GOVERNMENT OF HARYANA
|
|
|
- Charlotte Matthews
- 6 years ago
- Views:
Transcription


1 GOVERNMENT OF HARYANA Issued by : DEPARTMENT OF ECONOMIC AND STATISTICAL ANALYSIS, HARYANA 2018

2 Publication No.1179 Available at GOVERNMENT OF HARYANA Economic Survey of Haryana Issued By: DEPARTMENT OF ECONOMIC AND STATISTICAL ANALYSIS, HARYANA YOJANA BHAWAN, SECTOR 4, PANCHKULA 2018
3 CONTENTS HARYANA AT A GLANCE (i-ii) CHAPTER TITLE PAGE(S) STATE ECONOMY CHAPTER-1 HARYANA ECONOMY AND PROSPECTS 1-11 CHAPTER-2 PUBLIC FINANCE, BANKING & CREDIT, FINANCIAL INCLUSION AND EXCISE & TAXATION ACHIEVEMENTS OF DEPARTMENTS/ BOARDS/CORPORATIONS CHAPTER-3 AGRICULTURE & ALLIED SECTOR CHAPTER-4 INDUSTRY, POWER, ROADS AND TRANSPORT CHAPTER-5 EDUCATION AND IT CHAPTER-6 HEALTH AND WOMEN & CHILD DEVELOPMENT CHAPTER-7 PANCHAYATI RAJ, RURAL AND URBAN DEVELOPMENT CHAPTER-8 SOCIAL SECTOR ANNEXURE S ***
4 HARYANA AT A GLANCE ITEM PERIOD/YEAR UNIT HARYANA STATUS ALL INDIA STATUS GEOGRAPHICAL AREA Sq. Km. 44,212 32,87,469 ADMINISTRATIVE SET UP February, 2018 No. (a) Divisions 6 (b) Districts 22 (c) Sub-Divisions 73 (d) Tehsils 93 (e) Sub-Tehsils 49 (f) Blocks 140 (g) Towns (h)villages (including inhabited) POPULATION Population Census 2011 Population Census 2011 Population Census 2011 No ,841 (a) Total 2,53,51,462 1,21,05,69,573 (b) Male 1,34,94,734 62,31,21,843 (c) Female 1,18,56,728 58,74,47,730 (d) Rural Percentage of Rural Population 1,65,09, ,34,63, (e) Urban 88,42,103 37,71,06,125 (f) Density of Population Per Sq.Km (g) Literacy Rate (h) Sex Ratio Male Female Percent Total Female per Thousand Male VITAL STATISTICS 2016 Per Thousand (a) Birth Rate (i) Combined (ii) Rural (ii) Urban (b) Death Rate (i) Combined (ii) Rural (iii) Urban
5 ITEM PERIOD/YEAR UNIT (c) Infant Mortality Rate 2016 Per Thousand ii HARYANA STATUS ALL INDIA STATUS (i) Combined (ii) Rural (iii) Urban (d) Maternal Mortality Ratio (MMR) LAND UTILIZATION Death per Lakh Live Birth (a) Area Under Forest Percent (b) Net Area Sown Thousand Hect. 3,522 1,40,130 (c) Area Sown More than Once 3,014 58,230 (d) Total Cropped Area 6,536 1,98,360 (e) Area Sown More than Once to Net Area Sown OPERATIONAL HOLDINGS Agri. Census (a) No. of Operational Holdings 000 Number 1,617 1,37,757 (b) Area of Operational Holdings Thousand Hect. 3,646 1,59,180 (c) Average Size of Holdings Hect POWER (a) Total Installed Capacity MW 6,368 3,02,088 (b) Power Available for Sale Lakh KWH 4,45,111 (c) Power Sold Lakh KWH 3,21,722 8,63,36,402 (d) Electricity Consumers No. 59,51,401 26,30,28,328 STATE INCOME (At Current Prices) (a) Gross State Domestic Product (GSDP) (Quick Estimates) Rupees Crore 5,45,323 1,52,53,714 (b) Gross State Value Added (GSVA) 4,90,250 1,38,41,591 (c) Agriculture and Allied Sector GSVA 96,607 24,84,005 (d) Industry Sector GSVA 1,54,414 40,54,112 (e) Services Sector GSVA 2,39,229 73,03,474 (f) Per Capita Income Rupees 1,78,890 1,03,870 ***
6 State Economy
 prices has been estimated to be 3.")
7 1 HARYANA ECONOMY AND PROSPECTS The economic growth of Haryana has been exemplary, except for some periods, since its creation as a separate State. Though Haryana is geographically a small State, the contribution of the State in the National Gross Domestic Product at constant ( ) prices has been estimated to be 3.6 percent as per the Quick Estimates of GROSS STATE DOMESTIC PRODUCT 1.2 The Department of Economic & Statistical Analysis, Haryana prepares the estimates of Gross State Domestic Product (GSDP). As per the Advance Estimates for the year , the GSDP of the State at current prices has been recorded as ` 6,08, crore, recording the growth of 11.6 percent over the previous year. The GSDP in is expected to reach the level of ` 4,77, crore, with the growth of 8.0 percent, at constant ( ) prices. The real growth of 8.0 percent recorded in GSDP of the State in is higher than the All India GDP growth of 6.6 percent. As per the Quick Estimates, the GSDP of the State at current prices has been estimated as ` 5,45, crore for as against the Provisional Estimates of ` 4,85, crore in , registering the growth of 12.2 percent. The GSDP at constant ( ) prices for has been estimated as ` 4,42, crore as against the Provisional Estimates of ` 4,08, crore for , recording the growth of 8.2 percent. The GSDP of the State at current and constant ( ) prices is 1 given in Table 1.1 & Fig. 1.1 whereas the growth in real terms is shown in Table 1.2 & Fig 1.2. Table 1.1- Gross State Domestic Product of Haryana. Year (` Crore) Gross State Domestic Product At Current Prices At Constant ( ) Prices (P) (P) (Q) (A) P: Provisional Estimates, Q: Quick Estimates, A: Advance Estimates Source: Department of Economic & Statistical Analysis, Haryana.
 recorded in Industry Sector.")
8 1.3 The growth in real Gross State Value Added (GSVA) was recorded as 5.9 percent during the year which improved to 8.7 percent during the year During , the growth in GSVA fell down to 8.2 percent which may be mainly attributed to the low growth (5.9%) recorded in Industry Sector. During the year , the growth in GSVA further fell down to 7.6 percent which is mainly due to the low growth recorded in Agriculture & Allied Sector (2.4%). This growth of 7.6 percent in State GSVA in is 2 higher as compared to the All India GVA growth of 6.4 percent (Table 1.2). Table 1.2- Growth in Gross State Value Added at Constant ( ) Prices. (Percent) Sector Haryana All India (P) (P) (Q) (A) (A) Agriculture & Allied Industry Services GSVA GSDP P: Provisional Estimates, Q: Quick Estimates, A: Advance Estimates Source: Department of Economic and Statistical Analysis, Haryana. Structural Transformation of State Economy 1.4 At the time of formation of Haryana State, the State economy was predominantly rural and agriculture based. At the beginning year ( ) of 4 th Five Year Plan, the contribution of Agriculture and Allied Sector (crops, livestock, forestry and fishing) in the GSDP at constant prices was largest (60.7%) followed by Services (21.7%) and Industry (17.6%) Sectors. At that time, the predominance of Agriculture (crops and livestock) Sector was highly responsible for instability in the growth rate of the economy due to fluctuations in agricultural production. Thereafter, the major drive towards diversification and modernization of State economy started and continued successfully in the following Five Years Plans. 1.5 During the period of 37 years ( to ) intervening 4 th and 10 th Five Year Plans, Industry and Services Sectors registered higher growth rate than the Agriculture and Allied Sector which resulted in the increased share of Industry and Services Sector and decreased share of Agriculture and Allied Sector in the GSDP. The share of Agriculture and Allied Sector in GSDP declined from 60.7 percent in to 21.3 percent in while the share of Industry Sector increased from 17.6 percent in to 32.1 percent in The share of Services Sector increased from 21.7 percent to 46.6 percent during this period. 1.6 During the period of 11 th Five Year Plan and onwards, the pace of structural transformation of the

9 State economy remained continue. Consequent upon the robust growth recorded in Services Sector in this period, the share of Services Sector in GSVA further strengthened to 50.9 percent in with the decrease in the share of Agriculture & Allied Sector at 17.6 percent. Thus, the composition of GSDP shows that the share of Agriculture & Allied Sector is continuously declining whereas the share of Services Sector is continuously increasing. Table 1.3- Per Capita Income. 3 PER CAPITA INCOME 1.7 The per capita income (Per Capita Net State Domestic Product) is another important indicator to assess the economic growth as well as the living standard of the people. During the year , the per capita income of the State at current prices was only ` 608. Since then, the per capita income has increased multi fold. The per capita income of the State has been presented in Table 1.3 and Fig Year Per Capita Income of Haryana (`) Per Capita Income of All India (`) At Current Prices At Constant ( ) Prices At Current Prices At Constant ( ) Prices (P) (P) (Q) (A) P: Provisional Estimates, Q: Quick Estimates, A: Advance Estimates Source: Department of Economic and Statistical Analysis, Haryana. 1.8 The per capita income of the State at constant ( ) prices as per Advance Estimates is expected to reach at the level of ` 1,54,587 during as against ` 1,45,163 in , indicating an increase of 6.5 percent during At current prices, the State per capita income is likely to reach the level of ` 1,96,982 during as compared to that of ` 1,78,890 in , showing an increase of 10.1 percent during It is also observed that the per capita income of the State, at both current and constant prices, is higher as compared to the National per capita income. AGRICULTURE & ALLIED SECTOR 1.9 Agriculture is the primary sector of our State economy and majority of the population is directly or indirectly dependent on agriculture and its allied activities. Accordingly, State has accorded high priority to Agriculture Sector since its creation on 1 st November, The strong infrastructure facilities like metalled roads, rural electrification, network of canals, development of market yards etc. were created which provided much needed impetus to agriculture development in the State. Creation of these facilities coupled with agriculture research support and excellent extension network to disseminate the information
10 related to improved farm practices for farmers yielded tangible results. The State has been converted from a food deficient to a food surplus State The Agriculture Sector has always been an important contributor to the Gross State Domestic Product (GSDP). However, as a consequence of rapid structural transition of the State economy over the years, the contribution of the Agriculture & Allied Sector at constant ( ) prices went down to only 17.6 percent of the GSVA during the year The economic growth of the State has become more sensitive to the growth in Industry and Services Sectors during the past few years but the recent experience suggests that high GSVA growth without consistent and rapid agricultural growth is likely to accelerate inflation in the State which would jeopardize the larger growth process. Therefore, the growth of Agriculture and Allied Sector continued to be a critical factor in the overall performance of the State economy Agriculture and Allied Sector is composed of agriculture, forestry & logging and fishing sub-sectors. Agriculture including crop husbandry and dairy farming is the main component contributing about 92 percent in GSVA of Agriculture and Allied Sector. The contribution of forestry and fishing subsectors in GSVA of Agriculture and Allied Sector is merely around 6 and 2 percent respectively resulting in very low impact of these two sub-sectors on the overall growth of Agriculture and Allied Sector The GSVA along with the growth rates recorded by the State economy at constant ( ) prices in Agriculture and Allied Sector during 4 different years have been shown in Table 1.4. The Provisional Estimates for reveal that Agriculture & Allied Sector of the State economy recorded the negative growth of 2.3 percent. The Provisional Estimates for indicate that Agriculture and Allied Sector recorded the growth of 3.8 percent. As per Quick Estimates for , the GSVA for Agriculture and Allied Sector has been recorded as ` 72, crore as against the Provisional Estimates of ` 65, crore in with the growth of 10.4 percent. As per the Advance Estimates for , the GSVA from this sector has been recorded as ` 74, crore with the growth of 2.4 percent. The GSVA from Agriculture Sector including crops and livestock has been estimated as ` 68, crore with the growth of 1.8 percent whereas the GSVA from forestry & logging and fishing sub-sectors has been recorded as ` 4, crore and ` 1, crore with the growth of 2.1 percent and 36.1 percent respectively during the year AGRICULTURE INDICES 1.13 The Indices of area under crops, agricultural production and yield from the year to (Base Triennium ending =100) for the State show that the index of area under crops decreased from in to in The index of agricultural production decreased from in to in However, the index of yield increased from in to in during this period. The index of production of foodgrains increased from in to in whereas the index of non-foodgrains decreased from in to in
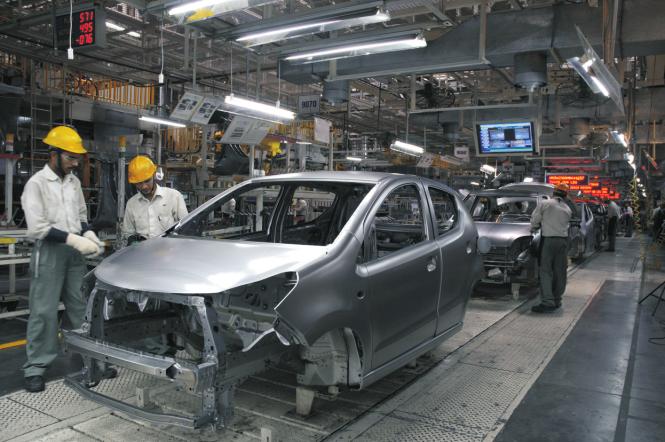
11 Table 1.4- GSVA from Agriculture and Allied Sector at Constant ( ) Prices. Sector (P) Crops & Livestock (-2.0) (3.2) (-2.9) Forestry & Logging (-3.2) Fishing (5.2) Agriculture & Allied (-2.0) (-2.5) (-5.3) (2.8) ( 6.0) (5.3) (-2.3) (P) (3.7) (2.2) (11.4) (3.8) (` Crore) (Q) (A) (10.9) (1.8) (1.9) (17.4) (10.4) (2.1) (36.1) (2.4) P: Provisional Estimates, Q: Quick Estimates, A: Advance Estimates, * Figures in brackets show the percentage growth over previous year. Source: Department of Economic & Statistical Analysis, Haryana. INDUSTRY SECTOR 1.14 Industrialization plays a vital and crucial role in the development of an economy. It accelerates economic growth of a State and thereby increases the contribution of Industry Sector in the State Domestic Product by way of increase in the production and employment The sub sector-wise Gross State Value Added (GSVA) alongwith the growth rates recorded by the Industry Sector in the State at constant ( ) prices during different years have been shown in Table 1.5. The Provisional Estimates for indicate that Industry Sector in the State recorded the growth of 10.5 percent. As per Quick Estimates for , the GSVA for Industry Sector has been recorded as ` 1,24, crore as against the Provisional Estimates of ` 1,17, crore in recording a growth of 5.9 percent. As per the Advance Estimates for , the GSVA from Industry Sector is estimated to be ` 1,33, crore recording a growth of 7.7 percent over the previous year. Table 1.5- GSVA from Industry Sector at Constant ( ) Prices. Sector (P) Mining & Quarrying (-22.6) (196.3) (21.5) Manufacturing (18.8) (6.6) (7.2) Electricity, Gas, Water Supply & Other Utility Services (-2.1) Construction (-7.2) Industry (9.0) (-13.6) (11.1) (7.4) (11.2) (-1.8) (4.6) (P) (107.6) (15.1) (-9.6) (0.7) (10.5) (` Crore) (Q) (A) (38.3) (11.0) (5.8) (8.7) (21.6) (21.8) (3.7) (5.9) (3.4) (7.7) P: Provisional Estimates, Q: Quick Estimates, A: Advance Estimates, * Figures in brackets show the percentage growth over previous year. Source: Department of Economic & Statistical Analysis, Haryana. INDEX OF INDUSTRIAL PRODUCTION 1.16 Index of Industrial Production (IIP) is one of the prime indicators for measurement of trend in the industrial production over a period of time with reference to a chosen base year. The IIP is presently being prepared in the State with
12 as base year by the Department of Economic and Statistical Analysis, Haryana. Growth in major sectors and use Table 1.6- Index of Industrial Production. Industry Group Manufacturing (2.4) Electricity (3.8) Basic Goods Industries (1.1) Capital Goods Industries (7.8) Intermediate Goods Industries (-9.8) Consumer Goods Industries (9.2) a) Consumer Durable Goods (4.5) b) Consumer Non-Durable Goods (13.5) General Index of IIP (2.6) Source: Department of Economic and Statistical Analysis, Haryana The General IIP with as base year increased from in to in , registering an increase of 5.9 percent. The IIP of Manufacturing Sector increased from in to in , exhibiting a growth of 5.5 percent over the previous year. The IIP of Electricity Sector indicated a growth of 9.0 percent as it rose from in to in The IIP of Basic Goods Industries like scrap, iron/steel, cold rolled sheets, pipes & tubes, stainless steel, high carbon steel, stainless steel, strip, plets, sheet etc. increased to in recording an increase of 5.5 percent The IIP of Capital Goods Industries like sugar machinery, CKD/STD telephony components, air compressor, microscope and all types cable etc. increased from in to 6 based categories of IIP from the year and are given Table 1.6. (Base Year =100) Index (5.5) (9.0) (5.5) (16.7) (9.4) (-3.6) (0.1) (-6.5) (5.9) in , showing an increase of 16.7 percent The IIP of Intermediate Goods Industries like fabrics, mixed, pipes, plastic/pvc, bricks & tiles (non-ceramic), yarn polyester, yarn polyester blended etc. increased from in to in , recording an increase of 9.4 percent The IIP of Consumer Goods Industries decreased from in to in , showing a decrease of 3.6 percent. The Index of Consumer Durable Goods Industries like poles & posts of concrete, helmet, safety, tyre, cab/car, fan ceiling etc. is almost same i.e in and in , indicating a change of only 0.1 percent over the previous year The Index of Consumer Non-Durable Goods Industries like HIV testing kits, bag polythene, edible oil, milk all kind, powder milk, hosiery goods,
13 others-cotton and malt barley etc. decreased from in to in , recording a decrease of 6.5 percent. The growth of various industry groups at two digit levels during the year is given in Annexure 1.1 and The revision of base year of State IIP from to is under process. SERVICES SECTOR 1.24 The importance of the Services Sector can be gauged by looking at its contribution to different aspects of the economy. The share of Services Sector in the Gross State Value Added (GSVA) at constant ( ) prices has increased to 50.9 percent in The rise in the Services Sector s share in GSVA marks a Table 1.7- GSVA from Services Sector at Constant ( ) Prices. Sector (P) Trade, Repair, Hotels & Restaurants (9.5) (6.1) (12.1) Transport, Storage, Communication & Services related to Broadcasting Financial, Real Estate & Professional Services Public Administration, Defence and Other Services (8.5) (13.1) (7.6) Overall Services (10.6) (9.2) (15.5) (3.0) (10.1) 7 structural shift in the State economy and takes it closer to the fundamentals of a developed economy. During the period of 11 th Five Years Plan, the Services Sector grew at the average annual growth rate of 12.2 percent. This growth rate of Service Sector was significantly faster than the average annual growth recorded for combined Agriculture and Industry Sectors during this period. The growth of Service Sector GSVA has been continuously above the overall growth during this period. It has also been more stable than the growth of other two sectors. The above trend of faster and comparatively stable growth of Service Sector as compared to other two sectors also remained on the same path during the period of 12 th Plan ( ) and thereafter (12.0) (7.8) (14.2) (10.4) P: Provisional Estimates, Q: Quick: Estimates, A: Advance Estimates * Figures in brackets show the percentage growth over previous year. Source: Deptt. of Economic and Statistical Analysis, Haryana After recording the excellent growth throughout the 11 th Five Year Plan, the Services Sector recorded the growth of 10.6 percent, 10.1 percent, 10.4 percent and 9.3 percent in , , and , respectively. As per Quick Estimates of , the real GSVA from (P) (13.2) (10.4) (8.3) (4.7) (9.3) (Q) (9.3) (10.1) (7.3) (11.4) (8.8) (` Crore) (A) (9.4) (9.8) (9.1) (10.1) (9.4) this sector has been recorded as ` 1,96, crore as against the Provisional Estimates of ` 1,80, crore in , registering the comparative low growth of 8.8 percent. The low growth of 8.8 percent during may be attributed to the lower
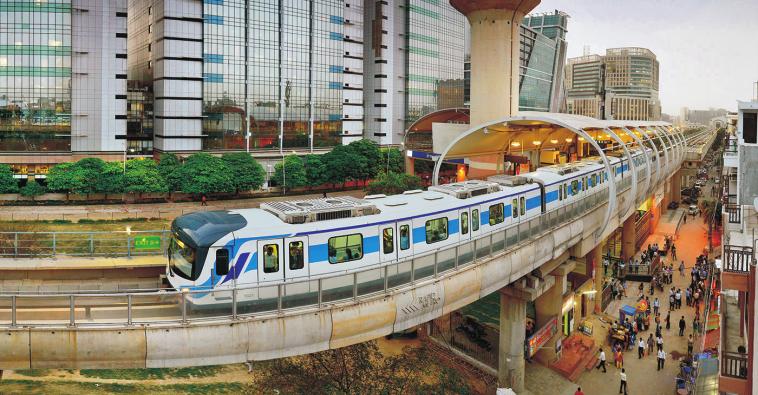
14 growth achieved in financial, real estate & professional services (7.3%) and trade, repair, hotels & restaurants (9.3%). As per the Advance Estimates for , the GSVA from Services Sector has been estimated as ` 2,15, crore with the growth of 9.4 percent. The growth recorded in trade, repair, hotels & restaurants and transport, storage, communication & services related to broadcasting was 9.4 percent and 9.8 percent respectively. The growth achieved in financial, real estate & professional services and public administration, defence and other services was 9.1 percent and 10.1 percent respectively (Table 1.7). Growth of Different Sub-Sectors in Services Sector Trade, Repair, Hotels & Restaurants 1.26 The growth of this sector in and has been recorded as 12.1 and 13.2 percent, respectively. As per the Quick Estimates of , the growth of this sector has been recorded as 9.3 percent. As per the Advance Estimates for , the growth of this sub-sector is likely to be 9.4 percent. Transport, Storage & Communication 1.27 The growth of this sector in and has been recorded as 12.0 and 10.4 percent, respectively. As per the Quick Estimates of , the growth of this sector has been recorded as 10.1 percent. As per the Advance Estimates for , the growth of this sub-sector is likely to be 9.8 percent. Finance, Real Estate and Professional Services 1.28 This sub-sector recorded the growth of 7.8 percent, 8.3 percent and 7.3 percent in , and respectively. As per the Advance Estimates for , this sub-sector is likely to achieve the growth of 9.1 percent. 8 Public Administration, Defence and Other Services 1.29 This sub-sector recorded the growth of 14.2 percent, 4.7 percent and 11.4 percent in , and respectively. As per the Advance Estimates for , the growth of this sub-sector is likely to be 10.1 percent. GROSS FIXED CAPITAL FORMATION 1.30 The productive capacity of the economy depends to a large extent upon the Capital Formation i.e. more the capital accumulation, the higher would be the productive capacity of the economy. The Department of Economic and Statistical Analysis, Haryana compiles the estimates of Gross Fixed Capital Formation (GFCF) for the State at current and constant ( ) prices by Industry of use, by type of Institutions and also by type of Assets. At current prices the GFCF of the State has been estimated at ` 71,116 crore during the year as against ` 65,357 crore during the year , recording an increase of 8.8 percent. Similarly, at constant ( ) prices, the GFCF has been estimated to ` 38,851 crore during the year as against ` 36,158 crore during the year , recording an increase of 7.4 percent during the year (Table 1.8 & Fig. 1.4). Table 1.8- Gross Fixed Capital Formation in Haryana. Year (` Crore) Gross Fixed Capital Formation At Constant ( ) Prices At Current Prices (P) P: Provisional Estimates Source: Department of Economic & Statistical Analysis, Haryana.

15 Gross Fixed Capital Formation in Agriculture & Allied Sector 1.31 The contribution of Gross Fixed Capital Formation in Agriculture & Allied Sector at constant ( ) prices increased from 9.3 percent in to 12.3 percent in Gross Fixed Capital Formation in Industry Sector 1.32 In the State the contribution of Gross Fixed Capital Formation in Industry Sector was 55.5 percent in which decreased to 53.1 percent in Gross Fixed Capital Formation in Services Sector 1.33 The contribution of Gross Fixed Capital Formation in Services Sector was 31.7 percent in Thereafter, it increased to 32.7 percent in and 34.5 percent in PRICE SITUATION 1.34 The rise in prices of goods and services which is termed as inflation, is a crucial determinant in the growth of economy. The inflation is measured by Price Indices. For assessing the price situation in the State, the Department of Economic & Statistical Analysis, Haryana collects wholesale and retail prices of essential commodities and services on weekly/monthly basis from rural and urban areas of the State and prepares the WPI and CPI for rural Haryana & Working Class respectively Wholesale Price Index: The Wholesale Price Index (WPI) of 20 selected agricultural commodities (Base Agri. Year =100) of the State from to is given in Table 1.9. It has increased from in to in , showing an increase of 2.5 percent as compared to an increase of 4.8 and 3.0 per cent respectively during the year and over the previous years. Table 1.9- Year-wise Wholesale Price Index of 20 Selected Agricultural Commodities in Haryana. Year Index (Base Agri. Year =100) Source: Department of Economic and Statistical Analysis, Haryana. Table: Monthly Wholesale Price Index of 20 Selected Agricultural Commodities in Haryana. Month Index (Base Year =100) December, January, February, March, April, May, June, July, August, September, October, November, December, Source: Department of Economic & Statistical Analysis, Haryana. 9
16 1.36 The month-wise WPI from December, 2016 to December, 2017 is presented in Table The WPI rose from in December, 2016 to in December, 2017 registering an increase of 2.4 percent. This rise is mainly attributed to the increase in prices of grains, pulses and other crops which is 3.9, 4.4 and 13.1 respectively Consumer Price Index (Rural): It measures changes in the price level of consumer goods and services purchased by households over a period of time. It is used to adjust the effect of inflation on the real value of wages, salaries and pensions. The main objective of computing this Index is to watch the movement of general level of retail prices of selected essential commodities that are in the consumption pattern of an average rural household in the State. The prices are collected fortnightly from 24 villages from different parts of the State where majority of population is engaged in agriculture and allied occupation Consumer Price Index (Rural) of Food Group moved by 3.4 percent during as compared to 4.7 percent during and General Group by 3.0 percent during as compared to 5.5 percent during Year-wise CPI (Rural) of the State from to is given in Table Table Year-wise Consumer Price Index (Rural) in Haryana. (Base Year =100) Year Food Index General Index Source: Department of Economic & Statistical Analysis, Haryana To observe the detail of monthwise movement of CPI (Rural) in the State, the index of December, 2016 to December, 2017 is presented in Table It was 703 in December, 2016 which rose to 730 in December, 2017 by registering an increase of 3.8 percent. Table Monthly Consumer Price Index (Rural) in Haryana. Month (Base Year =100) Index December, January, February, March, April, May, June, July, August, September, October, November, December, Source: Department of Economic & Statistical Analysis, Haryana Consumer Price Index for Working Class: CPI (IW) measures the relative change over time in the level of retail prices of a fixed set of goods and services consumed by an average working class family. It is compiled by taking into account the weighted average of the monthly Indices of six centres namely, Surajpur-Pinjor, Panipat, Sonipat, Bhiwani, Hisar and Bahadurgarh. CPI(IW) of the State from is presented in Table Table Year-wise Consumer Price Index (IW) in Haryana. Year (Base Year 1982=100) Index Source: Department of Economic & Statistical Analysis, Haryana.
17 1.41 The CPI (IW) of the State has increased from 1068 in 2016 to 1094 in 2017, showing an increase of 2.4 percent. The centre-wise increase was comparatively high in Panipat (2.7 percent) whereas it was low in Surajpur Pinjor (2.2 percent) for the year The detail of month-wise movement of CPI (IW) in the State, the index of December, 2016 to December, 2017 is presented in Table The Consumer Price Index for Working Class (Base Year 1982=100) was 1070 in December, 2016 which rose to 1113 in December, 2017 by registering an increase of 4.0 percent. Table Monthly Consumer Price Index (IW) in Haryana. (Base Year 1982=100) Month Index December, January, February, March, April, May, June, July, August, September, October, November, December, Source: Department of Economic & Statistical Analysis, Haryana. *** 11
18 PUBLIC FINANCE, BANKING & CREDIT, FINANCIAL INCLUSION AND EXCISE & TAXATION Haryana is one of the most progressive States in the country. It has been a pioneer State in carrying out fiscal reforms and our fiscal management is reckoned as one of the best in the country. Public finance relates to the collection of taxes by the Government from those who benefit from the provision of public goods and the use of those tax funds towards production and distribution of public goods. Resource generation, resource allocation and expenditure management (resource utilization) are the essential components of a public financial management system. The purview of public finance is considered to be three fold namely; efficient allocation of resources, distribution of income, and macro-economic stabilization. 2.2 As per the mandate of the 14 th Finance Commission, the fiscal deficit target was set at 3 percent of Gross State Domestic Product (GSDP) for its award period i.e to As per the BE for , fiscal deficit is projected at ` 16,155 crore (without UDAY), constituting 2.61 percent of GSDP which is well within the stipulated limits. Similarly, Debt to GSDP ratio is estimated at percent (without UDAY) in BE as against the prescribed limit of 25 percent. The total Revenue Receipts (TRR) as percentage of GSDP has increased from percent in RE to percent in BE The percentage of State s Own Tax Revenue to GSDP has also increased from 6.91 percent in RE to 7.01 percent in BE REVENUE RECEIPTS AND REVENUE EXPENDITURE 2.3 The revenue receipts and revenue expenditure of the State from to (BE) is shown in the Rupees Crore Fig. 2.1-Revenue Receipts and Expenditure (RE) (BE) Year Revenue Receipts Revenue Expenditure Fig. 2.1 and Annexure 2.1 to 2.3. The revenue receipts are collected through State s own tax and non-tax revenue, share in Central taxes and grant-in-aid from Centre. As per Budget Estimates of , the revenue receipts of the Govt. of Haryana is expected to be ` 68, crore against the estimated revenue expenditure of ` 79, crore, with a deficit of ` 11, crore. The revenue receipts of the State 12
19 Government was ` 40, crore against revenue expenditure of ` 49, crore with a deficit amounting to ` 8, crore in It was ` 47, crore against the revenue expenditure of 59, crore depicting a deficit amounting to 11, crore in State s Own Sources (Tax Revenue and Non-Tax Revenue) 2.4 There are two major components of State s own sources i.e. (i) State s own tax revenue and (ii) State s own non-tax revenue. The State s own sources are expected to rise from ` 32, crore in to ` 53, crore in (BE). The State s own tax revenue expected to increase from Table 2.1- Tax Position of Haryana. 13 ` 27, crore in to ` 43, crore in (BE) whereas the State s own non-tax revenue are expected to increase from ` 4, crore to ` 10, crore during this period. Taxes 2.5 The tax position of Haryana State from to (BE) is given in the Table 2.1. Total tax comprises of i) State s own tax revenue (OTR) and ii) State s share in Central taxes (SCT). State total tax is expected to increase from ` 31, crore (` 27, crore OTR + ` 3, crore SCT) in to ` 51, crore (` 43, crore OTR + ` 8, crore SCT) in (BE). (` Crore) Year State s Own Tax Revenue Share in Central Taxes Total Tax (RE) (BE) RE - Revised Estimates, BE- Budget Estimates Source: State Budget Documents. Tax Revenue 2.6 The break-up of tax revenue reveals that sales tax is the major source of tax revenue and it is estimated at ` 30,500 crore in (BE) as compared to ` 26,400 crore in (RE). Sales tax is estimated to increase by percent in (BE) over (RE). The contribution in tax revenue from State excise is estimated at ` 6,100 crore in (BE) as compared to ` 5, crore in (RE) showing an increase of percent in (BE) over (RE). The contribution in tax revenue from stamps and registration is estimated at ` 3,900 crore in (BE) as compared to `3,500 crore in (RE)(Annex. 2.1). Share in Central Taxes 2.7 Transfer from Centre mainly consists of State s share in Central taxes, grant for Plan schemes, grant under the award of Central Finance Commission and other non-plan grants. The share in Central taxes is estimated at ` 8, crore in (BE) against ` 7, crore in (RE). It shows that share in Central taxes is likely to increase by percent in (BE) over (RE). Grant-in-Aid 2.8 The grant-in-aid received in the State is shown in Table 2.2. Apart from the valuable amount from Central taxes, Finance Commission has made recommendations regarding grant-in-aid to the States for some specific purpose. The
20 State is expected to receive about ` 7, crore as grant-in-aid in (BE) against ` 7, crore in (RE). It indicates that grant-in-aid is likely to decrease by percent in (BE) over (RE). Table 2.2- Grant-in-aid received from Central Government (` Crore) Year Amount Received (RE) (BE) RE - Revised Estimates, BE- Budget Estimates Source: State Budget Documents. CAPITAL RECEIPTS AND CAPITAL EXPENDITURE Capital Receipts 2.9 The capital receipts and capital expenditure of the State from to (BE) is shown in Fig. 2.2 and Annexure 2.1 and 2.2. The capital receipts consist of three parts namely; (i) recovery of loans (ii) misc. capital receipts and (iii) public debt (Net). The public debt has a major contribution in the capital receipts. Capital receipts is expected to increase from ` 10, crore in to ` 22, crore in (BE). Capital Expenditure 2.10 Capital expenditure consists of capital outlay and lending (disbursement of loans and advances) and it relates to the creation of assets. The capital expenditure of the State is expected to increase from ` 4, crore in to ` 12, crore in (BE) as shown in Annexure The total developmental expenditure comprising of social services like education, medical and public health, water supply and sanitation, social security and welfare, labour and employment, etc. and economic services like agriculture & allied activities, irrigation & flood control, power, industries, transport, rural development, etc. The developmental expenditure is estimated at ` 66, crore in (BE) as against ` 61, crore in (RE), showing an increase of 8.58 percent. Rupees Crore Fig Capital Receipts and Expenditure The total non-developmental expenditure comprising of administrative services, organs of State, fiscal services, interest payments, pensions and miscellaneous general services etc. is estimated at ` 25, crore in (BE) as compared to ` 22, crore in (RE). The total non-developmental expenditure is estimated to increase by percent in (BE) over (RE). Financial Position 2.13 The net transactions on year s account is estimated to show a surplus of ` crore in (BE) as against the surplus of ` crore in (RE). The revenue account is estimated to show a deficit of ` 11, crore in (BE). The net deposits of small savings, provident fund etc. are estimated to show a surplus of ` 1,305 crore in (BE) as compared to ` 1,205 crore in (RE) (Annexure 2.3) (RE) (BE) Capital Receipts Year Capital Expenditure 14
21 BUDGETARY EXPENDITURE OF STATE GOVERNMENT AS PER ECONOMIC CLASSIFICATION 2.14 In order to secure legislative control, administrative accountability and auditing of any act of spending, the expenditure in the Government Budget is generally classified department-wise. The Government budgetary transactions are significant only in terms of meaningful economic categories such as consumption expenditure, capital formation etc. and so they have to be sorted out, re-classified and re-grouped. Budget can broadly be divided into Administrative Departments and Departmental Commercial Undertakings. Administrative Departments are Government agencies for the implementation of social and economic policy of the Government, whereas Departmental Commercial Undertakings are un-incorporated enterprises owned, controlled and run directly by the Government The Economic Classification of the Budget which classifies the budgetary transactions in significant economic categories place the total expenditure at ` 89, crore in the year (BE) as compared to ` 83, crore in (RE) showing an increase of 7.11 percent in (BE) over (RE) (Annexure 2.4) The consumption expenditure of the State Government is estimated at ` 28, crore in (BE) against ` 26, crore in (RE). It shows that consumption expenditure is ikely to increase by 5.88 percent in (BE) over (RE) State s gross capital formation i.e. investment on buildings, roads & other construction, purchase of vehicles and machinery & equipments by Administrative Departments and Departmental Commercial Undertakings is estimated at ` 9, crore in (BE) against ` 4, crore in (RE). In addition to the gross capital formation, the State Government also provides financial assistance to other sectors of the economy for capital formation through capital transfers, loans & advances and by purchasing financial assets (Annexure 2.4). INSTITUTIONAL FINANCE 2.18 Institutional Finance is essential Rural Banks (RRBs) branches working in for any development programme. The role the State as on September, 2017 was 4,708. of the State Government has been to The total deposits of CBs and persuade the banking institutions to give greater importance to the agricultural and allied sector, particularly for poverty alleviation programmes. The Institutional Finance available through Commercial, RRBs increased to ` 3,19,469 crore in September, Similarly total advances in the State increased to ` 2,10,193 crore in September, Credit-Deposit (CD) Ratio is a significant indicator of credit Cooperative Banks and other term lending flow for accelerating economic institutions reduces pressure on the development of the State. The CD Ratio in budgetary resources of the State the State has slightly decreased to Government. 66 percent in September, 2017 as compared 2.19 The total number of to 73 percent during the corresponding Commercial Banks (CBs) and Regional period of last year. 15
22 State Annual Credit Plan 2.20 Annual Credit Plan of the State for the current year envisages a credit lending of ` 52,515 crore. The targets for are down by 60 percent as compared to those for the year Table 2.3- Annual Credit Plan of Haryana for Sector Target Overall achievement under State Annual Credit Plan stood at ` 44,127 crore upto September, 2017 against the target of ` 52,515 crore which was 84 percent of the annual target (Table-2.3). Achievement (upto ) (` Crore) Percentage Achievement Agriculture & Allied Micro & Small Enterprises Other Priority Sector Total Source: Convener Bank, Punjab National Bank The performance of banks regarding credit lending to agriculture & allied sector is satisfactory. Against the annual target of ` 35,056 crore, the achievement upto September, 2017 was ` 29,053 crore i.e. 83 percent. In the micro & small enterprises, the performance was quite satisfactory. The banks disbursed ` 10,071 crore against the annual target of ` 9,555 crore which is 105 percent of the target. In the other priority sector banks disbursed ` 5,003 crore against the target of ` 7,904 crore which is 63 percent of the target. Bank-wise Performance CBs and RRBs 2.22 Under Annual Credit Plan, Haryana for the year , Commercial Banks and RRBs advanced ` 38,036 crore upto September, 2017 against the target of ` 44,892 crore which is 85 percent of target. Advances by CBs and RRBs during is given in Table 2.4. Table 2.4- Advance by Commercial Banks and RRBs in Haryana during (` Crore) Sector Target Achievement (upto ) Percentage Achievement Agriculture & Allied Micro & Small Enterprises Other Priority Sector Total Source: Convener Bank, Punjab National Bank The CBs and RRBs registered the highest advances of ` 23,660 crore in agriculture & allied sector followed by ` 9,796 crore in micro & small enterprises sector and ` 4,580 crore in other priority sector. However, the percentage of achievement against the target was highest in micro & small enterprises sector 108 percent followed by agriculture & allied sector 84 percent and other priority sector 59 percent. Cooperative Banks 2.24 Haryana State Cooperative Apex Bank has disbursed ` 5,936 crore upto September, 2017 against the target of ` 7,057 crore which is 84 percent of the target. Sector-wise detail is given in Table
23 Table 2.5-Advances by Co-operative Banks in Haryana during (` Crore) Sector Target Achievement (upto ) Percentage Achievement Agriculture & Allied Micro & Small Enterprises Other Priority Sector Total Source: Convener Bank, Punjab National Bank. Haryana State Cooperative Agriculture & Rural Development Bank Haryana State Cooperative Agriculture & Rural Development Bank (HSCARDB) advanced ` 98 crore upto September, 2017 against the target of ` 375 crore which is 26 percent of the target. Sector-wise performance of Haryana State Cooperative Agriculture and Rural Development Bank (HSCARDB) during the year is given in Table 2.6. Table 2.6- Advances by HSCARDB during (` Crore) Sector Target Achievement (upto ) Percentage Achievement Agriculture & Allied Micro & Small Enterprises Other Priority Sector Total Source: Convener Bank, Punjab National Bank. Table 2.7- Advances by Small Industries Development Bank of India during (` Crore) Sector Target Achievement (upto ) Percentage Achievement Agriculture & Allied Micro & Small Enterprises Other Priority Sector Total Source: Convener Bank, Punjab National Bank. Small Industries Development Bank upto September, 2017 against the target of ` 185 crore which is 26 percent Small Industries Development Bank of India had advanced ` 49 crore Sector-wise detail is given in Table-2.7. THE HARYANA STATE COOPERATIVE AGRICULTURE AND RURAL DEVELOPMENT BANK LTD The Haryana State Cooperative Agriculture and Rural Development Bank Ltd. (HSARDB), was set up on 1st Nov At the time of establishment of the Bank, there were only 7 PCARDBs in the State, now this number has risen to 76 PCARDBs. These PCARDBs have now been amalgamated into 19 DCARDBs and the existing PCARDBs at Tehsil and Sub- Tehsil level act as branches of these DCARDBs The Haryana State Cooperative Agriculture and Rural Development Bank 17
24 Ltd. has advanced ` crore from to against the annual target of ` 350 crore which is percent of the annual target. Sector-wise performance of the Haryana 18 State Cooperative Agriculture and Rural Development Bank Ltd. (HSCARDB) during the year & (upto ) is given in Table 2.8. Table 2.8- Performances of Haryana State Cooperative Agriculture and Rural Development Bank Ltd. (` Crore) Sr. No Sector/ Schemes Projected Advancement Projected Advancement up Target for year Target for to year Minor Irrigation Farm Mechanisation Land Development Dairy Development incl. Cattle Shed Hort./Farm Forestry Rural Housing Non Farm Sector Purchase of Land Rural Godowns Others Total Source: Haryana State Cooperative Agriculture and Rural Development Bank Ltd. (A) The following Schemes are in operations by the HSCARDB Ltd.:- 1. Rural Housing Scheme; 2. Purchase of Agriculture Land; 3. Combine Harvester; 4. Straw-Reaper; 5. Strawberry Cultivation; 6. Commercial Dairy for Self Employment; 7. Scheme for setting up of Agri-clinics and Agri-Business Centres for agriculture graduates; 8. Financing of 2-Wheelers to farmers; 9. Cattle Shed Scheme; 10. Financing of Medicinal & Aromatic Plants; 11. Financing of Community Halls; 12. Rural Godown; 13. Rural Educational Infrastructure; 14. Marriage Palace, all kinds of IT activities and other services; 15 The Bank has opened the window of credit for replacement of defunct tubewells with new submersible tube- wells. (B) Besides, the Bank has taken various steps for the benefit of the farmers, as mentioned below: 1. The limit of loan amount for purchase of agriculture land has been enhanced from ` 1 lakh to ` lakh; 2. The value of agriculture land for the purpose of security has been adequately enhanced on the basis of latest sale statistics; 3. On purchasing new Tractor by the farmers, the bank is pledging one and half time value of agriculture land of Tractor Cost in the State of Haryana; 4. Third party payment upto loans of ` 2 lakh has been abolished; 5. Third party security of agriculture land as well as commercial property has also been allowed for the purpose of NFS loans; 6. The stamp duty has been abolished by the State Govt. on mortgage of land for coop. loans relating to agriculture activities w.e.f. 15 th October, 2003.
This Press Release is embargoed against publication, telecast or circulation on internet till 5.30 pm today i.e. 31 st January, 2018.
 This Press Release is embargoed against publication, telecast or circulation on internet till 5.30 pm today i.e. 31 st January, 2018. PRESS NOTE ON FIRST REVISED ESTIMATES OF NATIONAL INCOME, CONSUMPTION
NOTES ON METHODOLOGY AND REVISIONS IN THE ESTIMATES
 NOTES ON METHODOLOGY AND REVISIONS IN THE ESTIMATES The new series on National Accounts Statistics was introduced through a Press Release on January 30, 2015 with base year 2011-12 in place of previous
Economics & Statistics Division State Planning Institute
 TTAR P R Printed at United Block Printers, Lucknow TTAR P R ESH website - http://updes.up.nic.in FU AD ESH Economics & Statistics Division State Planning Institute Uttar Pradesh G OV T.O FU AD G OV T.O
NATIONAL ACCOUNTS STATISTICS 2014 AN OVERVIEW
 NATIONAL ACCOUNTS STATISTICS 2014 AN OVERVIEW 1. THE PUBLICATION 1.01 The Central Statistics Office (CSO), Ministry of Statistics and Programme Implementation, regularly compiles estimates of national
Welcome to Presentation of Twelfth Five Year Plan and Annual Plan Proposal Madhya Pradesh. May 11, 2012
 Welcome to Presentation of Twelfth Five Year Plan and Annual Plan Proposal Madhya Pradesh May 11, 2012 1 ACHIEVEMENTS OF ELEVENTH PLAN (ECONOMY) Targets and Achievement Sector Target for Growth Expected
4(8)/Ec. Dn. /2017 Ministry of Finance Department of Economic Affairs Economic Division MONTHLY ECONOMIC REPORT NOVEMBER 2018 ***** HIGHLIGHTS
/Ec. Dn. /2017 Ministry of Finance Department of Economic Affairs Economic Division MONTHLY ECONOMIC REPORT NOVEMBER 2018 ***** HIGHLIGHTS") 4(8)/Ec. Dn. /2017 Ministry of Finance Department of Economic Affairs Economic Division MONTHLY ECONOMIC REPORT NOVEMBER 2018 ***** HIGHLIGHTS The growth of real GDP for the first half of 2018-19 was 7.6
4(8)/Ec. Dn. /2017 Ministry of Finance Department of Economic Affairs Economic Division MONTHLY ECONOMIC REPORT NOVEMBER 2018 ***** HIGHLIGHTS The growth of real GDP for the first half of 2018-19 was 7.6
This Press Release is embargoed against publication, telecast or circulation on internet till 5.30 pm today i.e. 6 th January 2017 PRESS NOTE
 PRESS NOTE ON FIRST ADVANCE ESTIMATES OF NATIONAL INCOME 2016-17 CENTRAL STATISTICS OFFICE MINISTRY OF STATISTICS & PROGRAMME IMPLEMENTATION GOVERNMENT OF INDIA 2 GOVERNMENT OF INDIA MINISTRY OF STATISTICS
This Press Release is embargoed against publication, telecast or circulation on internet till 5.30 pm today i.e. 28th February
 . PRESS NOTE ON SECOND ADVANCE ESTIMATES OF NATIONAL INCOME 2017-18 AND QUARTERLY ESTIMATES OF GROSS DOMESTIC PRODUCT FOR THE THIRD QUARTER (Q3) OF 2017-18 CENTRAL STATISTICS OFFICE MINISTRY OF STATISTICS
Analysis of State Budget Allocation of Goa, Manipur, Punjab, Uttar Pradesh and Uttarakhand
 Analysis of State Budget Allocation of Goa, Manipur, Punjab, Uttar Pradesh and Uttarakhand Executive Summary The highest fiscal deficit among the 5 state is in Uttar Pradesh, amounting to an all-time high
PRESS NOTE ON QUARTERLY ESTIMATES OF GROSS DOMESTIC PRODUCT FOR THE THIRD QUARTER (OCTOBER-DECEMBER) OF CENTRAL STATISTICS OFFICE
 OF CENTRAL STATISTICS OFFICE") PRESS NOTE ON QUARTERLY ESTIMATES OF GROSS DOMESTIC PRODUCT FOR THE THIRD QUARTER (OCTOBER-DECEMBER) OF 2012-13 CENTRAL STATISTICS OFFICE MINISTRY OF STATISTICS AND PROGRAMME IMPLEMENTATION GOVERNMENT
PRESS NOTE ON QUARTERLY ESTIMATES OF GROSS DOMESTIC PRODUCT FOR THE THIRD QUARTER (OCTOBER-DECEMBER) OF 2012-13 CENTRAL STATISTICS OFFICE MINISTRY OF STATISTICS AND PROGRAMME IMPLEMENTATION GOVERNMENT
NATIONAL ACCOUNTS STATISTICS 2013 AN OVERVIEW
 NATIONAL ACCOUNTS STATISTICS 2013 AN OVERVIEW 1. THE PUBLICATION 1.01 The Central Statistics Office (CSO), Ministry of Statistics and Programme Implementation, regularly compiles estimates of national
METHODOLOGY OF COMPILING QUARTERLY GDP ESTIMATES
 METHODOLOGY OF COMPILING QUARTERLY GDP ESTIMATES The Central Statistical Organisation (CSO) introduced the quarterly estimates of Gross Domestic Product (GDP) on 30.6.1999. Quarterly Releases include GDP
This Press Release is embargoed against publication, telecast or circulation on internet till 5.30 pm today i.e. 8th February
 . PRESS NOTE ON ADVANCE ESTIMATES OF NATIONAL INCOME 2015-16 AND QUARTERLY ESTIMATES OF GROSS DOMESTIC PRODUCT FOR THE THIRD QUARTER (Q3) OF 2015-16 CENTRAL STATISTICS OFFICE MINISTRY OF STATISTICS & PROGRAMME
This Press Release is embargoed against publication, telecast or circulation on internet till 5.30 pm today i.e. 31 st May 2018 PRESS NOTE
 This Press Release is embargoed against publication, telecast or circulation on internet till 5.30 pm today i.e. 31 st May 2018 PRESS NOTE ON PROVISIONAL ESTIMATES OF ANNUAL NATIONAL INCOME, 2017-18 AND
PRESS INFORMATION BUREAU GOVERNMENT OF INDIA PRESS NOTE ESTIMATES OF GROSS DOMESTIC PRODUCT FOR THE THIRD QUARTER (OCTOBER-DECEMBER) OF
 OF") 1 PRESS INFORMATION BUREAU GOVERNMENT OF INDIA PRESS NOTE Dated the 9 Phalguna, 1932 Saka 28 February, 2011 ESTIMATES OF GROSS DOMESTIC PRODUCT FOR THE THIRD QUARTER (OCTOBER-DECEMBER) OF 2010-11 The Central
1 PRESS INFORMATION BUREAU GOVERNMENT OF INDIA PRESS NOTE Dated the 9 Phalguna, 1932 Saka 28 February, 2011 ESTIMATES OF GROSS DOMESTIC PRODUCT FOR THE THIRD QUARTER (OCTOBER-DECEMBER) OF 2010-11 The Central
LOANS AND ADVANCES OF TNSC BANK
 CHAPTER V LOANS AND ADVANCES OF TNSC BANK 5.1 INTRODUCTION 5.2 LOANS AND ADVANCES 5.3 LENDING RATES 5.4 GOVERNMENT OF INDIA INTEREST SUBVENTION 5.5 GOVERNMENT OF TAMIL NADU INTEREST SUBSIDY 5.6 NUMBER
4(8)/Ec. Dn. /2017 Ministry of Finance Department of Economic Affairs Economic Division MONTHLY ECONOMIC REPORT JUNE 2018 ***** HIGHLIGHTS
/Ec. Dn. /2017 Ministry of Finance Department of Economic Affairs Economic Division MONTHLY ECONOMIC REPORT JUNE 2018 ***** HIGHLIGHTS") 4(8)/Ec. Dn. /2017 Ministry of Finance Department of Economic Affairs Economic Division MONTHLY ECONOMIC REPORT JUNE 2018 ***** HIGHLIGHTS The growth of GDP at constant prices for the fourth quarter of
4(8)/Ec. Dn. /2017 Ministry of Finance Department of Economic Affairs Economic Division MONTHLY ECONOMIC REPORT JUNE 2018 ***** HIGHLIGHTS The growth of GDP at constant prices for the fourth quarter of
STATE DOMESTIC PRODUCT
 CHAPTER 3 STATE DOMESTIC PRODUCT The State Domestic Product (SDP) commonly known as State Income is one of the important indicators to measure the economic development of the State/UT. In the context of
NATIONAL ACCOUNTS STATISTICS Highlights
 Per Capita Income (in Rs.) NATIONAL ACCOUNTS STATISTICS 218 Highlights 1. The Gross Domestic Product at constant (211-12) prices for the year 217-18 is estimated at ` 13.1 lakh crore, as against the estimate
NATIONAL ACCOUNTS STATISTICS 2008 AN OVERVIEW
 NATIONAL ACCOUNTS STATISTICS 2008 AN OVERVIEW 1. THE PUBLICATION 1.01 The Central Statistical Organisation (CSO), Ministry of Statistics and Programme Implementation, regularly compiles estimates of national
Delhi Budget Analysis
 Delhi Budget Analysis The Minister of Finance of Delhi, Mr. Manish Sisodia, presented the Budget for financial year on March 22, 2018. Budget Highlights The Gross State Domestic Product (GSDP) of Delhi
West Bengal Budget Analysis
 0.3% 3. 2.3% 6.4% 5.9% 8.8% 8. 8. 11.4% 10.2% 11. 15. West Bengal Budget Analysis The Finance Minister of West Bengal, Dr. Amit Mitra presented the Budget for financial year on January 31, 2018. Budget
Content. 2 Infrastructure & Development Sectors. 3 Social Sectors. 3.6 Culture
 Content Chapter Page No. Section 1 : Overview From to 1 Introduction 1-2 2 Macro Economic Outlook 2018-19 3-12 Section 2: Policy Choices 1 Incentives Vs Infrastructure 14-18 2 Public Expenditure Policy:
STATE DOMESTIC PRODUCT
 CHAPTER 4 STATE DOMESTIC PRODUCT The State Domestic Product (SDP) commonly known as State Income is one of the important indicators to measure the economic development of the State. In the context of planned
MONTHLY ECONOMIC REPORT MARCH 2013 HIGHLIGHTS
 Ministry of Finance Department of Economic Affairs Economic Division 4(3)/Ec. Dn. /2012 MONTHLY ECONOMIC REPORT MARCH 2013 HIGHLIGHTS The overall growth of GDP at factor cost at constant prices, as per
NATIONAL ACCOUNTS STATISTICS 2007 AN OVERVIEW
 NATIONAL ACCOUNTS STATISTICS 2007 AN OVERVIEW 1. THE PUBLICATION 1.01 The Central Statistical Organisation (CSO), Ministry of Statistics and Programme Implementation, regularly compiles estimates of national
(Narendra Jena) Economic Officer
 Economic Officer") Ministry of Finance Department of Economic Affairs Economic Division 4(3)/Ec. Dn. /2012 MONTHLY ECONOMIC REPORT DECEMBER 2016 ***** HIGHLIGHTS As per the first revised estimates of national income, consumption
Ministry of Finance Department of Economic Affairs Economic Division 4(3)/Ec. Dn. /2012 MONTHLY ECONOMIC REPORT DECEMBER 2016 ***** HIGHLIGHTS As per the first revised estimates of national income, consumption
FOR January, 2018
 FOR 2018-19 January, 2018 MEDIUM TERM FISCAL POLICY STATEMENT & FISCAL POLICY STRATEGY STATEMENT FOR 2018 2019 Finance Department Government of West Bengal Foreword As per the statute of West Bengal Fiscal
This Press Release is embargoed against publication, telecast or circulation on internet till 5.30 pm today i.e. 31 st May 2017.
 This Press Release is embargoed against publication, telecast or circulation on internet till 5.30 pm today i.e. 31 st May 2017. PRESS NOTE ON PROVISIONAL ESTIMATES OF ANNUAL NATIONAL INCOME, 2016-17 AND
Kathmandu, Nepal, September 23-26, 2009
 Session Number: Session 8b (Parallel) Time: Friday, September 25, 14:00-15:30 Paper Prepared for the Special IARIW-SAIM Conference on Measuring the Informal Economy in Developing Countries Kathmandu, Nepal,
Preliminary Annual. National Accounts. Preliminary Annual National Accounts 2016
 Preliminary Annual National Accounts 2016 Preliminary Annual National Accounts 2016 1 Mission Statement In a coordinated manner produce and disseminate relevant, quality and timely statistics that are
PRESS NOTE ON ESTIMATES OF GROSS DOMESTIC PRODUCT FOR THE FIRST QUARTER
 PRESS NOTE ON ESTIMATES OF GROSS DOMESTIC PRODUCT FOR THE FIRST QUARTER APRIL-JUNE (2010-2011) CENTRAL STATISTICS OFFICE MINISTRY OF STATISTICS & PROGRAMME IMPLEMENTATION GOVERNMENT OF INDIA (Revised)
Himachal Pradesh Budget Analysis
 -4.9% -3.2% 3.9% 9. 10.4% 7.2% 10.2% 10. 10.8% 7.5% 9.1% 6.9% Himachal Pradesh Budget Analysis The Finance Minister of Himachal Pradesh, Mr. Jai Ram Thakur, presented the Budget for financial year on March
PRESS INFORMATION BUREAU GOVERNMENT OF INDIA PRESS NOTE ADVANCE ESTIMATES OF NATIONAL INCOME,
 PRESS INFORMATION BUREAU GOVERNMENT OF INDIA Dated the 12 Magha, 1933 Saka 7 February, 2012 PRESS NOTE ADVANCE ESTIMATES OF NATIONAL INCOME, 2011-12 The Central Statistics Office (CSO), Ministry of Statistics
Bihar Budget Analysis
 -1. -0. 1.6% 4. 6.6% 5. 4.9% 8. 7. 10. 10. 14. Bihar Budget Analysis The Finance Minister of Bihar, Mr. Sushil Kumar Modi, presented the Budget for financial year on February 27, 2018. Budget Highlights
SECTION- III RESULTS. Married Widowed Divorced Total
 SECTION- III RESULTS The results of this survey are based on the data of 18890 sample households enumerated during four quarters of the year from July, 2001 to June, 2002. In order to facilitate computation
Annual National Accounts 2016
 Annual National Accounts 2016 Namibia Statistics Agency P.O. Box 2133, FGI House, Post Street Mall, Windhoek, Namibia Tel: +264 61 431 3200 Fax: +264 61 431 3253 Email: info@nsa.org.na www.nsa.org.na Annual
STATE FINANCES for the year ended 31 March 2015
 Report of the Comptroller and Auditor General of India On STATE FINANCES for the year ended 31 March 2015 GOVERNMENT OF UTTAR PRADESH TABLE OF CONTENTS Preface Particulars Reference to Paragraph Page
PRESS NOTE ON ADVANCE ESTIMATES OF NATIONAL INCOME CENTRAL STATISTICS OFFICE MINISTRY OF STATISTICS & PROGRAMME IMPLEMENTATION
 PRESS NOTE ON ADVANCE ESTIMATES OF NATIONAL INCOME 2010-11 CENTRAL STATISTICS OFFICE MINISTRY OF STATISTICS & PROGRAMME IMPLEMENTATION GOVERNMENT OF INDIA PRESS INFORMATION BUREAU GOVERNMENT OF INDIA Dated
Ministry of Finance Department of Economic Affairs Economic Division 4(3)/Ec. Dn. /2012 MONTHLY ECONOMIC REPORT NOVEMER 2016 ***** HIGHLIGHTS
/Ec. Dn. /2012 MONTHLY ECONOMIC REPORT NOVEMER 2016 ***** HIGHLIGHTS") Ministry of Finance Department of Economic Affairs Economic Division 4(3)/Ec. Dn. /2012 MONTHLY ECONOMIC REPORT NOVEMER 2016 ***** HIGHLIGHTS As per the estimates of Gross Domestic Product (GDP) for the
Ministry of Finance Department of Economic Affairs Economic Division 4(3)/Ec. Dn. /2012 MONTHLY ECONOMIC REPORT NOVEMER 2016 ***** HIGHLIGHTS As per the estimates of Gross Domestic Product (GDP) for the
PAKISTAN ECONOMY
 PAKISTAN ECONOMY 2017-18 MISE-EN-SCÈNE https://goo.gl/lfiwyx https://goo.gl/qdm4zm ADDRESS 408, 4th Floor, Continental Trade Centre, Clifton Block-8, Karachi Email: connect@tolaassociates.com Ph# 35303294-6
Ministry of Finance Department of Economic Affairs Economic Division 4(8)/Ec. Dn. /2017 MONTHLY ECONOMIC REPORT OCTOBER 2017 *****
/Ec. Dn. /2017 MONTHLY ECONOMIC REPORT OCTOBER 2017 *****") Ministry of Finance Department of Economic Affairs Economic Division 4(8)/Ec. Dn. /2017 MONTHLY ECONOMIC REPORT OCTOBER 2017 ***** HIGHLIGHTS The growth rate of Gross Domestic Product (GDP) at constant
Ministry of Finance Department of Economic Affairs Economic Division 4(8)/Ec. Dn. /2017 MONTHLY ECONOMIC REPORT OCTOBER 2017 ***** HIGHLIGHTS The growth rate of Gross Domestic Product (GDP) at constant
MONTHLY ECONOMIC REPORT MARCH 2014
 Ministry of Finance Department of Economic Affairs Economic Division 4(3)/Ec. Dn. /2012 MONTHLY ECONOMIC REPORT MARCH 2014 HIGHLIGHTS The growth of GDP at factor cost at constant (2004-05) prices (real
GOVERNMENT OF INDIA MINISTRY OF STATISTICS & PROGRAMME IMPLEMENTATION
 GOVERNMENT OF INDIA MINISTRY OF STATISTICS & PROGRAMME IMPLEMENTATION Dated, the 28 th November, 2018 7 th Agrahayana, 1940 Saka NATIONAL ACCOUNTS STATISTICS: BACK-SERIES 2004-05 TO 2011-12 Base year of
Impact of FDI on Industrial Development of India
 Impact of FDI on Industrial Development of India Foreign capital and technology have been playing a vital role in India s industrial development. At the time of Independence, India inherited an industrial
INDICATORS DATA SOURCE REMARKS Demographics. Population Census, Registrar General & Census Commissioner, India
 Public Disclosure Authorized Technical Demographics Public Disclosure Authorized Population Urban Share Child Sex Ratio Adults Population Census, Registrar General & Census Commissioner, India Population
ECONOMIC POLICIES, GROWTH AND STRUCTURAL CHANGE OF INDIA B. A. PRAKASH
 ECONOMIC POLICIES, GROWTH AND STRUCTURAL CHANGE OF INDIA B. A. PRAKASH Chairman, Fifth State Finance Commission December 6, 2017 Objectives Examine the economic policies prior and after liberalisation
Jammu and Kashmir Budget Analysis
 Jammu and Kashmir Budget Analysis The Finance Minister of Jammu and Kashmir, Mr. Haseeb A. Drabu, presented the Budget for Jammu and Kashmir for the financial year on January 11, 2018. Budget Highlights
Chapter 3 : City Economic Profile
 Chapter 3 : City Economic Profile IL&FS ECOSMART CHAPTER - 3 CITY ECONOMIC PROFILE 3.1 INTRODUCTION Delhi is rapidly emerging as a world-class metropolis. With a 15% average compounded growth rate, it
GOVERNMENT OF BIHAR ACCOUNTS AT A GLANCE
 GOVERNMENT OF BIHAR ACCOUNTS AT A GLANCE 2008-2009 1 Preface The Annual Accounts of the State Government are prepared and examined under the directions of the Comptroller and Auditor General of India (C
GUATEMALA. 1. General trends
 Economic Survey of Latin America and the Caribbean 2014 1 GUATEMALA 1. General trends GDP grew by 3.7% in 2013 in real terms, versus 3.0% in 2012, reflecting the robustness of domestic demand, mainly from
FINANCE ACCOUNTS (VOLUME I)
") FINANCE ACCOUNTS (VOLUME I) 2013-2014 GOVERNMENT OF MADHYA PRADESH Finance Accounts (VOLUME - I) 2013-14 Government of Madhya Pradesh TABLE OF CONTENTS SUBJECT PAGES VOLUME - I Table of contents i-ii Certificate
FINANCE ACCOUNTS (VOLUME I) 2013-2014 GOVERNMENT OF MADHYA PRADESH Finance Accounts (VOLUME - I) 2013-14 Government of Madhya Pradesh TABLE OF CONTENTS SUBJECT PAGES VOLUME - I Table of contents i-ii Certificate
Strategy beyond Twelfth Five Year Plan - Achievement of Sustainable Development Goals
 Strategy beyond Twelfth Five Year Plan - Achievement of Sustainable Development Goals Demographic Indicators Indicator Himachal Pradesh (Census 2011) All India Population (million) 6.8 1210 Decennial Growth
Telangana Budget Analysis
 -5.8% -4.9% -2.9% 3.6% 6.8% 6. 6.1% 12.9% 6.2% 11. 8.6% 12.2% 10.2% 10.1% 11.1% 10.4% Budget Analysis The Finance Minister of, Mr. Eatala Rajender, presented the Budget for financial year on March 15,
GOVERNMENT OF MADHYA PRADESH
 GOVERNMENT OF MADHYA PRADESH ACCOUNTANT GENERAL (ACCOUNTS AND ENTITLEMENTS) MADHYA PRADESH, GWALIOR 2 Preface The Annual Accounts of the State Government are prepared and examined under the directions
State Update: Government of Gujarat
 March 24, 2013 Economics State Update: Government of Gujarat With a decadal growth rate of more than 10% (2001-2011), the state of Gujarat has come to establish itself as a strong growth engine for the
GUYANA. 1. General trends
 Economic Survey of Latin America and the Caribbean 2017 1 GUYANA 1. General trends Economic growth in Guyana is estimated to have been 3.3% in 2016, up from 3.2% in 2015. A combination of the largest gold
INTERNATIONAL WORKSHOP ON SHORT- TERM STATISTICS BEIJING, CHINA MAY Dr. Sudeepta Ghosh National Accounts Division, CSO INDIA
 INTERNATIONAL WORKSHOP ON SHORT- TERM STATISTICS BEIJING, CHINA 18-20 MAY 2015 Dr. Sudeepta Ghosh National Accounts Division, CSO INDIA About India Population of the country- 1.22 billion (2 nd in the
This Press Release is embargoed against publication, telecast or circulation on internet till 5.30 pm today i.e. 29th May 2015.
 PRESS NOTE ON PROVISIONAL ESTIMATES OF ANNUAL NATIONAL INCOME 2014-15 AND QUARTERLY ESTIMATES OF GROSS DOMESTIC PRODUCT FOR THE FOURTH QUARTER (Q4) 2014-15 CENTRAL STATISTICS OFFICE MINISTRY OF STATISTICS
CIVIL ACCOUNT FOR THE GOVERNMENT OF GENERAL STATEMENT OF ACCOUNT 17,62,51,48,07, ,54,51,43,51, ,87,67,92,03,000.
 REPORT ID: PRINTED BY: PRINTED ON: CIVIL ACCOUNT FOR THE GOVERNMENT OF FOR THE MONTH OF NOV/218 GENERAL STATEMENT OF ACCOUNT TAMILNADU
Gujarat Budget Analysis
 Gujarat Budget Analysis The Finance Minister of Gujarat, Mr. Nitin Patel, presented the Budget for financial year on February 20, 2018. Budget Highlights The Gross State Domestic Product of Gujarat for
PRESS INFORMATION BUREAU GOVERNMENT OF INDIA PRESS NOTE ADVANCE ESTIMATES OF NATIONAL INCOME,
 1 PRESS INFORMATION BUREAU GOVERNMENT OF INDIA PRESS NOTE ADVANCE ESTIMATES OF NATIONAL INCOME, 2012-13 Dated the 12 Magha, 1934 Saka 7 February, 2013 The Central Statistics Office (CSO), Ministry of Statistics
Finance Accounts (Volume- I) Government of Haryana
 Government of Haryana") Finance Accounts (Volume- I) 2015-16 Government of Haryana Subject (i) TABLE OF CONTENTS VOLUME-I Page(s) Certificate of the Comptroller and Auditor General of India (iii)-(v) Guide to Finance Accounts
Finance Accounts (Volume- I) 2015-16 Government of Haryana Subject (i) TABLE OF CONTENTS VOLUME-I Page(s) Certificate of the Comptroller and Auditor General of India (iii)-(v) Guide to Finance Accounts
ROYAL MONETARY AUTHORITY OF BHUTAN SELECTED ECONOMIC INDICATORS
 ROYAL MONETARY AUTHORITY OF BHUTAN SELECTED ECONOMIC INDICATORS JUNE 2012 ROYAL MONETARY AUTHORITY OF BHUTAN SELECTED ECONOMIC INDICATORS Vol.26 No.2 JUNE 2012 Postal Address Royal Monetary Authority of
CIVIL ACCOUNT FOR THE GOVERNMENT OF GENERAL STATEMENT OF ACCOUNT 15,93,62,78,38, ,66,89,50,78, ,78,38,22,24,000.
 REPORT ID: PRINTED BY: PRINTED ON: CIVIL ACCOUNT FOR THE GOVERNMENT OF FOR THE MONTH OF APR/217 GENERAL STATEMENT OF ACCOUNT TAMILNADU
Sai Om Journal of Commerce & Management A Peer Reviewed International Journal
 Volume 4, Issue 2 (February, 2017) Online ISSN-2347-7571 Published by: Sai Om Publications Sai Om Journal of Commerce & Management INSTITUTIONAL CREDIT TO FARMERS: OVERVIEW OF PUNJAB STATE CO-OPERATIVE
Current Macroeconomic Situation of Nepal
 Current Macroeconomic Situation of Nepal (During the First Two Months of FY 2004/05) Nepal Rastra Bank November 2004 Major Highlights During the first two months of FY 2004/05, broad money increased, while
CIVIL ACCOUNT FOR THE GOVERNMENT OF GENERAL STATEMENT OF ACCOUNT 14,94,51,85,03, ,04,94,96,12, ,12,49,12,000.
 REPORT ID: PRINTED BY: PRINTED ON: CIVIL ACCOUNT FOR THE GOVERNMENT OF FOR THE MONTH OF SEP/216 GENERAL STATEMENT OF ACCOUNT TAMILNADU
Government of Bihar. Particulars
 Government of Bihar Main Features-Budget 2012-13 Rs. in Cr 2009-10 2010-11 2011-12 2012-13 % 2012-13 Increase Rece./Exp. over Actuals Actuals B.E. B.E. % of Rev/ 2011-12 Cap (B.E.) 1 2 3 4 5 6 7 Particulars
Madhya Pradesh Budget Analysis
 Madhya Pradesh Budget Analysis The Finance Minister of Madhya Pradesh, Mr. Jayant Malaiya, presented the Budget for financial year on February 28, 2018. Budget Highlights The Gross State Domestic Product
Kerala Budget Analysis
 2.1% 4.3% 2.9% 5.2% 5.7% 4. 7.2% 6.7% 4.3% 6.6% 7.4% Kerala Budget Analysis The Finance Minister of Kerala, Dr. T.M. Thomas Isaac, presented the Budget for financial year on February 2, 2018. Budget Highlights
4(8)/Ec. Dn. /2017 Ministry of Finance Department of Economic Affairs Economic Division MONTHLY ECONOMIC REPORT OCTOBER 2018 ***** HIGHLIGHTS
/Ec. Dn. /2017 Ministry of Finance Department of Economic Affairs Economic Division MONTHLY ECONOMIC REPORT OCTOBER 2018 ***** HIGHLIGHTS") 4(8)/Ec. Dn. /2017 Ministry of Finance Department of Economic Affairs Economic Division MONTHLY ECONOMIC REPORT OCTOBER 2018 ***** HIGHLIGHTS The growth of real GDP for the first quarter of was 8.2 per
4(8)/Ec. Dn. /2017 Ministry of Finance Department of Economic Affairs Economic Division MONTHLY ECONOMIC REPORT OCTOBER 2018 ***** HIGHLIGHTS The growth of real GDP for the first quarter of was 8.2 per
CIVIL ACCOUNT FOR THE GOVERNMENT OF GENERAL STATEMENT OF ACCOUNT 17,62,51,48,07, ,14,37,60,32, ,34,23,85,29,000.
 REPORT ID: PRINTED BY: PRINTED ON: CIVIL ACCOUNT FOR THE GOVERNMENT OF FOR THE MONTH OF FEB/219 GENERAL STATEMENT OF ACCOUNT TAMILNADU
National Bureau of Statistics Ministry of Finance Dar-es-Salaam
 THE UNITED REPUBLIC OF TANZANIA National Bureau of Statistics Ministry of Finance Dar-es-Salaam October, 2013 PREFACE The publication National Accounts of Tanzania Mainland 2001-2012 is the fifth in the
International Monetary Fund Washington, D.C.
 2008 International Monetary Fund June 2008 IMF Country Report No. 08/192 Kuwait: Statistical Appendix This Statistical Appendix for Kuwait was prepared by a staff team of the International Monetary Fund
BUDGET: TABLE 1: BUDGET AT A GLANCE (Actuals) A. Revenue Receipts
 A. Revenue Receipts") BUDGET: 2018-19 TABLE 1: BUDGET AT A GLANCE (Rs. in crore) Items 2016-17 (Actuals) (RE) 2018-19 A. Revenue Receipts 41978 58168 55307 64269 B. Revenue Expenditure 39812 48819 43882 51185 Revenue Surplus
BUDGET: 2018-19 TABLE 1: BUDGET AT A GLANCE (Rs. in crore) Items 2016-17 (Actuals) (RE) 2018-19 A. Revenue Receipts 41978 58168 55307 64269 B. Revenue Expenditure 39812 48819 43882 51185 Revenue Surplus
International Journal of Academic Research ISSN: ; Vol.4, Issue-1(1), January, 2017 Impact Factor: 4.535;
, January, 2017 Impact Factor: 4.535;") Compositional changes of public expenditure in Andhra Pradesh Dr.B.Lilly Grace Eunice, Assistant Professor, Dept. of Economics, Andhra University Visakhapatnam Mr.D.Narayana Rao, Lecturer, Girraj Govt.
Compositional changes of public expenditure in Andhra Pradesh Dr.B.Lilly Grace Eunice, Assistant Professor, Dept. of Economics, Andhra University Visakhapatnam Mr.D.Narayana Rao, Lecturer, Girraj Govt.
TAMILNADU STATE FINANCES
 TAMILNADU STATE FINANCES Prof.K.R.Shanmugam 1 Dr.G.S.Ganesh Prasad 2 Dr. L. Venkatachalam 3 Report Submitted to The Fourteenth Finance Commission, New Delhi MADRAS INSTITUTE OF DEVELOPMENT STUDIES Chennai
Union Budget : An Analysis
 Union Budget 2012-13: An Analysis -*Dr U.Subrahmanyam The Indian Finance Minister, Mr. Pranab Mukherjee presented the Union Budget 2012-13, in a scenario of world countries most of them in a serious crisis.
STATUS OF RURAL AND AGRICULTURAL FINANCE IN INDIA
 STATUS OF RURAL AND AGRICULTURAL FINANCE IN INDIA Dr. K. K. Tripathy The public capital formation in the agricultural sector is on the decline and the traditional concern about accessibility of agricultural
Prepared by Basanta K Pradhan & Sangeeta Chakravarty November 2009
 Prepared by Basanta K Pradhan & Sangeeta Chakravarty November 2009 Index of industrial production shows sign of economic recovery IIP increased by 9.1 percent Inflation now turning positive High food prices
CIVIL ACCOUNT FOR THE GOVERNMENT OF GENERAL STATEMENT OF ACCOUNT ,08,36,09,79, ,39,20,14, ,25,98,73,000.
 REPORT ID: PRINTED BY: PRINTED ON: CIVIL ACCOUNT FOR THE GOVERNMENT OF FOR THE MONTH OF APR/216 GENERAL STATEMENT OF ACCOUNT TAMILNADU
Haryana Budget Analysis
 -2. -2. 3.1% 3. 2.3% 5.7% 7. 7. 7.7% 6.1% 7.7% 8. 9. 9. 8.7% 10.5% 9.9% 10.3% 10.9% 10.8% Budget Analysis The Finance Minister of, Captain Abhimanyu, presented the Budget for financial year on March 9,
CIVIL ACCOUNT FOR THE GOVERNMENT OF GENERAL STATEMENT OF ACCOUNT 9,69,71,98,06, ,08,36,09,79, ,39,20,14,000.00
 REPORT ID: PRINTED BY: PRINTED ON: CIVIL ACCOUNT FOR THE GOVERNMENT OF FOR THE MONTH OF JUN/216 GENERAL STATEMENT OF ACCOUNT TAMILNADU
Item
 223 POPULATION a, b Total population million; as of 1 July 5.704 6.156 6.665 6.744 6.731 6.784 6.813 6.857 Population density c persons per square kilometer 5296 5840 6200 6260 6240 6280 6310 6350 Population
Telangana Budget Analysis
 The Finance Minister of Telangana, Mr. Eatala Rajender, presented the Budget for Telangana for financial year on March 14, 2016. Budget Highlights The Gross State Domestic Product of Telangana for is estimated
State Finances. Chapter Introduction
 UTTAR PRADESH Chapter 16 State Finances 16.1 Introduction In the late nineties, almost all states went through a difficult phase in respect of state finances. In a comparative perspective, however, Uttar
A monthly publication from South Indian Bank. To kindle interest in economic affairs... To empower the student community...
 To kindle interest in economic affairs... To empower the student community... Open YAccess www.sib.co.in ho2099@sib.co.in A monthly publication from South Indian Bank Experience Next Generation Banking
Hong Kong, China. Key Indicators for Asia and the Pacific 2018
 Key Indicators for Asia and the Pacific 2018 1 POPULATION a Total population as of 1 July (million) 6.7 6.7 6.7 6.7 6.8 6.8 6.9 6.9 7.0 7.0 7.0 7.1 7.2 7.2 7.2 7.3 7.3 7.4 Population density b (persons/km
Current Macroeconomic Situation of Nepal
 Current Macroeconomic Situation of Nepal (Based on the Four Months' Data of FY 2012/13) Monetary Situation Money Supply 1. Broad money supply (M2) increased by 4.0 percent during the four months of the
National Accounts
 Republic of Namibia National Accounts 1996 2006 Sectoral Contribution to GDP, 2006 Primary Sector 22.1% Tertiary Sector 51.6% Secondary Sector 18.4% Central Bureau of Statistics National Planning Commission
DOMESTIC SAVING. National Accounts Statistics Sources & Methods, 2007 CHAPTER 24. quasi government bodies and nondepartmental
 DOMESTIC SAVING Introduction 24.1 Saving represents the excess of current income over current expenditure and is the balancing item of: the income and outlay accounts (as per 1968 SNA) and use of disposable
STCI Primary Dealer Ltd
 Macroeconomic Update: GDP Q3 FY18 Beating expectations, India s Real GDP noted a sharp rebound, coming in at 7.2% for Q3 FY18, higher than the revised estimate of 6.5% witnessed in the previous quarter.
International Monetary Fund Washington, D.C.
 2004 International Monetary Fund May 2004 IMF Country Report No. 04/140 January 29, 2001 January 29, 2001 January 29, 2001 January 29, 2001 January 29, 2001 Republic of Belarus: Statistical Appendix This
ANNEXURE-I QUESTIONNAIRE FOR FARMERS
 ANNEXURE-I QUESTIONNAIRE FOR FARMERS 1. Identification (i) State (ii) Distt. (iii) Tehsil (iv) Village (v) Block (vi) Name of the Head of Family (vii) Respondent 2. Household Composition S.No. Name Relationship
Karnataka Budget Analysis
 -4. 3. 8.9% 7.7% 8.6% 7. 8. 10.3% 14. 19.7% 19.8% 15. 13.4% 13.6% 13.4% 11.8% 11. 11.8% 12. 17.4% Karnataka Budget Analysis The Chief Minister and Finance Minister, Mr. H. D. Kumaraswamy presented the
NATIONAL ECONOMIC ACCOUNTS 2010 (Provisional Estimates)
") REPUBLIC OF CYPRUS NATIONAL ECONOMIC ACCOUNTS 2010 (Provisional Estimates) STATISTICAL SERVICE National Accounts Statistics Series II Report No. 27 Obtainable from the Printing Office of the Republic of
REPUBLIC OF CYPRUS NATIONAL ECONOMIC ACCOUNTS 2010 (Provisional Estimates) STATISTICAL SERVICE National Accounts Statistics Series II Report No. 27 Obtainable from the Printing Office of the Republic of
Prepared by Basanta K Pradhan & Sangeeta Chakravarty August 2010
 Prepared by Basanta K Pradhan & Sangeeta Chakravarty August 21 Highlights Industrial growth cools down WPI inflation falls marginally. Rupee appreciates marginally The annual growth of Index of Industrial
PRIORITY SECTOR LENDING - RRB
 PRIORITY SECTOR LENDING - RRB Priority Sector lending includes lending to those sectors that impact large sections of the population, the weaker sections and the sectors which are employment-intensive
Nicaragua. 1. General trends. 2. Economic policy. The economy grew by 4.5% in 2010, after shrinking by 1.5% in 2009, indicating that Nicaragua
 Economic Survey of Latin America and the Caribbean 2010-2011 197 Nicaragua 1. General trends The economy grew by 4.5% in 2010, after shrinking by 1.5% in 2009, indicating that Nicaragua has recovered from