ROYAL MONETARY AUTHORITY OF BHUTAN SELECTED ECONOMIC INDICATORS
|
|
|
- Vivien Barton
- 5 years ago
- Views:
Transcription
1 ROYAL MONETARY AUTHORITY OF BHUTAN SELECTED ECONOMIC INDICATORS JUNE 2012

2 ROYAL MONETARY AUTHORITY OF BHUTAN SELECTED ECONOMIC INDICATORS Vol.26 No.2 JUNE 2012
3 Postal Address Royal Monetary Authority of Bhutan Post Box No.154 Thimphu, Bhutan Telephone /323110/323111/ Fax (975) Website
4 CONTENTS
5 PAGE PREFACE STATISTICAL ABBREVIATIONS AND SYMBOLS... 2 OVERALL ECONOMIC SITUATION... 3 A SUMMARY OF ECONOMIC INDICATORS... 4 SECTORAL DEVELOPMENT... 5 STATISTICAL SECTION Table 1. Gross Domestic Product at Factor Cost by Kind of Activity, at Current Prices...17 Table 2. Gross Domestic Product at Factor Cost by Kind of Activity, at 2000 Prices...18 Table 3. Sales of Major Hydropower Plants..19 Table 4. Sales of Major Industries Table 5. Royal Monetary Authority of Bhutan- Monetary and Financial Statistics..23 Table 6. Deposit Money Banks-Monetary and Financial Statistics Table 7. Bank of Bhutan Limited-Monetary and Financial Statistics Table 8. Bhutan National Bank Limited-Monetary and Financial Statistics Table 9. TBank Limited-Monetary and Financial Statistics Table 10. Druk PNB Bank Limited-Monetary and Financial Statistics Table 11.Bhutan Development Bank Limited-Monetary and Financial Statistics Table 12. Monetary Survey Table 13. Royal Insurance Corporation of Bhutan Limited- Financial Statistics Table 14. Bhutan Insurance Limited-Financial Statistics Table 15. Auctions/Tap Sales of RMA Bills/ Govt. Treasury Bills Table 16. Financial Institutions Deposits and Lending Rates Table 17. Summary of Consumer Price Index Table 18. Indian Wholesale Price Index (WPI) of all Commodities Table 19. The Royal Securities Exchange of Bhutan Limited-Information on Listed Companies Table 20. Overall Balance of Payments Estimates Table 21. Balance of Payments Estimates with India Table 22. Balance of Payments Estimates with Countries Other Than India Table 23. Gross International Reserves Table 24A. Composition of Trade with India (Imports) Table 24B. Composition of Trade with India (Exports) Table 25A. Composition of Imports from Countries Other Than India Table 25B. Composition of Exports to Countries Other Than India Table 26. Direction of Trade Table 27. Tourist Arrivals and Revenues Table 28. External Debt: Disbursement by sector Table 29. External Debt Servicing by sector..68 Table 30. Bhutan s Outstanding External Debt-Fiscal Year Postition Table 31. External Debt Outstanding By Individual Creditor Categories Table 32. Bhutan s Debt Service Payments By Creditor Categories... 74
6 Table 33. Exchange Rate, Ngultrum/US Dollar Table 34. Exchange Rate, Japanese Yen/US Dollar Table 35. Exchange Rate, Euro/US Dollar Table 36. Summary of Budgetary Operations Chart 1. Sales of Major Hydropower Plants Chart 2. Sales of Major Industries Chart 3. Net Domestic Credit Chart 4. Currency in Circulation Outside Banks Chart 5. Overall Foreign Trade Chart 6. Overall Balance of Payments Chart 7. Trade with India Chart 8. Balance of Payments with India Chart 9. Trade with Countries Other Than India...54 Chart 10. Balance of Payments with Countries Other Than India..54 Chart 11. Gross Rupee Reserves Chart 12. Gross Convertible Currency Reserves Chart 13. Tourism s Contribution to GDP Chart 14. Tourism s Earnings in % of Domestic Revenues.64 Chart 15. External Debt Outstanding Chart 16. Creditor-Wise Loans Outstanding Chart 17. Total Debt Outstanding as % of GDP 71 Chart 18. Debt Service Ratio Chart 19. Exchange Rate, Ngultrum/US Dollar Chart 20. Exchange Rate, Japanese Yen/US Dollar 76 Chart 21. Exchange Rate, Euro/US Dollar Chart 22. Domestic Revenue Chart 23. Government Expenditure Chart 24. Fiscal Balance (% of GDP) Chart 25. Summary of the Government Budget Annexures.. 81 Annex I. Royal Monetary Authority of Bhutan-Balance Sheet...82 Annex II. Royal Monetary Authority of Bhutan-Income and Expenditure..85 Publication Calendar of the Royal Monetary Authority of Bhutan..86
7 PREFACE The Selected Economic Indicators (SEI) is issued quarterly by the Research and Statistics Department of the Royal Monetary Authority of Bhutan, under the direction of the Management. This publication features macro-economic indicators for Bhutan available up to the second quarter of For users reference, the Publication Calendar of the Royal Monetary Authority of Bhutan has been presented at the end of this SEI. We thank all those who have contributed to the information contained in this Report. 1
8 STATISTICAL ABBREVIATIONS AND SYMBOLS e p r estimated provisional revised estimates - the figure is zero or less than half the final digit shown or the item does not exist or the figure is not available. the figure is unknown or is not meaningful or is not to be published --- change within a time series, causing a break in continuity + fiscal year, July-June Y-o-y year on year Indian Rupees ( ) negative Discrepancies in the totals are due to rounding. 2
9 OVERALL ECONOMIC SITUATION As per the national accounts statistics of the National Statistics Bureau, real GDP growth was recorded at 8.5 percent in 2011 as compared to 11.7 percent in Growth in broad money (M2) declined during the quarter ending June 2012 recording negative 1 percent from 21.2 percent during the same quarter last year. And inflation, measured by the year-to-year change of the consumer price index, increased to 13.5 percent in the second quarter of 2012, from 8.3 percent in the same quarter of Bhutan s balance of payments estimates are available as of the FY 2010/11 and have been revised in this edition of the SEI since the figures were first published in the RMA Annual Report 2010/11. Bhutan s current account deficit widened to 25.7 percent of GDP in FY 2010/11 from 10.8 percent in the previous year. However, aid related inflows in the capital and financial account have continued to largely finance the current account deficit, as a result of which, the overall balance was positive at Nu.4.5 billion. As of the quarter ending June 2012, Bhutan s gross international reserves stood at USD 770 million, slightly increasing from the previous quarter (USD million as of March 2012). Out of total reserves, USD million were convertible currency reserves, while the remaining equivalent of USD 27.1 million ( 1.5 billion), were Indian Rupee reserves. This was sufficient to cover 9.6 months of merchandise imports at the end of June (Please see Table 23 for details). Meanwhile, the country s total outstanding external debt as of June 2012 stood at USD 1,358.1 million. Of this total, USD million were outstanding convertible currency debt and an equivalent of USD million ( 45.6 billion) were Indian Rupee debt. Debt servicing for the fiscal year 2011/12 (June 2012) amounted to USD 22.8 million on convertible currency debt and 44.8 billion towards Rupee denominated debt. The Government of India remains Bhutan s leading creditor with an outstanding debt of 38.5 billion or an equivalent of USD million, followed by the ADB at USD million and the World Bank at USD million. According to the revised budget estimates for the FY 2011/12, the total budget allocation stood at Nu.37.1 billion, higher by Nu.7.3 billion as compared to the 2010/11 actual budget outlay. This increase was mainly due to a surge in both capital and current expenditures. 3
10 A SUMMARY OF ECONOMIC INDICATORS Bhutan India Price Index Domestic Credit 3)4) Hydropower Sales Net International reserves 3)6) (Net) sector Domestic Export revenues 5) INR currency Total 1) 2) Government Private Tourism Convertible in millions of: Exchange rates 7) BTN/ BTN/ Period Percentage change on the previous year BTN BTN USD INR USD USD USD EURO Mar Jun Sep Dec Mar Jun Sep Dec Mar Jun Sep Dec Mar Jun Sep Dec Mar Jun Source: 1) National Statistics Bureau. The index refers to the average prices during the respective quarters (Base Q = 100). Prior to Q3, 2003, the CPI was calculated on a half-yearly basis. 2) Source: Reserve Bank of India. Wholesale Price Index of All Commodities, Base = 100. Effective August 2010, the RBI has revised the base year from to , creating a break in the continuity and comparison of data. The newly-recalculated WPI commences from April ) End of period. 4) Monetary Survey data. 5) Convertible currency paying tourists only 6) RMA and Commercial Banks. Reserves are net of Gold and Liabilities. Note: W.e.f. April 2004, cash in hand of commercial banks are excluded from total reserves. Historical data have also been adjusted. 7) Period average 4
11 SECTORAL DEVELOPMENT 5
12 DOMESTIC ECONOMY As per the national accounts statistics of the National Statistics Bureau, real GDP growth recorded 8.5 percent in 2011 compared to 11.7 percent in Percent The tertiary sector (Wholesale and retail trade; Hotel and restaurant; Transport, storage and communication; Financing, insurance and real estate; Community, social and personal services and Private social and recreational services) was the main contributor to real GDP growth followed by the secondary sector. Percent Real GDP Growth (Year-to-Year,%) Real GDP Growth (By Sector) Primary Sector Secondary Sector Tertiary Sector 8.5 The tertiary sector growth rate accelerated to 27.4 percent in 2011, accounting for 43.6 percent of nominal GDP. Within the tertiary sector, the hotels and restaurants growth rate was highest (56 percent), followed by growth in the construction sector (under the secondary sector) at 35 percent. Sectors including mining and quarrying; electricity and water; and wholesale and retail trade witnessed growth rates of 20.1 percent, -6.7 percent and 23.7 percent, respectively. The construction sector accounted for the highest share of overall GDP at 16.3 percent followed by agriculture, livestock and forestry sector at 15.7 percent and the electricity and water sector at 13.9 percent during the year. In terms of sectoral contribution to overall real GDP, the transport, storage and communication sector along with financing, insurance, real estate and business services sector was the highest with an increase of 1.9 percentage points, followed by construction at 1.8 percentage points. (Please refer to Tables 1, 2, and 27 for more details on GDP and Tourism figures). Quarter-wise Arrivals (Convertible Currency Paying Tourists) Q1 Q2 Q3 Q4 Q1 Q2 Q3 Q4 Q
13 Convertible currency paying tourist arrivals totaled 10,903 during the second quarter of 2012, increasing by 40.1 percent over the same quarter in 2011 and by 42.5 percent over the previous quarter. Subsequent revenue earnings totaled USD 15.1 million against 9.6 million in the same quarter of 2011, increasing by 50.9 percent against the previous quarter and an annual growth of 57.4 percent from the same quarter last year Power Sales (Nu. in millions) Q1 Q2 Q3 Q4 Q1 Q2 Q3 Q4 Q1 Q Foreign Exchange Earnings from Tourism 25.0 Exports Domestic sales (right hand) Q1 Q2 Q3 Q4 Q1 Q2 Q3 Q4 Q1 Q Meanwhile, on the hydropower sector front, total export earnings increased to Nu.1.8 billion during the second quarter of 2012, from Nu.4.3 million in the first quarter of Total electricity sales (export and domestic) for the quarter ending June 2012 amounted to Nu.2 billion. (Please refer to Table 3 for more details on hydropower sales.) 7
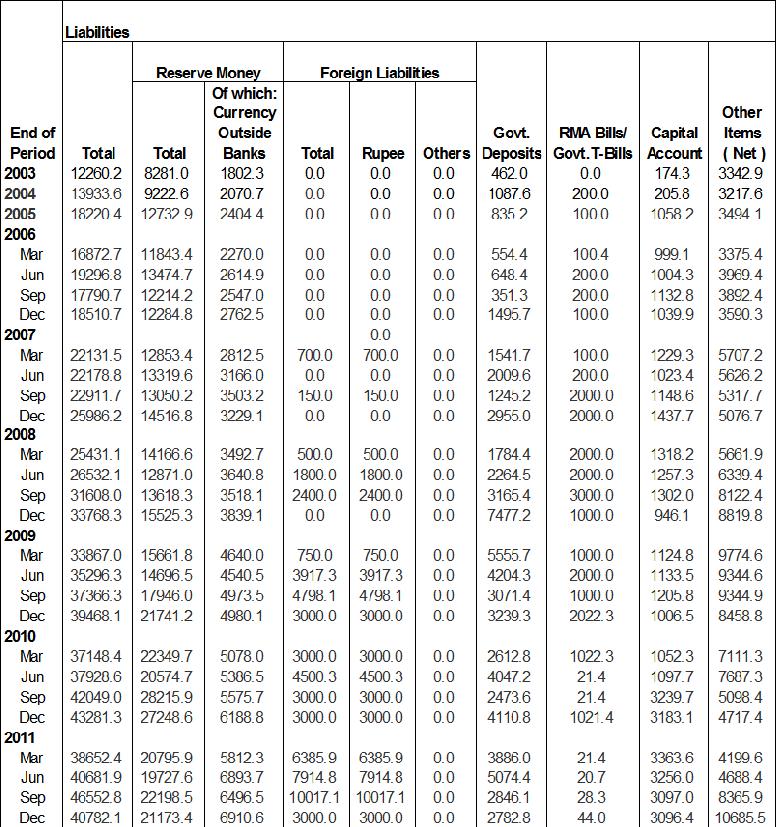
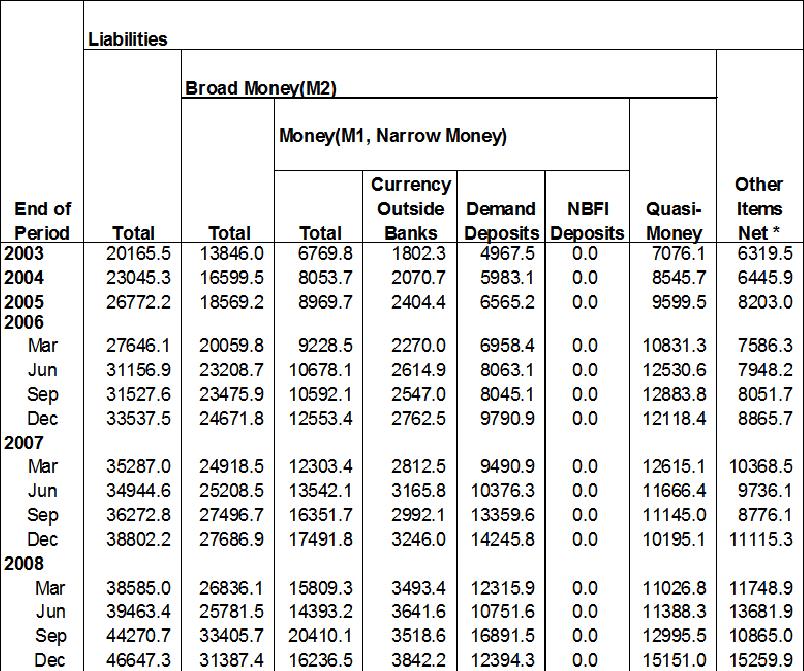
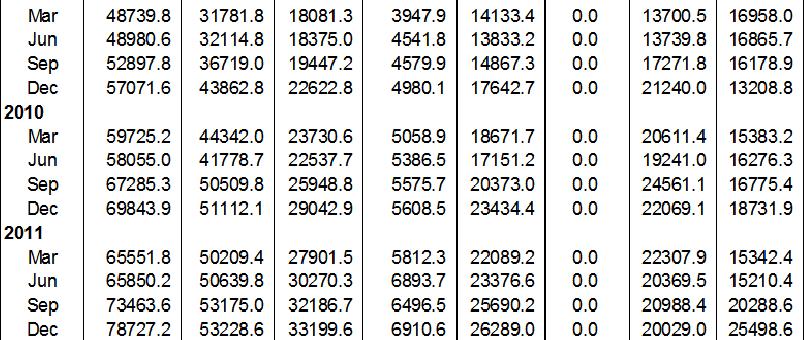
14 MONETARY AND FINANCIAL DEVELOPMENTS For monetary analysis, the financial institutions balance sheets are classified within the framework of the Monetary and Financial Statistics (MFS) Manual 2000 of the IMF. The data presented is not comparable to those produced by the Financial Regulation and Supervision Department of the RMA. The annual growth rate of broad money (M2) recorded negative growth of 1 percent as of the quarter ending June 2012 compared to 21.2 percent corresponding to the same quarter of last year. This was mainly due to the decrease in quasi money (QM) as well as currency in circulation outside the banks. (Details of the Monetary Survey are presented in Table 12). Money Supply (Nu. in millions) Q1 Q2 Q3 Q4 Q1 Q2 Q3 Q4 Q1 Q Broad money Quasi money Narrow money The growth rate of M1 decreased from 34.3 percent as of June 2011 to 5.6 percent as of the review quarter. Of M1, currency in circulation outside banks decreased from 28 percent as of June 2011 to negative 7.3 percent as of June 2012 and growth in demand deposits decreased from 36.3 percent to 9.4 percent as of the review quarter. Meanwhile, the growth in time deposits improved from negative 4.4 percent to negative 2.9 percent as of June 2012 and growth in foreign currency deposits decreased from percent to negative 48.6 percent during the review quarter. As a result, growth in quasi-money decreased from 5.9 percent to negative 10.8 percent during June Slow-down in the growth of foreign currency deposits was the main contributing factor for the lower growth in quasi money. Net foreign assets (NFA), a major counterpart of money supply, slightly increased to Nu.35.2 billion as of June 2012 from Nu.35.1 billion as of the quarter ending June Of the total NFA, convertible foreign currency amounted to Nu.44.7 billion and Indian Rupees to (9.6) billion. Growth in domestic credit, the other counterpart of M2, increased from 32.7 percent in June 2011 to 51.3 percent as of June Growth in credit to the private sector increased from 29.4 percent as of June 2011 to 30.1 percent during the review quarter. Meanwhile, growth in other items net (OIN) increased to percent in June 2012 from negative 6.5 percent as of March Annual inflation, as measured by the consumer price index (CPI), increased to 13.5 percent in the second quarter of 2012 from 8.3 percent in the same quarter of An increase was witnessed in the general prices of food items from 10.6 percent in the second quarter of 2011 to 18.7 percent in the same quarter of 2012, while non-food prices increased to 10.7 percent in the second quarter of 2012 from 7.1 percent during the same quarter of previous year. (Details of the CPI are presented in Table 17). 8
15 Activities of Commercial Banks The total assets and liabilities of commercial banks increased to Nu.59.6 billion as of June 2012 from Nu.54.1 billion as of the same period last year, recording a growth rate of 10.3 percent during the review quarter (Please refer to Tables 6-12 for details). Composition of Commercial Banks Reserve (June 2012) Other Deposits 69% Cash 9% Cash Reserve Ratio (CRR) 22% respectively as of June 2012 (The total credit was Nu.45.5 billion while total deposit was Nu.43.7 billion). Of the total deposit liabilities of the commercial banks (Nu.43.7 billion as of June 2012), 49.8 percent were held by individuals, 23.9 percent were held by the government corporations, and the remaining by other sectors of the economy. Financial Institution s Contribution to Credit (June 2012) TBank 5% DPNB 6% RICB 11% BIL 1% BOB 33% BDBL 10% Total reserves with the RMA amounted to Nu.10.5 billion as of June 2012, or 17.7 percent of their total assets. Of the total reserves, 22 percent were absorbed through CRR, 9 percent was held in cash and the remaining was held as other deposits. In addition to reserves held with the RMA, and excluding cash in hand, the banks held Nu.2.6 billion worth of foreign assets (both in Indian Rupee and convertible foreign currency) as of June BNB 34% Activities of Non-Bank Financial Institutions (NBFIs) The total assets and liabilities of the NBFIs stood at Nu.7.2 billion as of June This was mainly attributed to the rise in the claims on the private sector. Meanwhile, their total credit portfolio accounted for 93.6 percent of their total assets. (Please refer to Tables 13 and 14 for details). Commercial banks credit to the private sector increased to Nu.43.7 billion, recording an annual growth of 30.1 percent as of June Meanwhile, commercial banks credit to asset and credit to deposit ratios were recorded at 77.6 percent and percent 9
16 Sectoral Credit of the Financial Institutions The growth (y-o-y) in the total credit of the financial institutions grew by 26.2 percent (to Nu.51.3 billion) during the quarter. Of this, 26.5 percent were invested in building and construction, followed by personal loans (16.2 percent), manufacturing sector (15.3 percent), service and tourism (12 percent), with the remainder invested in other sectors of the economy. Credit Activity (June 2012) Nu. in millions 16,000 14,000 12,000 10,000 8,000 6,000 4,000 2,000 0 Q1 Q2 Q3 Q4 Q1 Q2 Q3 Q4 Q1 Q Agriculture Service & Tourism Manufacturing Building & Construction Trade & Commerce Transport Others 10
17 EXTERNAL SECTOR Bhutan s balance of payments data for FY 2010/11 were first published in the RMA Annual Report 2010/11. Since then, and in keeping with the RMA revision policy, this edition of the SEI features revised balance of payments data for FY 2010/11. The BOP for FY 2010/11 has been revised based on revisions in data for current transfer receipts (grants for budget support) sourced from the Ministry of Finance. Bhutan s trade deficit continued to widen considerably to Nu.23.5 billion or 32.5 percent of GDP in the fiscal year. While exports to India grew by 8.9 percent, exports to COTI more than doubled. However, COTI exports accounted for only 15.6 percent of the total in the fiscal year and consequently, the doubling of COTI exports did not impact overall export performance much. Overall exports increased by 18.7 percent to Nu.30.2 billion. On the other hand, overall imports increased by 36.5 percent to Nu.53.7 billion driven by a huge jump in imports from India (from Nu.28.3 billion in FY 2009/10 to Nu.40.6 billion). Bhutan s Overall Balance of Payment Nu. Millions / / /11 (p) Trade Balance Current Account Overall Balance Budgetary Grants Capital & Financial Account Within the invisibles account, the deficit in the services and income accounts increased by 57.7 percent and 29.1 percent, respectively during the year. Current transfer receipts (largely grants for budgetary support) also decreased during the year by 5.6 percent. Consequently, Bhutan s current account deficit widened to 25.7 percent of GDP from 10.8 percent in the previous year. Bhutan s capital and financial account surplus more than doubled in 2010/11 as RGOB borrowing increased fourfold with the start of construction on the GOI-financed Punatsangchhu II and Mangdechhu hydropower projects, while disbursements for the Dungsam Cement Corporation Ltd from a consortium of Indian banks, to the tune of Nu.1.5 billion, also commenced in the year, helping to drive up the overall surplus. Further, the Royal Government s convertible currency loan disbursements availed on concessional terms also doubled in the fiscal year. Total RGOB loan disbursements increased, from Nu.4.9 billion in 2009/10 to Nu.14.1 billion. Of the total, Rupee loan disbursements constituted 67.1 percent (Nu.9.5 billion compared to Nu.2.4 billion in 2009/10). Convertible currency loan disbursements increased from Nu.2.5 billion in 2009/10 to Nu.4.6 billion in 2010/11. After provisioning for net errors and omissions, Bhutan s overall balance of payments was positive at Nu.4.5 billion for the fiscal year 2010/11, underpinned as usual by the combination of large current transfer receipts and capital and financial account surplus. (Please see Tables for details) 11
18 As of the quarter ending June 2012, Bhutan s gross international reserves stood at USD 770 million, slightly increasing from the previous quarter (USD million as of March 2012). Out of total reserves, USD million were convertible currency reserves, while the remaining, equivalent of USD 27.1 million ( 1.5 billion), were Indian Rupee reserves. This was sufficient to cover 9.6 months of merchandise imports at the end of June (Please see Table 23 for details Meanwhile, the country s total outstanding external debt as of June 2012 stood at USD 1,358.1 million. Of this total, USD million were outstanding convertible currency debt and an equivalent of USD million ( 45.6 billion) were Indian Rupee debt. Debt servicing for the fiscal year 2011/12 (June 2012) amounted to USD 22.8 million on convertible currency debt and 44.8 billion towards Rupee denominated debt. (Please refer to Tables for details on External Debt and Tables for details on Exchange Rates.) Import cover of Reserves (in months) Total reserves (left y-axis) Rupee reserves (left y-axis) Convertible currency reserves (right y-axis) The Government of India remains Bhutan s leading creditor with an outstanding debt of 38.5 billion or an equivalent of USD million, followed by the ADB at USD million and the World Bank at USD million. In exchange rate developments, the Ngultrum averaged Nu per US Dollar in the quarter ending June The Ngultrum depreciated by 21 percent compared to the quarter ending June Among other major currencies, for the quarter ending June 2012 both the Euro and Yen depreciated against the USD by 2.2 and 1.1 percent respectively as compared to first quarter to
19 Yen vis-à-vis the USD BTN vis-à-vis the USD (period average) Yen per USD Dec '11 Jan '12 Feb '12 Mar '12 Apr '12 May '12 Jun '12 Ngultrum per USD Dec'11 Jan '12 Feb '12 Mar '12 Apr '12 May '12 Jun '12 Euro vis-à-vis USD Euro per USD Dec' 11 Jan '12 Feb '12 Mar '12 Apr '12 May '12 Jun '12 External Debt Indicators Debt Outstanding (in millions) Total (USD) 2006/ / / / /11 1, /12 1,358.1 Convertible Currency (USD) Indian Rupee 18, , , , , ,550.9 Debt/GDP ratio * Total Convertible Currency loan Indian Rupee loan Debt service ratio ** Total Convertible Currency loan Indian Rupee loan GDP * Based on calendar year GDP figures. Example, the 2008 GDP figure is used to calculate the ratio for 2008/09. ** Debt service payments as a percent of the export of goods and services. The total debt service ratio represents the total debt service payments (i.e. on convertible currency & Rupee loans) as a percentage of the total export earnings (from India & other countries). Convertible currency debt service ratio is the debt servicing on convertible currency loans as a percentage of the export earnings from countries other than India. Similarly, the Indian Rupee debt service ratio is the debt servicing on Indian Rupee loans as a percentage of the export earnings from India. The debt service ratio for the latest period is calculated based on the previous year's export of goods and services. ****Debt position published by the RMA include the total external debt of the country (public+private), and therefore is not comparable to those published by the Ministry of Finance which covers only public debt.further, the RMA uses Calendar Year GDP figures for all ratrios to the GDP. Source: Department of Public Accounts & private sector enterprises. 13
20 GOVERNMENT FINANCE A summary of the FY 2011/12 revised budget estimates as of June 2012 has been highlighted in this section. Source: National Budget FY , Ministry of Finance. According to the budget estimates for FY 2011/12, total outlay increased by 24.3 percent to Nu.37.1 billion over the 2010/11 actual budget. This increase was mainly due to the growth in capital and current expenditures. During the year, current expenditure increased by 17.7 percent and capital expenditure by 30.8 percent. Although there was a surge in total expenditure during 2011/12, domestic resources were more than sufficient to cover current expenditure requirements, with a portion (Nu.2.5 billion) being available to finance capital expenditure as well. As a result, the overall budget is estimated to be in deficit of Nu.3.7 billion against a deficit of Nu.1.7 billion in the previous year. (Please see Table 36 for details.) On the resource front, total revenue including grants increased from Nu.28.2 billion in 2010/11 to Nu.33.3 billion in 2011/12, mainly on account of improvements in resource mobilization efforts through domestic tax revenue as well as continued donor assistance. The percentage share of tax revenue and non-tax revenue to overall resources were 40.3 percent and 17.1 percent, respectively. Grants constituted 40.5 percent of total resources. Financing the Deficit (Nu. in millions) 2000 Financing the Deficit Nu. in millions / / / Percent Net internal borrowing Fiscal deficit in % of GDP Net external borrowing -5 14
21 STATISTICAL SECTION 15
22 TABLE 1. GROSS DOMESTIC PRODUCT BY KIND OF ACTIVITY AT CURRENT PRICES Millions of Ngultrum Year Sector Agriculture, livestock, and forestry Agriculture proper Livestock Forestry and logging Mining and quarrying Manufacturing Electricity and water Construction Wholesale and retail trade Hotel and restaurant Transport, storage, and communication Financing, insurance, real estate & Business services Finance & Insurance Real estate & dwelings Business services Community and social services Public Administration Education and health Private social & recreational services Plus: taxes net of subsidies Gross Domestic Product GDP Growth rate (%) Source: National Accounts Statistics, 2010, National Statistics Bureau. Discrepancies in the figures are due to rounding. 16
23 TABLE 2. GROSS DOMESTIC PRODUCT BY KIND OF ACTIVITY IN 2000 PRICES Millions of Ngultrum Year Sector Growth from 2010 to 2011(%) 1. Agriculture, livestock, and forestry Agriculture proper Livestock Forestry and logging Mining and quarrying Manufacturing Electricity & water Construction Wholesale and retail trade Hotels and restaurants Transport, storage, and communication Finance, insurance, real estate & Business services Finance & Insurance Real estate & dwellings Business services Community and social services Public Administration Education and health Private social & recreational services Plus taxes on products less subsidies Gross Domestic Product GDP Growth rate (%) Source: National Accounts Statistics, 2010, National Statistics Bureau. Discrepancies in the figures are due to rounding. 17
24 TABLE 3. SALES OF MAJOR HYDROPOWER PLANTS Millions of Ngultrum Total Sales Domestic Sales (1) Exports (2) Period Total Basochu Chukha Kurichhu Tala Total Basochu Chukha Kurichhu Tala Total Chukha Kurichhu Tala , , , , , , , , , , , , , , , , , , Q (10.2) Jan (4.7) 83.2 Feb (2.7) 44.6 Mar (2.8) 42.2 Q2 2, , , ,111.0 Apr May Jun 1, , Q3 4, , , , , ,068.8 Jul 1, , Aug 1, , Sep 1, , Q4 2, , , ,130.9 Oct 1, , Nov Dec Q (4.7) Jan (2.6) 79.5 Feb (1.8) 41.1 Mar (0.3) 62.2 Q2 2, , , ,089.6 Apr May Jun 1, Percentage change on the previous year (0.3) (11.2) (48.2) 9.9 (0.7) (11.0) (7.5) (4.2) (1.2) (9.5) (10.9) 7.8 (4.2) 14.6 (5.0) 39.6 (8.7) (1.6) (11.8) (12.4) 2010 (2.9) (18.4) (26.8) 55.9 (33.1) (11.4) (0.9) 96.8 (30.1) 2011 Q1 (14.2) 9.4 (11.6) (51.2) (11.0) (30.8) 9.4 (51.4) (13.2) (56.0) (6.4) (7.7) (155.5) 14.5 Jan (10.8) 6.0 (15.5) (31.2) (5.4) (25.8) 6.0 (50.1) 4.1 (53.8) (4.9) (12.4) (741.5) 12.9 Feb (39.7) 15.3 (28.1) 17.4 (53.1) 1.9 (55.8) (165.1) Mar (30.9) 6.3 (21.6) (64.9) (33.6) (37.6) 6.3 (51.2) (32.3) (58.3) (27.8) (18.9) (121.0) (19.9) Q2 (4.6) (2.6) (7.7) (0.9) (3.0) (30.7) (2.6) (53.3) (6.5) (60.5) (1.7) (6.5) Apr (33.1) 6.9 (28.9) (19.1) (42.2) (30.6) 6.9 (55.8) 0.7 (59.4) (33.6) (27.7) (40.9) (39.0) May (0.2) (6.6) (3.2) (32.9) (6.6) (51.7) (3.4) (60.9) 4.0 (1.7) Jun 2.1 (4.2) (2.0) (28.9) (4.2) (52.3) (16.1) (61.1) 4.4 (1.1) Q3 (31.1) (0.5) (5.3) (4.4) (45.4) (6.9) (0.5) (23.8) 1.2 (30.4) (32.3) (5.2) (6.1) (45.6) Jul (29.5) 0.9 (0.7) (13.5) (44.6) (21.5) 0.9 (52.7) (19.8) (60.5) (30.0) 0.0 (11.3) (44.3) Aug (28.8) 0.3 (2.2) (4.1) (43.4) (30.2) (2.3) (8.1) (43.8) Sep (35.2) (2.6) (13.5) 5.2 (48.4) 2.1 (2.6) (36.9) (13.6) 1.4 (48.9) Q4 (13.7) (9.4) (11.4) (16.0) (15.4) (0.4) (9.4) (14.9) (11.8) (31.1) (16.0) Oct (15.5) (12.5) (15.3) (16.5) (15.8) (4.1) (12.5) (16.2) (15.5) (24.1) (16.2) Nov (15.5) (7.1) (10.9) (18.4) (19.1) 1.9 (7.1) (17.2) (11.4) (33.4) (20.3) Dec (3.0) (5.8) 1.1 (10.2) (5.2) 2.3 (5.8) (4.0) 0.8 (97.5) (5.7) 2012 Q1 6.6 (1.2) (1.2) (54.4) 7.5 Jan (0.0) (5.4) (3.0) 0.5 (5.4) 13.5 (1.4) 6.8 (0.2) 1.4 (45.3) (4.5) Feb (3.0) (0.3) (5.1) 17.2 (4.2) 6.0 (0.3) (6.3) (6.3) (32.6) (7.7) Mar (90.5) 47.2 Q2 Apr May (14.4) (24.6) (15.4) 5.5 (16.3) (1.0) (24.6) (15.6) (15.7) 2.7 (17.4) Jun (15.3) (16.0) (17.9) 6.9 (15.8) (2.8) (16.0) (16.0) (18.1) 4.9 (16.2) Source: DGPC (1) Power tariff for domestic sales: Nu.0.13 per unit for royalty energy (15% of total to government; revised from Nu.0.3 per unit from August 2010) and Nu.1.20 for the rest (industrial use mainly from Kurichhu). Baoschhu sales are to Chhukha at Nu.1.2 per unit. Domestic sales are exclusive of demand charges. (2) Power tariff for export to India: Nu.2 per unit for Chhukha (revised from Nu.1.5 per unit from Jan. 2005); Nu.1.8 per unit for Kurichhu (revised from Nu.1.75 per unit from Jan. 2008) & Tala. Export sales reflected here are net of any payments for the import of power from India in each month. 18
25 Chart 1 Sales of Major Hydropower Plants Nu. millions Total Sales Exports Domestic Sales Chart Sales of Major Industries Nu. millions Exports to India Exports to Countries other than India Domestic Sales 19
26 Millions of Ngultrum TABLE 4. SALES OF MAJOR INDUSTRIES Year Industry II III IV Total II III IV Total I II III IV Total I II III IV Total I II (1) Army Welfare Project Exports to India Exports to Countries other than India Sales within Bhutan (2) Bhutan Board Products Limited Exports to India Exports to Countries other than India Sales within Bhutan (3) Bhutan Carbide & Chemicals Ltd Exports to India Exports to Countries other than India Sales within Bhutan (4) Bhutan Fruit Products Limited Exports to India Exports to Countries other than India Sales within Bhutan (5) Bhutan Polythene Company ltd Exports to India Exports to Countries other than India(*) Sales within Bhutan (6) Penden Cement Authority Ltd Exports to India Exports to Countries other than India Sales within Bhutan
27 TABLE 4. SALES OF MAJOR INDUSTRIES, CONTINUED Millions of Ngultrum Year Industry III IV Total I II III IV Total I II III IV Total I II (7) Bhutan Ferro Alloys Limited Exports to India Exports to Countries other than India Sales within Bhutan (8) Bhutan Agro Industries Limited Exports to India Exports to Countries other than India Sales within Bhutan (9) S.D. Eastern Bhutan Coal Company Ltd Exports to India Exports to Countries other than India Sales within Bhutan (10) Druk Satair Corporation Limited Exports to India Exports to Countries other than India Sales within Bhutan (11) Druk Plaster & Chemicals Limited Exports to India Exports to Countries other than India Sales within Bhutan TOTAL Exports to India Exports to Countries other than India Sales within Bhutan Source : Respective Industry. (1) Alcoholic beverages. -(2) Particle boards. -(3) Calcium carbide. -(4) Processed vegetables and fruits. -(5) High Density Polythene (HDPE) Pipe. (*) Deemed export.- (6)Cement.-(7) Ferro Silicon.-(8) Processed vegetables and fruits -(9) Coal. -(10) Gypsum dust & Gypsum boulders. Data on Bhutan Fruit Products Ltd. unavailable as of 2nd Quarter'
28 22
29 23
30 TABLE 6. DEPOSIT MONEY BANKS - MONETARY AND FINANCIAL STATISTICS Millions of Ngultrum Assets Foreign Assets Claims on Claims Claims Other on End of on Public Private Period Total Reserves Total Rupee Others Govt. Sectors * Sectors** Mar Jun Sep Dec Mar Jun Sep Dec Mar Jun Sep Dec Mar Jun Sep Dec Mar Jun *) Claims on other Public Sector includes Claims on Government Corporations and Other Public Corporations. **) Claims on Private Sector includes Claims on NBFIs. 24
31 TABLE 6. CONTINUED DEPOSIT MONEY BANKS Millions of Ngultrum Liabilities Foreign Liabilities Foreign Other End of Demand Time Currency Govt. Domestic Capital Items Period Total Deposits Deposits Deposits Total Rupee Others Deposits Borrowings Accounts (Net) Mar Jun Sep Dec Mar Jun Sep Dec Mar Jun Sep Dec Mar Jun Sep Dec Mar Jun
32 TABLE 7. BANK OF BHUTAN LIMITED - MONETARY AND FINANCIAL STATISTICS Millions of Ngultrum Assets Foreign Assets Cliams Claims Claims on Other on End of on Public Private Period Total Reserves Total Rupee Others Govt. Sectors* Sectors** Mar Jun Sep Dec Mar Jun Sep Dec Mar Jun Sep Dec Mar Jun Sep Dec Mar Jun *) Claims on Other Public Sector includes claims on Government Corporations and Other Public Corporations. **) Claims on Private Sector includes Claims on NBFIs. 26
33 TABLE 7. CONTINUED BANK OF BHUTAN LIMITED Millions of Ngultrum Liabilities Foreign Liabilities Foreign Other End of Demand Time Currency Govt. Domestic Capital Items Period Total Deposits Deposits Deposits Total Rupee Others Deposits Borrowings Accounts (Net) Mar Jun Sep Dec Mar Jun Sep Dec Mar Jun Sep Dec Mar Jun Sep Dec Mar Jun
34 TABLE 8. BHUTAN NATIONAL BANK LIMITED - MONETARY AND FINANCIAL STATISTICS Millions of Ngultrum Assets Foreign Assets Cliams on Claims Claims Other on End of on Public Private Period Total Reserves Total Rupee Others Govt. Sectors* Sectors** Mar Jun Sep Dec Mar Jun Sep Dec Mar Jun Sep Dec Mar Jun Sep Dec Mar Jun *) Claims on Other Public Sector includes claims on Government corporations and Other Public Corporations. **) Claims on Private Sector includes Claims on NBFIs. 28
35 TABLE 8. CONTINUED BHUTAN NATIONAL BANK LIMITED Millions of Ngultrum Liabilities Foreign Liabilities Foreign Other End of Demand Time Currency Govt. Domestic Capital Items Period Total Deposits Deposits Deposits Total Rupee Others Deposits Borrowings Accounts (Net) Mar Jun Sep Dec Mar Jun Sep Dec Mar Jun Sep Dec Mar Jun Sep Dec Mar Jun
36 TABLE 9. TBANK LIMITED - MONETARY AND FINANCIAL STATISTICS (*) Millions of Ngultrum Assets Foreign Assets Claims on Other Public Sectors ** Claims on Private Sectors *** Claims End of on Period Total Reserves Total Rupee Others Govt Jun Sep Dec Mar Jun Sep Dec Mar Jun *) Reports on the new deposit taking institutions in the financial sector are recorded w.e.f April **) Claims on Other Public Sector includes claims on Government Corporations and Other Public Corporations. ***) Claims on Private sector includes claims on NBFIs. TABLE 9. CONTINUED TBank Limited Millions of Ngultrum Liabilities Foreign Liabilities Foreign Other End of Demand Time Currency Govt. Domestic Capital Items Period Total Deposits Deposits Deposits Total Rupee Others Deposits Borrowings Accounts (Net) 2010 Jun Sep Dec Mar Jun Sep Dec Mar Jun
37 TABLE 10. DRUK PNB LIMITED - MONETARY AND FINANCIAL STATISITCS (*) Millions of Ngultrum Assets Foreign Assets Claims on Claims Other Claims on End of on Public Private Period Total Reserves Total Rupee Others Govt. Sectors ** Sectors*** 2010 Jun Sep Dec Mar Jun Sep Dec Mar Jun *) Reports on the new deposit taking institutions in the financial sector are recorded w.e.f April **) Claims on Other Public Sectors includes claims on Government Corporations and Other Public Corporations. ***) Claims on Private sectors includes claims on NBFIs. TABLE 10.CONTINUED DRUK PNB LIMITED Millions of Ngultrum Liabilities Foreign Liabilities Foreign Other End of Demand Time Currency Govt. Domestic Capital Items Period Total Deposits Deposits Deposits Total Rupee* Others Deposits Borrowings Accounts (Net) 2010 Jun Sep Dec Mar Jun Sep Dec Mar Jun
38 TABLE 11. BHUTAN DEVELOPMENT BANK LIMITED(*) MONETARY AND FINANCIAL STATISTICS Millions of Ngultrum Assets Foreign Assets Claims on Claims Other Claims on End of on Public Private Period Total Reserves Total Rupee Others Govt. Sectors ** Sectors*** 2010 Mar Jun Sep Dec Mar Jun Sep Dec Mar Jun *) Reports on the new deposit taking instutions in the financial sector are recorded w.e.f March **) Claims on Other Public Sectors includes claims on Government Corporations and Other Public Corporations. ***) Claims on Private sectors includes claims on NBFIs. TABLE 11. CONTINUED BHUTAN DEVELOPMENT BANK LIMITED Millions of Ngultrum 32 Liabilities Foreign Liabilities Foreign Other End of Demand Time Currency Govt. Domestic Capital Items Period Total Deposits Deposits Deposits Total Rupee Others Deposits borrowings Accounts (Net) 2010 Mar Jun Sep Dec Mar Jun Sep Dec Mar Jun
39 TABLE 12. MONETARY SURVEY Millions of Ngultrum Assets Foreign Assets(Net) Domestic Credit Public Sector Convertible End of Foreign Govt. Period Total Total Rupee Currency Total (Net) Other Public Private Sectors * Sectors** Mar Jun Sep Dec Mar Jun Jul Dec Mar Jun Sep Dec Mar Jun Sep Dec Mar Jun Sep Dec Mar Jun Sep Dec Mar Jun *) Other Public Sectors includes claims on Govt. Corporations and Other Public Corporations. **) Private sectors includes Claims on NBFIs. 33
40 34
KEY ECONOMIC INDICATORS PREFACE
 PREFACE This June issue of the Monthly Statistical Bulletin contains updates on the monetary aggregates for May, and other available macroeconomic data. We thank all those who have contributed to the information
ROYAL MONETARY AUTHORITY OF BHUTAN
 ROYAL MONETARY AUTHORITY OF BHUTAN MONETARY POLICY STATEMENT MAY 2015 ROYAL MONETARY AUTHORITY OF BHUTAN This Report has been prepared by the Royal Monetary Authority of Bhutan in accordance with Chapter
Current Macroeconomic Situation (Based on the annual Data of 2009/10)
") Current Macroeconomic Situation (Based on the annual Data of 2009/10) Real Sector Gross Domestic Product (GDP) 1. Based on the Preliminary estimate of the Central Bureau of Statistics, the gross domestic
Current Macroeconomic Situation (Based on the annual Data of 2009/10) Real Sector Gross Domestic Product (GDP) 1. Based on the Preliminary estimate of the Central Bureau of Statistics, the gross domestic
ROYAL MONETARY AUTHORITY OF BHUTAN
 ROYAL MONETARY AUTHORITY OF BHUTAN ANNUAL REPORT 2004/2005 January 2006 Postal Address Royal Monetary Authority of Bhutan Chhophel Lam Kawajangsa Post Box No. 154 Thimphu, Bhutan Telephone 322540/323110/323111/323112
4(8)/Ec. Dn. /2017 Ministry of Finance Department of Economic Affairs Economic Division MONTHLY ECONOMIC REPORT NOVEMBER 2018 ***** HIGHLIGHTS
/Ec. Dn. /2017 Ministry of Finance Department of Economic Affairs Economic Division MONTHLY ECONOMIC REPORT NOVEMBER 2018 ***** HIGHLIGHTS") 4(8)/Ec. Dn. /2017 Ministry of Finance Department of Economic Affairs Economic Division MONTHLY ECONOMIC REPORT NOVEMBER 2018 ***** HIGHLIGHTS The growth of real GDP for the first half of 2018-19 was 7.6
4(8)/Ec. Dn. /2017 Ministry of Finance Department of Economic Affairs Economic Division MONTHLY ECONOMIC REPORT NOVEMBER 2018 ***** HIGHLIGHTS The growth of real GDP for the first half of 2018-19 was 7.6
QUARTERLY ECONOMIC REVIEW (QER)
") QUARTERLY ECONOMIC REVIEW (QER) Volume 2 No 4 January - March 2018 OBJECTIVES OF THE CENTRAL BANK OF KENYA The principal objectives of the Central Bank of Kenya (CBK) as established in the CBK Act are:
QUARTERLY ECONOMIC REVIEW (QER) Volume 2 No 4 January - March 2018 OBJECTIVES OF THE CENTRAL BANK OF KENYA The principal objectives of the Central Bank of Kenya (CBK) as established in the CBK Act are:
1 RED June/July 2018 JUNE/JULY 2018
 1 RED June/July 20 JUNE/JULY 20 2 RED June/July 20 MAJOR HIGHLIGHTS Headline consumer inflation grew by 4.9 per cent in June 20 compared to 4.8 per cent recorded in May 20 Inflation rate (% y/y) 4.9 (June)
MONTHLY ECONOMIC REPORT MARCH 2014
 Ministry of Finance Department of Economic Affairs Economic Division 4(3)/Ec. Dn. /2012 MONTHLY ECONOMIC REPORT MARCH 2014 HIGHLIGHTS The growth of GDP at factor cost at constant (2004-05) prices (real
ROYAL MONETARY AUTHORITY OF BHUTAN
 ROYAL MONETARY AUTHORITY OF BHUTAN ANNUAL REPORT 2006/07 January 2008 Postal Address Royal Monetary Authority of Bhutan Chhophel Lam Kawajangsa Post Box No. 154 Thimphu, Bhutan Telephone 322540/323110/323111/323112
Monetary Policy Report
 CENTRAL BANK OF THE GAMBIA Monetary Policy Report November 20 The Central Bank of The Gambia Monetary Policy Report provides summary of reports presented at the Monetary Policy Committee Meeting. It entails
Indian Economy. GDP growth slowed down but remained above the comfortable 7% Manufacturing GVAbp
 Indian Economy Economic Growth GDP growth slowed down but remained above the comfortable 7% Domestic economy witnessed 7.1% GDP growth during the first quarter (Apr - Jun) of fiscal 2016-17 (Q1FY17) as
4(8)/Ec. Dn. /2017 Ministry of Finance Department of Economic Affairs Economic Division MONTHLY ECONOMIC REPORT JUNE 2018 ***** HIGHLIGHTS
/Ec. Dn. /2017 Ministry of Finance Department of Economic Affairs Economic Division MONTHLY ECONOMIC REPORT JUNE 2018 ***** HIGHLIGHTS") 4(8)/Ec. Dn. /2017 Ministry of Finance Department of Economic Affairs Economic Division MONTHLY ECONOMIC REPORT JUNE 2018 ***** HIGHLIGHTS The growth of GDP at constant prices for the fourth quarter of
4(8)/Ec. Dn. /2017 Ministry of Finance Department of Economic Affairs Economic Division MONTHLY ECONOMIC REPORT JUNE 2018 ***** HIGHLIGHTS The growth of GDP at constant prices for the fourth quarter of
MONTHLY ECONOMIC INDICATORS
 MONTHLY ECONOMIC INDICATORS SEPTEMBER 0 Table of Contents 1. INFLATION... 2 2. MONEY, CREDIT AND INTEREST RATES... 6 3. REAL SECTOR INDICATORS... 9 4. BALANCE OF PAYMENTS AND EXTERNAL SECTOR INDICATORS...
Balance of Payment Q3 FY (October-December 2012)
") Balance of Payment Q3 FY2012-13 (October-December 2012) Key Highlights: - India s Current Account Deficit (CAD) widened to a record high of 6.7% of GDP in Q3 FY2012-13 on the back of surging oil and gold
Balance of Payment Q3 FY2012-13 (October-December 2012) Key Highlights: - India s Current Account Deficit (CAD) widened to a record high of 6.7% of GDP in Q3 FY2012-13 on the back of surging oil and gold
Broad Money and Its Affecting Factors
 Broad Money and Its Affecting Factors wa e Weaker growth of broad money (M2) remained in e. It grew 13.0, lower than 13.4 growth in. The deceleration of M2 growth was dragged by Quasi Money (Time and Saving
Annual Report. Fiscal Year 2012/13. Nepal Rastra Bank
 Annual Report Fiscal Year 2012/13 Nepal Rastra Bank Published By: Nepal Rastra Bank Research Department Publication Division Baluwatar, Kathmandu, Nepal Email: publication@nrb.org.np Website: www.nrb.org.np
Major Highlights. Recent Economic Developments. September/October,2016. Central Bank of Swaziland 1
 September/October,20 Major Highlights The country s headline inflation increased to 8.3 per cent in Septmber 20 from 8.0 per cent in August 20. Inflation rate (% y/y) 8.3 (Sep) Discount and prime rates
Financial Stability Report-Bhutan
 Financial Stability Report-Bhutan Bhutan 2015 Financial Regulation & Supervision Department Royal Monetary Authority Purpose of the Financial Stability Report As per Section 7 of the Royal Monetary Authority
Quarterly Statistical Digest
 Quarterly Statistical Digest August Volume 27, No. 3 The Statistical Digest is a quarterly publication of the Central Bank of The Bahamas, prepared by the Research Department for issue in February, May,
Bhutan Development Update
 April 2015 Bhutan Development Update Public Disclosure Authorized Public Disclosure Authorized Public Disclosure Authorized Public Disclosure Authorized The World Bank 1 Growth rebounded in 2014 along
1 RED September/October 2018 SEPTEMBER/OCTOBER 2018
 1 RED September/October 20 SEPTEMBER/OCTOBER 20 2 RED September/October 20 MAJOR HIGHLIGHTS The country s annual consumer inflation grew by 0.2 percentage points to reach 5.1 per cent in September 20,
MONTHLY ECONOMIC REPORT MARCH 2013 HIGHLIGHTS
 Ministry of Finance Department of Economic Affairs Economic Division 4(3)/Ec. Dn. /2012 MONTHLY ECONOMIC REPORT MARCH 2013 HIGHLIGHTS The overall growth of GDP at factor cost at constant prices, as per
ECONOMIC POLICIES, GROWTH AND STRUCTURAL CHANGE OF INDIA B. A. PRAKASH
 ECONOMIC POLICIES, GROWTH AND STRUCTURAL CHANGE OF INDIA B. A. PRAKASH Chairman, Fifth State Finance Commission December 6, 2017 Objectives Examine the economic policies prior and after liberalisation
Quarterly Statistical Digest
 Quarterly Statistical Digest February 2019 Volume 28, No. 1 The Statistical Digest is a quarterly publication of the Central Bank of The Bahamas, prepared by the Research Department for issue in February,
MONETARY POLICY COMMITTEE STATEMENT FOR THIRD QUARTER Governor s Presentation to the Media. 22 nd November, 2017
 1 MONETARY POLICY COMMITTEE STATEMENT FOR THIRD QUARTER 2017 Governor s Presentation to the Media 22 nd November, 2017 INTRODUCTION 2 The presentation is structured as follows: 1. Decision of the Monetary
Broad Money and Its Affecting Factors
 Broad Money and Its Affecting Factors wa ember The growth of liquidity in the economy, or broad money (M2), grew at 9.2% (yoy) in ember, down from 10.4% (yoy) the month earlier. By component, growth of
The Economic Letter March 2018
 ASSOCIATION OF BANKS IN LEBANON Research & Statistics Department The Economic Letter March 2018 Summary: In the first quarter 2018, most real sector indicators retreated with regard to the corresponding
Economic UpdatE JUnE 2016
 Economic Update June Date of issue: 30 June Central Bank of Malta, Address Pjazza Kastilja Valletta VLT 1060 Malta Telephone (+356) 2550 0000 Fax (+356) 2550 2500 Website https://www.centralbankmalta.org
Major Highlights. Recent Economic Developments April/May Central Bank of Swaziland 1
 Major Highlights Annual consumer inflation increased to 7.0 per cent in April 2017 from 6.0 per cent in March 2017. Inflation rate (% y/y) 7.0 (Apr) Discount and prime lending rates remained unchanged
To be a World Class Modern Central Bank
 1 Monthly Economic Bulletin June 2018 Table of Contents SYMBOLS... 3 DEFINITIONS... 4 1. INFLATION... 6 2. MONEY, CREDIT AND INTEREST RATES... 10 3. REAL SECTOR INDICATORS... 13 4. BALANCE OF PAYMENTS
MONTHLY ECONOMIC INDICATORS
 MONTHLY ECONOMIC INDICATORS JULY Table of Contents 1. INFLATION... 2 2. MONEY, CREDIT AND INTEREST RATES... 6 3. REAL SECTOR INDICATORS... 9 4. BALANCE OF PAYMENT AND EXTERNAL SECTOR INDICATORS... 10 5.
Zambia s Economic Outlook
 Zambia s Economic Outlook F R A N C I S C H I P I M O D I R E C T O R E C O N O M I C S B A N K O F Z A M B I A Z A M B I A I N V E S T M E N T C O N F E R E N C E N O V E M B E R 4, 2 0 1 5 L O N D O
The Economic Letter January 2018
 ASSOCIATION OF BANKS IN LEBANON Research & Statistics Department The Economic Letter January 2018 Summary: In the first month of 2018, most real sector indicators retreated in relation to the preceding
1 RED July/August 2018 JULY/AUGUST 2018
 1 RED July/August 20 JULY/AUGUST 20 2 RED July/August 20 MAJOR HIGHLIGHTS The country s annual consumer inflation remained unchanged at 4.9 per cent in July 20 same as in June 20. Inflation rate (% y/y)
August 1, 2017 I Economics EXPECTATIONS FROM CREDIT POLICY: AUGUST 2017
 EXPECTATIONS FROM CREDIT POLICY: AUGUST 2017 August 1, 2017 I Economics The third bi-monthly monetary policy review for this fiscal year is to be announced by the RBI on 2nd August 2017. It will be sixth
The Economic Letter July 2018
 ASSOCIATION OF BANKS IN LEBANON Research & Statistics Department The Economic Letter July 2018 Summary: In July 2018, real sector indicators progressed in relation to the preceding month. Both imports
Major Economic Indicators
 Volume: 11/2015 Major Economic Indicators Monthly Update: November 2015 Major Economic Indicators Monetary Policy Department Bangladesh Bank Contents Page No. Executive summary.. 1-2 1. Monetary and credit
QUARTERLY ECONOMIC REVIEW (QER)
") QUARTERLY ECONOMIC REVIEW (QER) Volume 2 No 5 April - June 2018 OBJECTIVES OF THE CENTRAL BANK OF KENYA The principal objectives of the Central Bank of Kenya (CBK) as established in the CBK Act are: 1)
QUARTERLY ECONOMIC REVIEW (QER) Volume 2 No 5 April - June 2018 OBJECTIVES OF THE CENTRAL BANK OF KENYA The principal objectives of the Central Bank of Kenya (CBK) as established in the CBK Act are: 1)
MONETARY POLICY STATEMENT
 MONETARY POLICY STATEMENT September 2013 Designed & Printed @ KUENSEL Corporation Limited Royal Monetary Authority of Bhutan Royal Monetary Authority of Bhutan This Report has been prepared by the Royal
Broad Money and Its Affecting Factors
 Broad Money and Its Affecting Factors wa uary The growth of liquidity in the economy, or broad money (M2), decelerated in uary to 7.7% (yoy) from 8.9% (yoy) in ember. By component, slower growth of quasi-money
The Economic Letter November 2018
 ASSOCIATION OF BANKS IN LEBANON Research & Statistics Department The Summary: In November 2018, the majority of real sector indicators regressed in relation to the previous month. Imports and exports of
PRELIMINARY IMPACT OF GLOBAL CRISIS IN INDONESIA
 PRELIMINARY IMPACT OF GLOBAL CRISIS IN INDONESIA 1 Preliminary Impacts Up to January 2009, some economic indicators still showed strong results while others started to reflect impact at early stage GDP
The Economic Letter September 2018
 ASSOCIATION OF BANKS IN LEBANON Research & Statistics Department The Economic Letter September 2018 Summary: In the first three quarters of 2018, most real sector indicators retreated in relation to the
International Monetary Fund Washington, D.C.
 2005 International Monetary Fund September 2005 IMF Country Report No. 05/357 Brunei Darussalam: Statistical Appendix This Statistical Appendix paper for Brunei Darussalam was prepared by a staff team
Ministry of Finance Department of Economic Affairs Economic Division 4(8)/Ec. Dn. /2017 MONTHLY ECONOMIC REPORT OCTOBER 2017 *****
/Ec. Dn. /2017 MONTHLY ECONOMIC REPORT OCTOBER 2017 *****") Ministry of Finance Department of Economic Affairs Economic Division 4(8)/Ec. Dn. /2017 MONTHLY ECONOMIC REPORT OCTOBER 2017 ***** HIGHLIGHTS The growth rate of Gross Domestic Product (GDP) at constant
Ministry of Finance Department of Economic Affairs Economic Division 4(8)/Ec. Dn. /2017 MONTHLY ECONOMIC REPORT OCTOBER 2017 ***** HIGHLIGHTS The growth rate of Gross Domestic Product (GDP) at constant
(Narendra Jena) Economic Officer
 Economic Officer") Ministry of Finance Department of Economic Affairs Economic Division 4(3)/Ec. Dn. /2012 MONTHLY ECONOMIC REPORT DECEMBER 2016 ***** HIGHLIGHTS As per the first revised estimates of national income, consumption
Ministry of Finance Department of Economic Affairs Economic Division 4(3)/Ec. Dn. /2012 MONTHLY ECONOMIC REPORT DECEMBER 2016 ***** HIGHLIGHTS As per the first revised estimates of national income, consumption
CURRENT ECONOMIC CONDITIONS
 Presentation to the FIA CURRENT ECONOMIC CONDITIONS 5 October 2017 Global economic outlook Has improved Global Economy Consolidating Healthy Growth Trajectory Global growth (%) Source: 2017 July IMF World
MONTHLY ECONOMIC INDICATORS
 MONTHLY ECONOMIC INDICATORS April 1 Monthly Economic Bulletin April Table of Contents 1. INFLATION...3 2. MONEY, CREDIT AND INTEREST RATES...7 3. REAL SECTOR INDICATORS...10 4. BALANCE OF PAYMENTS AND
Nepal Rastra Bank Research Department
 Nepal Rastra Bank Research Department Current Macroeconomic and Financial Situation of Nepal Macroeconomic Outlook (Based on Three Months' Data of 2017/18) 1. Macroeconomic data available so far suggest
Economic Monthly ASEAN & India
 Economic Monthly ASEAN & India AKI FUKUCHI, SHOHEI TAKASE ECONOMIC RESEARCH OFFICE TOKYO YUMA TSUCHIYA, MAKIKO STOKES ECONOMIC RESEARCH OFFICE SINGAPORE 1 DECEMBER 1 (ORIGINAL JAPANESE VERSION RELEASED
Nepal Rastra Bank Research Department
 Nepal Rastra Bank Research Department Current Macroeconomic and Financial Situation of Nepal (Based on Six Months' Data of 2016/17) Macroeconomic Outlook 1. The current macroeconomic indicators show the
Economic Update 9/2016
 Economic Update 9/ Date of issue: 10 October Central Bank of Malta, Address Pjazza Kastilja Valletta VLT 1060 Malta Telephone (+356) 2550 0000 Fax (+356) 2550 2500 Website https://www.centralbankmalta.org
Launch of Commemorative Banknote
 The Royal Monetary Authority of Bhutan joins the Nation in offering our heartfelt felicitations to His Majesty the King and Her Majesty the Gyaltsuen on the birth of His Royal Highness Gyalsey Jigme Namgyel
Mauritius Economy Update January 2015
 January 19, 2015 Economics Mauritius Economy Update January 2015 Overview - Mauritian economy has been witnessing a persistent moderation in growth since 2010 due to weak economic activity in Euro Zone,
Major Economic Indicators: Monthly Update
 Volume 02/2018 February 2018 Major Economic Indicators: Monthly Update Monetary Policy Department BANGLADESH BANK Contents Page No. Executive summary 1-2 1. Monetary and credit developments 3 2. Reserve
Economic Monthly ASEAN & India
 Economic Monthly ASEAN & India AKI FUKUCHI ECONOMIC RESEARCH OFFICE TOKYO YUMA TSUCHIYA ECONOMIC RESEARCH OFFICE SINGAPORE APRIL 8 (ORIGINAL JAPANESE VERSION RELEASED ON APRIL 8) MUFG Bank, Ltd. A member
Current Macroeconomic Situation of Nepal
 Current Macroeconomic Situation of Nepal (Based on the Four Months' Data of FY 2012/13) Monetary Situation Money Supply 1. Broad money supply (M2) increased by 4.0 percent during the four months of the
Reserve Bank of Malawi. Monthly Economic Review
 Reserve Bank of Malawi Monthly Economic Review November 2018 Table of Contents 1.0 INTRODUCTION... 1 1.1 Gross Official Reserves... 1 1.2 Exchange Rates... 1 1.3 Money Supply... 1 1.4 Interest Rates...
The Economic Letter December 2010
 ASSOCIATION OF BANKS IN LEBANON Research & Statistics Department The Economic Letter December 2010 Summary: Despite the deceleration in the activities of a number of economic sectors in the fourth quarter,
1.0 BANK OF TANZANIA MONTHLY ECONOMIC REVIEW
 1.0 BANK OF TANZANIA MONTHLY ECONOMIC REVIEW April 2016 Contents 1.0 Inflation and Food Supply Situation... 1 1.1 Inflation Developments... 1 1.2 Food Supply Situation... 1 1.3 Prices of Food Crops...
Monthly Economic and Financial Developments February 2007
 Release Date: 3 April Monthly Economic and Financial Developments February In an effort to provide the public with more frequent information on its economic surveillance activities, the Central Bank has
The Economic Letter May 2018
 ASSOCIATION OF BANKS IN LEBANON Research & Statistics Department The Economic Letter May 2018 Summary: In May 2018, real sector indicators were mixed with reference to the preceding month. Imports of goods
Asia Bond Monitor November 2018
 7 December 8 Key Developments in Asian Local Currency Markets T he monetary board of the Bangko Sentral ng Pilipinas decided to keep its key policy rates steady during its final meeting for the year on
Major Economic Indicators: Monthly Update
 Volume 05/2018 May 2018 Major Economic Indicators: Monthly Update Monetary Policy Department BANGLADESH BANK Contents Page No. Executive summary 1-2 1. Monetary and credit developments 3 2. Reserve money
MONTHLY ECONOMIC INDICATORS
 MONTHLY ECONOMIC INDICATORS May 2018 1 Monthly Economic Bulletin May 2018 Table of Contents SYMBOLS... 3 DEFINITIONS... 4 1. INFLATION... 6 2. MONEY, CREDIT AND INTEREST RATES... 10 3. REAL SECTOR INDICATORS...
Nepal Rastra Bank Central Office. Current Macroeconomic Situation of Nepal
 Nepal Rastra Bank Central Office Current Macroeconomic Situation of Nepal (Based on the Annual Data of FY 2013/14) Real Sector Gross Domestic Product 1. According to the preliminary estimates of Central
Valentyn Povroznyuk, Radu Mihai Balan, Edilberto L. Segura
 September 214 GDP grew by 1.2% yoy in Q2 214. Industrial output growth was equal to 1.4% yoy in June 214. The consolidated budget deficit narrowed to.2% of GDP in January-July 214. Consumer inflation slightly
Markets at a Glance. India Q2 CY For Distributors use only
 Markets at a Glance India Q CY 17 For Distributors use only India Macro Economy Trade Inflation Monetary Sector Valuations Liquidity Macro Economy GDP Emerging vs Developed (In % YoY) Credit Growth vs
Public Debt Management
 Public Debt Management quarterly report JULY SEPTEMBER 2017 Government of India Ministry of finance Budget Division Department of economic affairs NOVEMBER 2017 www.finmin.nic.in I CONTENTS Section Page
KEY MONETARY AND FINANCIAL INDICATORS
 January 04, 2019 KEY MONETARY AND FINANCIAL INDICATORS Inflation Overall inflation increased marginally to 5.7 percent in December 2018 from 5.6 percent in November, but remained within target, mainly
Nepal Rastra Bank Research Department
 Nepal Rastra Bank Research Department Current Macroeconomic and Financial Situation of Nepal (Based on Three Months Data of 2018/19) Major Highlights Inflation remained 4.7 percent on y-o-y basis. Import
This Press Release is embargoed against publication, telecast or circulation on internet till 5.30 pm today i.e. 28th February
 . PRESS NOTE ON SECOND ADVANCE ESTIMATES OF NATIONAL INCOME 2017-18 AND QUARTERLY ESTIMATES OF GROSS DOMESTIC PRODUCT FOR THE THIRD QUARTER (Q3) OF 2017-18 CENTRAL STATISTICS OFFICE MINISTRY OF STATISTICS
MONETARY POLICY COMMITTEE STATEMENT FOR FIRST QUARTER Governor s Presentation to the Media. 16 th May, 2018
 1 MONETARY POLICY COMMITTEE STATEMENT FOR FIRST QUARTER 2018 Governor s Presentation to the Media 16 th May, 2018 INTRODUCTION 2 The presentation is structured as follows: 1. Decision of the Monetary Policy
CENTRAL BANK OF SEYCHELLES
 CENTRAL BANK OF SEYCHE LLES MONTHLY REVIEW May 2013 1.0 Key Economic Developments As observed in recent months, inflationary pressures continued to ease during May 2013. However, the month also experienced
This Press Release is embargoed against publication, telecast or circulation on internet till 5.30 pm today i.e. 31 st January, 2018.
 This Press Release is embargoed against publication, telecast or circulation on internet till 5.30 pm today i.e. 31 st January, 2018. PRESS NOTE ON FIRST REVISED ESTIMATES OF NATIONAL INCOME, CONSUMPTION
Business Cycle Index July 2010
 Business Cycle Index July 2010 Bureau of Trade and Economic Indices, Ministry of Commerce, Tel. 0 2507 5805, Fax. 0 2507 5806, www.price.moc.go.th Thailand economic still expansion. Medium-run Leading
Current Macroeconomic Situation
 Current Macroeconomic Situation (Based on the First Month's Data of 2007/08) Monetary Situation Money Supply 1 Broad money (M 2 ) grew by 0.7 percent in the first month of 2007/08 as against a decline
5 Domestic and External Debt
 flows in billion Rs FY11 FY12 FY13 FY14 FY15 FY16 FY17 percent of GDP 5 Domestic and External Debt 5.1 Overview Gross public debt-to-gdp ratio improved marginally to 67.2 percent by end-june 217 from 67.6
MONTHLY ECONOMIC INDICATORS
 To be a World Class Modern Central Bank MONTHLY ECONOMIC INDICATORS August 2018 1 Monthly Economic Bulletin August 2018 Table of Contents SYMBOLS... 3 DEFINITIONS... 4 1. INFLATION... 6 2. MONEY, CREDIT
Nepal Rastra Bank Research Department
 Nepal Rastra Bank Research Department Current Macroeconomic and Financial Situation of Nepal Macroeconomic Outlook (Based on Two Months' Data of 2017/18) 1. Notwithstanding the damage caused by flood to
Monthly Report PERFORMANCE OF THE ECONOMY JUNE 2018 MACROECONOMIC POLICY DEPARTMENT MINISTRY OF FINANCE, PLANNING AND ECONOMIC DEVELOPMENT
 Monthly Report PERFORMANCE OF THE ECONOMY JUNE 2018 MACROECONOMIC POLICY DEPARTMENT MINISTRY OF FINANCE, PLANNING AND ECONOMIC DEVELOPMENT www.finance.go.ug Table of Contents SUMMARY... 1 REAL SECTOR DEVELOPMENTS...
2017 FIRST QUARTER ECONOMIC REVIEW
 2017 FIRST QUARTER ECONOMIC REVIEW MAY 2017 0 P a g e Overview The performance of the economy in the first quarter of 2017 was on a positive trajectory with annual growth projected to be about 3.9 % from
QUARTERLY ECONOMIC REVIEW (QER)
") QUARTERLY ECONOMIC REVIEW (QER) Volume 3 No 3 July - September 2018 OBJECTIVES OF THE CENTRAL BANK OF KENYA The principal objectives of the Central Bank of Kenya (CBK) as established in the CBK Act are:
QUARTERLY ECONOMIC REVIEW (QER) Volume 3 No 3 July - September 2018 OBJECTIVES OF THE CENTRAL BANK OF KENYA The principal objectives of the Central Bank of Kenya (CBK) as established in the CBK Act are:
PERFORMANCE OF ECONOMY REPORT December 2017
 PERFORMANCE OF ECONOMY REPORT December 2017 MACROECONOMIC POLICY DEPARTMENT MINISTRY OF FINANCE PLANNING AND ECONOMIC DEVELOPMENT www.finance.go.ug TABLE OF CONTENTS LIST OF ACRONYMS... 3 HIGHLIGHTS...
Major Economic Indicators: Monthly Update
 Volume 12/2017 December 2017 Major Economic Indicators: Monthly Update Monetary Policy Department BANGLADESH BANK Contents Page No. Executive summary 1-2 1. Monetary and credit developments 3 2. Reserve
CONTENTS COMMENTARY CHARTS TABLES GLOSSARY. Section 1: Headline Inflation Section 2: Core Inflation
 COMMENTARY CONTENTS Section 1: Headline Inflation Section 2: Core Inflation CHARTS 1. National Rates of Inflation, January 2010 April 2013 2. Monthly Changes in the Cost-of-Living Index, January 2010 April
Statistical Release Gross Domestic Product Third Quarter 2012
 Statistical Release Gross Domestic Product Third Quarter 01 1.0 Economic performance Kenya s economy exped by.7 per cent in the third quarter of 01 compared.0 per cent growth recorded in the same quarter
To be a World Class Modern Central Bank
 1 Monthly Economic Bulletin Table of Contents 1. INFLATION... 2 2. MONEY, CREDIT AND INTEREST RATES... 6 3. REAL SECTOR INDICATOR... 9 4. BALANCE OF PAYMENTS AND EXTERNAL SECTOR INDICATORS... 10 5. DEVELOPMENTS
Asia Bond Monitor November 2018
 January 9 asianbondsonline.adb.org Key Developments in Asian Local Currency Markets L ast week, the Philippines raised USD. billion from the sale of -year global bonds priced at basis points above benchmark
Mauritius Economy Update October 2013
 October 28, 2013 Economics Mauritius Economy Update October 2013 Mauritius, a tropical island situated towards the south east coast of Africa comprises 9 districts Flacq, Grand port, Moka, Pamplemousses,
India. Key Indicators for Asia and the Pacific Item
 1 POPULATION a Total population as of 1 October (million) 1,019 1,040 1,056 1,072 1,089 1,106 1,122 1,138 1,154 1,170 1,186 1,220 1,235 1,251 1,267 1,283 1,299 1,316 Population density (persons/km 2 )
Nepal Rastra Bank Research Department
 Nepal Rastra Bank Research Department Current Macroeconomic and Financial Situation of Nepal (Based on Seven Months' Data of 2017/18) Macroeconomic Outlook 1. The available macroeconomic data of the first
SACU INFLATION REPORT. December 2017
 SACU INFLATION REPORT December 20 The content of this publication is intended for general information only. While precaution is taken to ensure the accuracy of information, the SACU Secretariat shall not
Major Economic Indicators: Monthly Update
 Volume 03/2018 March 2018 Major Economic Indicators: Monthly Update Monetary Policy Department BANGLADESH BANK Contents Page No. Executive summary 1-2 1. Monetary and credit developments 3 2. Reserve money
Indian Economy. Industrial production declined in Nov 2015 for the first time in last 13 months. Fig1: Industrial Output Growth from April 2014
 Indian Economy Industrial Production Industrial production declined in Nov 2015 for the first time in last 13 months Industrial growth dropped to negative in Nov 2015 after 12 successive months of increase,
Bhutan Economic Update
 April, 21 Bhutan Economic Update Economic Policy and Poverty, and Finance and Private Sector Team South Asia Region The World Bank Bhutan Economic Update 1 April 21 Summary Real economic growth exceeded
BANK OF TANZANIA. Monthly Economic Review
 BANK OF TANZANIA Monthly Economic Review February 2011 1 TABLE OF CONTENTS 1.0 Inflation Developments... 3 Food Supply Situation... 5 2.0 Monetary and Financial Markets Developments... 6 Money Supply and
KCB INVESTOR PRESENTATION Q317 GROUP FINANCIAL RESULTS NOVEMBER 2017 JOSHUA OIGARA GROUP CEO & MD LAWRENCE KIMATHI GROUP CFO
 KCB INVESTOR PRESENTATION Q317 GROUP FINANCIAL RESULTS NOVEMBER 2017 JOSHUA OIGARA GROUP CEO & MD LAWRENCE KIMATHI GROUP CFO Macro-Economic Highlights: Kenya GDP Anchored by Non-Agriculture GDP Growth
MONTHLY ECONOMIC REVIEW
 April 218 a BANK OF TANZANIA MONTHLY ECONOMIC REVIEW April 218 b April 218 April 218 i Contents 1. Inflation and Food Stocks... 1 1.1 Inflation Developments... 1 1.2 Food Stocks... 2 1.3 Prices of Food
Ministry of Finance Department of Economic Affairs Economic Division 4(3)/Ec. Dn. /2012 MONTHLY ECONOMIC REPORT NOVEMER 2016 ***** HIGHLIGHTS
/Ec. Dn. /2012 MONTHLY ECONOMIC REPORT NOVEMER 2016 ***** HIGHLIGHTS") Ministry of Finance Department of Economic Affairs Economic Division 4(3)/Ec. Dn. /2012 MONTHLY ECONOMIC REPORT NOVEMER 2016 ***** HIGHLIGHTS As per the estimates of Gross Domestic Product (GDP) for the
Ministry of Finance Department of Economic Affairs Economic Division 4(3)/Ec. Dn. /2012 MONTHLY ECONOMIC REPORT NOVEMER 2016 ***** HIGHLIGHTS As per the estimates of Gross Domestic Product (GDP) for the