The Local Government Workforce. Trends and Blips on the Radar
|
|
|
- Silas Cobb
- 5 years ago
- Views:
Transcription

1 The Local Workforce Trends and Blips on the Radar


2 2 Workforce Program SECTOR POSITIONING WORKFORCE PLANNING & DEVELOPMENT WORKFORCE AND DEMOGRAPHIC DATA


3 3 National Workforce Strategy Local government requires significant and diverse workforce to provide increasingly diverse and complex services Local government can be a more capable partner by future-proofing workforce and addressing key challenges: Attraction Retention Development


4 4 National Workforce Strategy Consistent approach to workforce planning and development Builds on and reinforces existing good practices 1 Workforce planning and development 2 Data collection 3 Skills development and capacity building
5 5 National Workforce Strategy Improving workforce planning and development Creating a contemporary workforce Promoting as a place-based employer of choice Investing in skills Retaining and attracting a diverse workforce Improving productivity and leveraging technology Maximising management and leadership Implementation and collaboration
6 National Profile of the Local Workforce
7 7 The First National Profile + Australian Local Workforce and Employment Census - Some Challenges Designed to support National Workforce Strategy Piloted with councils around Australia then launched November 2012 closed late January 2013 Poor representation from some jurisdictions - underscores importance of national approach Results compared with other sources to confirm accuracy (i.e. ABS, NSW Office of Local ) 232 metro, regional and rural councils, representing over 67,000, or a third of estimated total workforce

8 8 The First National Profile Combined ALGWE Census and other data: 1. ABS Census, place of work and usual residence 2. ABS Census, longitudinal database 3. ABS Survey of Employee Earnings and Hours 4. Electoral Commissions 5. Comparative performance information from State departments of local government One of our most downloaded publications
9 9


10 10 Major findings from 2011 Spatial distribution CoAG Public Sector Employment Targets Female Managers and Councillors Ageing Workforce 5% Place-based employment Attraction and Retention Amalgamations Engineering and Infrastructure
11 How the sector is shaping up in 2016
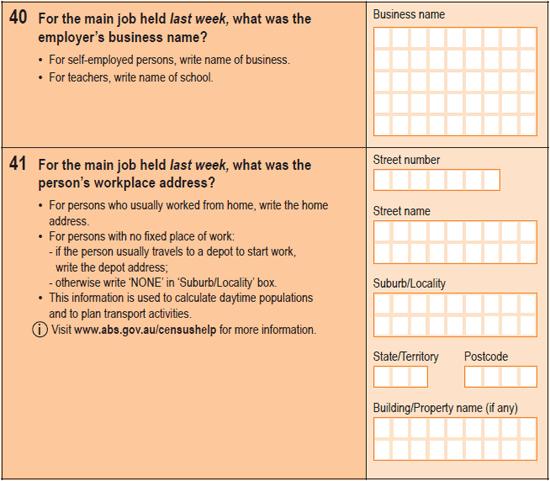
12 12 Data Sources 1. ABS Census, place of work and usual residence databases 2. ABS Census, longitudinal database (time series data) *Includes changes to number and boundaries of local governments following mergers and de-mergers in NSW and Qld between 2011 and 2016 Census underestimates the number of local government employees ABS Survey of Employee Earnings and Hours (Public Sector, 2017) Difference ABS Census, 2016 (POW) 189,500 Challenges for particular services (e.g.): 1. Libraries 2. Swimming pools 3. Contract outdoor staff 4. Regional airports -19% 153,308 (~80% of estimated sector workforce)
13 13 What is the local government sector? What is a government unit? Legal entities established by political processes that have legislative, judicial or executive authority over other institutional units within a given area: 1. Has funds of its own, raised by taxing other institutional units or received as transfers from other government units; 2. Has authority to disburse some, or all, of such funds in the pursuit of its policy objectives; and 3. Has authority to borrow funds on its own account All entities for which a local government can determine financial and operating policies governing the entity's strategic or long-term directions: 1. Financial corporations 2. agencies and departments 3. Non-financial corporations controlled by government 4. Notional institutional units controlled by government 5. Public financial and non-financial corporations E.g. Regional airports
14 14 Workforce size 148,585 SEE 192, ,308 SEE 189,500
15 15 Average council size The average urban and regional council workforce is larger in 2016 by 2016 Number of Number of local employees governments Average size Urban Regional Rural % Rural councils by 15% 2011 Number of Number of local employees governments Average size Urban Regional Rural
16 16 Average council size NUMBER OF EMPLOYEES NSW VIC QLD WA SA TAS NT Urban Regional Rural NUMBER OF COUNCILS Urban Regional Rural NUMBER OF EMPLOYEES NSW VIC QLD WA SA TAS NT Urban Regional Rural NUMBER OF COUNCILS Urban Regional Rural
17 17 Spatial distribution 100% 90% 80% 70% 60% 18% 34% 9% 29% 3% 20% 46% 35% 12% 10% 9% 9% 8% 22% 25% 26% 28% 31% 50% 33% 40% 30% 63% 78% 36% 62% 63% 69% 63% 61% 20% 48% 32% 10% 17% 0% Local State Commonwealth Agriculture, Forestry and Fishing Mining Manufacturing Construction Transport, Postal and Warehousing Education and TrainingHealth Care and Social Assistance Urban Regional Rural

18 18 Place-based employment 448 Number of councils where more than 50% of the workforce live locally 423 Number of councils where more than 50% of the workforce live locally

19 19 Ageing workforce 30% National workforce National workforce National workforce Local government workforce Local government workforce Local government workforce % 20% 15% % % % 15 to to to to to to to and over
20 20 Education 16% 14% 12% 10% 8% 6% 4% 2% 0% Doctoral Degree Level Master Degree Level Graduate Diploma Level Graduate Certificate Level Bachelor Degree Level Advanced Diploma and Associate Degree Level Diploma Level Certificate III & IV Level Certificate I & II Level 2016 Male 2016 Female 2011 Male 2011 Female Increasing Skill Level
21 21 Education 80% 70% 60% 50% 40% 30% 20% 10% 0% Doctoral Degree Level Master Degree Level Graduate Diploma Level Graduate Certificate Level Bachelor Degree Level Advanced Diploma and Associate Degree Level Diploma Level Certificate III & IV Level Certificate I & II Level 2016 Male 2016 Female 2011 Male 2011 Female Increasing Skill Level
22 22 Female Executives and Managers Local Workforce Total N % Male % Female % Change N change % Male % Female General Managers % 32% 8% 67 77% 24% Finance Managers % 43% 7% 67 63% 36% Policy and Planning Managers % 56% 6% 24 50% 50% Research and Development Managers % 42% 11% 27 68% 31% Construction Managers % 13% 4% 89 91% 10% Engineering Managers % 9% 4% 22 95% 5% Supply, Distribution and Procurement Managers % 31% 13% 29 79% 18% National Workforce Total N % Male % Female % Change N Change % Male % Female General Managers % 25% 2% % 23% Finance Managers % 46% 3% % 43% Policy and Planning Managers % 56% 3% % 54% Research and Development Managers % 46% 4% % 42% Construction Managers % 7% 1% % 6% Engineering Managers % 9% 1% % 8% Supply, Distribution and Procurement Managers % 22% 8% % 14%


23 23 Top 25 Occupations General Clerks 6529 Urban and Regional Planners 5108 Information Officers 4747 Contract, Program and Project Administrators 4386 Gardeners 4080 Truck Drivers 3706 Welfare Support Workers 3608 Aged and Disabled Carers 3484 Other Miscellaneous Labourers 3429 Inspectors and Regulatory Officers 3337 Civil Engineering Professionals 3298 Child Carers 3085 Other Specialist Managers 2978 Architectural, Building and Surveying Technicians 2804 Labourers 2695 Accounting Clerks 2483 Garden and Nursery Labourers 2348 Librarians 2307 Occupational and Environmental Health Professionals 2202 Earthmoving Plant Operators 2112 Library Assistants 2047 Personal Assistants 1926 Gallery, Library and Museum Technicians 1868 Accountants 1730 Building and Plumbing Labourers 1685 Librarians / Library Asst. Rubbish and recycling collectors Planners Paving and surface labourers
24 24 Indigenous employment 9% 8.54% 8% 7% 6% 5% 4% 3% 2% 1% 0% CoAG Target (2.6%) 2.45% 1.93% 2.07% 2.16% 2.13% 1.63% 6.13% 4.12% 2.13% 1.38% 1.57% Federal State Local Private Sector Despite changes to the CDEP, local government is still the only level of government that has met the CoAG target CDEP Non CDEP
25 25 Time series data identifies attraction and retention rates ABS Census Longitudinal Time series data National State/Territory Local National State/Territory Local Private sector Total Private sector Total
26 26 Gains, ABS Census Longitudinal Time series data National State/Territory Local National State/Territory Local Private sector Total Private sector Total
27 27 Losses, ABS Census Longitudinal Time series data National State/Territory Local National State/Territory Local Private sector Total Private sector Total
28 28 Retention, ABS Census Longitudinal Timeseries data National State/Territory Local National State/Territory Local Private sector Total Private sector Total


 38%")
29 29 Attraction and retention Employees retained Employees lost Employees gained Federal State Federal 3% State 15% Private Sector 82% Federal 3% State 11% Private Sector 84% 30% (N=41,249) 38% (N=58,480) Local
30 Contact us UTS Institute for Public Policy and Governance UTS Centre for Local University of Technology Sydney 15 Broadway, Ultimo, NSW ippg.uts.edu.au
Employment Outlook for. Public Administration and Safety
 Employment Outlook for Contents INTRODUCTION... 3 EMPLOYMENT GROWTH... 4 EMPLOYMENT PROSPECTS... 5 VACANCY TRENDS... 8 WORKFORCE AGEING... 11 EMPLOYMENT BY GENDER AND FULL-TIME/PART-TIME... 13 HOURS WORKED...
Employment Outlook for. Administration and Support Services
 Employment Outlook for Administration and Support Services Contents INTRODUCTION... 3 EMPLOYMENT GROWTH... 4 EMPLOYMENT PROSPECTS... 6 VACANCY TRENDS... 9 WORKFORCE AGEING... 11 EMPLOYMENT BY GENDER AND
THE IMPORTANCE OF PRODUCTIVITY GROWTH AS A DRIVER OF VICTORIA S ECONOMY
 THE IMPORTANCE OF PRODUCTIVITY GROWTH AS A DRIVER OF VICTORIA S ECONOMY PRESENTATION TO MEMBERS OF THE PARLIAMENT OF VICTORIA MELBOURNE 24 TH NOVEMBER 2016 Victoria s economy is picking up after under-performing
Local Government workforce
 STATISTICS FOR PEOPLE Local Government workforce Lisa Conolly Strategic Partnership Manager, South Australia My job title suggests management = Managerial Occupation I wrote statistician in my Census form
The Kangaroo Island (DC) Region. Workforce Wizard Region Report
 Region. Workforce Wizard Region Report") Workforce Wizard Region Report Table of Contents Executive Summary 3 Population and Social Characteristics 4 Current Population 4 Age Groups 4 Key Populations 5 Aboriginal Australians 6 Disability and
Workforce Wizard Region Report Table of Contents Executive Summary 3 Population and Social Characteristics 4 Current Population 4 Age Groups 4 Key Populations 5 Aboriginal Australians 6 Disability and
TOURISM AND THE AUSTRALIAN ECONOMY STATE & TERRITORY VISITOR ECONOMY IMPACTS EDITION
 TOURISM AND THE AUSTRALIAN ECONOMY STATE & TERRITORY VISITOR ECONOMY IMPACTS 2012-13 EDITION For further information, please contact: Philip Partalis Manager, Research & Policy (02) 9240 2004 ppartalis@ttf.org.au
WHAT THE DATA IS TELLING US
 WHAT THE DATA IS TELLING US The Connect Effect 2014 Series 13 March 2014 Assoc Prof John Spoehr Dr Ann-Louise Hordacre Funded by the Australian Government Suburban Jobs Program Economic growth rates 7%
Research (Level 6, FBE Building, 111 Barry St), University of Melbourne, Victoria, 3010 Australia. [
, University of Melbourne, Victoria, 3010 Australia. [") Original article Scand J Work Environ Health. 2016;42(3):201 208. doi:10.5271/sjweh.3553 Sickness absence and mental health: evidence from a nationally representative longitudinal survey 1 by Mark Wooden,
Original article Scand J Work Environ Health. 2016;42(3):201 208. doi:10.5271/sjweh.3553 Sickness absence and mental health: evidence from a nationally representative longitudinal survey 1 by Mark Wooden,
The Fleurieu & Kangaroo Island (State Govt) Region. Workforce Wizard Region Report
 Region. Workforce Wizard Region Report") The Fleurieu & Kangaroo Island (State Govt) Region Workforce Wizard Region Report Table of Contents Executive Summary 3 Population and Social Characteristics 4 Current Population 4 Age Groups 4 Key Populations
The Fleurieu & Kangaroo Island (State Govt) Region Workforce Wizard Region Report Table of Contents Executive Summary 3 Population and Social Characteristics 4 Current Population 4 Age Groups 4 Key Populations
Prepared and presented by Saul Eslake
 Prepared and presented by Saul Eslake First the good news Tasmania s economy is bigger than we knew Tasmania s gross state product before & after 6 55 5 45 $bn (current prices) 216-17 estimates 215-16
Australia s productivity performance
 Australia s productivity performance Seminar Presentation to Australian Treasury Canberra, 22 nd September 2010 Saul Eslake Grattan Institute Australia s productivity growth has slowed over the last five
Employment Outlook to November 2019
 Employment Outlook to November 2019 Based on the Department of Employment s 2015 employment projections Table of Contents Table of Contents... 1 Introduction... 2 Projected employment growth by industry...
An analysis of Victoria s labour productivity performance
 An analysis of Victoria s labour productivity performance Presentation to a forum hosted by Victorian Department of Innovation, Industry and Regional Development Melbourne 14 th April Saul Eslake Program
NEW ZEALAND PATHOLOGIST WORKFORCE STUDY 2018
 New Zealand Pathologist Workforce Study 2018 NEW ZEALAND PATHOLOGIST WORKFORCE STUDY 2018 WORKFORCE PROFILE AND TRENDS The New Zealand Pathologist workforce has shown significant growth between 2011 and
Superannuation balances of the self-employed
 Superannuation balances of the self-employed March 2018 Andrew Craston, Senior Research Advisor ASFA Research and Resource Centre The Association of Superannuation Funds of Australia Limited (ASFA) PO
NATIONAL RMBS TRUST
 The Manager confirms NAB s continued retention of an amount equal to at least 5% of the aggregate principal balance of securitised exposures Transaction Details as at 20 March 2013 Issuance Date 13-Dec-12
American Community Survey 5-Year Estimates
 S2401 OCCUPATION BY SEX AND MEDIAN EARNINGS IN THE PAST 12 MONTHS (IN 2012 INFLATION- ADJUSTED DOLLARS) FOR THE CIVILIAN EMPLOYED POPULATION 16 YEARS AND OVER 2008-2012 American Community Survey 5-Year
2016 SKILLS SURVEY RESULTS
 SKILLS SURVEY RESULTS TABLE OF CONTENTS ABOUT CONSULT AUSTRALIA INTRODUCTION RESULTS 1 What is the current skills situation at your firm? 3 2 What actions/strategies will you take in the next 12 months?
The Victorian economy and government financial position
 The n economy and government financial position Presentation to n Council of Social Service 26 Congress Saul Eslake Chief Economist ANZ RACV Centre Melbourne th August 26 4 th www.anz.com/go/economics
The Limestone Coast (State Govt) Region. Workforce Wizard Region Report
 Region. Workforce Wizard Region Report") The Limestone Coast (State Govt) Region Workforce Wizard Region Report Table of Contents Executive Summary 3 Population and Social Characteristics 4 Current Population 4 Age Groups 4 Key Populations 5
The Limestone Coast (State Govt) Region Workforce Wizard Region Report Table of Contents Executive Summary 3 Population and Social Characteristics 4 Current Population 4 Age Groups 4 Key Populations 5
56+44+I I I I I. LIFE IN AUSTRALIA 2017 Ipsos annual study of community values and liveability
 LIFE IN AUSTRALIA 2017 Mark Davis Managing mark.davis@ipsos.com (03) 9946 0826 In November 2017 we asked 10,188 Australians to select the top five attributes that they believe make place to live. We also
AusIMM Professional Employment Survey August, 2016
 AusIMM Professional Employment Survey 2016 August, 2016 1 Respondent demographics 2 Distribution of all respondents Australia 0.9% 1.5% 2.0% China Indonesia New Zealand 13.3% 0.5% Rest of World 81.8% Papua
Scenic Rim Regional Council Community Sustainability Indicators 2009
 Scenic Rim Regional Council Community Sustainability Indicators 2009 Draft July 2009 This report was commissioned by Scenic Rim Regional Council and the Queensland Government through the Boonah Rural Futures
SALARY AND CLASSIFICATION SCHEDULE
 SALARY AND CLASSIFICATION SCHEDULE MANAGEMENT MANAGEMENT Classifications Position Title Table Range Accountant Accounting Manager Account Technician, Senior Administrative Assistant Administrative Coordinator
An ageing workforce in Greater Western Sydney
 An ageing workforce in Greater Western Sydney Author: Barbara Beard WESTIR LTD May 2017 WESTIR Limited A.B.N 65 003 487 965 A.C.N. 003 487 965 This work is Copyright. Apart from use permitted under the
Review of Claims Trends for Liability Insurance in Australia
 Review of Claims Trends for Liability Insurance in Australia Prepared by Kundan Misra, Maggie Liu and Clement Peng Presented to the Actuaries Institute General Insurance Seminar 17 18 November 2014 Sydney
High risk worker cohorts
 MONASH MEDICINE, NURSING & HEALTH SCIENCES High risk worker cohorts Dr Shannon Gray Post-doctoral Research Fellow, Insurance Work and Health Group, Faculty of Medicine Nursing and Health Sciences, Monash
Equity and superannuation the real issues
 Equity and superannuation the real issues Ross Clare Director of Research SEPTEMBER 2012 The Association of Superannuation Funds of Australia Limited EXECUTIVE SUMMARY The real equity challenge Much of
2014 Law Society National Profile
 2014 Law Society National Profile Final Report APRIL 2015 Prepared by Urbis for The Law Society of New South Wales xdisclai mer x STAFF RESPONSIBLE FOR THIS REPORT WERE: Director Senior Consultants Consultant
Usual Resident Population Count , , ,253. Usual Resident Population Change , % ,
 Demographic Profile for Auckland Council Kumeu Subdivision For Census Usually Resident Population Count and Households, Families and Dwellings Counts Characteristics by Area of Usual Residence Source:
Balancing budgets in difficult times. John Daley Urbis, Brisbane 4 February 2014
 Balancing budgets in difficult times John Daley Urbis, Brisbane 4 February 214 Overview Australian government budgets are in trouble The Commonwealth has had a structural deficit for over 7 years Spending
RAMS First Home Buyers Pulse Check Survey 2013
 RAMS First Home Buyers Pulse Check Survey 2013 Australian attitudes and behaviours towards buying their first home August 2013 Strictly Embargoed: 12:01am AEST, 23 August 2013 Contents Highlights.....3
SWARTLAND SPATIAL DEVELOPMENT FRAMEWORK ADDENDUM F
 SWARTLAND SPATIAL DEVELOPMENT FRAMEWORK ADDENDUM F DEMOGRAPHIC PROFILE 2011 Census APRIL 2014 By CK Rumboll and Partners 1 1. Introduction Swartland Municipality is located on the north western boundary
Superannuation account balances by age and gender
 Superannuation account balances by age and gender October 2017 Ross Clare, Director of Research ASFA Research and Resource Centre The Association of Superannuation Funds of Australia Limited (ASFA) PO
SELECTED ECONOMIC CHARACTERISTICS American Community Survey 5-Year Estimates
 DP03 SELECTED ECONOMIC CHARACTERISTICS 2008-2012 American Community Survey 5-Year Estimates Supporting documentation on code lists, subject definitions, data accuracy, and statistical testing can be found
Eurobodalla Area Profile
 1 Eurobodalla Area Profile Population: 38,400 persons (2016 population) Growth Rate: 3.77% (2011-2016) 0.46% average annual growth Key Industry: Tourism, Retail, Health & Community Services (incl. Aged
ELECTION FORUM. Sydney, 7 June 2016
 ELECTION FORUM Sydney, 7 June 2016 A Campaign of 5 Reforms to address housing affordability, generate new affordable housing and halve homelessness A National Housing Strategy to deliver: 1. Dedicated
LATE PAYMENTS. days late. days late. days late. days late IN AUSTRALIA. Big Business in the slow lane
 Big Business in the slow lane LATE PAYMENTS IN AUSTRALIA Dun & Bradstreet 4th Quarter Analysis 2016 Late Payment times rose during the fourth quarter of 2016, marking a fitting end to a year which saw
Labour Force. 46 powellriver.info
 Labour Force 46 powellriver.info General Information The labour force represents the total number of Powell River residents who are employed. Compared to British Columbia as a whole, the Powell River economy
Ageing and jobs in Adelaide - North
 Ageing and jobs in Adelaide - North Given the considerable movement of labour and employment within and around regions, the City of Playford and Adelaide - North labour markets and policies are inextricably
ANZ/PROPERTY COUNCIL SURVEY CHART BOOK
 218 For further information please contact Property Council Research P 2 933 19 F 2 933 1978 E research@propertycouncil.com.au W www.propertycouncil.com.au ANZ/PROPERTY COUNCIL SURVEY CHART BOOK SEP QTR
Estimating Internet Access for Welfare Recipients in Australia
 3 Estimating Internet Access for Welfare Recipients in Australia Anne Daly School of Business and Government, University of Canberra Canberra ACT 2601, Australia E-mail: anne.daly@canberra.edu.au Rachel
Government health expenditure and tax revenue
 Health Expenditure Government health expenditure and tax revenue 21 16 $ The Australian Published May 218 Government spent 27.% of taxation revenue on health in 21 16 This report looks at how health expenditure
For personal use only. Veris. Simon THOMAS Chief Executive Officer. 6 th December Slide 1
 Veris Simon THOMAS Chief Executive Officer 6 th December 2016 Slide 1 Introduction Business Veris is the only ASX listed company (VRS) that is undergoing a growth strategy centred on consolidation of the
Title. Purpose. Background. Scope. Disclaimer. Definitions and Supporting Information
 Title Purpose Background Driving a participant - carer or funders motor vehicle while delivering a community support or service This guideline is to assist: Service providers, support workers, Participants,
ANZ/PROPERTY COUNCIL SURVEY CHART BOOK
 218 For further information please contact Property Council Research P 2 933 19 F 2 933 1978 E research@propertycouncil.com.au W www.propertycouncil.com.au ANZ/PROPERTY COUNCIL SURVEY CHART BOOK JUN QTR
IMPACT OF THE RESOURCE BOOM ON THE ECONOMIC MELBOURNE
 IMPACT OF THE RESOURCE BOOM ON THE ECONOMIC GEOGRAPHY OF MELBOURNE Dr Bruce Rasmussen and Kathleen Hurley Presentation to Conference The Resources Boom: Understanding National and Regional Implications
Fair tax and welfare for older workers. Older Australians at work summit John Daley Grattan Institute 24 February 2015
 Fair tax and welfare for older workers Older Australians at work summit John Daley Grattan Institute 24 February 215 Fair tax and welfare for older workers Government budgets are unsustainable: spending
NATIONAL PROFILE OF SOLICITORS 2016 REPORT
 NATIONAL PROFILE OF SOLICITORS 2016 REPORT 24 AUGUST 2017 PREPARED FOR THE LAW SOCIETY OF NEW SOUTH WALES STAFF RESPONSIBLE FOR THIS REPORT WERE: Director Senior Consultant Graphic Designers Project Code
Independent Assurance Practitioners Compliance Report to the Members of the Australian Curriculum Assessment and Reporting Authority ( ACARA )
") Deloitte Touche Tohmatsu ABN 74 490 121 060 Grosvenor Place 225 George Street Sydney NSW 2000 Tel: +61 2 9322 7000 www.deloitte.com.au Independent Assurance Practitioners Compliance Report to the Members
Deloitte Touche Tohmatsu ABN 74 490 121 060 Grosvenor Place 225 George Street Sydney NSW 2000 Tel: +61 2 9322 7000 www.deloitte.com.au Independent Assurance Practitioners Compliance Report to the Members
Wages and prices at a glance. Wage Price Index (WPI) September - 0.7% 3.6%
 September - 0.7% 3.6%") Wages Report Issue 1, November 2011 In late 2010 and early this year, employer groups began to claim that Australia was on the verge of an unsustainable wages breakout, with real wages rising faster than
Wages Report Issue 1, November 2011 In late 2010 and early this year, employer groups began to claim that Australia was on the verge of an unsustainable wages breakout, with real wages rising faster than
THE TASMANIAN GOVERNMENT S BUDGET
 THE TASMANIAN GOVERNMENT S BUDGET PRESENTATION TO A COMMUNITY ORGANIZATIONS MASTER CLASS SPONSORED BY THE AUSTRALIA INSTITUTE (TASMANIA) HOTEL GRAND CHANCELLOR HOBART 12 TH JUNE 218 C O R I N N A E C O
For personal use only
 Affinity Education Group (ASX:AFJ) Morgans Conference 10 October 2014 Disclaimer This presentation contains general information in summary form which is current as at 10 October 2014. It presents financial
2017 ANNUAL GENERAL MEETING. Chief Executive Officer Operational Presentation SILVER CHEF LIMITED
 2017 ANNUAL GENERAL MEETING Chief Executive Officer Operational Presentation SILVER CHEF LIMITED 1986 2005 2008 2011 2013 2016 Silver Chef established by Non-Executive Chairman Allan English Silver Chef
Minnesota Energy Industry
 Energy Industry Jobs Q3 2000 Q3 2001 Q3 2002 Q3 2003 Q3 2004 Q3 2005 Q3 2006 Q3 2007 Q3 2008 Q3 2009 Q3 2010 Q3 2011 Q3 Q3 Q3 Q3 Q3 2016 Minnesota Energy Consortium April 13, 2017 Cameron Macht DEED Labor
Financial Analysis: Dungog Shire Council Port Stephens Council
 Financial Analysis: Dungog Shire Port Stephens JUNE 2016 COUNCIL PROFILE An overview of the current performance of the two existing councils and the projected performance of the new proposed entity is
Retirement Intentions 2006
 Survey of Western Australian public sector employees 45 years and older Department of the Premier and Cabinet Government of Western Australia Survey of Western Australian public sector employees 45 years
Finding New Niches SMSFs
 Finding New Niches SMSFs Graeme Colley Director of Education and Professional Standards 1. About SPAA 2. How SMSFs are currently distributed? 3. Why are the main reasons why people set up SMSFs? 4. What
A Collection of Statistical Data for Huron County and its Census Subdivisions
 A Collection of Statistical Data for and its Census Subdivisions The following information is a collection of statistical data describing key elements (language, labour market, income levels, migration
A SUMMARY OF ECONOMIC CONDITIONS IN HENRYETTA AND OKMULGEE COUNTY, OKLAHOMA 2009
 AE-09127 A SUMMARY OF ECONOMIC CONDITIONS IN HENRYETTA AND OKMULGEE COUNTY, OKLAHOMA 2009 Doug Maxey, Okmulgee County Extension Director, Okmulgee (918) 756-1958 Jack Frye, Community Development Specialist,
Financial Analysis: Jerilderie Shire Council Murrumbidgee Shire Council
 Financial Analysis: Jerilderie Shire Council Murrumbidgee Shire Council MARCH 2016 COUNCIL PROFILE An overview of the current performance of the two existing councils and the projected performance of the
Developments. Dust Diseases
 November 2017 Dust Diseases Developments Dust Diseases Developments brings you the latest happenings in Australian asbestos and dust diseases compensation. You may have seen it before as Asbestos News.
TASMANIA S ECONOMY PAST, PRESENT AND FUTURE
 TASMANIA S ECONOMY PAST, PRESENT AND FUTURE PRESENTATION TO THE TASMANIAN ECONOMIC FORUM HOSTED BY THE ECONOMIC SOCIETY OF AUSTRALIA (TASMANIA BRANCH) HOBART FUNCTION AND CONFERENCE CENTRE 1 ST MARCH 18
Financial Analysis: Corowa Shire Council Urana Shire Council
 Financial Analysis: Corowa Shire Council Urana Shire Council MARCH 2016 COUNCIL PROFILE An overview of the current performance of the two existing councils and the projected performance of the new proposed
Terrorism Insurance Act 2003 Update
 Terrorism Insurance Act 2003 Update September October 2003 2003 W As you would be aware, following the events of September 11, most commercial insurers in Australia excluded terrorism-related claims, leaving
Presented by Simon Owen 20 September Ingenia Lifestyle South West Rocks INGENIA COMMUNITIES GROUP ASX CEO SESSIONS
 Presented by Simon Owen 20 September 2016 Ingenia Lifestyle South West Rocks INGENIA COMMUNITIES GROUP ASX CEO SESSIONS Page 2 Business Overview Creating Australia s best lifestyle communities Over 5,000
A SUMMARY OF ECONOMIC CONDITIONS IN SEMINOLE, WEWOKA AND SEMINOLE COUNTY, OKLAHOMA 2011
 AE-11006 A SUMMARY OF ECONOMIC CONDITIONS IN SEMINOLE, WEWOKA AND SEMINOLE COUNTY, OKLAHOMA 2011 Dave Shideler, Extension Economist, OSU, Stillwater (405) 744-6170 Lara Brooks, Assistant Extension Specialist,
American Community Survey 5-Year Estimates
 DP03 SELECTED ECONOMIC CHARACTERISTICS 2013-2017 American Community Survey 5-Year Estimates Supporting documentation on code lists, subject definitions, data accuracy, and statistical testing can be found
DRAFT NATIONAL ASSESSMENT FRAMEWORK for Local Government Asset Management and Financial Planning IMPLEMENTATION DISCUSSION PAPER
 L.M. Patterson Program Coordinator ACELG May 2011 This page intentionally blank Acknowledgement: This discussion paper has been prepared as an outcome of collaboration between the Municipal Association
Tell us what you think. Provide feedback to help make American Community Survey data more useful for you.
 DP03 SELECTED ECONOMIC CHARACTERISTICS 2016 American Community Survey 1-Year Estimates Supporting documentation on code lists, subject definitions, data accuracy, and statistical testing can be found on
Monthly Covered Bond Report Date: 26/11/2015 Determination Date: 6/11/2015 Distribution Date: 6/11/2015. Stable. Stable
 Monthly Covered Bond Report Date: 26/11/2015 Determination Date: 6/11/2015 Distribution Date: 6/11/2015 Parties Issuer Macquarie Bank Limited Servicer Macquarie Securitisation Limited Covered Bond Guarantor
Findings of the 2018 HILDA Statistical Report
 RESEARCH PAPER SERIES, 2018 19 31 JULY 2018 ISSN 2203-5249 Findings of the 2018 HILDA Statistical Report Geoff Gilfillan Statistics and Mapping Introduction The results of the 2018 Household, Income and
FP Turbo Series Trust as at 30 April 2015
 Portfolio Summary Portfolio size ($) $198,492,343 Number of contracts 6,500 Number of obligors 953 Weighted average yield (% p.a.) 11.46% Average contract balance (current) ($) $30,537 Maximum contract
7.3% 6265 Trades Non-trades
 Apprentices and trainees 2017 - June quarter WESTERN AUSTRALIA 35 330 In training as at 30 June 2017-9.0% from June 2016 2.6% of workers were employed as an apprentice or trainee 7.3% of employed workers
Financial information 2017 $
 Australian vocational education and training statistics Financial information 2017 $ National Centre for Vocational Education Research Highlights This publication provides financial information on the
Public Infrastructure Spending
 kpmg Public Infrastructure Spending The Australia Institute Conference 17 October 2018 Show me the money Government has a crucial role in providing and maintaining public good infrastructure in society
Overview of the COMPARE Project
 MONASH MEDICINE, NURSING & HEALTH SCIENCES Overview of the COMPARE Project Professor Alex Collie Director, Insurance Work and Health Group, Faculty of Medicine Nursing and Health Sciences, Monash University
American Community Survey 5-Year Estimates
 DP03 SELECTED ECONOMIC CHARACTERISTICS 2012-2016 American Community Survey 5-Year Estimates Supporting documentation on code lists, subject definitions, data accuracy, and statistical testing can be found
American Community Survey 5-Year Estimates
 DP03 SELECTED ECONOMIC CHARACTERISTICS 2012-2016 American Community Survey 5-Year Estimates Supporting documentation on code lists, subject definitions, data accuracy, and statistical testing can be found
American Community Survey 5-Year Estimates
 DP03 SELECTED ECONOMIC CHARACTERISTICS 2012-2016 American Community Survey 5-Year Estimates Supporting documentation on code lists, subject definitions, data accuracy, and statistical testing can be found
American Community Survey 5-Year Estimates
 DP03 SELECTED ECONOMIC CHARACTERISTICS 2012-2016 American Community Survey 5-Year Estimates Supporting documentation on code lists, subject definitions, data accuracy, and statistical testing can be found
American Community Survey 5-Year Estimates
 DP03 SELECTED ECONOMIC CHARACTERISTICS 2012-2016 American Community Survey 5-Year Estimates Supporting documentation on code lists, subject definitions, data accuracy, and statistical testing can be found
American Community Survey 5-Year Estimates
 DP03 SELECTED ECONOMIC CHARACTERISTICS 2012-2016 American Community Survey 5-Year Estimates Supporting documentation on code lists, subject definitions, data accuracy, and statistical testing can be found
American Community Survey 5-Year Estimates
 DP03 SELECTED ECONOMIC CHARACTERISTICS 2012-2016 American Community Survey 5-Year Estimates Supporting documentation on code lists, subject definitions, data accuracy, and statistical testing can be found
American Community Survey 5-Year Estimates
 DP03 SELECTED ECONOMIC CHARACTERISTICS 2012-2016 American Community Survey 5-Year Estimates Supporting documentation on code lists, subject definitions, data accuracy, and statistical testing can be found
American Community Survey 5-Year Estimates
 DP03 SELECTED ECONOMIC CHARACTERISTICS 2012-2016 American Community Survey 5-Year Estimates Supporting documentation on code lists, subject definitions, data accuracy, and statistical testing can be found
American Community Survey 5-Year Estimates
 DP03 SELECTED ECONOMIC CHARACTERISTICS 2012-2016 American Community Survey 5-Year Estimates Supporting documentation on code lists, subject definitions, data accuracy, and statistical testing can be found
American Community Survey 5-Year Estimates
 DP03 SELECTED ECONOMIC CHARACTERISTICS 2012-2016 American Community Survey 5-Year Estimates Supporting documentation on code lists, subject definitions, data accuracy, and statistical testing can be found
American Community Survey 5-Year Estimates
 DP03 SELECTED ECONOMIC CHARACTERISTICS 2012-2016 American Community Survey 5-Year Estimates Supporting documentation on code lists, subject definitions, data accuracy, and statistical testing can be found
American Community Survey 5-Year Estimates
 DP03 SELECTED ECONOMIC CHARACTERISTICS 2012-2016 American Community Survey 5-Year Estimates Supporting documentation on code lists, subject definitions, data accuracy, and statistical testing can be found
American Community Survey 5-Year Estimates
 DP03 SELECTED ECONOMIC CHARACTERISTICS 2012-2016 American Community Survey 5-Year Estimates Supporting documentation on code lists, subject definitions, data accuracy, and statistical testing can be found
American Community Survey 5-Year Estimates
 DP03 SELECTED ECONOMIC CHARACTERISTICS 2012-2016 American Community Survey 5-Year Estimates Supporting documentation on code lists, subject definitions, data accuracy, and statistical testing can be found
American Community Survey 5-Year Estimates
 DP03 SELECTED ECONOMIC CHARACTERISTICS 2012-2016 American Community Survey 5-Year Estimates Supporting documentation on code lists, subject definitions, data accuracy, and statistical testing can be found
American Community Survey 5-Year Estimates
 DP03 SELECTED ECONOMIC CHARACTERISTICS 2012-2016 American Community Survey 5-Year Estimates Supporting documentation on code lists, subject definitions, data accuracy, and statistical testing can be found
American Community Survey 5-Year Estimates
 DP03 SELECTED ECONOMIC CHARACTERISTICS 2012-2016 American Community Survey 5-Year Estimates Supporting documentation on code lists, subject definitions, data accuracy, and statistical testing can be found
American Community Survey 5-Year Estimates
 DP03 SELECTED ECONOMIC CHARACTERISTICS 2012-2016 American Community Survey 5-Year Estimates Supporting documentation on code lists, subject definitions, data accuracy, and statistical testing can be found
American Community Survey 5-Year Estimates
 DP03 SELECTED ECONOMIC CHARACTERISTICS 2012-2016 American Community Survey 5-Year Estimates Supporting documentation on code lists, subject definitions, data accuracy, and statistical testing can be found
American Community Survey 5-Year Estimates
 DP03 SELECTED ECONOMIC CHARACTERISTICS 2012-2016 American Community Survey 5-Year Estimates Supporting documentation on code lists, subject definitions, data accuracy, and statistical testing can be found
American Community Survey 5-Year Estimates
 DP03 SELECTED ECONOMIC CHARACTERISTICS 2012-2016 American Community Survey 5-Year Estimates Supporting documentation on code lists, subject definitions, data accuracy, and statistical testing can be found
American Community Survey 5-Year Estimates
 DP03 SELECTED ECONOMIC CHARACTERISTICS 2012-2016 American Community Survey 5-Year Estimates Supporting documentation on code lists, subject definitions, data accuracy, and statistical testing can be found