Multicollinearity of Technical Indicators. Dr. Rajeev Shukla Investrade group, Indore
|
|
|
- Clyde Turner
- 6 years ago
- Views:
Transcription
1 Multicollinearity of Technical Indicators Dr. Rajeev Shukla Investrade group, Indore
2 All my best thoughts were stolen by the ancients. Ralph Waldo E erso Originality is nothing but judicious imitation. The most original writers borrowed one from another. Voltaire
3 Pure price systems are close enough to the North Pole that any departure tends to bring you farther south. - William Eckhardt

4 mul ti col lin ear i ty noun \"+kəˌlinēˈarə tē, -kä-\??? The existence of such a high degree of correlation between supposedly independent variables being used to estimate a dependent variable that the contribution of each independent variable to variation in the dependent variable cannot be determined.
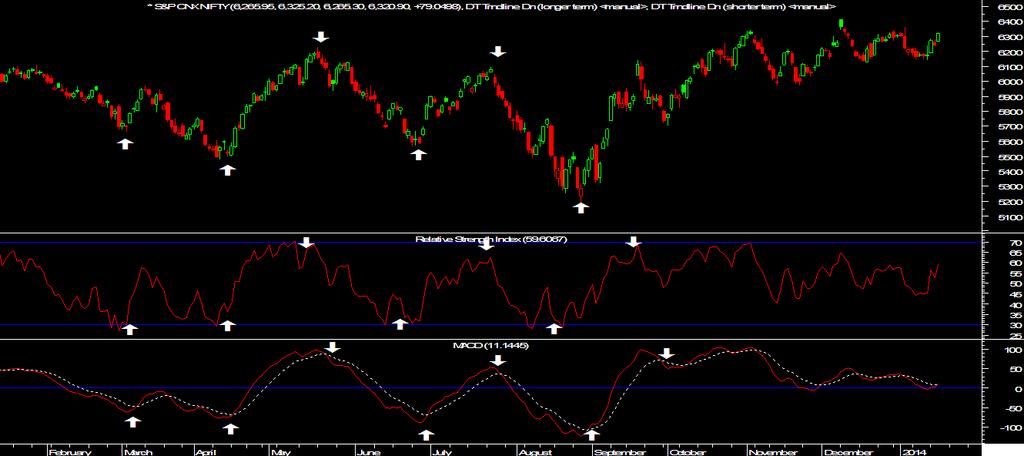
5 John Bollinger "A cardinal rule for the successful use of technical analysis requires avoiding multicollinearity amid indicators. Multicollinearity is simply the multiple counting of the same information. The use of four different indicators all derived from the same series of closing prices to confirm each other is a perfect example."
6

7

8
9 Problems with multicollinearity In some sense, the collinear variables contain the same information about the dependent variable. If nominally "different" measures actually quantify the same phenomenon then they are redundant. A principal danger of such data redundancy is that of over-fitting in regression analysis models.

10

11
12 What indicators to choose? collection of Technical indicators for trading needs to be simplified and made clear.
13 Types of indicators (Source: Metastock) Trend indicators Volatility indicators Momentum indicators Cycle indicators Market strength indicators Support and resistance indicators (Few indicators may fall in more than one category.)
14 Trend Indicators (Source: Metastock) Indicator Aroon Commodity Selection Index DEMA Directional Movement Forecast Oscillator Linear Regression Indicator Linear Regression Slope Linear Regression Trendline MACD Moving Averages (all calculation methods) Parabolic SAR Performance Polarized Fractal Efficiency Creator Chande Wilder Mulloy Wilder Chande Appel Wilder Hannula Indicator Price Oscillator Qstick Indicator r-squared Raff Regression Channel Standard Deviation Channel Standard Error Standard Error Bands Standard Error Channel TEMA Time Series Forecast Trendlines Vertical Horizontal Filter Zig Zag Creator Chande Raff Equis Equis (Andersen) Equis Mulloy White Merril
15 Volatility Indicators (Source: Metastock) Indicator Creator Reference Average True Range Wilder Average True Range Bollinger Bands Bollinger Bollinger Bands Commodity Selection Index Wilder Commodity Selection Index Moving Average (variable) Chande Variable ODDS Probability Cones Fishback ODDS Probability Cones Relative Volatility Index Dorsey Relative Volatility Index Standard Deviation Standard Deviation Standard Error Bands Equis (Andersen) Standard Error Bands Volatility, Chaikin's Chaikin Volatility, Chaikin's Volatility, Option Bookstaber Option Volatility
16 Momentum Indicators (Source: Metastock) Indicator Creator Reference Indicator Creator Reference Accumulation Swing Index Chande Momentum Oscillator Commodity Channel Index Dynamic Momentum Index Intraday Momentum Index Linear Regression Slope Wilder Chande Lamber t Chande Chande Accumulation Swing Index Chande Momentum Oscillator Commodity Channel Index Dynamic Momentum Index Intraday Momentum Index Linear Regression Slope Random Walk Index Poulus Random Walk Index Range Indicator Relative Momentum Index Relative Strength Index Stochastic Momentum Index Weinberg Range Indicator Altman Wilder Blau Relative Momentum Index Relative Strength Index Stochastic Momentum Index Stochastic Oscillator Lane Stochastic Oscillator Swing Index Wilder Swing Index MACD Appel MACD TRIX unknown TRIX Mass Index Dorsey Mass Index Ultimate Oscillator Williams Ultimate Oscillator Momentum Indicator Momentum Williams' %R Williams Williams' %R Price Oscillator Price Oscillator Price Rate-Of-Change Appel Price Rate-Of-Change Williams' Accumulation/ Distribution Williams Williams' Accumulation/Distribu tion
17 Cycle Indicators (Source: Metastock) Indicator Creator Reference Cycle Lines Cycle Lines Detrended Price Oscillator Detrended Price Oscillator Fibonacci Time Zones Time Zones Fourier Transform Fourier Transform MESA Sine Wave Indicator Ehlers MESA Sine Wave
18 Market Strength Indicators (Source: Metastock) Indicator Creator Reference Indicator Creator Reference Accumulation/ Distribution Williams Accumulation/ Distribution Demand Index Sibbet Demand Index Chaikin Money Flow Chaikin Oscillator Chaikin Chaikin Chaikin Money Flow Chaikin A/D Oscillator Ease of Movement Arms Ease of Movement Herrick Payoff Index Herrick Herrick Payoff Index Negative Volume Index On Balance Volume Open Interest Positive Volume Index Price Volume Trend Trade Volume Index Fosback Granville Fosback Equis (Slauson) Negative Volume Index On Balance Volume Open Interest Positive Volume Index Price Volume Trend Trade Volume Index Klinger Oscillator Klinger Klinger Oscillator Volume Volume Money Flow Index Quong/Soud ack Money Flow Index Volume Oscillator Volume Oscillator Moving Average (volume adjusted) Arms Moving Average Calculation Methods Volume Rate-Of- Change Volume Rate-Of- Change
19 Support & Resistance Indicators (Source: Metastock) Indicator Creator Reference Andrews' Pitchfork Andrews Andrews' Pitchfork Envelope Fibonacci Arcs, Fans, Retracements Envelope Fibonacci Studies Gann Lines, Fans, Grids Gann Gann Studies Projection Bands Widner Projection Bands Projection Oscillator Widner Projection Oscillator Quadrant Lines Speed Resistance Lines Quadrant Lines Speed Resistance Lines Tirone Levels Tirone Tirone Levels Trendlines Trendlines
20
21 Advantages of unrelated indicators The best regression models are those in which the predictor variables each correlate highly with the dependent (outcome) variable but correlate at most only minimally with each other. Such a model is often called "low noise" and will be statistically robust (that is, it will predict reliably across numerous samples of variable sets drawn from the same statistical population).
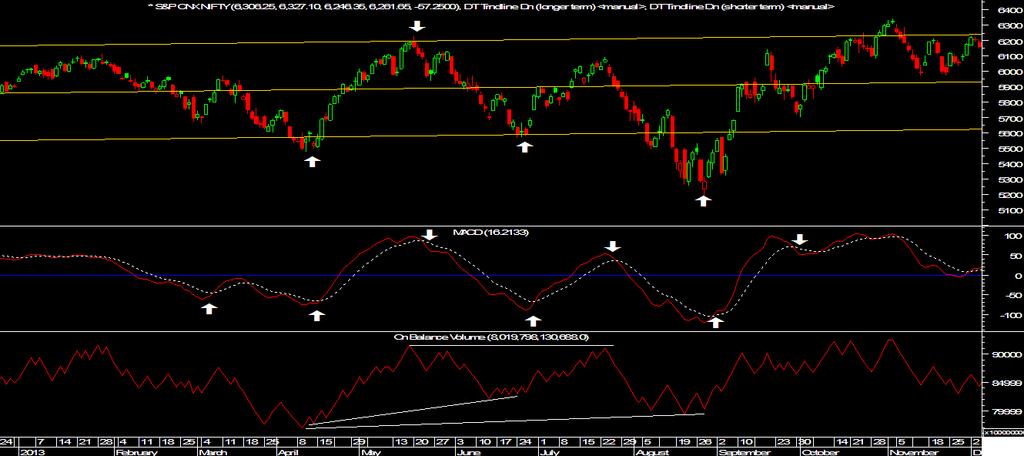
22 Use complimentary indicators To avoid the problems associated with multicollinearity, traders should select indicators that work well with, or complement, each other without providing redundant results.
23 Few combinations suggested Standard deviation + MACD + OBV
24
25 Few combinations suggested MA crossover + MFI

26

27
28 Few combinations suggested Bollinger bands + RSI + Volume Oscillator

29
30 Few combinations suggested PSAR + ROC + Trendlines

31
32 Few combinations suggested PSAR + MFI + Trendlines

33

34
35 A word about Market Breadth Indicators Arms Index (TRIN) Advance-Decline Line Advance-Decline Volume Line Bullish Percent Index High-Low Index McClellan Oscillator McClellan Summation Index Net New Highs Percent Above Moving Average Record High Percent Volatility Index (VIX)
36
37 Eccentric indicators (Bizarre!) Just for fun!!! (Source:CNBC) Hemline/Skirt Length Indicator Super Bowl Indicator Billboard Top 100 Indicator Sports Illustrated Swimsuit Cover The Big Mac Index Lipstick Indicator/Lipstick Effect
38 Take home message Use optimization and backtesting but avoid overoptimization as past never equals future. Technical analysis deals in probabilities rather than certainties. There is no combination of indicators that will accurately predict the markets' moves 100% of the time. While too many indicators, or the incorrect use of indicators, can blur a trader's view of the markets, traders who use technical indicators carefully and effectively can more accurately pinpoint highprobability trading set-ups, increasing their odds of success in the markets.
39 Suggested Reading Technical Analysis of the Financial Markets: A Comprehensive Guide to Trading Methods and Applications (New York Institute of Finance) - John J. Murphy Technical Analysis of Stock Trends - John Magee Technical Analysis: The Complete Resource for Financial Market Technicians -Charles D. Kirkpatrick II, Julie Dahlquist
40 A special thanks - Investrade group, Indore and my dear friends Nareshji, Deveshji and Himanshuji for their help and cooperation. ATMA for allowing me to speak on this platform.

41 Every battle is won before it is ever fought. Sun Tzu

42 THANK YOU
1. Accumulation Swing Index
 1. Accumulation Swing Index The Accumulation Swing Index (Wilder) is a cumulative total of the Swing Index. The Accumulation Swing Index may be analyzed using technical indicators, line studies, and chart
Indicators Manual. Genesis Financial Technologies Inc. Finally Strategy Development and Back Testing Just Got Easier!
 s Manual Genesis Financial Technologies Inc. Finally Strategy Development and Back Testing Just Got Easier! KEY : 5 TRADE NAVIGATOR INDICATORS: 6 ACCUMULATION/DISTRIBUTION 6 ADOSC 7 ADX 8 ADXMOD 9 ADXR
Technical Indicators versiunea
 Technical Indicators versiunea 2.0 03.10.2008 Contents 1 Price... 1 2 Charts... 1 2.1 Line, Step, Scatter, Histogram/Mountain charts 1 2.2 Open/High/Low/Close charts (Bar Charts)... 2 2.3 Candle charts...
finbay.ru
 1... 6... 6... 7... 7... 7... 7... 8... 8... 9... 10... 12 (line charts)... 12 (BAR CHARTS)... 12 (volume bar chart)... 13... 14... 15... 18 (traders remorse)... 19... 21... 22... 24 (Moving averages)...
Charting Glossary. September 2008 Version 1
 Charting Glossary September 2008 Version 1 i Contents 1 Price... 1 2 Charts... 1 2.1 Line, Step, Scatter, Histogram/Mountain charts...1 2.2 Open/High/Low/Close charts (Bar Charts)...1 2.3 Candle charts...2
IronFX. technical indicators
 IronFX technical indicators Average Directional Index (ADX) The Average Directional Index (ADX) helps traders see if a trend is developing in the charts and whether the trend is strengthening or weakening.
Level II Learning Objectives by chapter
 Level II Learning Objectives by chapter 1. Charting Explain the six basic tenets of Dow Theory Interpret a chart data using various chart types (line, bar, candle, etc) Classify a given trend as primary,
CFD Marketmaker v5.0 New Charting User Guide. 7 th June 2005 v1.2
 CFD Marketmaker v5.0 New Charting User Guide 7 th June 2005 v1.2 Contents Page Introduction...3 Charting...4 How to View a Chart... 4 Main Chart Window... 6 Date/Time & Value where the mouse is... 6 Value
Level I Learning Objectives by chapter
 Level I Learning Objectives by chapter 1. Introduction to the Evolution of Technical Analysis Describe the development of modern technical analysis Describe the origins of technical analysis 2. A New Age
Learning Objectives CMT Level II
 Theory and Analysis Learning Objectives CMT Level II - 2018 Section I: Chart Development and Analysis Chapter 1 Charting Explain the six basic tenets of Dow Theory Interpret chart data using various chart
COPYRIGHTED MATERIAL. Index
 Index A Accuracy of data, 117 Adaptive moving averages, 19 ADX, see Average directional movement index Aesop, 1 Alcott, Louisa May, 163 Anti-Martingale strategy, 168, 169 Appel, Gerald, 27 Aristotle, 189
Technical Analysis. Dealing Room Peter Leonidou. Peter Leonidou
 Technical Analysis Dealing Room Questions Traders Should Ask What is the trend? What is the pivot point? What is the support levels? What is the resistance levels? Strong or weaker USD? What 1. Trade
Technical Stock Market and Stock Analysis UCLA Extension
 Technical Stock Market and Stock Analysis UCLA Extension Date: February 4, 2012 Duration: Instructor: 9:00 AM - 4:00 PM Andrew Lais Investment Executive and General Principal Course Topics and Aim: This
OSCILLATORS. TradeSmart Education Center
 OSCILLATORS TradeSmart Education Center TABLE OF CONTENTS Oscillators Bollinger Bands... Commodity Channel Index.. Fast Stochastic... KST (Short term, Intermediate term, Long term) MACD... Momentum Relative
IVGraph Live Service Contents
 IVGraph Live Service Contents Introduction... 2 Getting Started... 2 User Interface... 3 Main menu... 3 Toolbar... 4 Application settings... 5 Working with layouts... 5 Working with tabs and viewports...
Chapter 2.3. Technical Indicators
 1 Chapter 2.3 Technical Indicators 0 TECHNICAL ANALYSIS: TECHNICAL INDICATORS Charts always have a story to tell. However, sometimes those charts may be speaking a language you do not understand and you
CONTENTS 2 THE BASIC PRINCIPLE OF TECHNICAL ANALYSIS THE TREND 9
 JLWD ' i - CONTENTS Acknowledgments About the Authors xxiii xxv Part I: Introduction 1 INTRODUCTION TO TECHNICAL ANALYSIS 3 2 THE BASIC PRINCIPLE OF TECHNICAL ANALYSIS THE TREND 9 How Does the Technical
CMT LEVEL I CURRICULUM Self-Evaluation
 CMT LEVEL I CURRICULUM Self-Evaluation DEAR CFA CHARTERHOLDER, As a CFA charterholder, the requirement that you sit for the CMT Level I exam is waived. However, the content in the CMT Level I Curriculum
Fast Track Stochastic:
 Fast Track Stochastic: For discussion, the nuts and bolts of trading the Stochastic Indicator in any market and any timeframe are presented herein at the request of Beth Shapiro, organizer of the Day Traders
Chapter 2.3. Technical Analysis: Technical Indicators
 Chapter 2.3 Technical Analysis: Technical Indicators 0 TECHNICAL ANALYSIS: TECHNICAL INDICATORS Charts always have a story to tell. However, from time to time those charts may be speaking a language you
ART OF TRADING. Master the
 Master the ART OF TRADING EXPERT TRAINING FROM TRADING MASTERS AND COACHING PROFESSIONALS From learning the basics to creating a trading plan, our programs will help you increase your knowledge and improve
1 P a g e. Executive Summary
 Executive Summary Over the past week we re-introduced some alternative counts, all of which bullish and some simple more bullish than others. The market keeps tracking them well; and we still can t eliminate
20.2 Charting the Market
 NPTEL Course Course Title: Security Analysis and Portfolio Management Course Coordinator: Dr. Jitendra Mahakud Module-10 Session-20 Technical Analysis-II 20.1. Other Instruments of Technical Analysis Several
Technical Indicators
 Taken From: Technical Analysis of the Financial Markets A Comprehensive Guide to Trading Methods & Applications John Murphy, New York Institute of Finance, Published 1999 Technical Indicators Technical
Technical Analysis and Charting Part II Having an education is one thing, being educated is another.
 Chapter 7 Technical Analysis and Charting Part II Having an education is one thing, being educated is another. Technical analysis is a very broad topic in trading. There are many methods, indicators, and
Contents 1. Introduction 6 2. User interface 8 General features 8 Editing your strategy 10 Context menu 13 Backtesting 15 Backtest report view 17 3.
 Contents 1. Introduction 6 2. User interface 8 General features 8 Editing your strategy 10 Context menu 13 Backtesting 15 Backtest report view 17 3. Model elements / language 19 Market information 20 Instrument
Maybank IB. Understanding technical analysis. by Lee Cheng Hooi. 24 September Slide 1 of Maybank-IB
 Maybank IB Understanding technical analysis 24 September 2011 by Lee Cheng Hooi Slide 1 of 40 Why technical analysis? 1) Market action discounts everything 2) Prices move in trends 3) History repeats itself
INTERMEDIATE EDUCATION GUIDE
 INTERMEDIATE EDUCATION GUIDE CONTENTS Key Chart Patterns That Every Trader Needs To Know Continution Patterns Reversal Patterns Statistical Indicators Support And Resistance Fibonacci Retracement Moving
Trading Platforms-Liquidity-White Label-Management Systems
 Trading Platforms-Liquidity-White Label-Management Systems WORLD CLASS TRADING PLATFORM PROVIDER Brokers Introducing Brokers Forex Training Schools Hedge Funds & Money Managers PROVIDING OPPORTUNITY INTRODUCTION
Trends. Define the term Trend Explain why Trend is important Identify Primary, Secondary, and Short-Term trends
 Trends Define the term Trend Explain why Trend is important Identify Primary, Secondary, and Short-Term trends 1 What is a Trend? Uptrend Prices rise and fall in Trends Trend is defined as: Up (Rising)
Adding longs in the SPX zone will be well-rewarded longer term we believe.
 Executive Summary Last week we found, based on our analyses of the charts: Our SPX2146-2069 target zone remains and can now be narrowed down to SPX2117-2069, as the S&P500 closed at SPX2128 yesterday,
Star Search Strategy. Barbara Star, PhD. Wednesday 07/11/2018
 Learn a strategy for finding profitable trades in stocks and commodities using a variation of Bollinger Bands and another, less well-known, indicator that is available on most charting software. Both conservative
MULTI-TIMEFRAME TREND TRADING
 1. SYNOPSIS The system described is a trend-following system on a slow timeframe that uses optimized (that is, contrarian) entries and exits on a fast timeframe at the tops and bottoms of retraces against
Trading the Hidden Divergence. Presented by Sunil Mangwani
 Trading the Hidden Divergence Indicators in technical analysis. Indicators along with chart patterns, trend lines, resistance / support levels etc., are an essential part of technical analysis. But there
Table of Contents. Risk Disclosure. Things we will be going over. 2 Most Common Chart Layouts Anatomy of a candlestick.
 Table of Contents Risk Disclosure Things we will be going over 2 Most Common Chart Layouts Anatomy of a candlestick Candlestick chart Anatomy of a BAR PLOT Indicators Trend-Lines Volume MACD RSI The Stochastic
BursaStation Learning Workshop Enhance Your Trading Skills With Bursastation
 BursaStation Learning Workshop Enhance Your Trading Skills With Bursastation Presented by: C.Y. Leow Assistant Manager ShareInvestor Malaysia BURSASTATION LAYOUT LAYOUT Toolbar CHANNEL NAVIGATOR MAIN FRAME
COPYRIGHTED MATERIAL. Index
 Index A Adaptive techniques adaptive intraday breakout system, 748 749 adaptive momentum calculations dynamic momentum index, 747 748 trend-adjusted oscillator, 747 variable-length stochastic technique,
Kagi 113 Large Block Ratio 115 Linear Regression Lines 116 MACD 118 Mass Index 120 McClellan Oscillator 122 McClellan Summation Index 124 Median
 Contents Preface 1 Acknowledgments 2 Terminology 3 To Learn More 4 Introduction 5 Technical Analysis 6 Price fields 9 Charts 11 Support & resistance 14 Trends 22 Moving averages 24 Indicators 27 Market
MetaStock XV Featuring Offline Mode
 MetaStock XV Featuring Offline Mode Disclaimer This demonstration is designed to instruct you on using MetaStock and accompanying software plug-ins and is not a recommendation to buy or sell, but rather
Summary Merry Christmass,
 Summary For weeks I ve been looking for the indices to reach ideally SPX2500-2475, NAS6395-6295 and NDX6080 +/- 10, DJIA $23,200 +/-100 and RUT $1355-1310. as at these levels the minute, minor and intermediate-waves
Martin J. Pring President of Pring.com
 Martin J. Pring President of Pring.com How to Manage Risk Using Technical Analysis The first trading objective is to preserve capital #1 Trading rule Cut losses quickly, let profits run. First trade 50%
Market Technical Analysis REPORT
 Market Technical Analysis REPORT using Integrated Pitchfork Analysis by Dr Mircea Dologa, MD, CTA MORNING of May 21st 2007 The traders must progressively monitor the conditions of the market movements
1 P a g e. Executive Summary
 Executive Summary For three weeks we provided a primary (major b) and alternative count (primary V) up and we keep tracking both until one or the other is disproven. Two weeks ago we projected a major
THE CYCLE TRADING PATTERN MANUAL
 TIMING IS EVERYTHING And the use of time cycles can greatly improve the accuracy and success of your trading and/or system. THE CYCLE TRADING PATTERN MANUAL By Walter Bressert There is no magic oscillator
Symmetry target: 24000
 Flat/consolidation day for the S&P and NAS, whereas the DJIA continued its relentless Bull run. Since the low made in February 2016 (22 months ago) the DJIA has gained 8000 points, of which the last 3100
Intelligent Investing, LLC Major Indices Daily Update 02/26/ 19
 Elliot Wave Updates Yesterday I found a move below last Friday s high (SPX2794.20) will be a first sign of lower prices as then the decline can t be a 4 th wave because 4 th and 1 st waves can t overlap
Learning Objectives CMT Level I
 Learning Objectives CMT Level I - 2018 An Introduction to Technical Analysis Section I: Chart Development and Analysis Chapter 1 The Basic Principle of Technical Analysis - The Trend Define what is meant
Notices and Disclaimer
 Part 2 March 14, 2013 Saul Seinberg Notices and Disclaimer } This is a copyrighted presentation. It may not be copied or used in whole or in part for any purpose without prior written consent from the
An informative reference for John Carter's commonly used trading indicators.
 An informative reference for John Carter's commonly used trading indicators. At Simpler Options Stocks you will see a handful of proprietary indicators on John Carter s charts. This purpose of this guide
Level I Learning Objectives by chapter (2017)
") Level I Learning Objectives by chapter (2017) 1. The Basic Principle of Technical Analysis: The Trend Define what is meant by a trend in Technical Analysis Explain why determining the trend is important
Level I Learning Objectives by chapter (2017) 1. The Basic Principle of Technical Analysis: The Trend Define what is meant by a trend in Technical Analysis Explain why determining the trend is important
Popular Exit Strategies The Good, the Bad, and the Ugly
 Popular Exit Strategies The Good, the Bad, and the Ugly A webcast presentation for the Market Technicians Association Presented by Chuck LeBeau Director of Analytics www.smartstops.net What we intend to
1 P a g e. Summary. However, a move over SPX2817 from current levels will mean we re still dealing with a larger, more complex bounce to SPX
 Summary Last week I provided some additional information from John Murphy and about typical end-of-bull sector rotation as added weight of evidence for a larger correction being underway. This week the
Real-time Analytics Methodology
 New High/Low New High/Low alerts are generated once daily when a stock hits a new 13 Week, 26 Week or 52 Week High/Low. Each second of the trading day, the stock price is compared to its previous 13 Week,
GUIDE TO STOCK trading tools
 P age 1 GUIDE TO STOCK trading tools VI. TECHNICAL INDICATORS AND OSCILLATORS I. Introduction to Indicators and Oscillators Technical indicators, to start, are data points derived from a specific formula.
Introduction. Technicians (also known as quantitative analysts or chartists) usually look at price, volume and psychological indicators over time.
 usually look at price, volume and psychological indicators over time.") Technical Analysis Introduction Technical Analysis is the study of market action, primarily through the use of charts, for the purpose of forecasting future price trends. Technicians (also known as quantitative
Technical Analysis Introduction Technical Analysis is the study of market action, primarily through the use of charts, for the purpose of forecasting future price trends. Technicians (also known as quantitative
Intermediate - Trading Analysis
 Intermediate - Trading Analysis Technical Analysis Technical analysis is the attempt to forecast currencies prices on the basis of market-derived data. Technicians (also known as quantitative analysts
Index. long-term 200-day, 45 market cycle, myths, very long-term, weekly-based longer-term, 46-47
 Appel_Index2.qxd 2/22/05 11:07 AM Page 229 Index Symbols 10-day rate of change, NYSE Index advance-decline line, 133-134 18-month market cycles, 104 21-day rate of change, NYSE Index advance-decline line,
Advance Certificate in Trading : A PROGRAM FOR SELF-INVESTORS
 Advance Certificate in Trading : A PROGRAM FOR SELF-INVESTORS [Stock Commodity-Forex] Duration: 4 Months Fee: 33,000 + Service Tax Training: Weekends / Weekdays Certifications: Certified Trader Certificate
1 P a g e. Executive Summary
 Executive Summary We can keep the executive summary very simple, and repeat what we said last week: A break below SPX2405 is now needed to put the Bull-count in jeopardy. Until then we have to look up,
Systems And The Universal Cycle Index Cycles In Time And Money
 CYCLES Systems And The Universal Cycle Index Cycles In Time And Money Wouldn t you like to be able to identify top and bottom extremes and get signals to open new positions or close current ones? This
Track n Trade Indicator Cheat Sheet
 Track n Trade Indicator Cheat Sheet Percent Bollinger Bands (%B) Bollinger Bands are calculated as a simple moving average shifted up and down by a number of standard deviations. Percent Bollinger Bands
The Best Gann Fan Trading Strategy
 The Best Gann Fan Trading Strategy The best Gann fan trading strategy is a complex support and resistance trading strategy that uses diagonal support and resistance levels. Unlike the traditional horizontal
iii Figure 1. SPX 60-min chart.
 Today the S&P500 (not the DJIA, NAS and NDX) made a marginally lower low below yesterday s low (SPX2527 vs SPX2529), which forced me to re-assess the short-term Elliott-wave count I have for this move
Technicals & Time Frame
 Advanced Charting Neither Better Trades or any of its personnel are registered broker-dealers or investment advisers. I will mention that I consider certain securities or positions to be good candidates
Introduction. Technical analysis is the attempt to forecast stock prices on the basis of market-derived data.
 Technical Analysis Introduction Technical analysis is the attempt to forecast stock prices on the basis of market-derived data. Technicians (also known as quantitative analysts or chartists) usually look
Micro-4 SPX2544. Minute-iv SPX2557. You are here. Major-4 SPX P a g e. Executive Summary
 Executive Summary Although 5 waves up off the SPX2557 low can be counted, because of the -what in my book counts best as- 3 wave structures both up and down since that mid-november low, the ending diagonal
Ensign Manual. Studies. Copyright 2011 Ensign Software, Inc.
 Ensign Manual Studies Copyright 2011 Ensign Software, Inc. Table of Contents Studies...4 Overview...5 Properties...6 Description...9 Accumulation / Distribution...9 Accumulation Swing Index...10 Aroon
What is it really? Presentation to the Melbourne ATAA meeting 8 October, Technical Analysis What is it really?
 1 What is it really? What is it really? Presentation to the Melbourne ATAA meeting 8 October, 2009 The share market can seem mystical and almost like black magic; but with the right support and assistance,
Technical Analysis. A Language of the Market
 Technical Analysis A Language of the Market Acknowledgement: Most of the slides were originally from CFA Institute and I adapted them for QF206 https://www.cfainstitute.org/learning/products/publications/inv/documents/forms/allitems.aspx
1 P a g e. Executive Summary
 Executive Summary My call two weeks ago to revoke the major-3 top for the S&P500 based on OEW downtrend confirmations on several indices including the S&P500. was the correct thing today as I was then
Please note that many technical indicator names are quite long, therefore function abbreviations have been conveniently provided wherever possible.
 Technical Analysis Functions Forex can be analyzed by means of either fundamental analysis or technical analysis. Those who analyze securities using fundamental analysis rely on data such as the profits-to-earnings
The very first calculations for average gain and average loss are simple 14- period averages.
 Introduction Developed by J. Welles Wilder, the Relative Strength Index (RSI) is a momentum oscillator that measures the speed and change of price movements. RSI oscillates between zero and 100. Traditionally,
Resistance remains in the SPX S/R zone, with a break out targeting 2170s.
 Executive Summary With a flat week, it appears a one pager would be sufficient to summarize what has happened. However, we believe that would get us off too easy and we still would like to provide a full
JPY BUY SQUARE /28/ Points
 (www.rts-forex.com) Daily Currency Trading Recommendations --CME/Globex FUTURES--MAR Contract 3/3/ Published at 3:-4: pm New York time for the upcoming overnight Globex session and following day until
Course Modules and Schedules
 Course Modules and Schedules Course Modules Together with our international partners we have developed a comprehensive Forex Trading Course. Some of the highlights of our course are: Its interactive features
Profiting. with Indicators. By Jeff Drake with Ed Downs
 Profiting with Indicators By Jeff Drake with Ed Downs Profiting with Indicators By Jeff Drake with Ed Downs Copyright 2018 Nirvana Systems Inc. All Rights Reserved The charts and indicators used in this
Interdepartmental Graduate Program in Business Administration - MBA
 Interdepartmental Graduate Program in Business Administration - MBA Elective Course MBΑ (3 rd Semester) Investments Analysis and Portfolio Management Instructors: Athanasios G. Noulas Professor Office:
What is Technical Analysis
 Reg. office: International School of Financial Market, Plot no. 152 - P (LGF), Sec - 38, Medicity Road, Gurgaon - 122002 Contact no. : 0124-2200689,+919540008689, 9654446629 Web : www.isfm.co.in, Email
Impact of Risk Management Features on Performance of Automated Trading System in GRAINS Futures Segment
 Impact of Risk Management Features on Performance of Automated Trading System in GRAINS Futures Segment PETR TUCNIK Department of Information Technologies University of Hradec Kralove Rokitanskeho 62,
The S&P500 is still allowed to tag SPX and then roll over, as it would fit with a c=a relationship on the COMPQ to $6226.
 Yesterday I showed the different possibilities the market has, and since there s not been a >10p move to the opposite direction since the SPX2446.55 low and SPX 2469.64 higher were struck (today s decline
Thomas Gith Day Trader
 Thomas Gith Day Trader Distinctions A Day Trader opens and closes a trade in the markets during the course of the trading day 3 to 5 Trades per Day No Scalping A Position Trader keeps a trade open overnight
Research Desk StockBroking
 Research Desk StockBroking India ValueMax June 01, 2017 ValueMax Monthly Investment Ideas ValueMax helps clients to take a long stance on stocks from thes&pbse-100 universe. Comprising monthly technical
Intelligent Investing, LLC Major Indices Daily Update 02/28/ 19
 Elliot Wave Updates Today the S&P500 was stuck in a less than 6p range. So there s really not much we can learn. All parameters remain the same a step 2: A move below SPX2764.55 (last Thursday s low) will
1 P a g e. Executive Summary
 Executive Summary After having reached SPX2484, 1p short of my ideal SPX24585-2505 target zone, on July 27 and selling off intra-day the S&P500 hasn t made a higher high and has remained flat the past
1 P a g e. Executive Summary
 Executive Summary Our standard sub division (SSD) Elliot Wave count for the S&P500 continues to track the market well, and we ll keep it as is until the market will tell us different. We continue to expect
10-Year Treasury Notes ($UST Price)
") 1 Weekly Inter-market Technical Report 10-Year Treasury Notes ($UST Price) Monthly Continuing from last week's report, bonds (notes) appear to be on a strong buy signal on the monthly chart, as price is
1 Weekly Inter-market Technical Report 10-Year Treasury Notes ($UST Price) Monthly Continuing from last week's report, bonds (notes) appear to be on a strong buy signal on the monthly chart, as price is
When traders make trading decisions based on repeated price patterns that once formed,
 Trading Strategy / Gert.Nurme@iBrokers.ee Price Action Trading Strategy Introduction WHAT IS PRICE ACTION TRADING? When traders make trading decisions based on repeated price patterns that once formed,
Nifty Auto (CMP: 7464)
") Nifty Auto (CMP: 7464) Positive Bullish Harami pattern at a strong support zone (Lower end of the Channel as well as the 50% Fibonacci retracement level) Technical Overview: The overall Automobile space
Nifty Auto (CMP: 7464) Positive Bullish Harami pattern at a strong support zone (Lower end of the Channel as well as the 50% Fibonacci retracement level) Technical Overview: The overall Automobile space
1 P a g e. Executive Summary
 Executive Summary Based on this week s deduction of observable facts, we continue to favor the major a at SPX 1867, major b at SPX 2021 and major c down to SPX 1830-1850ies around October 9-12. How exactly
Book References for the Level 2 Reading Plan. A Note About This Plan
 CMT Level 2 Reading Plan Fall 2013 Book References for the Level 2 Reading Plan Book references are given as the following: TAST Technical Analysis of Stock Trends, 9 th Ed. TA Technical Analysis, The
 1 www.candlecharts.com 2 BONUS www. candlecharts.com/special/swing-trading-2/ 3 www. candlecharts.com/special/swing-trading-2/ 4 www. candlecharts.com/special/swing-trading-2/ 5 www. candlecharts.com/special/swing-trading-2/
Part I: Identifying and Understanding the Trend
 CONTENTS Cover Half Title Series Page Title Page Copyright Page Dedication Foreword Introduction Part I: Identifying and Understanding the Trend Chapter 1: Identifying the Major Trend Market Influencers
15 th March Gold Silver Copper Zinc Lead Aluminium Nickel Crude Oil Natural Gas Guar seed Castor seed. Bullion. Base Metal. Energy.
 15 th March 2018 Bullion Base Metal Energy Agro Gold Silver Copper Zinc Lead Aluminium Nickel Crude Oil Natural Gas Guar seed Castor seed On the daily chart MCX Gold price has given rising wedge breakdown
A handbook of the basics
 Primer Market Analysis United States 14 May 2013 A handbook of the basics Market Analysis Technical Handbook We cover the basics of Trend, Momentum and other technical indicators and methods. Stephen Suttmeier,
Index. Chaikin Money Flow (CMF), 59 chartists, 32 33, 44 confirmation, 31, contrarian trading, 4, 29
, 59 chartists, 32 33, 44 confirmation, 31, contrarian trading, 4, 29") Notes Introduction 1. High-Frequency Trading, New York Times, October 10, 2011. 2. Securities and Exchange Commission (SEC) at www.sec.gov/answers/ pumpdump.htm. 1 Options: Trading Basics 1. In future
Notes Introduction 1. High-Frequency Trading, New York Times, October 10, 2011. 2. Securities and Exchange Commission (SEC) at www.sec.gov/answers/ pumpdump.htm. 1 Options: Trading Basics 1. In future
Technical Indicators that Really Work
 Technical Indicators that Really Work TECHNICAL INDICATORS Technical indicators have become more important than Fundamentals. With the proper use of technical indicators investors are able to determine
Forexsignal30 Extreme ver. 2 Tutorials
 Forexsignal30 Extreme ver. 2 Tutorials Forexsignal30.com is a manual trading system that is composed of several indicators that mutually cooperate with each other. Very difficult to find indicators that
Technical Analysis Workshop Series. Session Eight Commodity Channel Index
 Technical Analysis Workshop Series Session Eight DISCLOSURES & DISCLAIMERS This research material has been prepared by NUS Invest. NUS Invest specifically prohibits the redistribution of this material
Last Gasp in the Dollar. Market Update May 18, Seattle Technical Advisors
 SeattleTA provides investment managers with technical analysis of the equity, fixed-income, commodity, and currency markets. While equities are expected to take a hit this week, the big news is expected
This article is taken from the notes of my trading log for a closed and open trade in the platinum
 Time, price and pattern by Robert Miner This article is taken from the notes of my trading log for a closed and open trade in the platinum market. My trading plan is three-dimensional. I look for coincidences