MetaStock XV Featuring Offline Mode
|
|
|
- Ellen Hampton
- 6 years ago
- Views:
Transcription

1 MetaStock XV Featuring Offline Mode
2 Disclaimer This demonstration is designed to instruct you on using MetaStock and accompanying software plug-ins and is not a recommendation to buy or sell, but rather guidelines to interpreting and using the specific indicators and features within the software. The information, software, and techniques presented today should only be used by investors who are aware of the risk inherent in trading. MetaStock shall have no liability for any investment decisions based on the use of their software, any trading strategies or any information provided in connection with the company.
3 New Features in MetaStock XV Offline Mode Downloader Local Data Custom Time Frames in the Explorer and System Tester Forecast Any Time Frame Power Strike SectorStat Experts Haguro Method TTT Systems 7 New Templates

4 Offline Mode

5 Local Data
6 Data that can be read Legacy MetaStock Data CSV Local Data Format (New and Improved)
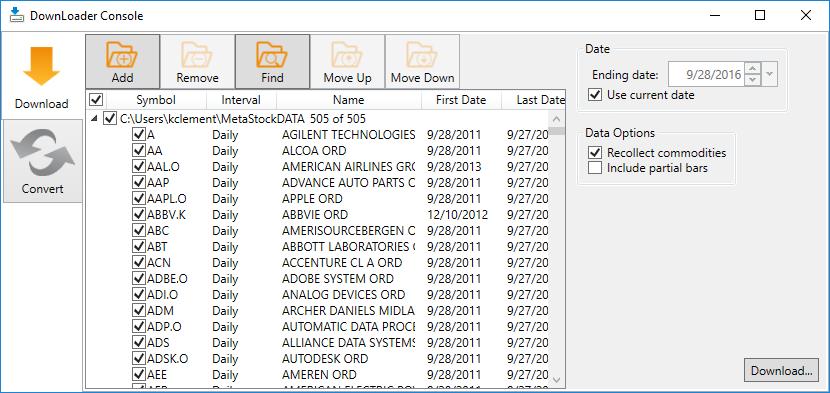
7 Downloader

8 Customize your time frame

9 Forecast Any Time Frame
10 PowerStrike
11 Concept of Support and Resistance Support is a level below the market where buying pressure exceeds selling pressure and a decline is halted. Resistance is a level above the market where selling pressure exceeds buying pressure and a rally is halted. Source: Charting made easy: John Murphy
12 Concept of Support
13 Concept of Resistance
14 Guiding Principle #1 Humans prefer easily divisible and memorable numbers. (Such as 19 over 20). These values are more typical with option strike prices. Hence many traders attention is drawn to these numbers providing potential for more concentrated buying and selling.
15 Options Strike Prices Price between $5 and $25 Increments of $2.5 Example: $5, $7.50, $10, $12.50 Price between $25 and $200 Increments of $5 Example: $25, $30, $35, $40 Price above $200 Increments of $10

16 Using Options Strike Prices
17 Guiding Principle #2 Stock prices are heavily influenced by trading near option strike price levels. Greater influence on important buying and selling Support and Resistance is based on the concentrated buying and selling. Option Strike Price levels attract more attention from important market participants over other levels
18 Guiding Principle #3 Bullish and Bearish pressures at Option Strike Price levels resolve more quickly than pressures at other levels.
19 Pivots Pivot Low Pivot High
20 Scoring PIVOTS + VOLUME = SCORE Greater volume = Greater Score
21 Scoring Example

22 Scoring Example
23 Buy Enabled Buy Enabled: A condition comprised of a stock s closing price being within the PowerStrike Bands, the 20-period TSF being above the DownStrike level, and the Downstrike score being at least 33% greater than the Upstrike score.
24 Short Enabled Short Enabled: A condition comprised of a stock s closing price being within the PowerStrike Bands, the 20-period TSF being below the UpStrike level, and the Upstrike score being at least 33% greater than the Downstrike score
25 SectorStat Experts
26 SectorStat Experts 40 New Indicators 18 New Experts 19 New Templates
27 SectorStat Experts Designed to help traders identify trends and corrections in the market. SectorStat experts builds on the already popular SectorStat indicators built in MetaStock XIII and higher. The SectorStat Experts expand by now covering 7 additional global market overviews.
28 SectorStat Experts Original SectorStat Indicators included 13 per Sector. The SectorStat indicators use 6 SectorStat Indicators for triggers. - Advancing Issues - Declining Issues - Up Volume - Down Volume - McClellan Oscillator - McClellan Oscillator (UVDV)
29 Advance/Decline Advance Number of Issues Moving Up Decline Number of Issues Moving Down
30 For Market Experts based Sectors: 1) Consumer Discretionary 2) Healthcare 3) Utilities 4) Consumer Staples 5) Technology 6) Industrial 7) Financial 8) Energy 9) Materials 10) Telecom Advance/Decline
31 Advance/Decline Volume Advance Number of Issues with increasing volume Decline Number of Issues with decreasing volume
32 McClellan Oscillator Developed by Sherman and Marian McClellan, this oscillator is the difference between a 19-period and a 39-period exponential moving average of advancing issues minus declining issues. The length of the averages were chosen to represent the two most dominate cycle lengths in the market. The difference between the averages is multiplied by 100 for scaling purposes (It will typically move between -100 and +100). The McClellan Oscillator is traditionally seen as bullish when above zero and bearish when below zero. Since the two moving averages are relatively short time frames, the oscillator is considered a short-term indicator.
33 Chart 1 Bar Colors determined by the McClellan being above or below 0 (Green above/red Below) 2 - Trend Ribbon determined by the McClellan (UVDV) being above or below 0 (Green above/red Below) 3- Alert arrows determined by both Oscillators being above/below 0. (Blue for Bullish/Red for Bearish)
34 Example

35 Haguro Method

36 Creator Seiki Shimzu Gary Burton
37 Designed for Weekly Charts Provides Support and Resistance on a weekly basis Key turning lines (candles) A fairly accurate forecast of a weekly movement
38 Midpoint line (candle)
39 Midpoint Line We set a new midpoint if the range (h-l) is greater this week then the previous week and the week before. It acts as support and resistance.
")
40 Line (Candle) Breakdown
41 Meaning of Lines (Candles)
42 Determining Significance Lines have more significance when the price is extended in range. Included is an indicator to measure extension in range using a Zig Zag. It measures distance from the last trough/peak
43 Candle 3 Significant Events Haguro Mid Point Cross.

44 Example
45 TTT (Teach Talk Trade) Methods TTT Bollinger Band Oscillator TTT MACD Oscillator TTT T Oscillator
46 TTT Methods Based on classic indicators such as Bollinger Bands and MACD

47 Set your Account Size and Risk

48 System Uses your Risk and Account
49 TTT MACD Rules The MACD Oscillator is a Mechanical Trading System which is based upon the traditional MACD which is the difference between the 12 day and 26 day exponential moving averages. This MACD Oscillator substitutes Fibonacci numbers, creating and indicator that is smoother than a lot of published versions of the MACD. If you like the MACD indicator then you will love the TTT MACD Oscillator. The triggers used for the TTT MACD are 0.1 and The short trade is triggered when the price closes above the upper trigger level and a long trade is triggered when price closes below the lower trigger level. The suggested stop is based upon an ATR.
50 TTT Bollinger Band Oscillator Rules The TTT Bollinger Band Oscillator is a Mechanical Trading System based upon the classic Bollinger Bands structure developed by John Bollinger. The TTT Bollinger Band Oscillator re-configures the classic bands to display movement within 2 parallel levels as opposed to erratic envelopes that cover up price action on your chart. The 2 parrallel leves represent a 2 standard deviation movement from the mean. These trigger level values are established at 0 and 100.
51 TTT T3 Osc The T3 Oscillator is a Mechanical Trading System which can be used Intra Day as well. It is based upon the T3 and spends a lot of time between the trigger levels if the market is not moving. It does a great job of identifying extremely overbought and oversold situations. It does not always trade a lot of positions. The triggers used for the TTT T3 Oscillator are 1.0 and This method works best on issues that oscillate rather than trending issues. Whether a Day Trading Swing or Intra Day lower time frame for Shorts look for price closing above the upper trigger level for a short and when price closes below the lower trigger level one would go long.
52 7 New Templates Pivots Daily (R/T Only) Pivots Weekly Popularized MACD MACD Histogram Bollinger Bands Oscillating Indicators Price Percentage Oscillator (PPO)
Technical Analysis. Dealing Room Peter Leonidou. Peter Leonidou
 Technical Analysis Dealing Room Questions Traders Should Ask What is the trend? What is the pivot point? What is the support levels? What is the resistance levels? Strong or weaker USD? What 1. Trade
An informative reference for John Carter's commonly used trading indicators.
 An informative reference for John Carter's commonly used trading indicators. At Simpler Options Stocks you will see a handful of proprietary indicators on John Carter s charts. This purpose of this guide
Moving Average Convergence Divergence (MACD) by
 by") Moving Average Convergence Divergence (MACD) by www.surefire-trading.com Ty Young Hi, this is Ty Young with Surefiretrading.com and today we will be discussing the Moving Average Convergence/Divergence
Moving Average Convergence Divergence (MACD) by www.surefire-trading.com Ty Young Hi, this is Ty Young with Surefiretrading.com and today we will be discussing the Moving Average Convergence/Divergence
Technical Indicators versiunea
 Technical Indicators versiunea 2.0 03.10.2008 Contents 1 Price... 1 2 Charts... 1 2.1 Line, Step, Scatter, Histogram/Mountain charts 1 2.2 Open/High/Low/Close charts (Bar Charts)... 2 2.3 Candle charts...
Table of Contents. Risk Disclosure. Things we will be going over. 2 Most Common Chart Layouts Anatomy of a candlestick.
 Table of Contents Risk Disclosure Things we will be going over 2 Most Common Chart Layouts Anatomy of a candlestick Candlestick chart Anatomy of a BAR PLOT Indicators Trend-Lines Volume MACD RSI The Stochastic
Charting Glossary. September 2008 Version 1
 Charting Glossary September 2008 Version 1 i Contents 1 Price... 1 2 Charts... 1 2.1 Line, Step, Scatter, Histogram/Mountain charts...1 2.2 Open/High/Low/Close charts (Bar Charts)...1 2.3 Candle charts...2
OSCILLATORS. TradeSmart Education Center
 OSCILLATORS TradeSmart Education Center TABLE OF CONTENTS Oscillators Bollinger Bands... Commodity Channel Index.. Fast Stochastic... KST (Short term, Intermediate term, Long term) MACD... Momentum Relative
INTERMEDIATE EDUCATION GUIDE
 INTERMEDIATE EDUCATION GUIDE CONTENTS Key Chart Patterns That Every Trader Needs To Know Continution Patterns Reversal Patterns Statistical Indicators Support And Resistance Fibonacci Retracement Moving
Chapter 2.3. Technical Analysis: Technical Indicators
 Chapter 2.3 Technical Analysis: Technical Indicators 0 TECHNICAL ANALYSIS: TECHNICAL INDICATORS Charts always have a story to tell. However, from time to time those charts may be speaking a language you
Introduction. Technical analysis is the attempt to forecast stock prices on the basis of market-derived data.
 Technical Analysis Introduction Technical analysis is the attempt to forecast stock prices on the basis of market-derived data. Technicians (also known as quantitative analysts or chartists) usually look
Introduction. Technicians (also known as quantitative analysts or chartists) usually look at price, volume and psychological indicators over time.
 usually look at price, volume and psychological indicators over time.") Technical Analysis Introduction Technical Analysis is the study of market action, primarily through the use of charts, for the purpose of forecasting future price trends. Technicians (also known as quantitative
Technical Analysis Introduction Technical Analysis is the study of market action, primarily through the use of charts, for the purpose of forecasting future price trends. Technicians (also known as quantitative
Chapter 2.3. Technical Indicators
 1 Chapter 2.3 Technical Indicators 0 TECHNICAL ANALYSIS: TECHNICAL INDICATORS Charts always have a story to tell. However, sometimes those charts may be speaking a language you do not understand and you
 1 www.candlecharts.com 2 BONUS www. candlecharts.com/special/swing-trading-2/ 3 www. candlecharts.com/special/swing-trading-2/ 4 www. candlecharts.com/special/swing-trading-2/ 5 www. candlecharts.com/special/swing-trading-2/
Technical Analysis and Charting Part II Having an education is one thing, being educated is another.
 Chapter 7 Technical Analysis and Charting Part II Having an education is one thing, being educated is another. Technical analysis is a very broad topic in trading. There are many methods, indicators, and
BY JIM PRINCE
 No part of this publication may be reproduced, stored in a retrieval system, or transmitted in any form or by any means electronic, mechanical, photocopying, recording, or otherwise without the prior permission
THE CYCLE TRADING PATTERN MANUAL
 TIMING IS EVERYTHING And the use of time cycles can greatly improve the accuracy and success of your trading and/or system. THE CYCLE TRADING PATTERN MANUAL By Walter Bressert There is no magic oscillator
BONUS. www. candlecharts.com/special/swing-trading-2/
 BONUS www. candlecharts.com/special/swing-trading-2/ 1 www. candlecharts.com/special/swing-trading-2/ www. candlecharts.com/special/swing-trading-2/ www. candlecharts.com/special/swing-trading-2/ 2 www.
Covert Code. (previously known as Currency Messenger System 1)
") Covert Code (previously known as Currency Messenger System 1) COVERT CODE INDICATORS Covert Code uses 5 different indicators Mes Signal 1 Indicator which gives you buy and sell arrow signal on the screen.
Covert Code (previously known as Currency Messenger System 1) COVERT CODE INDICATORS Covert Code uses 5 different indicators Mes Signal 1 Indicator which gives you buy and sell arrow signal on the screen.
Poseidon FX System (previously known as Currency Messenger System 2) Poseidon system indicators:
 Poseidon system indicators:") Poseidon FX System (previously known as Currency Messenger System 2) Poseidon system indicators: It uses 5 different indicators Mes Signal 2 Indicator which gives you buy and sell arrow signal on the screen.
Poseidon FX System (previously known as Currency Messenger System 2) Poseidon system indicators: It uses 5 different indicators Mes Signal 2 Indicator which gives you buy and sell arrow signal on the screen.
A Guide to Joe DiNapoli s D-Levels Studies Using GFT s DealBook FX 2
 A Guide to Joe DiNapoli s D-Levels Studies Using GFT s DealBook FX 2 Based on the book: Trading with DiNapoli Levels The Practical Application of Fibonacci Analysis to Investment Markets Important notice:
Expert Trend Locator. The Need for XTL. The Theory Behind XTL
 Chapter 20 C H A P T E R 20 The Need for XTL esignal does an excellent job in identifying Elliott Wave counts. When combined with studies such as the Profit Taking Index, Wave Four Channels, Trend Channels
Swing Trading Strategies that Work
 Swing Trading Strategies that Work Jesse Livermore, one of the greatest traders who ever lived once said that the big money is made in the big swings of the market. In this regard, Livermore successfully
Real-time Analytics Methodology
 New High/Low New High/Low alerts are generated once daily when a stock hits a new 13 Week, 26 Week or 52 Week High/Low. Each second of the trading day, the stock price is compared to its previous 13 Week,
IVGraph Live Service Contents
 IVGraph Live Service Contents Introduction... 2 Getting Started... 2 User Interface... 3 Main menu... 3 Toolbar... 4 Application settings... 5 Working with layouts... 5 Working with tabs and viewports...
TECHNICAL INDICATORS
 TECHNICAL INDICATORS WHY USE INDICATORS? Technical analysis is concerned only with price Technical analysis is grounded in the use and analysis of graphs/charts Based on several key assumptions: Price
How I Trade Profitably Every Single Month without Fail
 How I Trade Profitably Every Single Month without Fail First of all, let me take some time to introduce myself to you. I am Koon Hwee (KH Lee) and I am a full time currency trader. I have a passion for
Chapter 3. Price Action
 Chapter 3 Price Action The movement of price in any market is called Price Action. This movement is caused by the beliefs and trading systems of hundreds of thousands of worldwide traders that the market
Bollinger Trading Methods. Play 1 - The Squeeze
 Overview: Play 1 - The Squeeze Play 2 - The Trend Trade Play 3 - Reversals Wrap up Bollinger Trading Methods Play 1 - The Squeeze The Squeeze The most popular strategy Looks to enter a trend early on Anticipates
PART 3 - CHART PATTERNS & TECHNICAL INDICATORS
 Tyler Chianelli s EASYOPTIONTRADING by OPTION TRADING COACH PART 3 - CHART PATTERNS & TECHNICAL INDICATORS A SIMPLE SYSTEM FOR TRADING OPTIONS WORKS IN UP, DOWN, AND SIDEWAYS MARKETS PART 3.1 - PRIMARY
The goal for Part One is to develop a common language that you and I
 PART ONE Basic Training The goal for Part One is to develop a common language that you and I can use. The rest of the book will discuss how the technical indicators highlighted in the first two chapters
Darvas Trading - Defining the Trend
 Daryl Guppy In Association With www.nicolasdarvastrading.com Darvas Trading - Defining the Trend with Volatility 22 Hibernia Cres, Brinkin, Box 40043, Casuarina, Northern Territory, Australia, 0811 Phone
The Schaff Trend Cycle
 The Schaff Trend Cycle by Brian Twomey This indicator can be used with great reliability to catch moves in the currency markets. Doug Schaff, president and founder of FX Strategy, created the Schaff trend
MULTI-TIMEFRAME TREND TRADING
 1. SYNOPSIS The system described is a trend-following system on a slow timeframe that uses optimized (that is, contrarian) entries and exits on a fast timeframe at the tops and bottoms of retraces against
FOREX PROFITABILITY CODE
 FOREX PROFITABILITY CODE Forex Secret Protocol Published by Old Tree Publishing CC Suite 509, Private Bag X503 Northway, 4065, KZN, ZA www.oldtreepublishing.com Copyright 2013 by Old Tree Publishing CC,
1. Accumulation Swing Index
 1. Accumulation Swing Index The Accumulation Swing Index (Wilder) is a cumulative total of the Swing Index. The Accumulation Swing Index may be analyzed using technical indicators, line studies, and chart
Using Oscillators & Indicators Properly May 7, Clarify, Simplify & Multiply
 Using Oscillators & Indicators Properly May 7, 2016 Clarify, Simplify & Multiply Disclaimer U.S. Government Required Disclaimer Commodity Futures Trading Commission Futures and Options trading has large
Forexsignal30 Extreme ver. 2 Tutorials
 Forexsignal30 Extreme ver. 2 Tutorials Forexsignal30.com is a manual trading system that is composed of several indicators that mutually cooperate with each other. Very difficult to find indicators that
Williams Percent Range
 Williams Percent Range (Williams %R or %R) By Marcille Grapa www.surefiretradingchallenge.com RISK DISCLOSURE STATEMENT / DISCLAIMER AGREEMENT Trading any financial market involves risk. This report and
Buy rules: Sell rules: Strategy #2. Martingale hedging with exponential lot increase... 6
 Contents Introduction... 2 Data... 2 Short instructions on how to use Forex Tester.... 2 Sum up... 3 STRATEGIES... 3 Martingale strategies... 3 Strategy #1. Martingale Grid & Hedging... 4 Buy rules:...
IronFX. technical indicators
 IronFX technical indicators Average Directional Index (ADX) The Average Directional Index (ADX) helps traders see if a trend is developing in the charts and whether the trend is strengthening or weakening.
1. Introduction 2. Chart Basics 3. Trend Lines 4. Indicators 5. Putting It All Together
 Technical Analysis: A Beginners Guide 1. Introduction 2. Chart Basics 3. Trend Lines 4. Indicators 5. Putting It All Together Disclaimer: Neither these presentations, nor anything on Twitter, Cryptoscores.org,
Methodology. Our team of analysts uses technical and chartist analysis to draw an opinion and make decisions. The preferred chartist elements are:
 Methodology Technical analysis is at the heart of TRADING CENTRAL's expertise. Our methodology is proven. Our chartist and quantitative approach allows us to intervene on different investment horizons.
Technical Analysis Workshop Series. Session Ten Semester 2 Week 4 Oscillators Part 1
 Technical Analysis Workshop Series Session Ten Semester 2 Week 4 Oscillators Part 1 DISCLOSURES & DISCLAIMERS This research material has been prepared by NUS Invest. NUS Invest specifically prohibits the
Understanding Oscillators & Indicators March 4, Clarify, Simplify & Multiply
 Understanding Oscillators & Indicators March 4, 2015 Clarify, Simplify & Multiply Disclaimer U.S. Government Required Disclaimer Commodity Futures Trading Commission Futures and Options trading has large
TD AMERITRADE Technical Analysis Night School Week 2
 TD AMERITRADE Technical Analysis Night School Week 2 Hosted By Derek Moore Director, National Education For the audio portion of today s webcast, please enable your computer speakers. Past performance
Martin J. Pring President of Pring.com
 Martin J. Pring President of Pring.com How to Manage Risk Using Technical Analysis The first trading objective is to preserve capital #1 Trading rule Cut losses quickly, let profits run. First trade 50%
Technical analysis & Charting The Foundation of technical analysis is the Chart.
 Technical analysis & Charting The Foundation of technical analysis is the Chart. Charts Mainly there are 2 types of charts 1. Line Chart 2. Candlestick Chart Line charts A chart shown below is the Line
Options Mastery Day 1 System Training
 Options Mastery Day 1 System Training Day 1 Agenda 10:00-10:15 - Intro & Course Outline 10:15-11:00 Indicator Overview and Setup 11:00-11:15 - Break 11:15-12:15 - Active Swing Trader Training 12:15-12:30
Intra-Day Trading Techniques
 Pristine.com Presents Intra-Day Trading Techniques With Greg Capra Co-Founder of Pristine.com, and Co-Author of the best selling book, Tools and Tactics for the Master Day Trader Copyright 2001, Pristine
Walter Bressert, Inc.
 Walter Bressert, Inc. http://www.walterbressert.com mailto:info@walterbressert.com Copyright Walter Bressert, Inc. All rights reserved. 1 PROFITTRADER for METASTOCK END-OF-DAY AND INTRA VERSIONS The EOD
With that, let s dive into the steps. Step 1 Identify range bound markets on Daily or 4 Hour Charts
 If you have been trading for any length of time, you have probably noticed that the markets are moving sideways A LOT. Consolidation is a huge part of the market s balance and so it makes sense to learn
Quad EMA Strategy. by Admiral Markets Trading Camp
 Quad EMA Strategy by Admiral Markets Trading Camp Contents About the Author 3 Strategy Description 4 Exponential Moving Average 5 Awesome Oscillator 9 MACD Indicator 13 Conclusion 19 About the Author Nenad
The Trifecta Guide to Technical Analysis 1
 The Trifecta Guide to Technical Analysis 1 No trading system is bullet-proof. The list of factors that can impact a stock s share price is long and growing from investor sentiment to economic growth to
Notices and Disclaimer
 Part 2 March 14, 2013 Saul Seinberg Notices and Disclaimer } This is a copyrighted presentation. It may not be copied or used in whole or in part for any purpose without prior written consent from the
Brainy's Trading News and BullCharts Tips Monthly e-newsletters
 Brainy's Trading News and BullCharts Tips Monthly e-newsletters 24 Nov 2008 Special preview of Brainy's monthly articles This pdf file contains only the first page of each of the articles that are available
INDICATORS. The Insync Index
 INDICATORS The Insync Index Here's a method to graphically display the signal status for a group of indicators as well as an algorithm for generating a consensus indicator that shows when these indicators
What is Technical Analysis
 Reg. office: International School of Financial Market, Plot no. 152 - P (LGF), Sec - 38, Medicity Road, Gurgaon - 122002 Contact no. : 0124-2200689,+919540008689, 9654446629 Web : www.isfm.co.in, Email
Presents FOREX ALPHA CODE
 Presents FOREX ALPHA CODE Forex Alpha Code Published by Alaziac Trading CC Suite 509, Private Bag X503 Northway, 4065, KZN, ZA www.tradeology.com Copyright 2014 by Alaziac Trading CC, KZN, ZA Reproduction
Market Observations as of Mar 2, 2018
 Market Observations as of Mar 2, 2018 By Carl Jorgensen - For Objective Traders - For educational purposes only. Not Financial Advice. The markets were mixed this week as volatility raised its head back
JOURNAL INTRODUCING THE HPO ROBERT KRAUSZ'S. Volume 2, Issue 2. ear Trader,
 ROBERT KRAUSZ'S JOURNAL INTRODUCING THE HPO TM ear Trader, D First, I would like to introduce myself. My name is Thom Hartle (www.thomhartle.com) and I have put together this latest issue of the FT Journal.
Andrew s Trade Ideas Scanners
 Andrew s Trade Ideas Scanners This document contains the parameters and filters for each of Andrew s Trade Ideas Scanners. It is for information purposes only. The contents up this document may not be
Three Techniques for Spotting Market Twists and Turns. Riding the Roller
 Three Techniques for Spotting Market Twists and Turns Riding the Roller Coaster Learn to Spot the Twists and Turns Whether you re new to forex or you ve been trading a while, you know how the unexpected
.. /-!"::- '..- ( \.- - '-/../ '
 ....'-/ -!"::- ' ( \.-../ ' /- Triple Shot Forex Trading System The term "Day Trading" usually refers to the act of buying and selling a financial instrument within the same day. In the Forex market, a
Foxzard Trader MT4 Expert Advisor Manual Contents
 Foxzard Trader MT4 Expert Advisor Manual Contents Foxzard Trader MT4 Expert Advisor Manual... 1 Overview... 3 Features... 3 Installation Guide... 3 User Interface... 4 Input Parameters and Default Values...
I prefer to use the CCI indicator to trade divergences and it has worked well for me over the past 10 years.
 Make 100 pips Trading Divergences. There are several ways to trade divergences and several indicators that can help you identify the divergence between price and the indicator itself. I prefer to use the
CFD Marketmaker v5.0 New Charting User Guide. 7 th June 2005 v1.2
 CFD Marketmaker v5.0 New Charting User Guide 7 th June 2005 v1.2 Contents Page Introduction...3 Charting...4 How to View a Chart... 4 Main Chart Window... 6 Date/Time & Value where the mouse is... 6 Value
An Overview of the ZMA : The Superior Moving Average Page 2. ZMA Indicator: Infinite Flexibility and Maximum Adaptability Page 4
 An Overview of the ZMA : The Superior Moving Average Page 2 ZMA Indicator: Infinite Flexibility and Maximum Adaptability Page 4 ZMA PaintBar: Moving Average Color-Coding Page 5 Responsiveness and Inertia:
Main Client Screen. Main Screen - Quick Key
 Main Client Screen 1 2 3 4 5 6 7 8 9 10 11 12 13 Main Screen - Quick Key 1. Dealing Boxes: one per currency pair; view real time bid/ask rates; click on the BUY or SELL to instantaneously execute a trade.
Gambit Trading Suite Setup Guide. V2.31 PUBLIC BETA March 2017
 Gambit Trading Suite Setup Guide V2.31 PUBLIC BETA March 2017 Gambit Trading Suite - Intro The Gambit Trading Suite is a set of indicators developed in Pine script to be used on Tradingview.com. The goal
Presents. Forex Profit Boost
 Presents Forex Profit Boost Forex Profit Boost Published by Alzaiak Trading CC Nominee Old Tree Publishing CC Suite 509, Private Bag X503 Northway, 4065, KZN, ZA www.oldtreepublishing.com Copyright 2014
TOP 3 INDICATOR BOOT CAMP: PERCENT R
 BIGTRENDS.COM TOP 3 INDICATOR BOOT CAMP: PERCENT R PRICE HEADLEY, CFA, CMT Let s Get Started! Educate Understand the tools you have for trading. Learn what this indicator is and how you can profit from
Intermediate-a? SPX2533
 Summary Based on the prior week s price action, I found in last week s digest uncertainty has increased once again on where the market exactly is from and EWT-count perspective. The standard impulse (preferred),
Moving Averages, CrossOvers and the MACD
 Moving Averages, CrossOvers and the MACD October 14, 2017 Introduction: Moving averages are the most widely used indicators in technical analysis, and help smoothing out short-term fluctuations (or volatility)
Technical Analysis Indicators
 Technical Analysis Indicators William s Percent R Rules, Scans, Adding Filters, Breakout, Retest, and Application across MTFs Course Instructor: Price Headley, CFA, CMT BigTrends Coaching Access to BigTrends
The One Path Trading System. The foundation of the trading system is Supply and Demand and Support and Resistance.
 The One Path Trading System This trading system is based on Price Action read done by the indicators to make trading simpler and more automated for the trader. All the calculations that are performed in
IMV Commodity: Agro Technical Update
 IMV Commodity: Agro Technical Update From Research Desk In July future: Soya bean Rmseed Castor seed Guar seed Jeera Dhaniya Turmeric (Follow-up update) Cotton Seed Oil Cotton IMV Commodity Research Desk
Software user manual for all our indicators including. Floor Traders Tools & TrendPro
 Software user manual for all our indicators including Floor Traders Tools & TrendPro All the software was designed and developed by Roy Kelly ARC Systems, Inc. 1712 Pioneer Ave Ste 1637 Cheyenne, WY 82001
Instruction (Manual) Document
 Document") Instruction (Manual) Document This part should be filled by author before your submission. 1. Information about Author Your Surname Your First Name Your Country Your Email Address Your ID on our website
Instruction (Manual) Document This part should be filled by author before your submission. 1. Information about Author Your Surname Your First Name Your Country Your Email Address Your ID on our website
No-BS Trading System
 No-BS Trading System Techniques The Professionals Don t Want To Be Revealed DISCLAIMER U.S. Government Required Disclaimer - Commodity Futures Trading Commission Futures and Options trading has large potential
Maybank IB. Understanding technical analysis. by Lee Cheng Hooi. 24 September Slide 1 of Maybank-IB
 Maybank IB Understanding technical analysis 24 September 2011 by Lee Cheng Hooi Slide 1 of 40 Why technical analysis? 1) Market action discounts everything 2) Prices move in trends 3) History repeats itself
Dr. Elder s. Enhanced Trading Room. MetaStock. Add-on Manual. Printed in the USA All Rights Reserved Copyright 2017 Elder.
 Dr. Elder s Enhanced Trading Room MetaStock Add-on Manual Printed in the USA All Rights Reserved Copyright 2017 Elder.com and John Bruns MetaStock 4548 South Atherton Dr, Suite 200 Salt Lake City, UT 84123
Subject: Daily report explanatory notes, page 2 Version: 0.9 Date: Dec 29, 2013 Author: Ken Long
 Subject: Daily report explanatory notes, page 2 Version: 0.9 Date: Dec 29, 2013 Author: Ken Long Description Example from Dec 23, 2013 1. Market Classification: o Shows market condition in one of 9 conditions,
Icoachtrader Consulting Service WELCOME TO. Trading Boot Camp. Day 5
 Icoachtrader Consulting Service www.icoachtrader.weebly.com WELCOME TO Trading Boot Camp Day 5 David Ha Ngo Trading Coach Phone: 1.650.899.1088 Email: icoachtrader@gmail.com The information presented is
Written by Rahul Mohindar
 Your complete guide for using the ATM PowerScreener & RMO ATM add-on for MetaStock Written by Rahul Mohindar Copyright 2016 VIRATECH SOFTWARE & COMMUNICATIONS LTD. Disclaimer The ATM PowerScreener Product
TRADING ADDICTS. Lesson 3: Timing and Technical Indicators. Timing the Market. Copyright 2010, Trading Addicts, LLC. All Rights Reserved
 Lesson 3: Timing and Technical Indicators In this chapter, we will be focusing on the timing of the trade, from each individual angle. Timing plays a critical role in a Covered Call strategy, as it can
Chapter 24 DIVERGENCE DECISIONS
 Chapter 24 DIVERGENCE DECISIONS The subject of divergence is one that we will approach with the utmost caution. We hope we have made ourselves clear in the other volumes of this course that we have little
Indicators Manual. Genesis Financial Technologies Inc. Finally Strategy Development and Back Testing Just Got Easier!
 s Manual Genesis Financial Technologies Inc. Finally Strategy Development and Back Testing Just Got Easier! KEY : 5 TRADE NAVIGATOR INDICATORS: 6 ACCUMULATION/DISTRIBUTION 6 ADOSC 7 ADX 8 ADXMOD 9 ADXR
IndiaNivesh Weekly Pulse
 23rd Feb 2018 IndiaNivesh Weekly Pulse RETAIL TECHNICAL RESEARCH The closing of Feb 2018 might decide the fate of the markets! Close 10491 Chart 1 : Nifty Daily & Hourly R1 / R2 10630/ 10700 S1 / S2 10276/
RISK DISCLOSURE STATEMENT / DISCLAIMER AGREEMENT
 RISK DISCLOSURE STATEMENT / DISCLAIMER AGREEMENT Trading any financial market involves risk. This report and all and any of its contents are neither a solicitation nor an offer to Buy/Sell any financial
Technical Analysis for Options Trading. Fidelity Brokerage Services LLC, Member NYSE, SIPC, 900 Salem Street, Smithfield, RI
 Technical Analysis for Options Trading Fidelity Brokerage Services LLC, Member NYSE, SIPC, 900 Salem Street, Smithfield, RI 02917 747561.2.0 Disclosures Options trading entails significant risk and is
Stay on the Right Side & Finishing the Year Strong! From the Active Trend Trader
 Stay on the Right Side & Finishing the Year Strong! From the Active Trend Trader Disclaimer U.S. GOVERNMENT REQUIRED DISCLAIMER COMMODITY FUTURES TRADING COMMISSION FUTURES AND OPTIONS TRADING HAS LARGE
Profiting. with Indicators. By Jeff Drake with Ed Downs
 Profiting with Indicators By Jeff Drake with Ed Downs Profiting with Indicators By Jeff Drake with Ed Downs Copyright 2018 Nirvana Systems Inc. All Rights Reserved The charts and indicators used in this
EDUCATIONAL MATERIAL What Is Forex
 EDUCATIONAL MATERIAL What Is Forex Forex trading is the buying and the selling of specific currency pairs. TOGETHER WE REACH THE GOAL The foreign exchange or 'Forex Market' is the world's largest financial
Advance Certificate in Trading : A PROGRAM FOR SELF-INVESTORS
 Advance Certificate in Trading : A PROGRAM FOR SELF-INVESTORS [Stock Commodity-Forex] Duration: 4 Months Fee: 33,000 + Service Tax Training: Weekends / Weekdays Certifications: Certified Trader Certificate
In here, you will learn the trading rules on how to use trade teh 200 exponential moving average with the Awesome Oscillator Indicator.
 Trading Strategy / Gert.Nurme@iBrokers.ee 200 EMA with Awesome Oscillator Introduction The 200 EMA With Awesome Oscillator Forex Trading Strategy is a very simple trend trading system and therefore in
CMT LEVEL I CURRICULUM Self-Evaluation
 CMT LEVEL I CURRICULUM Self-Evaluation DEAR CFA CHARTERHOLDER, As a CFA charterholder, the requirement that you sit for the CMT Level I exam is waived. However, the content in the CMT Level I Curriculum
Find Elusive MACD Divergences Easily
 Find Elusive MACD Divergences Easily By using a Custom TradeStation Workspace After following these instructions, you will have Charts displaying MACD lines and histogram which highlight price/indicator
Raising Investment Standards TRADING SEMINAR
 Raising Investment Standards TRADING SEMINAR Raising Investment Standards DISCLAIMER Leveraged foreign exchange and options trading carries a significant level of risk, and may not be suitable for all
BUY SELL PRO. Improve Profitability & Reduce Risk with BUY SELL Pro. Ultimate BUY SELL Indicator for All Time Frames
 BUY SELL PRO Improve Profitability & Reduce Risk with BUY SELL Pro Ultimate BUY SELL Indicator for All Time Frames Risk Disclosure DISCLAIMER: Crypto, futures, stocks and options trading involves substantial