Martin J. Pring President of Pring.com
|
|
|
- Nora Clark
- 6 years ago
- Views:
Transcription

1 Martin J. Pring President of Pring.com How to Manage Risk Using Technical Analysis
2 The first trading objective is to preserve capital
3 #1 Trading rule Cut losses quickly, let profits run.
4 First trade 50% loss!
5 Next trade 50% gain
6 Next 3 trades make 10% each
7 Next 4 trades make 80%
8 Still not back to break even
9 A key trading rule is always run scared.
10 The number one decision when entering a trade is to know where you are going to get out if the market goes against you.
11 That means setting stops ahead of time and changing them when appropriate.
12 Best place to place stops is above resistance or below support.
13 ..so what are support and resistance?
14 Support is where a declining trend can be expected to halt, temporarily, due to a concentration of demand.
15 Resistance is where an advancing trend can be expected to halt, temporarily, due to a concentration of supply.
16 Support and resistance areas are not predictors of where prices will reverse, but merely indicate possible, or probable, points.
17 1. Previous low is a good point to expect support A Support has been violated "
18 A " B
19 A " B C New support level
20 2. Support reverses its role to resistance on the way back up A Resistance B C
21 A B C
22 Previous support is now A B C potential resistance
23 3. Resistance reverses its role to support on the way down. A Support again B C
24 Rules for Determining Significance of Support/Resistance Zones: 1. The more times a zone has been able to halt or reverse a price trend, the greater its significance. 2.The steeper the price move preceding a given support or resistance zone, the greater its significance. 3.The more a security changes hands at a particular level, the more significant that level is likely to be as a support or resistance zone.
25 Where are Support/Resistance Points Likely to Develop? 1. Previous highs and lows.
26 Oracle High could be resistance Support at previous low Declining platform
27 Oracle Support at previous low Declining platform
28 Oracle Declining platform
29 Oracle Now support Declining platform
30 Oracle High could be resistance Declining platform
31 Oracle Declining platform
32 Oracle Declining platform
33 Where are Support/Resistance Points Likely to Develop? 1. Previous highs and lows. 2.The upper and lower area of gaps often represent crucial support/resistance pivotal points.
34 Oracle Support and resistance form at gap openings and closings. Declining Support platform at gap opening
35 Comcast Attempt to close the gap
36 Chiron Gap is closed and upper end is resistance
37 Where are Support/Resistance Points Likely to Develop? 1. Previous highs and lows. 2.The upper and lower area of gaps often represent crucial support/resistance pivotal points. 3. Emotional points on charts
38 Boeing Weekly Emotional point
39 Boeing Weekly Once violated, a violent drop
40 Boeing Weekly Resistance again
41 Where are Support/Resistance Points Likely to Develop? 1. Previous highs and lows. 2.The upper and lower area of gaps often represent crucial support/resistance pivotal points. 3. Emotional points on charts 4. Trendlines and MA s represent potential support/resistance zones.
42 Hewlett Packard Daily
43 Hewlett Packard Daily 50-day MA
44 Hewlett Packard Daily
45 Hewlett Packard Daily Price moves above previous high and MA.
46 Hewlett Packard Daily 200-day MA Intersection of good trendline and reliable MA = massive potential support/resistance.
47 Where are Support/Resistance Points Likely to Develop? 5.Retracement points for previous moves; e.g., 50% Fibonacci retracement levels, etc.
48 Dollar General
49 ebay
50 Key Places to Place Stops for Long Positions 1. Below a previous low 2. Below the extreme low of an emotional bar. 3. Below an up trendline 4. Below a reliable MA 5. On a breakout from a price pattern. 6. Better still when more than one of these conditions is met.
51 Key Places to Place Stops for Short Positions 1. Above a previous high. 2. Above the extreme high of an emotional bar. 3. Above a down trendline. 4. Above a reliable MA. 5. On a breakout from a price pattern. 6. Better still when more than one of these conditions is met.
52 Buy on breakout Dollar/Yen 10-minute bar
53 Dollar/Yen 10-minute bar Buy on breakout Place stop below support Buy just above support where trendlines converge.
54 Dollar/Yen 10-minute bar Sell
55 Dollar/Yen 10-minute bar Place stop above previous high Sell Sell into resistance at a better price.
56 Dollar/Yen 10-minute bar Lower original stop just above previous high and trendline.
57 Dollar/Yen 10-minute bar Lower stop just above trendline.
58 Australian/US Dollar 4-hour bar Whipsaws
59 Australian/US Dollar 4-hour bar Trendline reinforces MA. And again Both act as support.
60 Australian /US Dollar 4-hour bar Extreme point
61 Australian /US Dollar 4-hour bar Extreme point Extreme point
62 Australian/US Dollar 4-hour bar Stop placed above trendline Head and shoulders Whipsaw break
63 Australian/US Dollar 4-hour bar Downside break
64 Australian/US Dollar 4-hour bar Upward zig zags
65 Dollar/yen 30-minute bar False breakout (two bar reversal) Place stop below trendline or the previous minor low.
66 Dollar/yen 4-hour bar Exhaustion break Later on place stop above trendline. Go short using placing stop above the exhaustion high.
67 Using Oscillators with Trend Following Techniques
68 A key problem, is never knowing whether a market is likely to trend or become a trading range.
69 One solution...split the trade into two parts.
70 Liquidation of one part is triggered by a momentum signal, the other by a trend following signal.
71 Sell one unit when the oscillator reaches an extreme reading and...
72 ...sell the second on a moving average crossover.
73 If the oscillator never reaches an extreme, sell both units on a moving average crossover.
74 S&P 30-minute close Liquidate 2 nd unit on MA crossover Take partial profit Buy 2 units 30-period price oscillator
75 S&P 30-minute close 1 st unit 2 nd unit 30-period price oscillator
76 S&P 30-minute close Sell 2 nd unit Sell 1 st unit 30-period price oscillator Buy
77 S&P 30-minute close 2nd unit 1 st unit 30-period price oscillator
78 Introducing the parabolic
79 The parabolic requires two parameters. 1. The speed of the move. 2. The maximum unit by which it can be increased or decreased.
80 S&P 30-minute close Buy Risk Place stop The parabolic curve
81 S&P 30-minute close Sell Risk Stop moves progressively higher.
82 S&P 30-minute close
83 S&P 30-minute close Cover second unit Go short on MA crossover Cover 1 st unit
84 S&P 30-minute close Parabolic MA
85 S&P 30-minute close
86 S&P 30-minute close Sell 2 nd unit Sell 1 st unit Buy
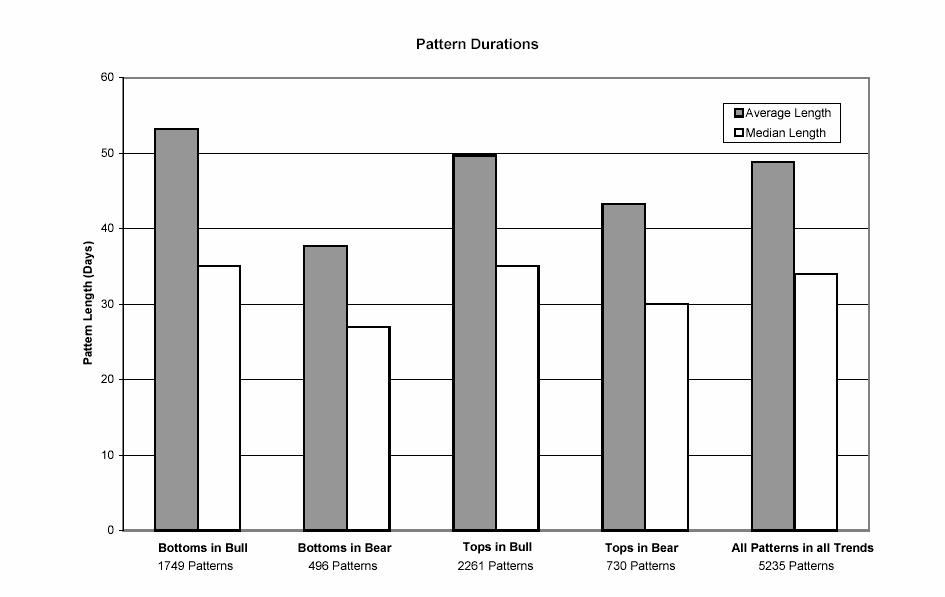
87 How do price patterns test?
88 Guidelines 1. Head and shoulders, and double tops and bottoms, were tested. 2. Financial, energy, transportation, and retail sectors were tested between Primary bull and bear markets were identified.
89
90 Nice result
91 Scary decline following the breakout.
92 H S S
93 H S S
94 The concept of L
95 50-days S H S
96 50-days 50-days 1L S H S
97 50-days 100-days 2L S H S
98 100% objective 50-days 50-days 1L S H S
99 200% objective 100% objective 50-days 100-days 2L S H S
100 1L
101 1L 5L
102 Primary bear market Bullish breakout in a bear market. S H S
103 496 Bottom Patterns in a Bear Trend Bullish signals in a bear market 5L in Bear Markets
104 496 Bottom Patterns in a Bear Trend 5L in Bear Markets 5L in Bull Markets
105 Pointers for a Primary Bull Market 1. Positive long-term KST. 2. Security should be above its long-term (e.g.,200-day) MA. Click here for online KST education. If you cannot open the click here hyperlink, hold down the Control key (Ctrl) and click again.

106 H&S Bottom

107 H&S Bottom Momentum and Stochastic not overbought at breakout time

108 Double Bottom Stop loss line

109 H&S Bottom

110 Double Bottom
111 The End
Martin Pring s. Weekly InfoMovie Report. April 8, 2014
 Martin Pring s Weekly InfoMovie Report April 8, 2014 Issue 1093 Weekly InfoMovie Report 1 Key level remains $184 on the SPY. US Equity Market - Last time I pointed out that the $184 level on the S&P ETF
OSCILLATORS. TradeSmart Education Center
 OSCILLATORS TradeSmart Education Center TABLE OF CONTENTS Oscillators Bollinger Bands... Commodity Channel Index.. Fast Stochastic... KST (Short term, Intermediate term, Long term) MACD... Momentum Relative
What Would It Take to Trigger a Secular Reversal in Bond Yields?
 What Would It Take to Trigger a Secular Reversal in Bond Yields? January 18, 2018 by Martin Pring of Pring Turner Capital Group In the fall of 1981, the twenty-year US bond yield peaked slightly above
Martin Pring s. Weekly InfoMovie Report. December 27, Happy New Year to Our Wonderful Subcriber Family! May 2013 be Prosperous and Productive!
 Martin Pring s Weekly InfoMovie Report December 27, 2012 Issue 1028 Happy New Year to Our Wonderful Subcriber Family! May 2013 be Prosperous and Productive! The Pring Family ~ 2012 Weekly InfoMovie Report
Martin Pring s. Weekly InfoMovie Report. December 19, 2012
 Martin Pring s Weekly InfoMovie Report December 19, 2012 Issue 1027 Merry Christmas to All! And may 2013 bring joyous Blessings and your Family know Joy and Peace! The Pring Family ~ 2012 Weekly InfoMovie
INTERMEDIATE EDUCATION GUIDE
 INTERMEDIATE EDUCATION GUIDE CONTENTS Key Chart Patterns That Every Trader Needs To Know Continution Patterns Reversal Patterns Statistical Indicators Support And Resistance Fibonacci Retracement Moving
Table of Contents. Risk Disclosure. Things we will be going over. 2 Most Common Chart Layouts Anatomy of a candlestick.
 Table of Contents Risk Disclosure Things we will be going over 2 Most Common Chart Layouts Anatomy of a candlestick Candlestick chart Anatomy of a BAR PLOT Indicators Trend-Lines Volume MACD RSI The Stochastic
Martin Pring s. Weekly InfoMovie Report. April 12, 2012
 Martin Pring s Weekly InfoMovie Report April 12, 2012 Issue 993 Weekly InfoMovie Report 1 Bearish US Equity Market - Last week I pointed out that this up trendline for the diffusion indicator monitoring
BUY SELL PRO. Improve Profitability & Reduce Risk with BUY SELL Pro. Ultimate BUY SELL Indicator for All Time Frames
 BUY SELL PRO Improve Profitability & Reduce Risk with BUY SELL Pro Ultimate BUY SELL Indicator for All Time Frames Risk Disclosure DISCLAIMER: Crypto, futures, stocks and options trading involves substantial
Homework Assignment #1 - Based on the MTAEF Glossary of Technical Terms
 Homework Assignment #1 - Based on the MTAEF Glossary of Technical Terms Each block of 3 question is preceded by 5 technical terms. Fill in the blank and make the statement complete. There is only one correct
Introduction. Technicians (also known as quantitative analysts or chartists) usually look at price, volume and psychological indicators over time.
 usually look at price, volume and psychological indicators over time.") Technical Analysis Introduction Technical Analysis is the study of market action, primarily through the use of charts, for the purpose of forecasting future price trends. Technicians (also known as quantitative
Technical Analysis Introduction Technical Analysis is the study of market action, primarily through the use of charts, for the purpose of forecasting future price trends. Technicians (also known as quantitative
Technical analysis & Charting The Foundation of technical analysis is the Chart.
 Technical analysis & Charting The Foundation of technical analysis is the Chart. Charts Mainly there are 2 types of charts 1. Line Chart 2. Candlestick Chart Line charts A chart shown below is the Line
Trading EveryDay reserves the right to change this privacy statement at any time. Be sure to check this page periodically for updates.
 This content is provided by The Trading EveryDay Group, LLC. This site, including its contents, is provided "as educational content only" without warranty or guarantee of any kind, either expressed or
 Jack Schwager s Planned Trading Approach 1.Define your trading philosophy or system 2. Choose your markets to be traded 3. Specify your risk parameters A. Minimum risk per trade B. Stop loss strategy C.
Technical Analysis. Dealing Room Peter Leonidou. Peter Leonidou
 Technical Analysis Dealing Room Questions Traders Should Ask What is the trend? What is the pivot point? What is the support levels? What is the resistance levels? Strong or weaker USD? What 1. Trade
Figure 3.6 Swing High
 Swing Highs and Lows A swing high is simply any turning point where rising price changes to falling price. I define a swing high (SH) as a price bar high, preceded by two lower highs (LH) and followed
Stacking Indicators Getting a GREAT entry! TWEEZERS Tweezer top/bottom at the band The stock is trending up Gap down (against the trend) Any moving
 Any moving") Dean Storholt I am not a registered broker-dealer or investment adviser. I will mention that I consider certain securities or positions to be good candidates for the types of strategies we are discussing
Dean Storholt I am not a registered broker-dealer or investment adviser. I will mention that I consider certain securities or positions to be good candidates for the types of strategies we are discussing
Technical Analysis and Charting Part II Having an education is one thing, being educated is another.
 Chapter 7 Technical Analysis and Charting Part II Having an education is one thing, being educated is another. Technical analysis is a very broad topic in trading. There are many methods, indicators, and
Introduction. Technical analysis is the attempt to forecast stock prices on the basis of market-derived data.
 Technical Analysis Introduction Technical analysis is the attempt to forecast stock prices on the basis of market-derived data. Technicians (also known as quantitative analysts or chartists) usually look
TOP 3 INDICATOR BOOT CAMP: PERCENT R
 BIGTRENDS.COM TOP 3 INDICATOR BOOT CAMP: PERCENT R PRICE HEADLEY, CFA, CMT Let s Get Started! Educate Understand the tools you have for trading. Learn what this indicator is and how you can profit from
Apiary Fund Trading Plan
 Apiary Fund Trading Plan Position Size Always set stop < 2% of account balance. 75% of trades should be between.5% and 1% of account balance. Chart Setup OSMA and SMA Strategy Chart Setup Monitor and focus
Stock Market Basics Series
 Stock Market Basics Series HOW DO I TRADE STOCKS.COM Copyright 2012 Stock Market Basics Series THE STOCHASTIC OSCILLATOR A Little Background The Stochastic Oscillator was developed by the late George Lane
Moving Average Convergence Divergence (MACD) by
 by") Moving Average Convergence Divergence (MACD) by www.surefire-trading.com Ty Young Hi, this is Ty Young with Surefiretrading.com and today we will be discussing the Moving Average Convergence/Divergence
Moving Average Convergence Divergence (MACD) by www.surefire-trading.com Ty Young Hi, this is Ty Young with Surefiretrading.com and today we will be discussing the Moving Average Convergence/Divergence
The six technical indicators for timing entry and exit in a short term trading program
 The six technical indicators for timing entry and exit in a short term trading program Definition Technical analysis includes the study of: Technical analysis the study of a stock s price and trends; volume;
Test Your Chapter 1 Knowledge
 Self-Test Answers Test Your Chapter 1 Knowledge 1. Which is the preferred chart type in LOCKIT? The preferred chart type in LOCKIT is the candle chart because candle patterns are part of the decision-making
Chapter 2.3. Technical Analysis: Technical Indicators
 Chapter 2.3 Technical Analysis: Technical Indicators 0 TECHNICAL ANALYSIS: TECHNICAL INDICATORS Charts always have a story to tell. However, from time to time those charts may be speaking a language you
THE CYCLE TRADING PATTERN MANUAL
 TIMING IS EVERYTHING And the use of time cycles can greatly improve the accuracy and success of your trading and/or system. THE CYCLE TRADING PATTERN MANUAL By Walter Bressert There is no magic oscillator
Williams Percent Range
 Williams Percent Range (Williams %R or %R) By Marcille Grapa www.surefiretradingchallenge.com RISK DISCLOSURE STATEMENT / DISCLAIMER AGREEMENT Trading any financial market involves risk. This report and
The Avalanche (Reverse for a Phoenix )
") The Avalanche (Reverse for a Phoenix ) The 6 Building Blocks of Price Development (Ideal Scenario): Momentum: Above average pace on the reversal from highs, followed by slower than average upside as support
The Avalanche (Reverse for a Phoenix ) The 6 Building Blocks of Price Development (Ideal Scenario): Momentum: Above average pace on the reversal from highs, followed by slower than average upside as support
Technical Analysis Workshop Series. Session Ten Semester 2 Week 4 Oscillators Part 1
 Technical Analysis Workshop Series Session Ten Semester 2 Week 4 Oscillators Part 1 DISCLOSURES & DISCLAIMERS This research material has been prepared by NUS Invest. NUS Invest specifically prohibits the
Technical Analysis Workshop Series. Session 11 Semester 2 Week 5 Oscillators Part 2
 Technical Analysis Workshop Series Session 11 Semester 2 Week 5 Oscillators Part 2 DISCLOSURES & DISCLAIMERS This research material has been prepared by NUS Invest. NUS Invest specifically prohibits the
Balance Of Market Power. Who s The Boss? Stocks & Commodities V. 19:8 (18-32): Balance Of Power by Igor Livshin INDICATORS
: Balance Of Power by Igor Livshin INDICATORS") INDICATORS Who s The Boss? MIKE YAPPS Balance Of Market Power Who s in charge, bulls or bears? It doesn t take higher-order math to get a good reading. T by Igor Livshin he balance of market power (BMP)
INDICATORS Who s The Boss? MIKE YAPPS Balance Of Market Power Who s in charge, bulls or bears? It doesn t take higher-order math to get a good reading. T by Igor Livshin he balance of market power (BMP)
The goal for Part One is to develop a common language that you and I
 PART ONE Basic Training The goal for Part One is to develop a common language that you and I can use. The rest of the book will discuss how the technical indicators highlighted in the first two chapters
EZ Trade FOREX Day Trading System. by Beau Diamond
 EZ Trade FOREX Day Trading System by Beau Diamond The EZ Trade FOREX Day Trading System is mainly used with four different currency pairs; the EUR/USD, USD/CHF, GBP/USD and AUD/USD, but some trades are
The very first calculations for average gain and average loss are simple 14- period averages.
 Introduction Developed by J. Welles Wilder, the Relative Strength Index (RSI) is a momentum oscillator that measures the speed and change of price movements. RSI oscillates between zero and 100. Traditionally,
Market Technical Analysis REPORT
 Market Technical Analysis REPORT using Integrated Pitchfork Analysis by Dr Mircea Dologa, MD, CTA MORNING of May 21st 2007 The traders must progressively monitor the conditions of the market movements
Wave-to-Wave Trading Analysis June 1, 2012
 Trading Wave-to-Wave 1 Wave-to-Wave Trading Analysis June 1, 2012 S&P 500 Index ETF (SPY) Successful traders understand that there are waves within waves 5-minute waves inside of 60-minute waves inside
2.0. Learning to Profit from Futures Trading with an Unfair Advantage! Income Generating Strategies Essential Trading Tips & Market Insights
 2.0 Learning to Profit from Futures Trading with an Unfair Advantage! Income Generating Strategies Essential Trading Tips & Market Insights Income Generating Strategies Essential Trading Tips & Market
What s the Canary in the Financial Coal Mine Saying?
 What s the Canary in the Financial Coal Mine Saying? December 22, 2015 by Martin Pring of Pring Turner Capital Group Credit spreads, which measure the relationship between bonds of different credit ratings,
Last Gasp in the Dollar. Market Update May 18, Seattle Technical Advisors
 SeattleTA provides investment managers with technical analysis of the equity, fixed-income, commodity, and currency markets. While equities are expected to take a hit this week, the big news is expected
Divergence and Momentum Trading
 presented by Thomas Wood MicroQuant SM Divergence Trading Workshop Day One Divergence and Momentum Trading Risk Disclaimer Trading or investing carries a high level of risk, and is not suitable for all
SOUTH ASIA CHARTSPEAK ISSUE 4 MARCH 2015 ISSUE 5, MAR 2015
 ISSUE 4 MARCH 2015 CONTENTS FX Technical outlook Pg USDINR Bias is for USD weakness till 63 holds 1 EURUSD Thrust is terminal; 1.07 is major support 2 GBPUSD Approaching the critical 1.4800 area 3 USDJPY
Stacking Indicators Getting a GREAT entry! TWEEZERS Tweezer top/bottom at the band The stock is trending up Gap down (against the trend) Any moving
 Any moving") Dean Storholt I am not a registered broker-dealer or investment adviser. I will mention that I consider certain securities or positions to be good candidates for the types of strategies we are discussing
Dean Storholt I am not a registered broker-dealer or investment adviser. I will mention that I consider certain securities or positions to be good candidates for the types of strategies we are discussing
Weekly outlook for Mar
 Weekly outlook for Mar. 26 30 2018 Summary The S&P500 index is expected to test February's low first and bounce from it before the Good Friday holiday. The end of the month and the end of the quarter may
How I Trade Profitably Every Single Month without Fail
 How I Trade Profitably Every Single Month without Fail First of all, let me take some time to introduce myself to you. I am Koon Hwee (KH Lee) and I am a full time currency trader. I have a passion for
Copyright Alpha Markets Ltd.
 Page 1 Trading Strategies - Module 3 Welcome to this unit on Trading Strategies. In this module we will be explaining the core components of a trading strategy and how you can begin to incorporate analysis
Trade Setups, Rules & Trading Strategies
 Trade Setups, Rules & Trading Strategies dba of FreeTradingVideos.com, Inc. v.1411 Using Technical Analysis to Enter, Manage and Exit Trades Quote of the Day At Grok Trade, we do not trade Trading Patterns.
Using Oscillators & Indicators Properly May 7, Clarify, Simplify & Multiply
 Using Oscillators & Indicators Properly May 7, 2016 Clarify, Simplify & Multiply Disclaimer U.S. Government Required Disclaimer Commodity Futures Trading Commission Futures and Options trading has large
Explanation of the 5 / 15-Minute Trading Rules
 5 / 15-Minute Trading Rules 1 Explanation of the 5 / 15-Minute Trading Rules Trading during the first ½ hour of the day can be very tricky and if one were able to gather all of the statistics for retail
Pattern Trader - December Trade Analysis, Trade Set-ups and Profit (Loss)
") Pattern Trader - December - 2015 - Trade Analysis, Trade Set-ups and Profit (Loss) Currency Pair: GBPJPY Entry Order: SELL stop @ 184.92 Stop loss: 185.37 Take profit: 181.18 Analysis: Since forming a
Pattern Trader - December - 2015 - Trade Analysis, Trade Set-ups and Profit (Loss) Currency Pair: GBPJPY Entry Order: SELL stop @ 184.92 Stop loss: 185.37 Take profit: 181.18 Analysis: Since forming a
Weekly outlook for May 21 - May 25, 2018
 Weekly outlook for May 21 - May 25, 2018 Summary The S&P500 index is expected to hold up for a higher level. The market broke to the upside from a symmetrical triangle pattern and is consolidating above
Scalp Trading Strategies
 Scalp Trading Strategies Services Disclaimer (for full disclosure, see Disclaimers section of website) Information Contained within our website and affiliates is not a substitute for professional advice
DAILY DAY TRADING PLAN
 DAILY DAY TRADING PLAN Gatherplace will be used to place all of your trades. You will be using the 5 minute chart for the trade setup and the 1 minute chart for your entry, stop and trailing stop.you will
12 th Oct2018. Gold Silver Copper Zinc Lead Aluminium Nickel Crude Oil Natural Gas. Bullion. Base Metal. Energy. Chana. Agro.
 12 th Oct2018 Bullion Base Metal Energy Agro Gold Silver Copper Zinc Lead Aluminium Nickel Crude Oil Natural Gas Chana Soybean Gold prices climbed almost 1.6% up on Thursday, regaining the psychologically
Interpreting Technical Indicators
 Interpreting Technical Indicators Copyright 1998, Optima Investment Research, Inc. All rights reserved. Reproduction of this material in any manner, including photocopying or electronic transmission via
TRADE SIGNALS POWERED BY AUTOCHARTIST
 SAXO TRADER GO TRADE SIGNALS POWERED BY AUTOCHARTIST Trade Signals is a SaxoTraderGO tool that uses Autochartist technology to identify emerging and completed patterns in most leading financial markets.
Chapter 2.3. Technical Indicators
 1 Chapter 2.3 Technical Indicators 0 TECHNICAL ANALYSIS: TECHNICAL INDICATORS Charts always have a story to tell. However, sometimes those charts may be speaking a language you do not understand and you
NIFTY. Momentum oscillator, RSI (14) is in bullish crossover which suggests index momentum to remain on the positive side.
 is in bullish crossover which suggests index momentum to remain on the positive side.") Date: 16 th July 2018 NIFTY The Nifty, which reversed its downwards trend in the previous week has continued rallying during the last week. Moreover, the Index has given a trend-line breakout on the weekly
Date: 16 th July 2018 NIFTY The Nifty, which reversed its downwards trend in the previous week has continued rallying during the last week. Moreover, the Index has given a trend-line breakout on the weekly
Ichimoku Charts How to read Clouds for Profitable Advantage
 Ichimoku Charts How to read Clouds for Profitable Advantage David Linton Updata david@updata.co.uk What I will cover General Points about Technical Analysis Theory, Cloud Construction, Interpretation Examples
Technical Analysis Indicators
 Technical Analysis Indicators William s Percent R Rules, Scans, Adding Filters, Breakout, Retest, and Application across MTFs Course Instructor: Price Headley, CFA, CMT BigTrends Coaching Access to BigTrends
Investing in the Second Lost Decade. IFTA Europe Martin J. Pring. Pring.com. PringTurner.com
 Investing in the Second Lost Decade IFTA Europe 2014 Martin J. Pring pring.com/ifta-2014.html 1. Copy of this presentation 2. Copy of article Is the Secular Bear Market About to Resume? 3. Copy of latest
Intermediate - Trading Analysis
 Intermediate - Trading Analysis Technical Analysis Technical analysis is the attempt to forecast currencies prices on the basis of market-derived data. Technicians (also known as quantitative analysts
10-Year Treasury Notes ($UST Price)
") 1 Weekly Inter-market Technical Report 10-Year Treasury Notes ($UST Price) Monthly Continuing from last week's report, bonds (notes) appear to be on a strong buy signal on the monthly chart, as price is
1 Weekly Inter-market Technical Report 10-Year Treasury Notes ($UST Price) Monthly Continuing from last week's report, bonds (notes) appear to be on a strong buy signal on the monthly chart, as price is
2.0. Learning to Profit from Futures Trading with an Unfair Advantage! Income Generating Strategies Starting the Trading Day
 2.0 Learning to Profit from Futures Trading with an Unfair Advantage! Income Generating Strategies Starting the Trading Day Income Generating Strategies Starting the Trading Day Pre-Market Analysis Before
TECHNICAL INDICATORS
 TECHNICAL INDICATORS WHY USE INDICATORS? Technical analysis is concerned only with price Technical analysis is grounded in the use and analysis of graphs/charts Based on several key assumptions: Price
TECHNICAL ANALYSIS. SURI DUDDELLA Trading Broadening Top/Bottom Patterns
 SURI DUDDELLA Trading Broadening Top/Bottom Patterns 8 Broadening top and bottom patterns are considered reversal patterns and usually appear at the major tops/ bottoms. Suri Duddella discusses how to
15 th March Gold Silver Copper Zinc Lead Aluminium Nickel Crude Oil Natural Gas Guar seed Castor seed. Bullion. Base Metal. Energy.
 15 th March 2018 Bullion Base Metal Energy Agro Gold Silver Copper Zinc Lead Aluminium Nickel Crude Oil Natural Gas Guar seed Castor seed On the daily chart MCX Gold price has given rising wedge breakdown
TRADE SIGNALS POWERED BY AUTOCHARTIST
 SAXO TRADER GO TRADE SIGNALS POWERED BY AUTOCHARTIST Trade Signals is a SaxoTraderGO tool that uses Autochartist technology to identify emerging and completed patterns in most leading financial markets.
What is Technical Analysis
 Reg. office: International School of Financial Market, Plot no. 152 - P (LGF), Sec - 38, Medicity Road, Gurgaon - 122002 Contact no. : 0124-2200689,+919540008689, 9654446629 Web : www.isfm.co.in, Email
Weekly outlook for June 12 June
 Weekly outlook for June 12 June 16 2017 TREND DIRECTION S&P 500 Oil Gold Short Term Intermediate-Term Long Term weak buy buy Weak neutral Strong sell buy buy buy Summary The S&P500 index is expected to
FIND THE SLAM DUNKS: COMBINE VSA WITH TECHNICAL ANALYSIS
 FIND THE SLAM DUNKS: COMBINE VSA WITH TECHNICAL ANALYSIS November 2006 By Todd Krueger In any competitive sports game there must be a specific set of boundaries for the game to make any sense. This actually
90 Days Trading Bonds
 90 Days Trading Bonds with Chip Cole 2015, All Rights Reserved. Order Flow Analytics, Inc. 1 Trading & Training chip@orderflowanalytics.com dbvaello@orderflowanalytics.com 2015, All Rights Reserved. Order
Monthly Dairy Technical Commentary August 19, 2015
 Monthly Dairy Technical Commentary August 19, 2015 CME Class III Milk Futures Range contraction continues for Class III Milk as it continues to correct the September 2014 through January 2015 downdraft.
Using Acceleration Bands, CCI & Williams %R
 Price Headley s Simple Trading System for Stock, ETF & Option Traders Using Acceleration Bands, CCI & Williams %R How Technical Indicators Can Help You Find the Big Trends For any type of trader, correctly
Technical Indicators versiunea
 Technical Indicators versiunea 2.0 03.10.2008 Contents 1 Price... 1 2 Charts... 1 2.1 Line, Step, Scatter, Histogram/Mountain charts 1 2.2 Open/High/Low/Close charts (Bar Charts)... 2 2.3 Candle charts...
Technical Chart Book. ANS Research Desk. Daily Report For, th Dec Weekly Price Outlooks of Various Indices
 ANS Research Desk ARHAM Financial Centre Harihar Chowk, RAJKOT (Guj) Speak to: 0281 6699401 Drop a line to: research@anspl.net Daily Report For, 26-30 th Dec 2011 Technical Chart Book Weekly Price Outlooks
Compiled by Timon Rossolimos
 Compiled by Timon Rossolimos - 2 - The Seven Best Forex Indicators -All yours! Dear new Forex trader, Everything we do in life, we do for a reason. Why have you taken time out of your day to read this
Trend Channels: How to Identify Easy Profit-Making Opportunities Using Simple Chart Analysis
 Trend Channels: How to Identify Easy Profit-Making Opportunities Using Simple Chart Analysis Trend channels produce a very powerful trading technique. They are very visible, which makes them easy to utilize
Weekly outlook for June 19 June
 Weekly outlook for June 19 June 23 2017 TREND DIRECTION Short Term Trend Intermediate-Term Trend Long Term Trend S&P 500 Oil Gold sideway Up Up down and oversold down down down and oversold soon Sideway
TRADING ACADEMY MODULE-3 TECHNICAL ANALYSIS SECTION-6 PRICE ACTION. LEVEL-1: THE COMPLETE GUIDE TO TRADING FOREX & CFDs
 TRADING ACADEMY LEVEL-1: THE COMPLETE GUIDE TO TRADING FOREX & CFDs MODULE-3 TECHNICAL ANALYSIS SECTION-6 PRICE ACTION TRADING ACADEMY LIMITED MODULE-3: TECHNICAL ANALYSIS SECTION-6: PRICE ACTION TRADING
5. Contract Seasonality
 5. Contract Seasonality The Importance of Incorporating Contract Seasonal Pricing into a Marketing Plan Presented By: Dr. Steve Amosson Regents Fellow Professor and Extension Economist Seasonal Price Patterns
Fintech $tocks. Chart Patterns & Algo. Trader. Trading Symmetric Triangle Patterns
 surinotes.com s Feb. 19, 2018 Chart Patterns & Algo. Trader Trading Symmetric Triangle Patterns A Weekly Publication Stocks/Futures/FX/Commodities Daily/Weekly/Monthly Analysis Auto Generated Chart Patterns/Analysis
6 TRADE SETUPS YOU CAN START USING RIGHT NOW. includes: Ryan's top charting patterns
 6 TRADE SETUPS YOU CAN START USING RIGHT NOW includes: Ryan's top charting patterns SharePlanner's Top Setups for TRADING LONG & SHORT Far too often we clutter our trading strategy with hundreds of different
TDP-Academy Trading SetupGuide
 TDP-Academy Trading SetupGuide Version 1.1. March 2017 Author: Boris Nikolajew & Wiktor Majorkiewicz INDEX 1. Foreword 2. Charts 3. Timeframes 4. Indicators 5. Drawings 6. Chartpatterns 7. Analyzing the
A Slowdown is in the Bag, but What About a Recession?
 A Slowdown is in the Bag, but What About a Recession? January 11, 2019 by Martin Pring of Pring Turner Capital Group There is little doubt that the US economy is in a state of slowdown. That s actually
Following Institutional Footprints
 Strategies Following Institutional Footprints Trading Expansions of Range and Volume Equity market cycles provide opportunity in every phase of liquidity. The greatest possibilities are evident when expansion-of-range-and-volume
Bollinger Trading Methods. Play 1 - The Squeeze
 Overview: Play 1 - The Squeeze Play 2 - The Trend Trade Play 3 - Reversals Wrap up Bollinger Trading Methods Play 1 - The Squeeze The Squeeze The most popular strategy Looks to enter a trend early on Anticipates
Intelligent Stock Monitor
 Intelligent Stock Monitor (by SHK Financial Data Ltd.) - 1 - Content 1. Technical Analysis 4 1.1 Chart 1.1.1 Line Chart 1.1.2 Bar Chart 1.1.3 Candlestick Chart 1.2 Technical Drawing Skills 1.2.1 Golden
Profiting. with Indicators. By Jeff Drake with Ed Downs
 Profiting with Indicators By Jeff Drake with Ed Downs Profiting with Indicators By Jeff Drake with Ed Downs Copyright 2018 Nirvana Systems Inc. All Rights Reserved The charts and indicators used in this
Date: 10 th Sep 2018 NIFTY
 Date: 10 th Sep 2018 NIFTY Indian market managed to close on positive note after it seen some selling pressure at the start of week on the back of rupee depreciation, higher crude prices and worries over
The Strategies Working Best in Today s E-Mini Market
 The Strategies Working Best in Today s E-Mini Market Todd Mitchell Craig Hill Legal Disclaimer No claim is made by Trading Concepts, Inc. that the trading strategies shown here will result in profits and
How To Read Charts Like A Pro Your guide to reading stock charts!
 How To Read Charts Like A Pro Your guide to reading stock charts! Courtesy of Swing-Trade-Stocks.com You may distribute this book FREELY or use it as part of a commercial package as long as this page and
Technical Analysis Workshop Series. Session Two
 Technical Analysis Workshop eries ession Two DICLOURE & DICLAIMER This research material has been prepared by NU Invest. NU Invest specifically prohibits the redistribution of this material in whole or
Trading the Hidden Divergence. Presented by Sunil Mangwani
 Trading the Hidden Divergence Indicators in technical analysis. Indicators along with chart patterns, trend lines, resistance / support levels etc., are an essential part of technical analysis. But there
1. Introduction 2. Chart Basics 3. Trend Lines 4. Indicators 5. Putting It All Together
 Technical Analysis: A Beginners Guide 1. Introduction 2. Chart Basics 3. Trend Lines 4. Indicators 5. Putting It All Together Disclaimer: Neither these presentations, nor anything on Twitter, Cryptoscores.org,
Combining Rsi With Rsi
 Working Two Stop Levels Combining Rsi With Rsi Optimization and stop-losses can help you minimize risks and give you better returns. channels, and so forth should be kept to a minimum. DAVID GOLDIN ou
Weekly outlook for April 30 May
 Weekly outlook for April 30 May 4 2018 Summary The S&P500 index is having trouble deciding if it will rally or decline. This indecision makes trading less profitable. Wait for a break-out direction to
Agenda. Who is Recognia. Event Driven Technical Analysis. Types of Technical Events. Finding and Validating Ideas using Recognia Q & A
 Disclaimer The information presented here is for educational and informational purposes only. The inclusion of any specific securities detailed is for illustrative purposes only. No information contained
PART 3 - CHART PATTERNS & TECHNICAL INDICATORS
 Tyler Chianelli s EASYOPTIONTRADING by OPTION TRADING COACH PART 3 - CHART PATTERNS & TECHNICAL INDICATORS A SIMPLE SYSTEM FOR TRADING OPTIONS WORKS IN UP, DOWN, AND SIDEWAYS MARKETS PART 3.1 - PRIMARY
Introductory Fundamental and Technical Analysis
 Introductory Fundamental and Technical Analysis Tan Junda junda@uobkayhian.com (65) 6590 6616 Jeffrey Tan jeffreytan@uobkayhian.com (65) 6590 6629 Our Focus Today What kind of investor are you? Technical