Riding the Growth wave. September 2018
|
|
|
- Roger Arnold
- 5 years ago
- Views:
Transcription

1 Riding the Growth wave September 2018
2 Growth, as the value creator Profitable Growth, not just growth Capital efficiency holds the key Looking into the future, not just present Evolving preferences, demand patterns Top down, not just bottom up Size of opportunity Trends, Tastes and Technologies Analyzing sector/industry dynamics at global level, not just domestic level Socio-political-economic factors 1


3 Growth dynamics in a Growing economy Trends Technology Rising Productivity Economic Growth Virtuous Growth Cycle Increase in discretionary spending Rising Income Infrastructure Consumption Real Estate prices rise Luxuries become necessities Tastes 2


4 A look at the Megatrends of the last decade Changing Lifestyles Demographics Consumers subscribing to Modern Retailing Need for home, increasing the real estate prices Gone are the days of booking your travel on your own, with travel advisers Increased access to financial services through Online / Mobile platforms Changing face of gaming Emergence of Urban middle class From luxury to necessity 3


5 A look at the Megatrends of the last decade Investments Capital Goods Infrastructure Construction Power Telecom Utilities Outsourcing IT/ IT Enabled services Auto Components Engineering goods Pharmaceuticals Financial Research Training & Development 4
6 Markets do respond to Growth trends But Growth pockets keep changing The top 3 best performing sectors have not been constant in last 10 years Year S&P BSE Auto S&P BSE Bankex S&P BSE Con. Dur. S&P BSE Capital Goods S&P BSE FMCG S&P BSE Health Care S&P BSE Metals S&P BSE Oil & Gas S&P BSE Power S&P BSE PSU S&P BSE Teck S&P BSE Sensex FY09-31% -41% -58% -53% -9% -25% -58% -29% -41% -28% -38% -37% FY10 154% 141% 163% 119% 42% 90% 215% 46% 69% 76% 79% 83% FY11 24% 26% 49% -5% 30% 14% -9% 2% -11% 1% 19% 13% FY12 12% -11% 3% -23% 27% 11% -29% -20% -22% -17% -7% -9% FY13 0% 13% 12% -9% 34% 22% -21% 5% -20% -11% 11% 10% FY14 35% 14% -7% 35% 19% 27% 18% 16% 7% 1% 27% 21% FY15 47% 45% 61% 45% 13% 72% -3% 0% 25% 23% 30% 27% FY16-5% -11% 11% -25% 0% -12% -16% 1% -15% -17% -1% -8% FY17 23% 34% 33% 29% 22% 1% 60% 53% 30% 45% -4% 18% FY18 10% 12% 47% 13% 12% -14% 18% 11% -5% -6% 15% 13% Best Performing 2 nd Best Performing 3 rd Best Performing Source: BSE. Returns are absolute returns. FY refers to fiscal year starting 1st April and ending on 31st March. Past performance may or may not be sustained in future Index values are calculated based on Total Return Index Values. 5
 Product Label This product is suitable for investors who are seeking* Long term capital")
7 How can investors benefit from Growth? Presenting Franklin India Focused Equity Fund (erstwhile Franklin India High Growth Companies Fund) Product Label This product is suitable for investors who are seeking* Long term capital appreciation A fund that invests in stocks of companies/sectors with high growth rates or above average potential * Investors should consult their financial advisors if in doubt about whether the product is suitable for them. 6

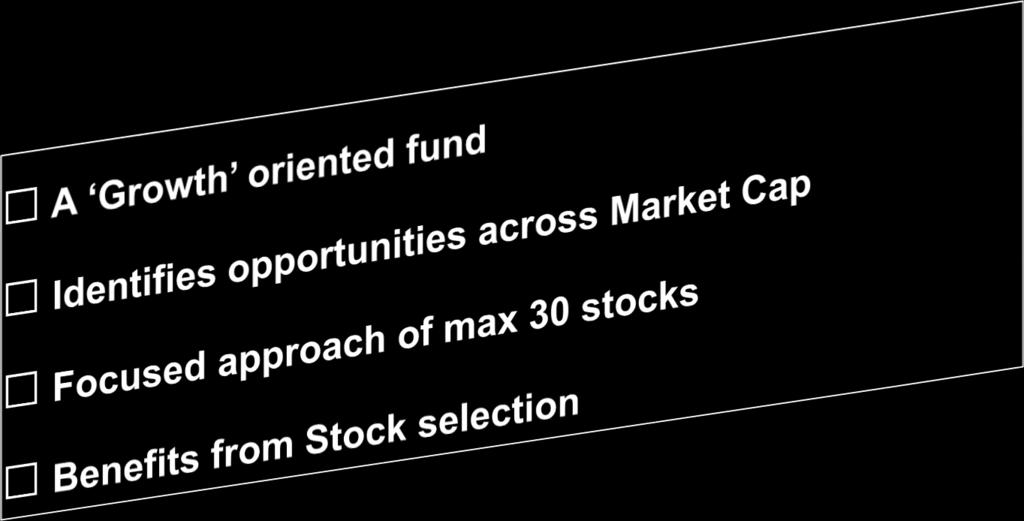


8 About the Fund 7

9 Fund Type 8

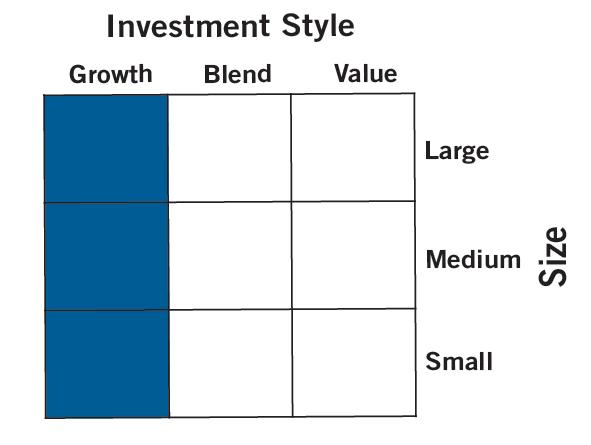
10 Investing across Market Cap 100% 90% 80% 70% 60% 50% 40% 30% 20% 10% 0% Aug- 09 Franklin India Focused Equity Fund (FIFEF)- (Allocation to Large Cap, Mid Cap & Small Cap) Feb- 10 Aug- 10 Feb- 11 Aug- 11 Feb- 12 Aug- 12 Feb- 13 Aug- 13 Large Cap Mid Cap Small Cap Feb- 14 Aug- 14 Feb- 15 Aug- 15 Feb- 16 Aug- 16 Feb- 17 Aug- 17 Feb- 18 Aug- 18 Focused on identifying Growth opportunities irrespective of market cap Source: As per the internal classification till Dec Market capitalization is as per AMFI classification since Jan Data is as on Aug 31, The graph shows large cap, mid cap and small cap break as a % of the total equity. Portfolio holdings are subject to change. 9

11 Investment process Domestic & global economic drivers Interest rates, inflation, liquidity regulation, politics Relative valuation Macro analysis - identify sectors Micro analysisstock picking Focused Strategy Diversified equity fund that seeks to achieve capital appreciation through investments in Indian companies/sectors with focused approach of maximum 30 stocks Sustainable above average growth Competitive advantage & business strength Financial strength 10
12 Top Down Approach Active Management through Sector Allocation Max Underweight (UW) Max UW as on Sectors Max Overweight (OW) Max OW as on Jun-11 Financials Jan Sep-16 Industrials Oct Oct-07 Materials 7.57 Mar Nov-17 Information Technology 5.18 Sep Aug-15 Health Care Apr Aug-18 Consumer Discretionary Sep Jul-09 Telecommunication Services Jul Apr-08 Energy 1.90 Jun May-13 Consumer Staples 1.40 Apr Feb-09 Utilities 2.12 Mar Jul-17 Real Estate 0.71 Nov-17 The above table indicates the active sector allocation followed by the fund manager. There can be times when the fund manager might be significantly underweight/overweight on a particular sector, based on macroeconomic conditions coupled with her/his views. Past performance may or may not be sustained in future Source: FactSet as on Aug 31, The data is taken from Sep 07 to Aug 18 (as on month ends). The overweight and underweight position is taken with respect to the index Nifty 500 and the minimum and maximum position has been highlighted for the given period. Information is historical. Portfolio holdings and sector allocation are subject to change. 11
13 The importance of Stock Selection 5 Years (ending Aug 31, 18) Attribution Analysis Asset Allocation Stock Selection Interaction Franklin India Focused Equity Fund Stock selection clearly the key contributor to performance Stock picking ability has ensured performance holds up well over the medium to long term, irrespective of how allocation decisions fared Allocation Effect: It measures the impact of decisions to overweight (OW) or underweight (UW) a particular sector relative to the benchmark. Positive allocation effect: Fund is (a) OW in a sector that outperforms (OP), and/or (b) UW in a sector that underperforms (UP), total returns of the benchmark. Negative allocation effect: Fund is (a) OW in a sector that UP, and/or (b) UW in a sector that OP, total returns of the benchmark. Selection Effect: It measures the impact of selecting securities that provide different returns for a particular sector, compared to the total benchmark returns. It evaluates the fund manager's skill in choosing securities that outperformed in a particular sector, compared to the benchmark. Interaction Effect: It measures the combined impact of allocation and selection effects. Positive interaction effect: Fund is (a) OW and OP, and/or (b) UW and UP, compared to the weights and returns of a particular sector in the benchmark. Negative interaction effect: Fund is (a) OW and UP, and/or (b) UW and OP, compared to the weights and returns of a particular sector in the benchmark. All attribution effects are computed daily and are linked through time by applying additional multi-period algorithms. Source: Factset. Past performance may or may not be sustained in future 12
14 Contributors/Detractors in last 3 years Sector Average Weight (%) FIFEF Nifty 500 Total Return (%) Average Weight (%) Total Return (%) Allocation Effect Selection Effect Interaction Effect Contributors Health Care Consumer Discretionary Industrials Information Technology Telecommunication Services Detractors Energy Materials Consumer Staples Financials Utilities Real Estate Indicates high contribution to the total effect. Past performance may or may not be sustained in future. Source: Factset as on Aug 31, Information is historical and may not reflect current or future portfolio characteristics. Portfolio holdings are subject to change. 13
15 Scheme Performance As on Aug 31, 2018 Scheme NAV as on Aug 31, 2018 Returns Compounded Annualised Growth Rate Performance (%) Last 1 Year Last 3 Years Last 5 Years Since inception Current Value of Current Value of Current Value of Current Value of Investment of Returns Investment of Returns Investment of Returns Investment of Rs Rs Rs Rs Franklin India Focused Equity Fund*** (FIFEF) - Growth % 10, % 14, % 31, % 40, B:Nifty % 11, % 15, % 25, % 29,595 AB:Nifty % 11, % 15, % 22, % 28,865 Performance of Top 3 and bottom 3 schemes managed by the fund managers of the scheme Franklin India Bluechip Fund (FIBCF) % 11, % 13, % 23, % 1,164, B:Nifty 100## $ 22.55% 12, % 15, % 22, % 168,000 AB:Nifty 50 * 19.40% 11, % 15, % 22, % 151,405 Franklin India Technology Fund (FITF) - ^^^ % 13, % 14, % 19, % 331, B: S&P BSE TECK # $ 39.49% 13, % 13, % 19,249 NA NA AB:Nifty 50 * 19.40% 11, % 15, % 22, % 178,398 Franklin India Equity Fund (FIEF)*** % 11, % 14, % 27, % 621, B:Nifty 500 $ 16.33% 11, % 15, % 25, % 125,655 AB:Nifty 50 * 19.40% 11, % 15, % 22, % 116,368 Franklin India Dynamic PE Ratio Fund of Funds (FIDPEF) - Growth % 10, % 13, % 19, % 81, B : CRISIL Hybrid Aggressive Index 11.75% 11, % 14, % 21, % 65,490 AB : S&P BSE Sensex 23.20% 12, % 15, % 22, % 97,981 Franklin Asian Equity Fund (FAEF) - Growth % 10, % 14, % 15, % 22, B: MSCI Asia (ex Japan) Standard Index 14.47% 11, % 15, % 16, % 28,137 AB:Nifty % 11, % 15, % 22, % 22,375 Franklin India Multi Asset Solution Fund (FIMAS) - Growth** % 10, % 12,149 N.A. N.A. 5.85% 12, B : CRISIL Hybrid Aggressive Index 11.75% 11, % 14,430 N.A. N.A % 14,513 Additional Benchmark N.A. N.A. N.A. N.A. N.A. N.A. N.A. N.A. Past performance may or may not be sustained in future. Fund Managers: FIFEF: Roshi Jain (Managing Since 09-Jul-12) & Anand Radhakrishnan (Managing Since 02-May-16), FIBCF: Anand Radhakrishnan (Managing Since 31-Mar-07) & Roshi Jain (Managing Since 02-May-16), FIEF: Anand Radhakrishnan (Managing Since 31-Mar-07) & R. Janakiraman(Managing Since 01-Feb-11), FAEF: Roshi Jain (Managing Since 01-Feb-11), FITF: Anand Radhakrishnan (Managing Since 01-Mar-07) & Varun Sharma (Managing Since 30-Nov-15), FIMAS: Anand Radhakrishnan (Managing Since 27-Feb-15), FIDPEF: Anand Radhakrishnan (Managing Since 01-Feb-11). B: Benchmark. AB: Additional Benchmark. N.A.: Not Applicable. The FIFEF fund manager Anand Radhakrishnan & Roshi Jain manages 7&4 schemes/plans of Franklin Templeton Mutual Fund respectively. Period for which scheme s performance has been provided is computed basis last day of the month-end preceding the date of advertisement. The top three and bottom three funds managed by the fund manager(s) have been derived on the basis of the since inception returns. Different plans have a different expense structure. The performance details provided herein are of Regular Plan. Load is not taken into consideration. Dividends assumed to be reinvested and Bonus is adjusted. On account of difference in the type/category, asset allocation or investment strategy, inception dates, performances of these funds are not strictly comparable. Please refer to for details on performance of all schemes (including Direct Plans). # Index is adjusted for the period January 31, 2000 to May 26, 2017 with the performance of S&P BSE Information Technology. ## Index adjusted for the period December 1, 1993 to June 4, 2018 with the performance of S&P BSE Sensex. **This scheme has been in existence for more than 1 year but less than 5 years.^^^ As the scheme was launched before the launch of the benchmark index, benchmark index figures since inception are not available. Benchmark returns calculated based on Total Return Index Values. ***The features of few Schemes including category of schemes (like Scheme Name, Investment Objective, Benchmark etc.) has undergone changes with effect from June 4, For details, please refer '@ As TRI data is not available since inception of the scheme, benchmark performance is calculated using composite CAGR in FIBCF: $ S&P BSE Sensex PRI values from to , S&P BSE Sensex TRI values from to and Nifty 100 TRI values since , * Nifty 50 PRI values from to and TRI values since ; FIEF: $ Nifty 500 PRI values from to and TRI values since , * Nifty 50 PRI values from to and TRI values since ; FITF: $ S&P BSE Information Technology PRI values from 01/02/1999 to 23/08/2004; S&P BSE Information Technology TRI values from 23/08/2004 to 29/05/2017 and S&P BSE TECK TRI values since 29/05/2017, *Nifty 50 PRI values from to and TRI values since Inception Date
16 Rupees Portfolio Journey Movement of Rs. 10,000 invested in FIFEF, Nifty 500 & Nifty FIFEF: Rs. 40, B: Nifty Rs. 29,595 AB: Nifty 50 - Rs. 28,865 0 Aug-07 Sep-08 Nov-09 Dec-10 Jan-12 Feb-13 Mar-14 Apr-15 May-16 Jul-17 Aug-18 FIFEF B: Nifty 500 AB: Nifty 50 Past performance may or may not be sustained in future. The graph shows the movement of Rs.10,000 invested in FIFEF Growth Plan, Nifty 500, and Nifty 50 since inception of the fund. B: Benchmark and AB: Additional Benchmark. Inception Date: July 26, Performance is as on Aug 31, Load is not taken into consideration. Dividends assumed to be reinvested and Bonus is adjusted. Please refer for details on performance of all schemes (including Direct Plans). Benchmark values are calculated based on Total Return Index Values. 15
17 Absolute Returns (%) Calendar Year Returns (20) (40) (60) 2018 YTD FIFEF-Growth (3) (25) (58) B: Nifty (26) (56) AB: Nifty (3) (24) (51) Outperformance over B (9) (0) (0) (0) 8 (1) Outperformance over AB (15) (1) (4) 21 (7) Past performance may or may not be sustained in future. The chart shows calendar year returns for FIFEF Growth Plan, Nifty 500, and Nifty 50 since inception of the fund. B: Benchmark and AB: Additional Benchmark. Inception Date: July 26, YTD Performance is as of Aug 31, Please refer for details on performance of all schemes (including Direct Plans). The superlative performance shown in 2009 and 2014 was on account of overall sharp rise in stock prices coupled with stock selection and fund s overweight position in outperforming sectors. 16 Benchmark returns calculated based on Total Return Index Values.
18 The advantage of long term investing Franklin India Focused Equity Fund Growth Option Historical instances of +ve performance 45.0% 40.0% 41.3% Historical instances of ve performance 35.0% 97.4% 30.0% 2.6% 28.3% 28.3% 100% 100% 25.0% 0% 0% 20.0% 15.0% 10.0% 5.0% 0.0% -5.0% -10.0% 17.5% 18.0% 17.7% 9.8% 0.3% 3 Year 5 Year 7 Year -4.1% Maximum Returns Minimum Returns Average Returns Past performance may or may not be sustained in future. Period to Load is not taken into consideration. Dividends assumed to be reinvested and Bonus is adjusted. Returns greater than 1 year period are compounded annualized. Note: The above graph shows the performance on a daily rolling return basis to compute returns for respective periods (3, 5 and 7 years). Please turn overleaf for performance data of Benchmark and Additional Benchmark. 17
19 The advantage of long term investing Nifty 500 * Nifty 50 ** 35.0% 30.5% 30.0% 25.0% 94.9% 22.1% 97.5% 20.8% 100.0% 20.0% 5.1% 2.5% 0% 15.0% 11.5% 11.7% 11.4% 10.0% 5.0% 3.9% 0.0% -5.0% 3 Year 5 Year 7 Year -4.2% -1.4% -10.0% Maximum Returns Minimum Returns Average Returns 35.0% 30.0% 28.8% 99.3% 25.0% 21.8% 99.9% 0.7% 19.8% 100% 20.0% 0.1% 0% 15.0% 10.7% 11.1% 10.8% 10.0% 4.9% 5.0% 0.0% 3 Year 5 Year 7 Year -5.0% -2.0% 0.0% Maximum Returns Minimum Returns Average Returns Historical instances of +ve performance Historical instances of ve performance Past performance may or may not be sustained in future. Period to Load is not taken into consideration. Dividends assumed to be reinvested and Bonus is adjusted. Returns greater than 1 year period are compounded annualized. *Benchmark. **Additional Benchmark. Note: The above graph shows the performance on a daily rolling return basis to compute returns for respective periods (3, 5 and 7 years). Benchmark returns calculated based on Total Return Index Values. 18
20 Returns (%) Market resilience (as of Aug 31, 2018) (20) (40) (60) (80) P1 P2 P3 P4 P5 P6 P7 P8 P9 FIFEF-Growth 44 (62) 99 (21) (18) B: Nifty (58) 81 (19) (18) AB: Nifty (53) 73 (15) (20) Outperformance over B 1 (4) 18 (3) 7 25 (0) (3) 3 Outperformance over AB 7 (9) 26 (6) (2) 3 P1: India Re-rating: 26 th July 07-8 th Jan 08. P2: Global Crisis Lows: 8 th Jan 08-9 th Mar 09. P3: Post Crisis Peak: 9 th Mar 09 9 th Nov 10. P4: High inflation, slow growth: 9 th Nov th Jan 12 P5: Rebound in US and QE3 buoying global rally: 30 th Jan th Jun 13 P6: Post European Crisis: 28 th Jun th Feb 15 P7: Chinese economic Slowdown: 27 th Feb th Feb 16 P8: Global Liquidity and Domestic Reforms: 29 th Feb st Aug 18 P9: Since Inception till 31 st Aug 18 Past performance may or may not be sustained in future. FIFEF- Growth option is taken for calculations. Returns are compounded and annualized for more than 1 year period. Inception Date: July 26, Dividends are assumed to be reinvested and bonus is adjusted. Load is not taken into consideration. B: Benchmark, AB: Additional Benchmark. The above graph depicts performance of the fund vis-à-vis benchmark and additional benchmark in the specified time periods which have displayed significant market movement due to change in domestic/global macroeconomic variables. Benchmark returns calculated based on Total Return Index Values. 19
21 SIP Returns as on Aug 31, 2018 If you had invested Rs every month in FIFEF- Growth FIFEF 1 year 3 year 5 year 7 year 10 year Since Inception Total amount Invested (Rs) 120, , , ,000 1,200,000 1,340,000 Total value as on 31-Aug-2018 (Rs) 125, , ,888 1,679,953 3,204,428 3,746,014 Returns 8.40% 13.68% 16.54% 19.45% 18.67% 17.32% Total value of B: Nifty , , ,492 1,511,096 2,613,545 3,006,260 B:Nifty 500 Returns 18.07% 18.94% 16.61% 16.48% 14.88% 13.73% Total value of AB: Nifty , , ,533 1,442,208 2,480,694 2,860,099 AB: Nifty 50 Returns 24.02% 19.37% 15.43% 15.17% 13.91% 12.91% Past performance may or may not be sustained in future. B: Benchmark, AB: Additional Benchmark. Inception Date: July 26, Returns over 1 year period are compounded annualized. Calculations assume investment on the 1st business day of every month. Load is not taken into consideration. Dividends assumed to be reinvested and Bonus is adjusted. On account of difference in the type/category, asset allocation or investment strategy, inception dates, performances of the fund is not strictly comparable. Benchmark returns calculated based on Total Return Index Values. 20
22 Telecommunication Services Financials Energy Utilities Health Care Real Estate Industrials Materials Consumer Discretionary Information Technology Consumer Staples Underweight In (%) Overweight Fund Facts Overweights/Underweights as on 31 st Aug Past performance may or may not be sustained in future. Source: Factset as of 31 st Aug 18. Calculations are done for the portfolio vis a vis its benchmark index Nifty 500 for determining overweights and underweights. Information is historical and may not reflect current or future portfolio characteristics. Portfolio holdings are subject to change. 21
23 Consistent Dividend History Record Date Dividend Per Unit (Rs.) (A) Record Date Nav (Rs.) Dividend Plan (B) Record Date NAV (Rs.) Direct Dividend Plan Dividend Yield *(A/B) 2018 August % 2017 August % 2016 August % 2015 August % 2014 August % 2013 August % 2011 July N.A 4% 2010 September N.A 4% Dividends on face value of Rs.10/- Past performance may or may not be sustained in future. Pursuant to payment of dividend, the NAVs of the schemes would fall to the extent of payout and statutory levies (as applicable). *Dividend yield is mentioned for Dividend option. 22
24 Portfolio Composition 23 Top 10 holdings Sector Share of equity AUM Top Sector Allocation Share of equity AUM ICICI Bank Ltd. Banks 9.84% State Bank of India Banks 9.73% HDFC Bank Ltd. Banks 8.67% Bharti Airtel Ltd. Telecom - Services 6.31% Axis Bank Ltd. Banks 6.16% Indian Oil Corporation Ltd. Petroleum Products 4.43% Cognizant Technology (USA) Software 4.17% Abbott India Ltd Pharmaceuticals 4.16% Ultratech Cement Ltd. Cement 3.96% Tata Motors Ltd, DVR Auto 3.79% Total (Top 10) 61.24% Total (Equity) 91.42% Banks 35.19% Petroleum Products 8.09% Telecom - Services 7.88% Pharmaceuticals 6.49% Cement 6.46% Industrial Products 5.53% Software 4.17% Gas 3.91% Auto 3.79% Construction 3.18% Total 84.69% These securities represent the ten largest holdings held in the Fund as of the date indicated. All portfolio holdings are subject to change. The information stated above does not constitute an investment advice or recommendation to subscribe or transact in these securities. Sector classification based on AMFI. As of Aug 31,
25 Why invest in FIFEF 1 Provides an opportunity to participate in Indian companies/sectors with focused approach 2 Blend of top-down (macro analysis to identify sectors) and bottom-up approach (micro analysis to pick stocks within these sectors) 3 Shifts between companies and sectors to be identified based on relative valuations, liquidity and growth potential 4 Long term performance record (over 11 years) 24
26 Fund Characteristics as on Aug 31, 2018 Fund Description An open-end diversified equity fund that seeks to achieve capital appreciation through investments in Indian companies/sectors with high growth rates or potential Inception Date July 26, 2007 Assets Rs crores (Aug 31, 2018) Managed by Investment Style Minimum Amount Roshi Jain & Anand Radhakrishnan. Srikesh Nair (dedicated fund manager for foreign securities) Focused approach of max 30 stocks Subscription: Fresh Purchase - Rs.5,000/-. Additional Purchase - Rs.1,000/-. Redemption: Rs.1,000/-. The amount for subscription and redemption in excess of the minimum amount specified above is any amount in multiple of Re. 1/-. Benchmark Nifty 500 Volatility Measures (3 years) (Aug 31, 2018) Portfolio Turnover (Aug 31, 2018) Exit Load Standard deviation: 4.37% Beta: 0.98 Sharpe Ratio*: % 1% if the units are redeemed/switched-out within one years of allotment (w.e.f. Dec 11, 2017) *Annualised. Risk free rate assumed to be 6.45% (FBIL overnight MIBOR) 25
27 Equity MFs - Positioning Thematic Asian Equity FoF Overseas Europe FoF Overseas - U.S. Thematic Technology Thematic Special Situations Thematic Infrastructure FAEF FIF-FEGF FIF-FUSOF FITF FIOF FBIF Small Cap Mid Cap Dividend Yield Value Focused ELSS Large & Mid Cap Multi Cap Large Cap Index Nifty FISCF FIPF FIT FIEAF FIEF FIBCF FIIF DIVERSIFIED TIEIF TIVF FIFEF STYLE / THEME FIIF: Franklin India Index Fund NSE Nifty Plan, FIBCF: Franklin India Bluechip Fund, FIEF: Franklin India Equity Fund, FIEAF: Franklin India Equity Advantage Fund, FIT: Franklin India Taxshield, FIFEF: Franklin India Focused Equity Fund, TIVF: Templeton India Value Fund, TIEIF: Templeton India Equity Income Fund, FIPF: Franklin India Prima Fund, FISCF: Franklin India Smaller Companies Fund, FBIF: Franklin Build India Fund, FIOF: Franklin India Opportunities Fund, FITF: Franklin India Technology Fund, FIF-FUSOF: Franklin India Feeder Franklin U.S. Opportunities Fund, FIF-FEGF: Franklin India Feeder Franklin European Growth Fund, FAEF: Franklin Asian Equity Fund 26
28 R: Risk Probability Equity MFs Risk Matrix FIF-FUSOF FIF-FEGF FAEF FIIF FIBCF FIEF FIEAF FIT FIFEF TIVF TIEIF FIPF FISCF FBIF FIOF FITF RP: Return Potential FIIF: Franklin India Index Fund NSE Nifty Plan, FIBCF: Franklin India Bluechip Fund, FIEF: Franklin India Equity Fund, FIEAF: Franklin India Equity Advantage Fund, FIT: Franklin India Taxshield, FIFEF: Franklin India Focused Equity Fund, TIVF: Templeton India Value Fund, TIEIF: Templeton India Equity Income Fund, FIPF: Franklin India Prima Fund, FISCF: Franklin India Smaller Companies Fund, FBIF: Franklin Build India Fund, FIOF: Franklin India Opportunities Fund, FITF: Franklin India Technology Fund, FIF-FUSOF: Franklin India Feeder Franklin U.S. Opportunities Fund, FIF-FEGF: Franklin India Feeder Franklin European Growth Fund, FAEF: Franklin Asian Equity Fund Note: Relative fund positioning is indicative in nature and is based on fundamental factors pertaining to relative risk return potential of 1) large caps vs mid caps vs small caps, 2) diversified vs style/theme and 3) exposure to foreign currencies. For ex: higher the mid/small cap exposure, higher the risk return potential. This is a simplified illustration of potential Risk-Return profile of the schemes and does not take into account various complex factors that may have a potential impact on the schemes. 27
29 Risk Factors The information contained in this presentation is not a complete representation of every material fact regarding any industry, security or the fund and is neither an offer for units nor an invitation to invest. This communication is meant for use by the recipient and not for circulation/reproduction without prior approval. The views expressed by the portfolio managers are based on current market conditions and information available to them and do not constitute investment advice. Scheme Classification and Objective: Franklin India Focused Equity Fund (FIFEF): An open ended equity scheme that seeks to achieve to achieve capital appreciation through investing predominantly in Indian companies/sectors with high growth rates or potential. Load Structure: Please refer to website for latest load structure of the scheme. Risk Factors: The NAVs of the schemes may go up or down depending upon the factors and forces affecting the securities market. The Mutual Fund is not guaranteeing or assuring any dividend under any of the schemes and the same is subject to the availability and adequacy of distributable surplus. The past performance of the mutual funds managed by the Franklin Templeton Group and its affiliates is not necessarily indicative of future performance of the schemes. Mutual Fund investments are subject to market risks, read all scheme related documents carefully. 28
30 Franklin Templeton Asset Management (India) Pvt. Ltd. Indiabulls Finance Centre, Tower 2, 12 th and 13 th floor, Senapati Bapat Marg, Elphinstone (W) Mumbai Tel (91-22) Fax (91-22) Franklin Templeton Investments. All rights reserved.
Franklin India Smaller Companies Fund*
 Franklin India Smaller Companies Fund* Invest in potential leaders of tomorrow September 2018 *Please refer Slide 8 for product label. Smaller Companies: A search beyond the bluechips Large Caps Top 101
Franklin India Prima Plus*
 Franklin India Prima Plus* Add Scale & Scope to your portfolio November 2017 *Please refer Slide 9 for Product Label 0 What do Multi-caps offer? Diversification across SECTORS Relatively lower volatility
Franklin India Flexi Cap Fund*
 Franklin India Flexi Cap Fund* A flexible approach to allocate between Scale & Scope November 2017 *Please refer Slide 8 for Product Label 0 What do Multi-caps offer? Diversification across SECTORS Relatively
Franklin India Smaller Companies Fund*
 Franklin India Smaller Companies Fund* Invest in the leaders of tomorrow November 2017 *Please refer Slide 8 for product label. Smaller Companies: A search beyond the bluechips Smaller Companies Large
Balance your asset allocation Dynamically Franklin India Dynamic PE Ratio Fund of Funds
 Balance your asset allocation Dynamically Franklin India Dynamic PE Ratio Fund of Funds November 2017 Return What does an investor expect from Investments? Moderate Return Moderate Risk Risk The Average
Explore the Investment potential of your Savings. November 2017
 Explore the Investment potential of your Savings November 2017 Few questions that bother investors? Tax saving avenues: Traditional or New? What additional benefits do ELSS offer? Is ELSS* a prudent avenue?
Have a Fine Balance in your portfolio. Franklin India Balanced Fund* November *Please refer Slide 12 for product label and riskometer
 Have a Fine Balance in your portfolio Franklin India Balanced Fund* November 2017 *Please refer Slide 12 for product label and riskometer Choosing the Right Path Consider you are on a holiday and have
Equity Oriented Funds* Changes
 Equity Oriented s* Changes Existing Name New Name Category Scheme Characteristics Index NSE Nifty Plan No Change Index Minimum 95% of assets to replicate / track Nifty 50 index Bluechip No Change Large
You look for options in everything you do. Why not when it comes to your tax-saving instruments? Before you invest, #AskWhatELSS
 You look for options in everying you do. Why not when it comes to your tax-saving instruments? Before you invest, #AskWhatELSS February 2016 Few Questions That Boer Investors??Ÿ Tax saving avenues: Traditional
You look for options in everything you do. Why not when it comes to your tax-saving instruments? Before you invest, #AskWhatELSS
 You look for options in everying you do. Why not when it comes to your tax-saving instruments? Before you invest, #AskWhatELSS November 2015 Few Questions That Boer Investors??Ÿ Tax saving avenues: Traditional
Participate in one of the key drivers of Growth & Development in India
 Participate in one of the key drivers of Growth & Development in India DATE OF ALLOTMENT December 28, 2015 BENCHMARK Nifty Financial Services TRI (WEF From 1st February 2018) FUND SIZE Rs.261.73 (Rs. in
How much will your current lifestyle cost at 60?
 (MODERATE PLAN) How much will your current lifestyle cost at 60? DATE OF ALLOTMENT November 01,2011 BENCHMARK CRISIL Hybrid 25+75 - Aggressive Index (WEF From 1st February 2018) FUND SIZE: Rs.856.45 (Rs.
How much will your current lifestyle cost at 60?
 (PROGRESSIVE PLAN) How much will your current lifestyle cost at 60? DATE OF ALLOTMENT November 01, 2011 BENCHMARK S&P BSE Sensex TRI (WEF From 1st February 2018) FUND SIZE Rs.474.87 (Rs. in Cr.) MONTHLY
How much will your current lifestyle cost at 60?
 (MODERATE PLAN) How much will your current lifestyle cost at 60? DATE OF ALLOTMENT November 01,2011 BENCHMARK CRISIL Hybrid 25+75 - Aggressive Index (WEF From 1st February 2018) FUND SIZE: Rs.733.18 (Rs.
How much will your current lifestyle cost at 60?
 (MODERATE PLAN) How much will your current lifestyle cost at 60? DATE OF ALLOTMENT November 01,2011 BENCHMARK CRISIL Hybrid 25+75 - Aggressive Index (WEF From 1st February 2018) FUND SIZE: Rs.772.12 (Rs.
How much will your current lifestyle cost at 60?
 (PROGRESSIVE PLAN) How much will your current lifestyle cost at 60? DATE OF ALLOTMENT November 01, 2011 BENCHMARK S&P BSE Sensex TRI (WEF From 1st February 2018) FUND SIZE Rs.547.64 (Rs. in Cr.) MONTHLY
How much will your current lifestyle cost at 60?
 (PROGRESSIVE PLAN) How much will your current lifestyle cost at 60? DATE OF ALLOTMENT November 01, 2011 BENCHMARK S&P BSE Sensex TRI (WEF From 1st February 2018) FUND SIZE Rs.467.54 (Rs. in Cr.) MONTHLY
Think Of Us Before You Invest
 Think Of Us Before You Invest DATE OF ALLOTMENT March 31,1996 BENCHMARK S&P BSE Sensex FUND SIZE Rs.679.21 (Rs. in Cr.) MONTHLY AVERAGE AUM Rs.668.51 (Rs. in Cr.) EXIT LOAD Nil (Compulsory lock-in period
How much will your current lifestyle cost at 60?
 (MODERATE PLAN) How much will your current lifestyle cost at 60? DATE OF ALLOTMENT November 01,2011 BENCHMARK CRISIL Balanced Fund - Aggressive Index FUND SIZE Rs.370.53 (Rs. in Cr.) MONTHLY AVERAGE AUM
Aims to achieve the right blend of Growth and Tax Saving
 Aims to achieve the right blend of Growth and Tax Saving DATE OF ALLOTMENT March 31,1996 BENCHMARK S&P BSE Sensex FUND SIZE Rs.981.23 (Rs. in Cr.) MONTHLY AVERAGE AUM Rs.939.37 (Rs. in Cr.) EXIT LOAD Nil
Reliance Focused Large Cap Fund
 Reliance Focused Large Cap Fund Formerly, Reliance Equity Fund (An open ended Diversified Equity Scheme) To know more call us at 1800 300 11111 visit www.reliancemutual.com Download Free App Download with
Franklin India Corporate Bond Opportunities Fund (FICBOF) November 2017
 November 2017") Franklin India Corporate Bond Opportunities Fund (FICBOF) November 2017 Popular Strategies followed by Debt Mutual Funds to generate α High Accrual Led Strategies Primary objective is to generate accrual
Franklin India Corporate Bond Opportunities Fund (FICBOF) November 2017 Popular Strategies followed by Debt Mutual Funds to generate α High Accrual Led Strategies Primary objective is to generate accrual
Invesco India Dynamic Equity Fund (An open-ended equity scheme)
") Invesco India Dynamic Equity Fund (An open-ended equity scheme) September 2016 Suitable for investors who are seeking*: Capital appreciation over long-term Investment in focused portfolio of equity and
Invesco India Dynamic Equity Fund (An open-ended equity scheme) September 2016 Suitable for investors who are seeking*: Capital appreciation over long-term Investment in focused portfolio of equity and
Franklin India Multi-Asset Solution Fund Dynamic Asset Allocation across Equity, Debt, Gold and Cash
 Franklin India Multi-Asset Solution Fund Dynamic Asset Allocation across Equity, Debt, Gold and NFO Opens: November 7, 2014 NFO Closes: November 21, 2014 Please refer to Slide No. 22 for risk factors &
Participate in the Digital Transformation of India
 Participate in the Digital Transformation of India DATE OF ALLOTMENT December 28, 2015 BENCHMARK S&P BSE IT TRI FUND SIZE Rs.111.56 (Rs. in Cr.) MONTHLY AVERAGE AUM Rs.90.94 (Rs. in Cr.) EXIT LOAD: 0.25%
Presenting. (An Open-Ended Balanced Scheme) August 2012
 August 2012") Presenting HDFC Balanced Fund (An Open-Ended Balanced ) August 2012 1 Table of Contents Balanced Fund- Basics Product Rationale and Asset Allocation Pattern Investment Strategy Portfolio Composition Performance
Presenting HDFC Balanced Fund (An Open-Ended Balanced ) August 2012 1 Table of Contents Balanced Fund- Basics Product Rationale and Asset Allocation Pattern Investment Strategy Portfolio Composition Performance
Invesco India Dynamic Equity Fund (An open-ended equity scheme)
") Invesco India Dynamic Equity Fund (An open-ended equity scheme) June 2017 Suitable for investors who are seeking*: Capital appreciation over long-term Investment in focused portfolio of equity and equity
Invesco India Dynamic Equity Fund (An open-ended equity scheme) June 2017 Suitable for investors who are seeking*: Capital appreciation over long-term Investment in focused portfolio of equity and equity
Kotak Select Focus Fund
 Kotak Select Focus Fund 1 About the Fund Investment Approach Investment Style & Philosophy Style: Growth at reasonable price (GARP) Philosophy to remain fully invested as per mandate and not to take active
Modes of Investing in Mutual Funds
 Modes of Investing in Mutual Funds An Investor Education & Awareness Initiative By Franklin Templeton Mutual Fund Popular Modes of Investing in a Mutual Fund Lump Sum or One Time Investment Systematic
Mirae Asset Emerging Bluechip Fund (MAEBF)
") Mirae Asset Emerging Bluechip Fund (MAEBF) (An Open Ended Equity Fund) Product Literature December 2014 MAEBF Our Goal Our endeavour has been to Spot the Potential of Emerging Companies and consistently
Mirae Asset Emerging Bluechip Fund (MAEBF) (An Open Ended Equity Fund) Product Literature December 2014 MAEBF Our Goal Our endeavour has been to Spot the Potential of Emerging Companies and consistently
CANARA ROBECO INFRASTRUCTURE OCTOBER 2018
 CANARA ROBECO INFRASTRUCTURE OCTOBER 2018 Canara Robeco Infrastructure An Open Ended Equity Scheme This product is suitable for investors who are seeking* Capital appreciation over long term Investing
Mirae Asset Emerging Bluechip Fund (MAEBF)
") Mirae Asset Emerging Bluechip Fund (MAEBF) (An Open Ended Equity Fund) Product Literature April 2015 MAEBF Our Goal Our endeavour has been to Spot the Potential of Emerging Companies and consistently outperform
Mirae Asset Emerging Bluechip Fund (MAEBF) (An Open Ended Equity Fund) Product Literature April 2015 MAEBF Our Goal Our endeavour has been to Spot the Potential of Emerging Companies and consistently outperform
You work hard to earn money. Invest it wisely
 You work hard to earn money. Invest it wisely DATE OF ALLOTMENT August 08,2002 BENCHMARK Crisil Short Term Bond Fund Index FUND SIZE Rs.6270.03 (Rs. in Cr.) MONTHLY AVERAGE AUM Rs.6258.57 (Rs. in Cr.)
CANARA ROBECO EMERGING EQUITIES. August 2018
 CANARA ROBECO EMERGING EQUITIES August 2018 Canara Robeco Emerging Equities Large & Mid Cap Fund - An open ended equity scheme investing in both large cap and mid cap stocks This product is suitable for
CANARA ROBECO LARGE CAP+ FUND FEBRUARY 2018
 CANARA ROBECO LARGE CAP+ FUND FEBRUARY 2018 Canara Robeco Large Cap+ Fund The sign (+) in the name of the fund has been used in terms of asset allocation and not in return/yield An Open Ended Equity Scheme
Equity Funds Ready Reckoner
 Equity Funds Ready Reckoner Name Investment Theme Product Positioning Key Features Fund Manager Monthly AAUM Mcap (%) Overweight Underweight Beta (Rs. Crs) Sharpe Standard Deviation (%) 5 years Alpha (%)
Equity Funds Ready Reckoner
 Equity Funds Ready Reckoner Name Investment Theme Product Positioning Key Features Fund Manager Monthly AAUM Mcap (%) Overweight Underweight Beta (Rs. Crs) Sharpe Standard Deviation (%) 5 years Alpha (%)
History Has Shown The Advantage Of True Diversification
 History Has Shown The Advantage Of True Diversification Returns of asset classes Year Stocks Bonds Gold Average 1995-23% 3% 14% -2% 1996-1% 13% -3% 3% 1997 20% 24% -14% 10% 1998-18% 8% 8% 0% 1999 67% 16%
You work hard to earn money. Invest it wisely
 You work hard to earn money. Invest it wisely DATE OF ALLOTMENT August 08,2002 BENCHMARK Crisil Short Term Bond Fund Index FUND SIZE Rs.6263.63 (Rs. in Cr.) MONTHLY AVERAGE AUM Rs.6164.44 (Rs. in Cr.)
Sharekhan Top SIP Fund Picks February 14, 2018
 February 14, 2018 Index Top SIP Fund Picks Large-Cap Funds Mid & Small-Cap Funds Multi-Cap Funds Tax-saving Funds (ELSS) BNP Paribas Mutual Fund Equity schemes Fund Focus BNP Paribas Equity Fund Mutual
Invest in the spending power of a billion people.
 Invest in the spending power of a billion people. DATE OF ALLOTMENT December 28, 2015 BENCHMARK Nifty India Consumption TRI (WEF From 1st February 2018) FUND SIZE Rs.1299.82 (Rs. in Cr.) MONTHLY AVERAGE
Religare Invesco Mid N Small Cap Fund
 Religare Invesco Mid N Small Cap Fund An Open Ended Equity Scheme Suitable for investors who are seeking*: Capital appreciation over long term Investment predominantly in equity and equityrelated instruments
You work hard to earn money. Invest it wisely
 You work hard to earn money. Invest it wisely DATE OF ALLOTMENT August 08,2002 BENCHMARK Crisil Short Term Bond Fund Index FUND SIZE Rs.6230.70 (Rs. in Cr.) MONTHLY AVERAGE AUM Rs.6367.03 (Rs. in Cr.)
CANARA ROBECO BLUE CHIP EQUITY FUND
 CANARA ROBECO BLUE CHIP EQUITY FUND JULY 2018 CONTENTS Blue Chip Equity Funds Risk-Reward Matrix An Introduction Canara Robeco Blue Chip Equity Fund Investment Process Portfolio Performance Why Canara
Invest in the spending power of a billion people.
 Invest in the spending power of a billion people. DATE OF ALLOTMENT December 28, 2015 BENCHMARK Nifty India Consumption TRI (WEF From 1st February 2018) FUND SIZE Rs.1118.33 (Rs. in Cr.) MONTHLY AVERAGE
Managed by ICICI Prudential Asset Management Company Ltd.
 Bharat 22 ETF A long-term investment opportunity Managed by ICICI Prudential Asset Management Company Ltd. NFO Period: The NFO for Anchor investor is on November 14, 2017 and Non-Anchor shall be between
You work hard to earn money. Invest it wisely
 You work hard to earn money. Invest it wisely DATE OF ALLOTMENT August 08,2002 BENCHMARK Crisil Short Term Bond Fund Index FUND SIZE Rs.6495.06 (Rs. in Cr.) MONTHLY AVERAGE AUM Rs.6872.16 (Rs. in Cr.)
STRIVE FOR BALANCE BETWEEN GROWTH AND STABILITY.
 MAGNUM BALANCED FUND An Open-ended Balanced Scheme STRIVE FOR BALANCE BETWEEN GROWTH AND STABILITY. Invest in a mix of equity and debt with SBI Magnum Balanced. BALANCED FUNDS A Balanced aims to balance
IIFL INDIA GROWTH FUND. (An open ended equity Scheme)
") IIFL INDIA GROWTH FUND (An open ended equity Scheme) IIFL INDIA GROWTH FUND (An open ended equity Scheme) This product is suitable for investors who are seeking* capital appreciation over long term; Investment
IIFL INDIA GROWTH FUND (An open ended equity Scheme) IIFL INDIA GROWTH FUND (An open ended equity Scheme) This product is suitable for investors who are seeking* capital appreciation over long term; Investment
Scheme Features yrs. 13-Mar % Growth Dividend (Dividend Option will in turn have two Investment Options
 QUANTUM LONG TERM EQUITY FUND An Open ended Equity Nature of Features An Open-ended Equity Equity Investment Objective The investment objective of the is to achieve long-term capital appreciation by investing
You work hard to earn money. Invest it wisely
 You work hard to earn money. Invest it wisely DATE OF ALLOTMENT August 08,2002 BENCHMARK Crisil Short Term Bond Fund Index FUND SIZE Rs.7122.84 (Rs. in Cr.) MONTHLY AVERAGE AUM Rs.6877.3 (Rs. in Cr.) EXIT
Franklin Templeton Mutual Fund
 Franklin Templeton Mutual Fund Dear Investor, The Board of Directors of Franklin Templeton Trustee Services Pvt. Ltd., Trustee to Franklin Templeton Mutual Fund, have the pleasure of presenting before
Comparative Performance of all schemes as on May 31, 2018
 Tata Equity P/E Fund - Reg - Growth 11,354 13.54 15,407 15.45 29,968 24.53 138,983 20.80 29-Jun-04 Scheme Benchmark () 11,508 15.08 13,251 9.81 19,163 13.88 85,334 16.64 Fund Manager: Sonam Udasi (Managing
Canara Robeco Emerging Equities. Type/Category: Open Ended Equity Scheme. (Indicative) (Indicative) Min Max Min Max Min Max Min Max Equity and
 (Indicative) Min Max Min Max Min Max Min Max Equity and") Key Disclosure Canara Robeco Infrastructure Type/category: Open Ended Equity Investment Objective: To generate income/capital appreciation by investing in equities and equity related instruments of companies
Key Disclosure Canara Robeco Infrastructure Type/category: Open Ended Equity Investment Objective: To generate income/capital appreciation by investing in equities and equity related instruments of companies
IIFL INDIA GROWTH FUND. (An open ended equity Scheme)
") IIFL INDIA GROWTH FUND (An open ended equity Scheme) IIFL INDIA GROWTH FUND (An open ended equity Scheme) This product is suitable for investors who are seeking* capital appreciation over long term; Investment
IIFL INDIA GROWTH FUND (An open ended equity Scheme) IIFL INDIA GROWTH FUND (An open ended equity Scheme) This product is suitable for investors who are seeking* capital appreciation over long term; Investment
Mutual Funds. Fortune Equity Brokers (India) Ltd.
 Ltd.") Mutual Funds A simple tool to achieve financial i goals.. What is Mutual Funds? Passed back to Generates Returns = Investor Pools money with Fund House Fund Managers invest in Capital Market Types of Mutual
Mutual Funds A simple tool to achieve financial i goals.. What is Mutual Funds? Passed back to Generates Returns = Investor Pools money with Fund House Fund Managers invest in Capital Market Types of Mutual
Why Small and Midcap Companies
 August 2012 1 Why Small and Midcap Companies Superior Growth Growth Presence in generally new & faster growing segments MATURITY Ability to gain share due to DECLINE new technology, better products / services
Understanding The Factsheet
 Monthly Fact Sheet January 2019 Understanding The Factsheet Fund Manager An employee of the asset management company such as a mutual fund or life insurer, who manages investments of the scheme. He is
Invest in the spending power of a billion people.
 Invest in the spending power of a billion people. DATE OF ALLOTMENT December 28, 2015 BENCHMARK Nifty India Consumption TRI (WEF From 1st February 2018) FUND SIZE Rs.788.83 (Rs. in Cr.) MONTHLY AVERAGE
PRODUCT LABELING FOR SCHEMES OF FRANKLIN TEMPLETON MUTUAL FUND
 PRODUCT LABELING FOR SCHEMES OF FRANKLIN TEMPLETON MUTUAL FUND Sr. No. 1. Franklin India Treasury Management Account Regular income for short term A liquid fund that invests in short term and money market
Motilal Oswal MidCap 100 ETF
 Motilal Oswal MidCap 100 ETF Product labeling This product is suitable for investors who are seeking* Return that corresponds generally to the performance of the NIFTY Midcap 100 index, subject to tracking
CONTENTS. page no. MARKET REVIEW HDFC Equity Fund... 5 HDFC Top 200 Fund... 6
 March 2017 CONTENTS page no. MARKET REVIEW... 3 HDFC Growth Fund... 4 HDFC Equity Fund... 5 HDFC Top 200 Fund... 6 HDFC Capital Builder Fund... 7 HDFC Core & Satellite Fund... 8 HDFC Premier Multi-Cap
QUANTUM TAX SAVING FUND
 QUANTUM TAX SAVING FUND An Open Ended Equity Linked Saving with a Statutory Lock in of 3 years and Tax Benefit Investment Objective : The investment objective of the is to achieve long-term capital appreciation
Time to Play on Infra
 20 May 2014 Time to Play on Infra What has changed? New business-friendly majority Government in power Improvement in policy environment Infrastructure thrust by new Govt. Capex cycle is bottoming out
QUANTUM EQUITY FUND OF FUNDS
 QUANTUM EQUITY FUND OF FUNDS An Open Ended Fund of Funds scheme Investing in Open Ended Diversified Equity s of Mutual Fund Investment Objective : The investment objective of the scheme is to generate
QUANTUM EQUITY FUND OF FUNDS
 QUANTUM EQUITY FUND OF FUNDS An Open Ended Fund of Funds scheme Investing in Open Ended Diversified Equity s of Mutual Fund Investment Objective : The investment objective of the scheme is to generate
QUANTUM LONG TERM EQUITY VALUE FUND
 QUANTUM LONG TERM EQUITY VALUE FUND An Open Ended Equity following a Value Investment Strategy Investment Objective : The investment objective of the is to achieve long-term capital appreciation by investing
Equity Funds Ready Reckoner
 s Ready Reckoner Name Investment Theme Product Positioning Key Features Manager Monthly AAUM Mcap (%)* (Rs. Crs) Overweight Underweight Beta Sharpe Standard Deviation (%) 3 years Alpha (%) Kotak 50 Large
QUANTUM LONG TERM EQUITY VALUE FUND
 QUANTUM LONG TERM EQUITY VALUE FUND An Open Ended Equity following a Value Investment Strategy Investment Objective : The investment objective of the is to achieve long-term capital appreciation by investing
Product Labeling This product is suitable for investors who are seeking*: Riskometer
 Product Labeling This product is suitable for investors who are seeking*: Riskometer Long term capital appreciation. Investments in high growth companies along with the liquidity of an open-ended scheme
Mutual Fund Industry in India. December 23, 2013 Sandesh Kirkire CEO Kotak Mutual Fund
 Mutual Fund Industry in India December 23, 2013 Sandesh Kirkire CEO Kotak Mutual Fund A View of Indian Mutual Fund Industry Total industry AUM with break-up across Equity, Debt & Gold Money Market Rs.
QUANTUM EQUITY FUND OF FUNDS
 QUANTUM EQUITY FUND OF FUNDS An Open Ended Fund of Funds scheme Investing in Open Ended Diversified Equity s of Mutual Fund Investment Objective : The investment objective of the scheme is to generate
QUANTUM EQUITY FUND OF FUNDS
 QUANTUM EQUITY FUND OF FUNDS An Open Ended Fund of Funds scheme Investing in Open Ended Diversified Equity s of Mutual Fund Investment Objective : The investment objective of the scheme is to generate
Analysing Risk Return and Performance of Mutual Funds
 Analysing Risk Return and Performance of Mutual Funds An Investor Education & Awareness Initiative By Franklin Templeton Mutual Fund Risks Associated With Mutual Funds Market Risk Industry Risk Country
QUANTUM TAX SAVING FUND
 QUANTUM TAX SAVING FUND An Open Ended Equity Linked Saving with a Statutory Lock in of 3 years and Tax Benefit Investment Objective : The investment objective of the is to achieve long-term capital appreciation
Riskometer. *Investors should consult their financial advisers if in doubt about whether the product is suitable for them.
 1 Product Labeling This product is suitable for investors who are seeking*: Regular income and capital appreciation. To generate income by investing in arbitrage opportunities in the cash and derivatives
Mutual Fund Screener For the quarter ended Jun -18
 Mutual Fund Screener For the quarter ended Jun -18 Mutual Fund Screener What s Inside 01 Industry Size 02 Investor Trends 03 Inflow Outflow Analysis 04 Sector Update 05 Category Performance 06 Industry
Trustee: Board of Trustees 16, V. N. Road, Fort, Mumbai , India
 Common Key Information Memorandum Continuous Offer of Units at NAV based prices This Common Key Information Memorandum (KIM) sets forth the information, which a prospective investor ought to know before
Equity Update May 2018
 Market Overview (as on April 30, 2018) Flows Apr-18 Mar-18 Feb-18 FIIs (Net Purchases / Sales) (Rs cr) MFs (Net Purchases / Sales) (Rs cr) Domestic Markets Macro Indicators GDP (YoY%) IIP (YoY%) Crude
QUANTUM LONG TERM EQUITY VALUE FUND
 QUANTUM LONG TERM EQUITY VALUE FUND An Open Ended Equity following a Value Investment Strategy Investment Objective : The investment objective of the is to achieve long-term capital appreciation by investing
CONTENTS. page no. MARKET REVIEW HDFC Equity Fund... 5 HDFC Top 200 Fund... 6
 February 2017 CONTENTS page no. MARKET REVIEW... 3 HDFC Growth Fund... 4 HDFC Equity Fund... 5 HDFC Top 200 Fund... 6 HDFC Capital Builder Fund... 7 HDFC Core & Satellite Fund... 8 HDFC Premier Multi-Cap
QUANTUM TAX SAVING FUND
 QUANTUM TAX SAVING FUND An Open Ended Equity Linked Saving with a Statutory Lock in of 3 years and Tax Benefit Investment Objective : The investment objective of the is to achieve long-term capital appreciation
HDFC Prudence Fund (An Open Ended Balanced Scheme)
") Rs 10,000 has become Rs 5.4 lacs (54 times) in 22 years CAGR of 19.2% for over 22 years since inception HDFC Prudence Fund (An Open Ended Balanced Scheme) Prudence Yatra is Prudent Yatra Over 2 Decades
Rs 10,000 has become Rs 5.4 lacs (54 times) in 22 years CAGR of 19.2% for over 22 years since inception HDFC Prudence Fund (An Open Ended Balanced Scheme) Prudence Yatra is Prudent Yatra Over 2 Decades
Open-ended Growth / Equity Schemes
 Open-ended Growth / Equity Schemes Open-ended Balanced Schemes Open-ended Equity Linked Savings Schemes Open-ended Index Linked Scheme Open-ended Income Schemes (Hybrid) Open-ended Fund of Fund Scheme
You work hard to earn money. Invest it wisely
 You work hard to earn money. Invest it wisely DATE OF ALLOTMENT September 03,2003 BENCHMARK I-Sec Composite Index FUND SIZE Rs.1136.26 (Rs. in Cr.) MONTHLY AVERAGE AUM Rs.1140.43 (Rs. in Cr.) EXIT LOAD
You work hard to earn money. Invest it wisely
 You work hard to earn money. Invest it wisely DATE OF ALLOTMENT September 03,2003 BENCHMARK I-Sec Composite Index FUND SIZE Rs.1141.39 (Rs. in Cr.) MONTHLY AVERAGE AUM Rs.1142.50 (Rs. in Cr.) EXIT LOAD
Wealth management a fresh perspective. Caterpillar... Religare Large Cap Core Portfolio... Panther... Leo Portfolio...
 Wealth management a fresh perspective Portfolios Caterpillar... Religare Large Cap Core Portfolio... Panther... Leo Portfolio... Religare Sector Opportunities Portfolio.... Infrastructure... Page 1 of
WEARS THE CAP THAT SUITS THE OCCASION
 MULTICAP FUND (An open ended equity scheme investing across large cap, mid cap, small cap stocks) WEARS THE CAP THAT SUITS THE OCCASION Tata Multicap Fund aims to fit into the right role across market
For product labelling please refer to slide no 16
 For product labelling please refer to slide no 16 Structural bull markets see intermittent correction phases Actively managed Small & Midcap funds vs Indices -11.9% -13.4% -19.4% -34.5% -15.7% Growth of
Franklin Templeton Mutual Fund
 Franklin Templeton Asset Management (India) Pvt. Ltd. Franklin Templeton Mutual Fund Key Information Memorandum and Common Application Form Sale of units on an ongoing basis at a Net Asset Value (NAV)
Understanding The Factsheet
 Monthly Fact Sheet July 2018 Understanding The Factsheet Fund Manager An employee of the asset management company such as a mutual fund or life insurer, who manages investments of the scheme. He is usually
fun Equity Diversified Large Cap Index Diversified Mid Cap & Small Cap Diversified Multi Cap Balanced Diversified Theme Based Sector Tax Saver
 fun e ge Equity Diversified Large Cap Vision Fund... 02 Top 200 Fund... 03 Quant Plus Fund... 04 NRI Equity Fund... 05 Equity Fund... 06 Index Index Fund - Nifty Plan... 06 Index Fund - Sensex Plan...
Axis Dynamic Equity Fund. (An Open - Ended Dynamic Asset Allocation Fund)
") Axis Dynamic Equity Fund (An Open - Ended Dynamic Asset Allocation Fund) Emotions and Impact Manual market timing Emotions have impacted investment decisions Investors ended up investing at market peak
Axis Dynamic Equity Fund (An Open - Ended Dynamic Asset Allocation Fund) Emotions and Impact Manual market timing Emotions have impacted investment decisions Investors ended up investing at market peak
Flow of the Presentation
 Flow of the Presentation Characteristics of Equity & Debt Investor Requirement Hybrid Funds Benefit from Dual Advantage SBI Dual Advantage Fund Series XXVI Disclaimer Characteristics of Equity & Debt %
There is a high dispersion in long term stock performance
 There is a high dispersion in long term stock performance Variation in top and bottom stocks over the last 10 years % CAGR (CY 07-17) BSE 100 index 5.5 Top quartile 16.7 Bottom quartile (21.2) Weak companies
Mutual Fund Screener For the quarter ended Dec-17
 Mutual Fund Screener For the quarter ended Dec-17 Mutual Fund Screener What s Inside 01 Industry Size 02 Investor Trends 03 Inflow Outflow Analysis 04 Sector Update 05 Category Performance 06 Industry
Understanding The Factsheet
 Monthly Fact Sheet June 2018 Understanding The Factsheet Fund Manager An employee of the asset management company such as a mutual fund or life insurer, who manages investments of the scheme. He is usually
Flexibility that endeavours to give you the best of both Short Term and Long Term
 Reliance Capital Asset Management Limited A Reliance Capital Company August 2015 Flexibility that endeavours to give you the best of both Short Term and Long Term Reliance Dynamic Bond Fund (An open ended
Flow of the Presentation
 Flow of the Presentation Characteristics of Equity & Debt Investor Requirement Hybrid Funds Benefit from Dual Advantage SBI Dual Advantage Fund Series V Disclaimer Characteristics of Equity & Debt % CAGR
Franklin Templeton Mutual Fund
 Franklin Templeton Asset Management (India) Pvt. Ltd. Franklin Templeton Mutual Fund Key Information Memorandum and Common Application Form Sale of units on an ongoing basis at a Net Asset Value (NAV)