Builders to the nation. Analyst Presentation Q4 / FY18. May 28, 2018
|
|
|
- Lillian Harrell
- 5 years ago
- Views:
Transcription


1 Builders to the nation Analyst Presentation Q4 / FY18 May 28, 2018
2 Disclaimer 2 This presentation contains certain forward looking statements concerning L&T s future business prospects and business profitability, which are subject to a number of risks and uncertainties and the actual results could materially differ from those in such forward looking statements. The risks and uncertainties relating to these statements include, but are not limited to, risks and uncertainties regarding fluctuations in earnings, our ability to manage growth, competition (both domestic and international), economic growth in India and the target countries for exports, ability to attract and retain highly skilled professionals, time and cost over runs on contracts, our ability to manage our international operations, government policies and actions with respect to investments, fiscal deficits, regulations, etc., interest and other fiscal costs generally prevailing in the economy. Past performance may not be indicative of future performance. The company does not undertake to make any announcement in case any of these forward looking statements become materially incorrect in future or update any forward looking statements made from time to time by or on behalf of the company.


3 Presentation Outline 3 Group Performance Highlights Group Performance Summary Segment / Key Subsidiaries The Environment & the Outlook


")
4 Performance Highlights FY18 4 Order Inflow +7% Revenue (like-to-like) +9.5% EBITDA +22% PAT +22% ROE 13.9% (+110bps) Div/Share 16/- (Payout 48%)
5 Key Financial Indicators 5 Q4 FY17 Q4 FY18 Amount in bn % Var Particulars FY17 FY18 % Var % Order Inflow % % Revenue from Operations (like-to-like) % % EBITDA % 13.5% 14.2% +70 bps EBITDA Margin (ex services) 10.0% 10.5% +50 bps % PAT % Net Working Capital 18.6% 19.2% +60 bps RONW (%) 12.8% 13.9% +110 bps Dividend (per share)-post bonus
6 Presentation Outline 6 Group Performance Highlights Group Performance Summary Segment / Key Subsidiaries The Environment & the Outlook


7 Q4/FY18 Order Inflow/Order Book Amount in bn 7 Order Inflow % 496 Ordering activity pre- dominantly led by public sector Domestic inflows compensates for decline in international inflows Order Book Private sector capex (including real estate) still muted. Nascent signs of pickup in metals 698 FY FY Large diversified order book smoothening sectoral cyclicality; 3X E&C Book to Bill Dom Intl Dom Intl
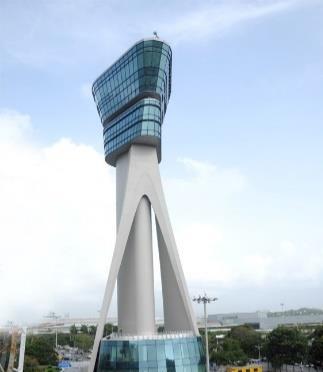
8 Key Orders won during FY18 8 Order Details Client Segment Value International Integrated light rail-based Urban Transit system Govt of Mauritius Infrastructure ~ USD 520 mn Haliba Field Development EPC Contract Al Dhafra Petro-UAE Hydrocarbon ~ USD 340 mn Crude Transit Line Kuwait Oil Company Hydrocarbon ~ USD 260 mn Gas based Power plant in Bangladesh BPDB Power ~ USD 250 mn Domestic Mumbai Trans Harbour Link MMRDA Infrastructure ~ 86 bn Railway track (Eastern corridor) DFCCIL Infrastructure ~ 29 bn Design & Construction of Roads, Water Supply, Sewerage Treatment Plants Survey, Design Validation and Revamping of entire Water supply system for Pune City APCRDA Infrastructure ~ 23 bn Pune Municipal Corp. Infrastructure ~ 17 bn Hydrocracker Project HPCL, Vizag Hydrocarbon ~ 16 bn Six Lane extra dosed bridge across Hoogly river WBHDCL Infrastructure ~ 14 bn South Parallel Runway-Bangalore Airport BIAL Infrastructure ~ 14 bn Blast Furnace - Dolvi JSW Steel Infrastructure ~ 13 bn Integrated Infrastructure Package of ABD Area Udaipur Smart City Ltd Infrastructure ~ 11 bn Steam Generator and End Shields NPCIL Heavy Engg. ~ 7 bn
9 Group Performance Sales & Costs 9 Q4 FY17 Q4 FY18 % Var ` Billion FY17 FY18 % Var % Revenue (like-to-like) 1,093 1, % 31% 29% -2% International Revenue % 34% 33% -1% % MCO Exp % % Fin. Charge Opex* % % Staff Costs % % Sales & Admin % % Total Opex 989 1,063 7% Infra, Hydrocarbon and services businesses drives revenue growth MCO charge benefits from cost curtailment and operating efficiencies Services business growth drives increase in staff costs AR Provisions leads to SGA cost increase * Finance cost of financial services business and finance lease activity
10 Group Performance EBITDA to PAT 10 Q4 FY17 Q4 FY18 % Var ` Billion FY17 FY18 % Var % EBITDA % (3) (4) 41% Fin. Cost (13) (15) 15% (7) (5) -32% Depreciation (24) (19) -19% % Other Income % (3) (15) Tax Expense (20) (32) 1 (1) JV/S&A PAT Share (4) (4) (2) (2) 9% Non-controlling Interest (4) (6) 43% (3) - Exceptional items % PAT % EBITDA growth mainly contributed by Infra, Realty and Fin services businesses Other income comprises of treasury earnings Finance Cost commensurate with average borrowing level Higher tax provision mainly due to Rule 14A provisions, timing differences on DDT Credit from Subs. and higher PBT
11 Presentation Outline 11 Group Performance Highlights Group Performance Summary Segment / Key Subsidiaries The Environment & the Outlook
12 Segment Composition 12 Infrastructure Power Heavy Engineering Electrical & Automation Buildings & Factories (B&F) Transportation Infra (TI) EPC- Coal & Gas Process Plant Equipment Electrical Standard Products Heavy Civil infra (HC) Water & Effluent Treatment (WET) Power T&D (PT&D) Thermal Power Plant Construction Electrostatic Precipitator Nuclear Power Plant Equipment Defence & Aerospace Electrical Systems & Equipment Metering & Protection Smart World & Communication (SW&C) Power Equipment Mfg* Piping Centre & *Forgings Control & Automation Hydrocarbon Developmental Projects IT & TS Financial Services Others Onshore Roads* Metros Information Technology Rural Lending Housing Finance Shipbuilding Realty Offshore Ports Power Technology Services Wholesale Finance Asset Management Metallurgical & Material Handling Industrial Products & Machinery * Consolidated at PAT level


13 FY18 Order Inflow Composition 13 Power 1.6% HE 3.8% E&A 3.7% Hydrocarbon 10.3% Services 16.7% Others 6.8% Infrastructure 57.1% Order Inflow 1529 Bn Middle East 10.5% USA & Europe 6.5% Domestic 76.6% ROW 6.4%


14 FY18 Order Book Composition 14 Power 3.6% HE 5.1% E&A 1.2% Hydrocarbon 10.1% Others 5.7% Infrastructure 74.3% Order Book 2631 Bn Middle East 16.8% Domestic 76.2% ROW 7.0%

15 FY18 Revenue Composition 15 Power 5.2% HE 3.2% E&A 4.4% Hydrocarbon 9.8% IT & TS 9.3% Fin. Services 8.4% Devl. Proj. 3.6% Others 6.9% Infrastructure 49.3% Revenue 1199 Bn Middle East 20.5% USA& Europe 8.5% ROW 4.1% Domestic 66.9%

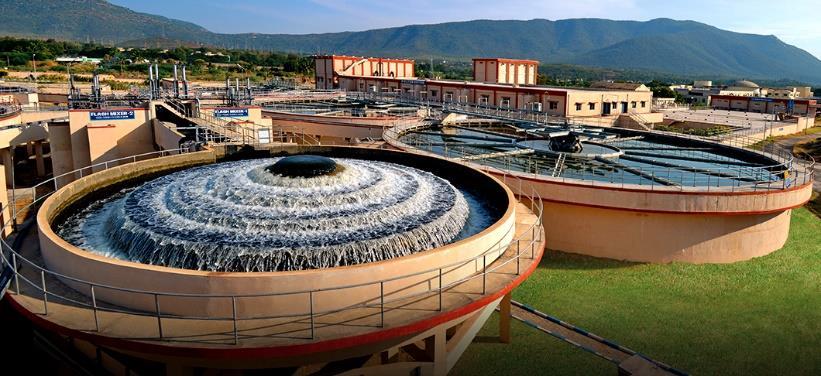
16 Infrastructure Segment Amount in ` bn 16 Net Revenue & EBITDA Margin Heavy Civil and Water businesses drives revenue growth Pick up in domestic execution compensates for slowdown in overseas markets Margin reflects job mix and stage of project completion
17 Power Segment Amount in ` bn 17 Net Revenue & EBITDA Margin Aggressive competition and limited opportunities continues to impact order inflow Revenue decline reflects depleting domestic order book Execution of International orders on track Profits of MHPS and other JV companies are consolidated at PAT level under equity method
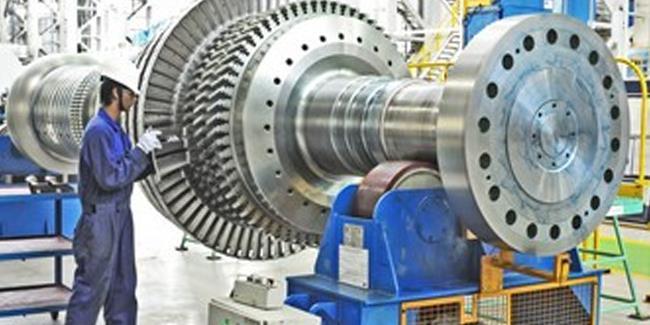
18 Heavy Engineering Segment Amount in ` bn 18 Net Revenue & EBITDA Margin Defence business drives revenue growth FY18 International revenues impacted by slowdown in refining ordering Margin difference due to variation in job execution stages
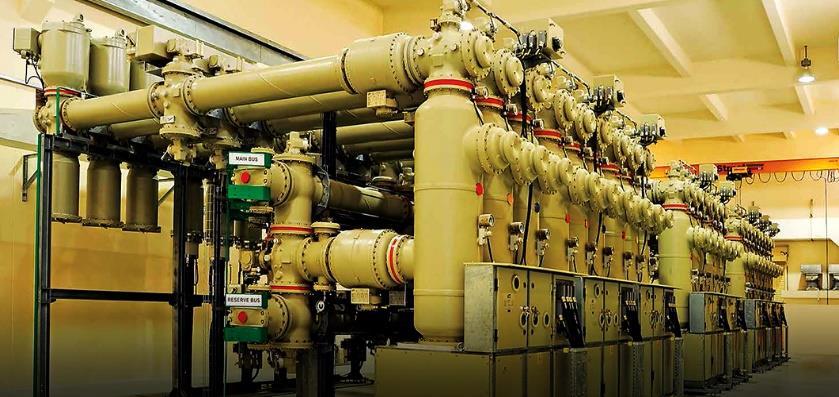
19 Electrical & Automation Segment Amount in ` bn 19 Net Revenue & EBITDA Margin Revenue growth for FY18 largely contributed by product business Margin growth driven by Standard Products group and cost efficiencies across multiple Business Units Undertaking signed for sale of E&A business to Schneider Electric for 140 bn subject to regulatory clearances
20 Hydrocarbon Segment Amount in ` bn 20 Net Revenue & EBITDA Margin Strong ordering activity witnessed in domestic & overseas markets Higher revenue growth on efficient execution of international order book Margin variance due to job stage mix
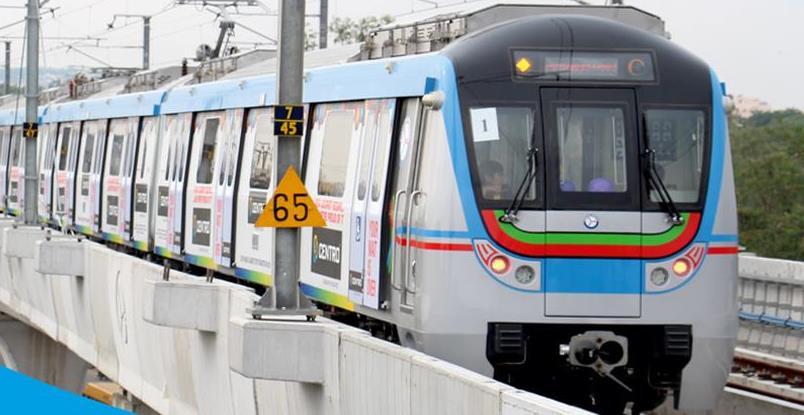
21 Developmental Projects Segment Amount in ` bn 21 Net Revenue & EBITDA Margin Segment includes Power Development, Hyderabad Metro and Kattupalli Port IDPL (Roads & TL) consolidated at PAT level under Equity method. Completed InvIT for 5 road projects in May 2018 Partial CoD of 30Km stretch in Hyderabad Metro in Nov Q4 includes 2bn charge on account of provision for disputed receivables (Nabha)

22 IT & Technology Services Segment Amount in ` bn 22 Net Revenue & EBITDA Margin LTI FY18 revenue growth led by BFS, Energy & Utilities and CPG, Retail & Pharma Verticals LTTS FY18 revenue growth led by Telecom & Hi-Tech and Transportation verticals
23 Others Segment Amount in ` bn 23 Net Revenue & EBITDA Margin Segment includes Metallurgical & Material Handling, Industrial Products & Machinery, Realty and Shipbuilding businesses Revenues affected by lower offtake in Valves business, slowdown in Realty sector and delayed clearance/lower opening Order Book in MMH Asset Monetisation in Realty Business
24 L&T Finance Holdings (I-GAAP) 24 Q4 FY17 Q4 FY18 % Var ` Bn FY17 FY18 % Var % Total Income % % PAT attributable to Equity Shareholders % Mutual Fund Average AUM Loan Book Net NPA (%) Networth ROE % % 5.0% 2.3% -268 bps % 12.3% 15.0% +272 bps Growth momentum continues in Lending & investment management businesses Digital and Data Analytics aid operations including risk management Focus on retailisation of the portfolio, growth in focused businesses, asset quality, fee income, cost control and productivity gains Net worth increased due to Equity Issue of 30bn in Q4FY18
25 Presentation Outline 25 Group Performance Highlights Group Performance Summary Segment / Key Subsidiaries The Environment & the Outlook


26 MOAT The Environment & the Outlook 26 Central & State Govt. Spends PSU Capex MOAT Inflation Multilateral Funding Land Acquisition / ROW Budgetary Allocations Bharatmala / Infra thrust Value Monetisation Operational Excellence Consumption trends Client Payments & Clearances IBC / Twin Balance Sheet Resolution Inflation / Commodity Prices Middle East Capex Robust Order Acquisitions NWC Control Payouts RoE Thrust Divestments Efficient & Profitable Execution Asset Utilisation MOAT Global Protectionist Policies Tax Revenues Nominal GDP Growth Private Sector Capex Currency Rural & Social Welfare Financialization of Savings MOAT Competition Oil Prices New Geographies Fiscal Deficit / CAD
27 Thank You 27
28 Annexures 28
29 Group Profit & Loss Extracts 29 ` Billion FY18 FY17 % Var Income from Operations* , , % EBITDA % Other Income % Interest Expenses (0.3) (0.0) (0.5) (14.6) (15.4) (13.4) 15% Depreciation (2.4) (0.5) (0.7) (15.6) (19.3) (23.7) -19% Provision for Taxes (5.0) (1.8) (0.3) (24.9) (32.0) (20.1) 59% Share in profit/(loss) of JVs / Associates Adjustments for non -controlling interest in Subs., etc. IT & TS Fin. Services Devl. Projects L&T & Others (Incl. Eliminations) L&T Group 0.0 (3.9) (0.4) (4.4) (4.0) (2.3) (4.6) (6.3) (4.4) Exceptional Items % Net PAT (2.8) % *Income from operations does not include Excise duty from 1 st July, 2017
30 Balance Sheet 30 ` Billion Mar-18 Mar-17 Incr / (Decr) Equity & Reserves Non Controlling Interest Borrowings - Financial Services Development Projects Others (14) Sources of Funds 1,688 1, Fixed Assets (4) Intangible Assets & Investment Property Loans towards Financing Activities Finance lease receivable (3) Net Non-Current Assets Current Investments, Cash & Cash Equivalents (15) Net Current Assets Application of Funds 1,688 1,
31 Group Cash Flow 31 Q4 FY17 Q4 FY18 ` Billion FY17 FY Operating Profit Changes in Working Capital 43.5 (34.2) (6.6) (8.7) Direct Taxes paid (32.0) (34.0) Net Cash from Operations (A) (6.9) (1.0) Net Investment in Fixed Assets (incl. Intangible) (28.2) (20.2) (1.7) 2.0 Net (Purchase)/ Sale of Long Term investments (20.3) 57.0 Net (Purchase)/ Sale of Current investments (71.5) 29.1 (19.8) (2.0) Loans/Deposits made with JV/Associate Cos. (22.2) (3.9) Interest & Dividend Received (42.9) 78.9 Net Cash from/(used in) Invest. Act. (B) (98.0) Issue of Share Capital / Minority (22.1) Net Borrowings (26.3) (82.3) Disbursements towards financing activities* (57.4) (164.6) (4.7) (6.5) Interest & Dividend paid (42.7) (48.6) (16.6) (98.8) Net Cash from Financing Activities (C) (28.5) (70.9) Net (Dec) / Inc in Cash & Bank (A+B+C) (2.4) 32.5 * included under Net Cash from operations under statutory financial statements
32 Share in Profit/(Loss) of JVs/Associates 32 Q4 FY17 Q4 FY18 ` Bn FY17 FY MHPS JVs (1.35) IDPL & Subs. (3.45) (4.14) (0.46) (0.44) Special Steels and Heavy Forgings (1.87) (2.23) Others (1.17) Total (3.95) (4.36)
* 15 Operational Project Cost:")

: `478 Bn Ports: Portfolio: 2")

: `170 bn Power (Excl.")
33 Concessions Business Portfolio 21 SPVs 33 Roads and Bridges: Portfolio: 15 projects (1661 Km)* 15 Operational Project Cost: `161 bn Transmission Lines: Portfolio: 1 project (482 Km) - Operational Project Cost: `15 bn Balance Equity Commitment (Mar 2018): ` 11 Bn Equity Invested at SPV level (Mar 2018): ` 93 Bn Total Project Cost (Mar 2018): `478 Bn Ports: Portfolio: 2 projects (18 MTPA) - Operational Project Cost: `20 bn Metros: Portfolio: 1 project (71.16 Km) Under-implementation Project Cost (Fin. Closure): `170 bn Power (Excl. Projects under DPR): Portfolio: 2 projects (1499 MW) 1 Operational Project Cost: `112 bn * As on 31 st Mar,2018
Builders to the nation. Analyst Presentation Q3/9M FY18. January 31, 2018
 1 Builders to the nation Analyst Presentation Q3/9M FY18 January 31, 2018 Disclaimer 2 This presentation contains certain forward looking statements concerning L&T s future business prospects and business
Analyst Presentation - Q1 FY18. July 28, 2017
 1 Analyst Presentation - Q1 FY18 July 28, 2017 Disclaimer 2 This presentation contains certain forward looking statements concerning L&T s future business prospects and business profitability, which are
Builders to the nation. Analyst Presentation Q2/H1 FY18. November 11, 2017
 1 Builders to the nation Analyst Presentation Q2/H1 FY18 November 11, 2017 Disclaimer 2 This presentation contains certain forward looking statements concerning L&T s future business prospects and business
Larsen & Toubro Analyst Presentation H1 FY16 October 30, 2015
 Larsen & Toubro Analyst Presentation H1 FY16 October 30, 2015 Disclaimer This presentation contains certain forward looking statements concerning L&T s future business prospects and business profitability,
Larsen & Toubro Analyst Presentation Q1 FY16 July 31, 2015
 Larsen & Toubro Analyst Presentation Q1 FY16 July 31, 2015 Disclaimer This presentation contains certain forward looking statements concerning L&T s future business prospects and business profitability,
May 30, Analyst Presentation FY15
 May 30, 2015 Analyst Presentation FY15 Disclaimer This presentation contains certain forward looking statements concerning L&T s future business prospects and business profitability, which are subject
Analyst Presentation - Q4 / FY17. May 29, 2017
 1 Analyst Presentation - Q4 / FY17 May 29, 2017 Disclaimer 2 This presentation contains certain forward looking statements concerning L&T s future business prospects and business profitability, which are
Presentation Outline. Q1 FY11 Performance Summary
 LARSEN & TOUBRO LIMITED Analyst Presentation Q1 FY11 Presentation Outline Q1 FY11 Performance Summary Segmental e Analysis s Performance of Key Subsidiaries Outlook 2 Presentation Outline Q1 FY11 Performance
LARSEN & TOUBRO LIMITED. Analyst Presentation 9M FY12
 LARSEN & TOUBRO LIMITED Analyst Presentation 9M FY12 Disclaimer This presentation contains certain forward looking statements concerning L&T s future business prospects and business profitability, which
L&T Press Release Issued by Corporate Brand Management & Communications
 L&T Press Release Issued by Corporate Brand Management & Communications L&T House, 2 nd Floor, Ballard Estate, Mumbai 400 001 Tel: 91 22 6752 5656 / 836 Fax: 91 22 6752 5796 CIN: L99999MH1946PLC004768
Investor Presentation
 1 Builders to the nation Investor Presentation Q2/H1 FY18 November 11, 2017 Disclaimer 2 This presentation contains certain forward looking statements concerning L&T s future business prospects and business
Group Performance for the quarter ended September 30, 2018
 Group Performance for the quarter ended September 30, Consolidated Results Stellar performance: Growth in Order Inflow 46%, Revenue 21% & PAT 23% Mumbai, October 31, : Larsen & Toubro recorded Consolidated
L&T Press Release Issued by Corporate Brand Management & Communications
 L&T Press Release Issued by Corporate Brand Management & Communications L&T House, 2 nd Floor, Ballard Estate, Mumbai 400 001 Tel: 91 22 6752 5656 / 836 Fax: 91 22 6752 5796 CIN: L99999MH1946PLC004768
Analyst Presentation Q1 09. July 28,
 Analyst Presentation Q1 09 July 28, 2008 1 Disclaimer This presentation contains certain forward looking statements concerning L&T s future business prospects and business profitability, which are subject
L&T Press Release Issued by Corporate Brand Management & Communications
 L&T Press Release Issued by Corporate Brand Management & Communications L&T House, 2 nd Floor, Ballard Estate, Mumbai 400 001 Tel: 91 22 6752 5656 / 836 Fax: 91 22 6752 5796 CIN: L99999MH1946PLC004768
Disclaimer. 17 th May
 17 th May 2010 LARSEN & TOUBRO LIMITED Disclaimer This presentation contains certain forward looking statements concerning L&T s future business prospects and business profitability, which are subject
Thanking you, Yours faithfully, for LARSEN & TOUBRO LIMITED
 Q LARSEN & TOUBRO SEC/PAM/201 Larsen & Toubro Limited Secretarial Department L&T House, Ballard Estate Narottam Morarjee Marg Murnbai - 400 001, INDIA Tel: +91 22 6752 5656 Fax: +91 22 6752 593 tww.larsentoubro.com
Larsen & Toubro BUY. Profit +34% YoY as margins expand but order inflows decline. 13 November 2017 India Infrastructure Company Update
 13 November 2017 India Infrastructure Company Update Larsen & Toubro BUY Profit +34% YoY as margins expand but order inflows decline L&T delivered 34% growth YoY in 2QFY18 consolidated net profits, driven
LARSEN & TOUBRO LIMITED Registered Office: L&T House, Ballard Estate, Mumbai CIN : L99999MH1946PLC004768
 1 Income: a) Income from operations 23499.65 15946.20 22265.41 66301.35 63812.65 b) Other income 345.31 498.74 761.26 1971.85 2341.04 Total Income 23844.96 16444.94 23026.67 68273.20 66153.69 2 Expenses:
Larsen & Toubro. Source: Company Data; PL Research
 Domestic execution showing positive trends July 28, 2017 Kunal Sheth kunalsheth@plindia.com +91 22 66322257 Rating BUY Price Rs1,159 Target Price Rs1,328 Implied Upside 14.6% Sensex 32,310 Nifty 10,015
Larsen & Toubro BUY. Performance Highlights. CMP `1,122 Target Price `1,310. 3QFY2016 Result Update Infrastructure
 3QFY2016 Result Update Infrastructure February 2, 2015 Larsen & Toubro Performance Highlights Quarterly highlights - Standalone Y/E March (` cr) 3QFY16 2QFY16 3QFY15 % chg (yoy) % chg (qoq) Net sales 14,774
ICICI Group: Strategy & Performance. February 2010
 ICICI Group: Strategy & Performance February 2010 Certain statements in these slides are forward-looking statements. These statements are based on management's current expectations and are subject to uncertainty
Larsen & Toubro (LT IN)
") (LT IN) Rating: BUY CMP: Rs1,321 TP: Rs1,566 July 25, 2018 Company Report Change in Estimates Target Reco Change in Estimates Current Previous FY19E FY20E FY19E FY20E Rating BUY BUY Target Price 1,566
(LT IN) Rating: BUY CMP: Rs1,321 TP: Rs1,566 July 25, 2018 Company Report Change in Estimates Target Reco Change in Estimates Current Previous FY19E FY20E FY19E FY20E Rating BUY BUY Target Price 1,566
Reliance Infrastructure Ltd. Investor Presentation
 Reliance Infrastructure Ltd. Investor Presentation Disclaimer By attending this presentation, you are agreeing to be bound by the restrictions set out below. Any failure to comply with these restrictions
Larsen & Toubro. CMP: INR1,160 TP: INR1,417 Buy
 BSE SENSEX S&P CNX 16,216 4,908 Bloomberg LT IN Equity Shares (m) 608.9 52-Week Range (INR) 1,868/971 1,6,12 Rel. Perf. (%) -4/-7/12 M.Cap. (INR b) 706.3 M.Cap. (USD b) 13.1 * Consolidated; EPS is fully
LARSEN & TOUBRO LIMITED Registered Office: L&T House, Ballard Estate, Mumbai CIN : L99999MH1946PLC004768
 1 Gross Sales / Revenue from operations 1085059 1914591 1044662 5755807 Less: Excise duty 14044 17799 10900 54066 Net Sales/Revenue from operations 1071015 1896792 1033762 5701741 2 Expenses: a) i) Consumption
THE BANKER TO EVERY INDIAN. Annual Results FY
 THE BANKER TO EVERY INDIAN Annual Results FY 2011-12 Healthy Growth in NII and Operating Profit - a Snapshot (1/2) Rs. In Crores Q4 FY11 Q4 FY12 Gr.% FY11 FY12 Gr.% Interest Income 21721 28583 31.59 Interest
Larsen & Toubro Ltd.
 Feb-17 Mar-17 Apr-17 May-17 Jun-17 Jul-17 Aug-17 Sep-17 Oct-17 Nov-17 Dec-17 Jan-18 Feb-18 Volume No.. III Issue No. 163. Larsen & Toubro Ltd. February 26, 2018 BSE Code: 500510 NSE Code: LT Reuters Code:
LARSEN & TOUBRO LIMITED Registered Office: L&T House, Ballard Estate, Mumbai CIN : L99999MH1946PLC004768
 1 Gross Sales/Revenue from operations 1914591 1512489 2022938 5755807 5716385 Less : Excise duty 17799 12987 15028 54066 56493 Net Sales/Revenue from operations 1896792 1499502 2007910 5701741 5659892
IG Petrochemicals Ltd. Investor Presentation - FY16
 IG Petrochemicals Ltd Investor Presentation - FY16 1 Safe Harbor This presentation and the accompanying slides (the Presentation ), which have been prepared by I G Petrochemicals Limited (the Company ),
BUY. NCC LIMITED Result Update (CONSOLIDATED): Q1 FY16 SYNOPSIS. CMP Target Price SEPTEMBER 21 st, 2015 ISIN: INE868B01028
: Q1 FY16 SYNOPSIS. CMP Target Price SEPTEMBER 21 st, 2015 ISIN: INE868B01028") BUY CMP 68.20 Target Price 78.00 NCC LIMITED Result Update (CONSOLIDATED): Q1 FY16 SEPTEMBER 21 st, 2015 ISIN: INE868B01028 Index Details Stock Data Sector Construction & Engineering BSE Code 500294 Face
BUY CMP 68.20 Target Price 78.00 NCC LIMITED Result Update (CONSOLIDATED): Q1 FY16 SEPTEMBER 21 st, 2015 ISIN: INE868B01028 Index Details Stock Data Sector Construction & Engineering BSE Code 500294 Face
Analyst Meet Presentation Q4 FY10
 Analyst Meet Presentation Q4 FY10 Agenda Economic Scenario Steel Scenario Operating Highlights Project Progress Financial Performance 2 Improving Global Outlook 10 0 10 Centre depicts zero and periphery
NIIT Technologies. 3QFY19 Result Update. Robust revenue visibility, Outlook robust
 NIIT Technologies 3QFY19 Result Update Robust revenue visibility, Outlook robust Sector: Technology CMP: `1227 Recommendation: Buy Market statistics Current stock price (`) 1,227 Shares O/S (cr.) 6.1 Mcap
NIIT Technologies. 2QFY19 Result Update. Robust revenue visibility, Outlook robust
 NIIT Technologies 2QFY19 Result Update Robust revenue visibility, Outlook robust Sector: Technology CMP: `1199 Recommendation: Buy Market statistics Current stock price (`) 1,199 Shares O/S (cr.) 6.1 Mcap
JSW Steel post 17% higher EBIDTA at `4,501 crores
 Press Release February 06, 2019 JSW Steel post 17% higher EBIDTA at `4,501 crores Mumbai, India: JSW Steel Limited ( JSW Steel or the Company ) today reported its results for the third quarter and the
Financial Results December Investor Presentation
 Financial Results December 2018 Investor Presentation 0 Key Highlights PAT for 2018 is Rs 12.4 bn vs Rs 8.8 bn in 2017. PBT is Rs 21.6 bn for 2018 compared to Rs 29.5 bn in 2017 Ex settlement payment,
ICICI Group: Strategy and Performance. August 2009
 ICICI Group: Strategy and Performance August 2009 Certain statements in these slides are forward-looking statements. These statements are based on management's current expectations and are subject to uncertainty
ICICI Group: Performance & Strategy. May 2016
 ICICI Group: Performance & Strategy May 2016 Agenda Indian economy ICICI Group Key International regulatory business developments 2 India: strong long term fundamentals Key drivers of growth Favourable
Larsen & Toubro. Revenues a positive surprise...so is other income! Q1FY13 Result Update
 Revenues a positive surprise...so is other income! July 23, 2012 Rupa Shah rupashah@plindia.com +91-22-66322244 Rating Accumulate Price Rs1,378 Target Price Rs1,517 Implied Upside 10.1% Sensex 16,877 Nifty
FY2018: Performance review. May 7, 2018
 FY2018: Performance review May 7, 2018 Certain statements in these slides are forward-looking statements. These statements are based on management's current expectations and are subject to uncertainty
GMR INFRASTRUCTURE LTD
 GMR INFRASTRUCTURE LTD Financial Presentation for the year ended Mar 31, 2017 0 Table of Contents Particulars Pg. No. Consolidated Financial Performance 2 Airports Sector 7 Energy Sector 17 Highways Sector
NIIT Technologies. 4QFY17 Result Update. Robust revenue visibility, Margin expansion story intact. Sector: Technology CMP: `471. Recommendation: Buy
 NIIT Technologies 4QFY17 Result Update Robust revenue visibility, Margin expansion story intact Sector: Technology CMP: `471 Recommendation: Buy Market statistics Current stock price (`) 471 Shares O/S
Analyst Meet Presentation Q2 FY11. Analyst Meet Presentation Q2 FY11
 Analyst Meet Presentation Q2 FY11 Analyst Meet Presentation Q2 FY11 Agenda Key Developments Economic and Steel Scenario Performance Highlights Projects Update 2 Key Developments Highest ever quarterly
NIIT Technologies. Financial Performance Q4FY14. May 9, NIIT Technologies
 NIIT Technologies Financial Performance Q4FY14 May 9, 2014 Outline Financial Highlights FY14 Q4FY14 Business Update Financial Statements Income Statement Balance Sheet Business Analysis Financial Highlights
EARNINGS PRESENTATION H1-FY18 / Q2-FY18
 EARNINGS PRESENTATION H1-FY18 / Q2-FY18 1 Robust Sector Outlook The total length of the National highways is expected to cross ~200,000 Kms in next 5 years a) A total 83,677 Kms of roads will be built
LARSEN & TOUBRO LIMITED Registered Office: L&T House, Ballard Estate, Mumbai CIN : L99999MH1946PLC004768
 3 months ended Year ended 1 (a) Gross Sales/Revenues from operations 3305386 2561602 2793921 10222659 9034676 Less : Excise duty 24162 22887 25209 89054 75708 Net Sales/Revenues from operations 3281224
PEER GROUPS CMP MARKET CAP EPS P/E (X) P/BV(X) DIVIDEND Company Name (Rs.) Rs. in mn. (Rs.) Ratio Ratio (%)
 P/BV(X) DIVIDEND Company Name (Rs.) Rs. in mn. (Rs.) Ratio Ratio (%)") BUY CMP 244.05 Target Price 280.00 KALPATARU POWER TRANSMISSION LTD. Result Update (PARENT BASIS): Q3 FY15 March 2 nd 2015 ISIN: INE220B01022 Index Details Stock Data Sector Heavy Electrical Equipment
BUY CMP 244.05 Target Price 280.00 KALPATARU POWER TRANSMISSION LTD. Result Update (PARENT BASIS): Q3 FY15 March 2 nd 2015 ISIN: INE220B01022 Index Details Stock Data Sector Heavy Electrical Equipment
Larsen & Toubro (LARTOU) 1420
 1420") es Result Update Rating matrix Rating : Buy Target : 1655 Target Period : 12 months Potential Upside : 17% What s Changed? Target Changed from 1475 to 1655 EPS FY17E Changed from 56.3 to 61.6 EPS FY18E
es Result Update Rating matrix Rating : Buy Target : 1655 Target Period : 12 months Potential Upside : 17% What s Changed? Target Changed from 1475 to 1655 EPS FY17E Changed from 56.3 to 61.6 EPS FY18E
Reliance Infrastructure CMP: INR528
 BSE SENSEX S&P CNX 17,657 5,363 16 August 2012 1QFY13 Results Update Sector: Utilities Reliance Infrastructure CMP: INR528 Buy Bloomberg RELI IN Equity Shares (m) 267.5 52-Week Range (INR) 680/328 1,6,12
Simplex Infrastructures
 May-14 Jul-14 Aug-14 Sep-14 Nov-14 Dec-14 Jan-15 Mar-15 Apr-15 May-15 India Research Infrastructure May 27, 2015 QUARTERLY REVIEW Bloomberg: SINF IN Reuters: SINF.BO HOLD Working capital ease to improve
Equity Market Outlook. May, 2016
 Equity Market Outlook May, 2016 Global Economy Update Jan-15 Feb-15 Mar-15 Apr-15 May-15 Jun-15 Jul-15 Aug-15 Sep-15 Oct-15 Nov-15 Dec-15 Jan-16 Feb-16 Mar-16 Apr-16 Global Central Bank Monetary Policies
Larsen & Toubro (LT IN) Shines on all parameters and we get constructive
 Shines on all parameters and we get constructive") INSTITUTIONAL EQUITY RESEARCH Larsen & Toubro (LT IN) Shines on all parameters and we get constructive INDIA CAPITAL GOODS Quarterly Update Top takeaways from 2QFY19 Recurring PAT (Rs 19.4bn, 15% yoy)
INSTITUTIONAL EQUITY RESEARCH Larsen & Toubro (LT IN) Shines on all parameters and we get constructive INDIA CAPITAL GOODS Quarterly Update Top takeaways from 2QFY19 Recurring PAT (Rs 19.4bn, 15% yoy)
Bharat Forge. Result Update. Q4FY13 Result Highlights. Valuation. No Respite in Sight May 29, Institutional Research 1
 [ Result Update Equity India Forging & Industrials Bharat Forge Ltd. No Respite in Sight May 29, 2013 CMP (`) Target (`) 241 238 Potential Upside Absolute Rating (1.24)% HOLD Market Info (as on May 28,
Larsen & Toubro. Decent performance! Source: Company Data; PL Research
 Decent performance! July 30, 2016 Kunal Sheth kunalsheth@plindia.com +91 22 66322257 Samir Bendre samirbendre@plindia.com +91 22 66322256 Rating BUY Price Rs1,558 Target Price Rs1,590 Implied Upside 2.1%
BHARAT FORGE LIMITED Analyst Update FY 2018 Results
 BHARAT FORGE LIMITED Analyst Update FY 2018 Results BFL 12 MONTH REPORT FY18 has been a record year for the company with revenue growth surpassing underlying demand growth across sectors and geographies.
NIIT Technologies Ltd. (NIIT Tech)
") Result Update October 17, 2012 NIIT Technologies Ltd. (NIIT Tech) In-line Performance; Forex loss haunted net margin: Maintain Buy CMP : Rs.286 Reco : BUY Target : Rs.345 STOCK INFO BSE 532541 NSE NIITTECH
Result Update October 17, 2012 NIIT Technologies Ltd. (NIIT Tech) In-line Performance; Forex loss haunted net margin: Maintain Buy CMP : Rs.286 Reco : BUY Target : Rs.345 STOCK INFO BSE 532541 NSE NIITTECH
Capital Goods. 3QFY18E Results Preview. 10 Jan Sujit Jain
 Capital Goods Results Preview 10 Jan 2018 Sujit Jain sujit.jain@hdfcsec.com +91-22-6171 7314 Basanth Patil basanth.patil@hdfcsec.com +91-22-6171 7319 FY16 4Q FY16 1Q FY17 2Q FY17 FY17 4Q FY17 1Q FY18 2Q
Earnings Presentation. Annual Results FY16-17
 Earnings Presentation Annual Results FY16-17 1 Safe Harbor Except for the historical information contained herein, statements in this release which contain words or phrases such as will, aim, will likely
Larsen & Toubro (LT IN) Well played on all fronts but for margins
 Well played on all fronts but for margins") INSTITUTIONAL EQUITY RESEARCH Larsen & Toubro (LT IN) Well played on all fronts but for margins INDIA CAPITAL GOODS Quarterly Update Top takeaways from 3QFY19 Recurring PAT (Rs 20.4bn, 36% yoy) was 20%/8%
INSTITUTIONAL EQUITY RESEARCH Larsen & Toubro (LT IN) Well played on all fronts but for margins INDIA CAPITAL GOODS Quarterly Update Top takeaways from 3QFY19 Recurring PAT (Rs 20.4bn, 36% yoy) was 20%/8%
ICICI Group: Strategy & Performance. Motilal Oswal Conference September 2, 2013
 ICICI Group: Strategy & Performance Motilal Oswal Conference September 2, 2013 Certain statements in these slides are forward-looking statements. These statements are based on management's current expectations
Financial Results March Investor Presentation
 Financial Results March 2017 Investor Presentation 0 Key Highlights Consolidated PAT is Rs 9.1 Bn, marginally higher than in Q1 16 PBT is Rs 14.1 Bn, 1% higher than Q1 16 Net interest income of Rs 20.13
ROBUST OPERATIONAL PERFORMANCE
 ROBUST OPERATIONAL PERFORMANCE Results presentation: H1 FY18 Half year ended 30 September 2017 13 December 2017 DISCLAIMER NOT FOR RELEASE, PUBLICATION OR DISTRIBUTION, DIRECTLY OR INDIRECTLY, IN OR INTO
LARGE CAP & 1,970 BSE
 Batlivala & Karani RESULT UPDATE LARGE CAP Share Data Reuters code DIVI.BO Bloomberg code DIVI IN Market cap. (US$ mn) 4,97 6M avg. daily turnover (US$ mn) 4.7 Issued shares (mn) 133 Target price (Rs)
Tech Mahindra. 1QFY18 Result Update. Steps in the right direction, compelling valuation. Sector: Technology CMP: ` 385. Recommendation: Buy
 Tech Mahindra 1QFY18 Result Update Steps in the right direction, compelling valuation Sector: Technology CMP: ` 385 Recommendation: Buy Market statistics Current stock price (`) 385 Shares O/S (cr.) 97.5
THE BANKER TO EVERY INDIAN. Quarterly Results Q1 FY 2012
 THE BANKER TO EVERY INDIAN Quarterly Results Q1 FY 2012 1 Rs. In Crores NII growth drives Profitability Parameter Q1 FY 11 Q4 FY 11 Q1 FY 12 YOY Growth % Interest Income 18452 21721 24197 31.14 Interest
Consistent Performance - Robust Order Book
 Consistent Performance - Robust Order Book February 7, 2019, Mumbai: Welspun Corp Ltd. (WCL), flagship Company of the Welspun Group, announced its consolidated financial results for the quarter and nine
IG Petrochemicals Ltd. Investor Presentation Q1FY17
 IG Petrochemicals Ltd Investor Presentation Q1FY17 1 Safe Harbor This presentation and the accompanying slides (the Presentation ), which have been prepared by I G Petrochemicals Limited (the Company ),
BUY. SUNIL HITECH ENGINEERS LTD Result Update (PARENT BASIS): Q4 FY15. CMP Target Price JUNE 30 th 2015 SYNOPSIS
: Q4 FY15. CMP Target Price JUNE 30 th 2015 SYNOPSIS") BUY CMP 207.50 Target Price 240.00 SUNIL HITECH ENGINEERS LTD Result Update (PARENT BASIS): Q4 FY15 JUNE 30 th 2015 ISIN: INE305H01010 Index Details Stock Data Sector Construction & Engineering BSE Code
BUY CMP 207.50 Target Price 240.00 SUNIL HITECH ENGINEERS LTD Result Update (PARENT BASIS): Q4 FY15 JUNE 30 th 2015 ISIN: INE305H01010 Index Details Stock Data Sector Construction & Engineering BSE Code
Group presentation. November 2007
 Group presentation November 2007 Safe Harbor This presentation contains forward-looking statements relating to the Group s expectations for future financial performance, including sales and profitability.
Leading in Challenging Times Sustaining Profitable Growth
 Leading in Challenging Times Sustaining Profitable Growth S Mahalingam Chief Financial Officer & Executive Director Analyst Day, Mumbai 12 February 2008 Top Investor Concerns Sustaining Growth US economic
KPIT. 1QFY18 Result Update. Profitability does it again, looking for sustenance. Sector: Technology CMP: ` 130. Recommendation: Hold
 KPIT 1QFY18 Result Update Profitability does it again, looking for sustenance Sector: Technology CMP: ` 130 Recommendation: Hold Market statistics Current stock price (`) 130 Shares O/S (cr.) 19.7 Mcap
Financial Performance Q1FY19 Jul 18, 2018
 Financial Performance Q1FY19 Jul 18, 2018 1 Agenda Financial Highlights Business Update Financial Statements Income Statement Balance Sheet Business Analysis Shareholding Pattern 2 Financial Highlights
India Growth Story. Steel Market Asia Conference Ashok Bhardwaj. 19 th -20 th November Intercontinental Grand Stanford - Hong Kong
 India Growth Story Steel Market Asia Conference 2012 19 th -20 th November - 2012 Intercontinental Grand Stanford - Hong Kong Ashok Bhardwaj (Director - Marketing) JSW Steel Limited India Urbanization
Investor Communiqué Q1 FY2013. Investor Communication Performance overview Q1FY2013
 Investor Communication Performance overview Q1FY2013 Aug 08, 2012 1 Disclaimer This presentation is for information purpose only and does not constitute an offer, solicitation or advertisement with respect
Larsen & Toubro. Result Update. Accumulate. Valuation (x) Estimates (` Bn) Q1FY18 Result (` Mn) July 26, 2018
 Estimates (` Bn) Q1FY18 Result (` Mn) July 26, 2018") Result Update Larsen & Toubro Accumulate Q1 was an inline quarter adjusting for IndAS changes and one-off gains. It has held on to its FY19 guidance given at the beginning of the year, making Q1 a non-event
Result Update Larsen & Toubro Accumulate Q1 was an inline quarter adjusting for IndAS changes and one-off gains. It has held on to its FY19 guidance given at the beginning of the year, making Q1 a non-event
 Excerpts from Analysts' Reports 2011 Consistent strong sales growth.. Momentum to continue Capex plans firming up Cut in dividend payout ratio to 56% Raw material cost pressure continue No signs of competitive
Havells India. Q4FY16 Result Update In-line result; Consistent improvement in performance. Sector: Consumer Durable CMP: ` 342. Recommendation: BUY
 Havells India Q4FY16 Result Update In-line result; Consistent improvement in performance Sector: Consumer Durable CMP: ` 342 Recommendation: BUY Market statistics Current stock price (`) 342 Shares O/S
KEC International (KECI IN)
") (KECI IN) Rating: BUY CMP: Rs370 TP: Rs425 June 15, 2018 Analyst Meet Update Change in Estimates Target Reco Change in Estimates Current Previous FY19E FY20E FY19E FY20E Rating BUY - Target Price 425 -
(KECI IN) Rating: BUY CMP: Rs370 TP: Rs425 June 15, 2018 Analyst Meet Update Change in Estimates Target Reco Change in Estimates Current Previous FY19E FY20E FY19E FY20E Rating BUY - Target Price 425 -
PEER GROUPS CMP MARKET CAP EPS P/E (X) P/BV(X) DIVIDEND Company Name (Rs.) Rs. in mn. (Rs.) Ratio Ratio (%)
 P/BV(X) DIVIDEND Company Name (Rs.) Rs. in mn. (Rs.) Ratio Ratio (%)") BUY CMP 412.60 Target Price 454.00 BHARAT FORGE LTD Result Update: Q3 FY14 MARCH 26 th 2014 ISIN: INE465A01025 Index Details Stock Data Sector Industrial Products BSE Code 500493 Face Value 2.00 52wk.
BUY CMP 412.60 Target Price 454.00 BHARAT FORGE LTD Result Update: Q3 FY14 MARCH 26 th 2014 ISIN: INE465A01025 Index Details Stock Data Sector Industrial Products BSE Code 500493 Face Value 2.00 52wk.
Q4 FY 17. Industry Update & Key Performance Highlights. 23 rd May, 2017
 Q4 FY 17 Industry Update & Key Performance Highlights 23 rd May, 2017 DISCLAIMER This presentation may contain certain forward looking statements concerning JSPL s future business prospects and business
Performance review. May 2016
 Performance review May 2016 Certain statements in these slides are forward-looking statements. These statements are based on management's current expectations and are subject to uncertainty and changes
Q2-2019: Performance review. October 26, 2018
 Q2-2019: Performance review October 26, 2018 Except for the historical information contained herein, statements in this release which contain words or phrases such as 'will', expected to, etc., and similar
BUY SIMPLEX INFRASTRUCTURES LTD SYNOPSIS. CMP Target Price FEBRUARY 28 th Result Update (PARENT BASIS): Q3 FY15
: Q3 FY15") BUY CMP 408.40 Target Price 460.00 SIMPLEX INFRASTRUCTURES LIMITED Result Update (PARENT BASIS): Q3 FY15 FEBRUARY 28 th 2015 ISIN: INE059B01024 Index Details Stock Data Sector Construction & Engineering
BUY CMP 408.40 Target Price 460.00 SIMPLEX INFRASTRUCTURES LIMITED Result Update (PARENT BASIS): Q3 FY15 FEBRUARY 28 th 2015 ISIN: INE059B01024 Index Details Stock Data Sector Construction & Engineering
Experience of Implementing Transportation PPPs in India. Abhijit Bhaumik August 6, 2015
 Experience of Implementing Transportation PPPs in India Abhijit Bhaumik August 6, 2015 Experience of Implementing PPPs in India India has witnessed successful PPPs across several infrastructure sectors
Skipper Ltd. February 13, Towering high. CMP INR 153 Target INR 184 Result Update - BUY. Company Background. Investment Rationale
 February 13, 2017 Skipper Ltd. Towering high CMP INR 153 Target INR 184 Result Update - BUY Key Share Data Face Value (INR) 1.0 Equity Capital (INR Mn) 102.3 Market Cap (INR Mn) 15,593.0 52 Week High/Low
Skipper Ltd. May 17, Towering high. CMP INR 205 Target INR 238 Result Update - BUY. Company Background. Investment Rationale
 May 17, 2017 Skipper Ltd. Towering high CMP INR 205 Target INR 238 Result Update - BUY Key Share Data Face Value (INR) 1.0 Equity Capital (INR Mn) 102.3 Market Cap (INR Mn) 20,979.9 52 Week High/Low (INR)
FY2017: Performance review. May 3, 2017
 FY2017: Performance review May 3, 2017 Certain statements in these slides are forward-looking statements. These statements are based on management's current expectations and are subject to uncertainty
ICICI Group: Strategy & Performance. November 2009
 ICICI Group: Strategy & Performance November 2009 Certain statements in these slides are forward-looking statements. These statements are based on management's current expectations and are subject to uncertainty
Presentation on Equity Markets. 10 th Jul 18
 Presentation on Equity Markets 10 th Jul 18 Performance: Regional markets 2 Performance: Sectoral Indices 3 International: Factors influencing markets Global Growth: Trade War: EM Currency: Expected growth
Prakash Industries Limited
 Prakash Industries Limited People... Prosperity... Progress Q2 & H1 FY18 Result Presentation Disclaimer This presentation and the accompanying slides (the Presentation ), which have been prepared by Prakash
Q2-2018: Performance review. October 27, 2017
 Q2-2018: Performance review October 27, Certain statements in these slides are forward-looking statements. These statements are based on management's current expectations and are subject to uncertainty
Q3-2018: Performance review. January 31, 2018
 Q3-2018: Performance review January 31, 2018 Certain statements in these slides are forward-looking statements. These statements are based on management's current expectations and are subject to uncertainty
Financial Results March Investor Presentation
 Financial Results March 2018 Investor Presentation 0 Key Highlights Consolidated PBT for Q1 18 is Rs 7.4 bn compared to Rs 14.1 bn in Q1 17 Domestic PBT is Rs 3.6 bn lower YoY at Rs 9.7 Bn, mainly due
EARNINGS PRESENTATION 9M/Q3-FY2018
 EARNINGS PRESENTATION 9M/Q3-FY2018 Executive Summary OVERVIEW Ion Exchange (India) Ltd (Ion Exchange), formed in 1964, is a pioneer in water, waste water treatment & environment solutions and caters to
Third Quarter 2018 Earnings Conference Call. August 7, 2018
 Third Quarter 2018 Earnings Conference Call August 7, 2018 1 Safe Harbor Statement Our commentary and responses to your questions may contain forward-looking statements, including our outlook for the remainder
GMR Infrastructure Limited (NSE: GMRINFRA) (BSE: )
 (BSE: )") CMP: Rs. 18.60 TARGET: Rs. 40.00 BUY Nifty 10,245 Sensex 33,371 Nifty PE 25.43 Sensex PE 23.04 Stock Data Sector Infrastructure BSE Code 532754 NSE Code GMRINFRA FV 1.00 Market Cap (INR cr) 11,196 Market
CMP: Rs. 18.60 TARGET: Rs. 40.00 BUY Nifty 10,245 Sensex 33,371 Nifty PE 25.43 Sensex PE 23.04 Stock Data Sector Infrastructure BSE Code 532754 NSE Code GMRINFRA FV 1.00 Market Cap (INR cr) 11,196 Market
ICICI Group: Strategy & Performance
 ICICI Group: Strategy & Performance Agenda India: macroeconomic scenario Indian banking sector ICICI Group 2 Growth indicators Strong long term growth fundamentals Key drivers of growth Favourable demographics
Reliance Capital Builder Fund Series C (A Close Ended Equity Oriented Scheme)
") Reliance Capital Builder Fund Series C (A Close Ended Equity Oriented Scheme) Offer for Sale of Units at Rs.10/- per unit during the new fund offer period Tenure 3 Years from the date of allotment of units
Reliance Capital Builder Fund Series C (A Close Ended Equity Oriented Scheme) Offer for Sale of Units at Rs.10/- per unit during the new fund offer period Tenure 3 Years from the date of allotment of units
FINANCIAL INFORMATION AS OF MARCH 31, 2017
 FINANCIAL INFORMATION AS OF MARCH 31, 2017 KEY MESSAGES & OPERATIONAL UPDATE KEY MESSAGES & OPERATIONAL UPDATE KEY MESSAGES Q1 in line with expectations Sound performance of growth engines Solid operational
Erdemir Group 2011 First Quarter Consolidated Financial Results. 06 May 2011
 Erdemir Group 2011 First Quarter Consolidated Financial Results 06 May 2011 2 / 26 DISCLAIMER Ereğli Demir Çelik Fabrikaları T.A.Ş. (Erdemir) may, when necessary, make written or verbal announcements about