Larsen & Toubro Analyst Presentation Q1 FY16 July 31, 2015
|
|
|
- Merilyn Atkinson
- 5 years ago
- Views:
Transcription


1 Larsen & Toubro Analyst Presentation Q1 FY16 July 31, 2015
2 Disclaimer This presentation contains certain forward looking statements concerning L&T s future business prospects and business profitability, which are subject to a number of risks and uncertainties and the actual results could materially differ from those in such forward looking statements. The risks and uncertainties relating to these statements include, but are not limited to, risks and uncertainties regarding fluctuations in earnings, our ability to manage growth, competition (both domestic and international), economic growth in India and the target countries for exports, ability to attract and retain highly skilled professionals, time and cost over runs on contracts, our ability to manage our international operations, government policies and actions with respect to investments, fiscal deficits, regulations, etc., interest and other fiscal costs generally prevailing in the economy. Past performance may not be indicative of future performance. The company does not undertake to make any announcement in case any of these forward looking statements become materially incorrect in future or update any forward looking statements made from time to time by or on behalf of the company. 2
3 Presentation Outline Group Performance Highlights Group Performance Summary Segment / Key Subsidiaries Performance Outlook 3

4 Presentation Outline Group Performance Highlights Group Performance Summary Segment / Key Subsidiaries Performance Outlook 4
5 Q1 FY16 Performance Highlights EBITDA Margin -1.9% PAT -37% Order Inflow -21% Order Book +22% Revenue +7% 5
6 Presentation Outline Group Performance Highlights Group Performance Summary Segment / Key Subsidiaries Performance Outlook 6


7 Group level Order Inflow & Order Book Order Inflow % Order Book % Amount in ` Bn Q1 FY15 Q1 FY16 Q1 FY15 Q1 FY16 Domestic International Domestic International Sluggish pace of awards in Infrastructure segment Investment momentum in Industrial capex yet to pick up Power and Hydrocarbon awards picking up; few target bids lost on price Prospect pipeline for balance FY16 appears encouraging 7
8 Group Performance Sales & Costs ` Billion Q1 FY15 Q1 FY16 % Change FY15 Net Sales / Revenue from Operations % International Sales % % of Total Sales 26% 33% - 28% Mfg, Cons. & Opex (MCO) % Staff Costs % Sales, adm. & other Exp. (SGA) % Total Opex % Execution challenges persist in some sectors Project business features sequentially non-linear execution progress Increase in MCO charge due to job mix and operationalization of Nabha power project Staff cost rise due to pay revisions and enlarged base of Middle East operations SGA expenses in line with level of operations 8
 EBITDA, 11.3% (13.2%) Q1 FY16 Material cost, 29.7% (30.")
 Subcontracting charges, 20.3% (19.")
9 Performance Summary Operational Costs & Profitability Sales, adm. & other Exp., 6.8% (7.3%) EBITDA, 11.3% (13.2%) Q1 FY16 Material cost, 29.7% (30.5%) Staff Costs, 10.3% (9.2%) Other Opex, 21.6% (20.0%) Subcontracting charges, 20.3% (19.8%) Figures in brackets indicate corresponding period of the Previous Year 9
10 Group Performance Summary Extracts ` Billion Q1 FY15 Q1 FY16 % Change FY15 EBITDA % EBITDA Margin 13.2% 11.3% -1.9% 12.3% Interest Expenses (7.74) (7.07) -9% (28.51) Depreciation (8.07) (6.22) -23% (26.23) Other Income % Provision for Taxes (4.49) (5.46) 22% (22.84) PAT after Minority Interest % Quarterly EBITDA variation reflects inherent non-linearity of project execution EBITDA margin drop due to divestment gain in PY and lower level of operation in segments with reduced order book; partly compensated by hydrocarbon recovery Decrease in interest cost on sale of Dhamra Port and loans refinancing Other income mainly comprises Treasury Gains Post-tax gain of Rs.1.96 Bn Exceptional items included in Q1 FY15 10
11 Group Balance Sheet Incr / ` Billion Jun-15 Mar-15 (Decr) Net Worth Minority Borrowings (Fin. Serv.) Other Non-Current Liabilities Other Current Liabilities Total Sources 2, , Net Fixed Assets Goodwill on consolidation Loans & Advances (Fin. Serv.) Other Non- Current Assets (0.12) Cash and Cash Equivalents Other Current Assets Total Applications 2, , Gross D/E: 2.29 Net Working Capital (excl. Fin. Serv.) : 25% of Sales 11
12 Group Cash Flow (Summarised) ` Billion Q1 FY16 Q1 FY15 Operating Profit Adjustments for NWC (6.34) (6.02) Direct Taxes (Paid) / Refund - Net (5.61) (5.21) Net Cash from Operations (A) Investments in Fixed Assets (Net) (15.90) (18.29) ICD Proceeds from/(to) Associate Cos. (0.01) 6.37 Net Purchase of Long Term & Curr. Inv. (28.00) (16.13) Interest & Div. Received and Others Net Cash from/(used in) Invest. Act. (B) (40.63) (27.05) Issue of Share Capital / Minority Net Borrowings Disbursements towards financing activities* (19.06) (6.44) Interest & Dividend paid (6.56) (8.79) Net Cash from Financing Activities (C) Net (Dec) / Inc in Cash & Bank (A+B+C) (6.26) (6.29) * included under Net Cash from operations under statutory financial statements 12
13 Presentation Outline Group Performance Highlights Group Performance Summary Segment / Key Subsidiaries Performance Outlook 13
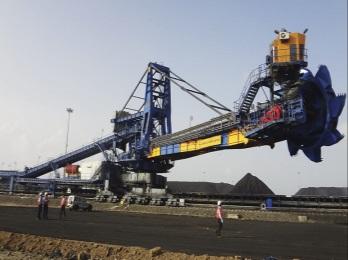
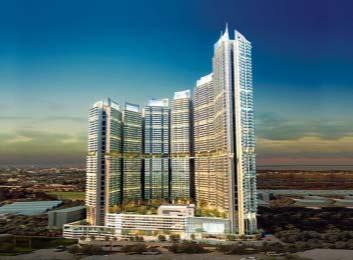
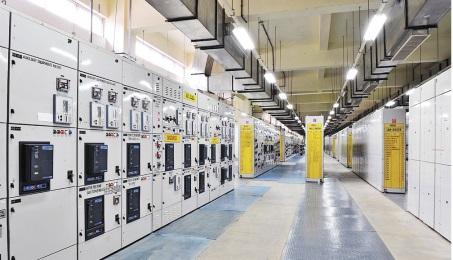
14 Segment Composition Infrastructure Power Building & Factories EPC Coal & Gas Ferrous Transportation Infra Heavy Civil Infra Water, Smart World & Communications Power T&D Thermal Power Plant Construction Critical Piping and ESP Metallurgical & Material Handling Non Ferrous Bulk Material Handling Heavy Engineering Process Plant Equipment Nuclear Power Plant Equipment Defence & Aerospace Electrical & Automation Electrical Standard Products Electrical Systems & Equipment Metering & Protection Control & Automation Hydrocarbon Developmental Projects IT & TS Financial Services Others Upstream Roads Information Retail & Corporate Shipbuilding Technology Mid & Downstream Metros Infrastructure Realty Construction & Pipelines Ports Power Technology Services General Insurance Mutual Fund Asset Management Construction & Mining Equipment Machinery & Industrial Products 14
 Power 1% (5%) Infrastructure 45% (43%) Order Inflow Rs 264 Bn Others 8% (6%)")
 Order Book Rs 2390 Bn Others 3%")
15 Segmental Breakup of Orders Q1 FY16 MMH 6% (1%) HE 4% (8%) E&A 4% (4%) Hydrocarbon 13% (17%) Services 19% (16%) Power 1% (5%) Infrastructure 45% (43%) Order Inflow Rs 264 Bn Others 8% (6%) Power 9% (9%) MMH 5% (5%) HE 4% (4%) E&A 1% (2%) Hydrocarbon 7% (7%) Figures in brackets indicate corresponding period of the Previous Year Infrastructure 71% (70%) Order Book Rs 2390 Bn Others 3% (3%) 15


16 Revenue Breakup Q1 FY16 MMH 2% Power 6% HE 3% E&A 5% Segmental Breakup Hydrocarbon 11% IT & TS 10% Fin. Services 9% Devl. Proj. 6% Others 7% Geographical breakup Infrastructure 41% 33% 67% Domestic International 16
17 Infrastructure Segment Revenues & Margin Amount in ` Bn Robust revenue growth driven by large order backlog International growth contributed by Power T&D, Transportation Infra and Heavy Civil Infra Steady margins achieved through efficient execution and stable commodity prices 17
18 Power Segment Revenues & Margin Amount in ` Bn Revenue growth driven by improved opening order book position International revenues contributed by Bangladesh job Margin variation due to job mix and early stage execution of new orders 18

19 Amount in ` Bn Metallurgical & Material Handling (MMH) Segment Revenues & Margin Revenue decline due to reduced order book and slow pace of execution in some jobs Recent order wins yet to start contributing Margin drop due to lower level of operations and cost provisions 19
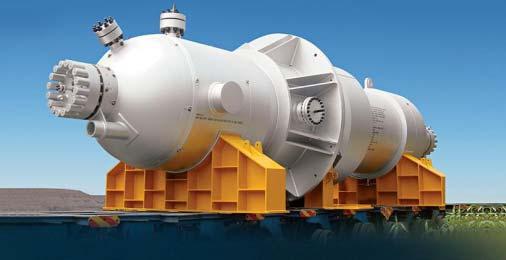
20 Heavy Engineering Segment Revenues & Margin Amount in ` Bn Investment environment remains lacklustre Contraction in revenues arising out of depleted order book Lower realisations, sub-optimal volumes and cost & time overruns affecting margins 20
21 Electrical & Automation (E&A) Segment Revenues & Margin Amount in ` Bn Muted revenue growth achieved in the face of sluggish industrial demand conditions Margin improvement due to soft commodity prices and operational efficiency 21
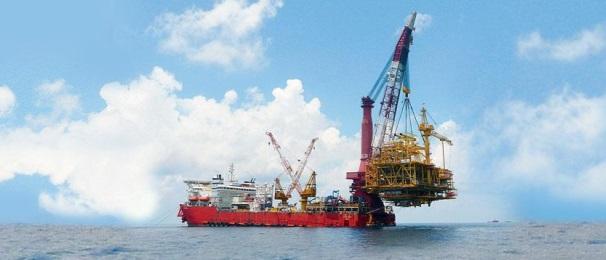
22 Hydrocarbon Segment Revenues & Margin Amount in ` Bn Orders booked in FY15 (International and Domestic) contributing to revenue growth Challenging legacy Middle East projects in the process of being closed out The business has invested in a localised organisational build up in GCC region Muted EBITDA margins in Q1 FY16 due to pending claims settlement and under recovery of international overheads 22

23 IT & Technology Services Segment Revenues & Margin Amount in ` Bn Robust growth in revenues contributed by BFSI segments in IT and Industrial Products segment in TS Stable margins maintained through continued execution efficiency and favourable currency 23
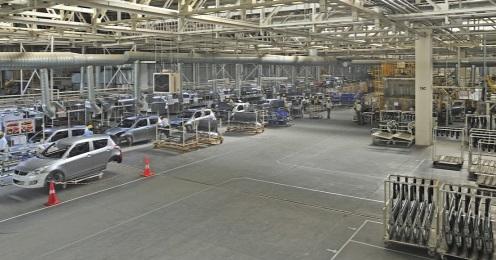
24 Others Segment Revenues & Margin Amount in ` Bn Revenue growth driven by Construction Equipment and Valves businesses Margin improvement contributed by Realty and Construction Equipment businesses 24

 revenue increase due to operationalization of 2 nd")
25 Developmental Projects Segment Revenues EBITDA Amount in ` Bn Increase in Concessions business due to traffic growth and 3 new operational road SPVs Nabha Power (2x700 MW) revenue increase due to operationalization of 2 nd Unit 25
; 1 Operational Project")
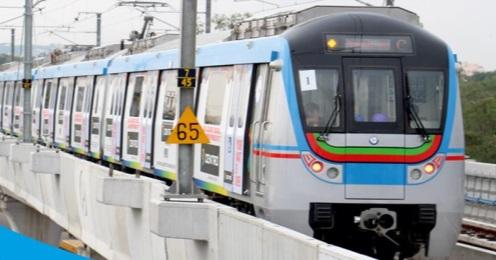
 - Operational Project Cost: `21 Bn Metros: Portfolio: 1 project (71.")
 Under-implementation Project Cost: `14 Bn Total Project Cost (June 2015): ` 570 Bn 26 Equity")
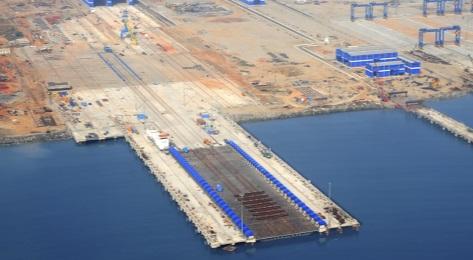
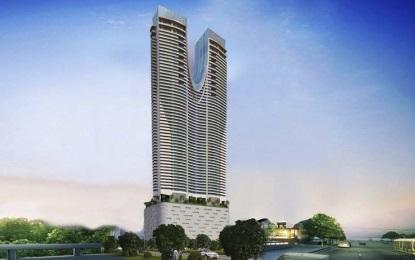
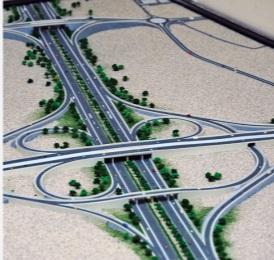
26 Concessions Business Portfolio 26 SPVs Roads and Bridges: Portfolio: 17 projects (1764 Km); 14 Operational Project Cost: `187 Bn Power: Portfolio: 5 projects (2270 MW); 1 Operational Project Cost: `178 Bn Ports: Portfolio: 2 projects (18.5 MTPA) - Operational Project Cost: `21 Bn Metros: Portfolio: 1 project (71.16 Km) Under-implementation Project Cost: `170 Bn Transmission Lines: Portfolio: 1 project (482 Km) Under-implementation Project Cost: `14 Bn Total Project Cost (June 2015): ` 570 Bn 26 Equity Invested (June 2015): ` 89 Bn Balance Equity Commitment (June 2015): ` 45 Bn
27 L&T Finance Holdings ` Billion Q1 FY15 Q1 FY16 % Change FY15 Networth (Incl. Pref. Cap.) % Borrowings % Loans and Advances % Mutual Fund Average AUM % Gross NPA (%) DPD 4.63% 3.05% -1.6% 3.08% Net NPA (%) DPD 3.72% 2.00% -1.7% 2.10% PAT (before exceptionals) % 7.36 Healthy growth in loan assets aided by disbursements in B2C and SME segments, as well as operational infrastructure assets Steady Mutual Fund AUM with shift towards equity / hybrid assets NPA recognition at 150 DPD (Days Past Due) from Q1FY16 27

28 Presentation Outline Group Performance Highlights Group Performance Summary Segment / Key Subsidiaries Performance Outlook 28

29 Outlook Wide circles of influence
30 Thank You 30
31 Annexure-1: Group Profit & Loss ` Billion IT & TS Fin. Services * Devl. Projects L&T & Others (Incl. Eliminations) L&T Group Q1 FY16 Q1 FY15 % Change Revenue from Operations % EBITDA % Interest Expenses (0.02) (0.02) (3.30) (3.72) (7.07) (7.74) -9% Depreciation (0.60) (0.25) (1.01) (4.37) (6.22) (8.07) -23% Other Income % Exceptional Items Provision for Taxes (0.67) (0.83) (0.24) (3.71) (5.46) (4.49) 22% PAT from Ordinary Activites (1.41) % Share in profit of Associates Adjustments for Minority Interest (0.00) (0.86) (0.69) (0.41) Profit After Tax (1.28) % * Includes Insurance Business 31
32 Annexure 2: Group Balance Sheet ` Billion IT & TS Fin. Services * Devl. Projects L&T & Others (Incl. Eliminations) Jun-15 L&T Group Mar-15 Inc / (Dec) Net Worth (Excl. Pref. Cap.) Minority Interest Borrowings ^ 290.9^ Deferred Payment Liabilities Other Current & Non-Current Liab Total Sources , , Net Segment Assets , , Total Applications , , * Includes Insurance Business ^ Partly netted off from Capital Employed in Reported Segment 32
33 Annexure 3: Group Cash Flow (Summarised) ` Billion IT&TS Fin. Services@ Devl. Projects L&T & Others (Incl. Eliminations) L&T Group Q1 FY16 Q1 FY15 Operating Profit Changes in Working Capital (0.41) (0.60) (3.80) (1.53) (6.34) (6.02) Direct Taxes (Paid) / Refund - Net (0.47) (1.05) (0.12) (3.97) (5.61) (5.21) Net Cash from Operations (A) (0.86) Investments in Fixed Assets (Net) (1.00) (0.51) (9.01) (5.38) (15.90) (18.29) (Purchase) /Sale of Long Term & Current Inv. (Net) 0.23 (7.39) 0.69 (21.53) (28.00) (16.13) ICD Proceeds from/(to) Associate Cos (0.01) (0.01) 6.37 Interest & Dividend Received and Others Net Cash used in Investing Activities (B) (0.74) (7.51) (8.28) (24.10) (40.63) (27.05) Issue of Share Capital / Minority Net Borrowings Disbursements towards financing activities* - (19.06) - - (19.06) (6.44) Interest & Dividend paid (Incl. Dividend tax) (2.81) (4.00) (6.56) (8.79) Net Cash from Financing Activities (C) Net (Dec) / Inc in Cash & Bank (A+B+C) (9.71) (6.26) Includes Insurance Business * included under Net Cash from operations under statutory financial statements 33
Larsen & Toubro Analyst Presentation H1 FY16 October 30, 2015
 Larsen & Toubro Analyst Presentation H1 FY16 October 30, 2015 Disclaimer This presentation contains certain forward looking statements concerning L&T s future business prospects and business profitability,
May 30, Analyst Presentation FY15
 May 30, 2015 Analyst Presentation FY15 Disclaimer This presentation contains certain forward looking statements concerning L&T s future business prospects and business profitability, which are subject
Analyst Presentation - Q1 FY18. July 28, 2017
 1 Analyst Presentation - Q1 FY18 July 28, 2017 Disclaimer 2 This presentation contains certain forward looking statements concerning L&T s future business prospects and business profitability, which are
Builders to the nation. Analyst Presentation Q2/H1 FY18. November 11, 2017
 1 Builders to the nation Analyst Presentation Q2/H1 FY18 November 11, 2017 Disclaimer 2 This presentation contains certain forward looking statements concerning L&T s future business prospects and business
Builders to the nation. Analyst Presentation Q3/9M FY18. January 31, 2018
 1 Builders to the nation Analyst Presentation Q3/9M FY18 January 31, 2018 Disclaimer 2 This presentation contains certain forward looking statements concerning L&T s future business prospects and business
Presentation Outline. Q1 FY11 Performance Summary
 LARSEN & TOUBRO LIMITED Analyst Presentation Q1 FY11 Presentation Outline Q1 FY11 Performance Summary Segmental e Analysis s Performance of Key Subsidiaries Outlook 2 Presentation Outline Q1 FY11 Performance
LARSEN & TOUBRO LIMITED. Analyst Presentation 9M FY12
 LARSEN & TOUBRO LIMITED Analyst Presentation 9M FY12 Disclaimer This presentation contains certain forward looking statements concerning L&T s future business prospects and business profitability, which
Builders to the nation. Analyst Presentation Q4 / FY18. May 28, 2018
 Builders to the nation Analyst Presentation Q4 / FY18 May 28, 2018 Disclaimer 2 This presentation contains certain forward looking statements concerning L&T s future business prospects and business profitability,
Analyst Presentation - Q4 / FY17. May 29, 2017
 1 Analyst Presentation - Q4 / FY17 May 29, 2017 Disclaimer 2 This presentation contains certain forward looking statements concerning L&T s future business prospects and business profitability, which are
L&T Press Release Issued by Corporate Brand Management & Communications
 L&T Press Release Issued by Corporate Brand Management & Communications L&T House, 2 nd Floor, Ballard Estate, Mumbai 400 001 Tel: 91 22 6752 5656 / 836 Fax: 91 22 6752 5796 CIN: L99999MH1946PLC004768
L&T Press Release Issued by Corporate Brand Management & Communications
 L&T Press Release Issued by Corporate Brand Management & Communications L&T House, 2 nd Floor, Ballard Estate, Mumbai 400 001 Tel: 91 22 6752 5656 / 836 Fax: 91 22 6752 5796 CIN: L99999MH1946PLC004768
L&T Press Release Issued by Corporate Brand Management & Communications
 L&T Press Release Issued by Corporate Brand Management & Communications L&T House, 2 nd Floor, Ballard Estate, Mumbai 400 001 Tel: 91 22 6752 5656 / 836 Fax: 91 22 6752 5796 CIN: L99999MH1946PLC004768
Disclaimer. 17 th May
 17 th May 2010 LARSEN & TOUBRO LIMITED Disclaimer This presentation contains certain forward looking statements concerning L&T s future business prospects and business profitability, which are subject
Group Performance for the quarter ended September 30, 2018
 Group Performance for the quarter ended September 30, Consolidated Results Stellar performance: Growth in Order Inflow 46%, Revenue 21% & PAT 23% Mumbai, October 31, : Larsen & Toubro recorded Consolidated
Analyst Presentation Q1 09. July 28,
 Analyst Presentation Q1 09 July 28, 2008 1 Disclaimer This presentation contains certain forward looking statements concerning L&T s future business prospects and business profitability, which are subject
Investor Presentation
 1 Builders to the nation Investor Presentation Q2/H1 FY18 November 11, 2017 Disclaimer 2 This presentation contains certain forward looking statements concerning L&T s future business prospects and business
LARSEN & TOUBRO LIMITED Registered Office: L&T House, Ballard Estate, Mumbai CIN : L99999MH1946PLC004768
 1 Gross Sales/Revenue from operations 1914591 1512489 2022938 5755807 5716385 Less : Excise duty 17799 12987 15028 54066 56493 Net Sales/Revenue from operations 1896792 1499502 2007910 5701741 5659892
LARSEN & TOUBRO LIMITED Registered Office: L&T House, Ballard Estate, Mumbai CIN : L99999MH1946PLC004768
 1 Gross Sales / Revenue from operations 1085059 1914591 1044662 5755807 Less: Excise duty 14044 17799 10900 54066 Net Sales/Revenue from operations 1071015 1896792 1033762 5701741 2 Expenses: a) i) Consumption
Larsen & Toubro Ltd.
 Feb-17 Mar-17 Apr-17 May-17 Jun-17 Jul-17 Aug-17 Sep-17 Oct-17 Nov-17 Dec-17 Jan-18 Feb-18 Volume No.. III Issue No. 163. Larsen & Toubro Ltd. February 26, 2018 BSE Code: 500510 NSE Code: LT Reuters Code:
LARSEN & TOUBRO LIMITED Registered Office: L&T House, Ballard Estate, Mumbai CIN : L99999MH1946PLC004768
 1 Income: a) Income from operations 23499.65 15946.20 22265.41 66301.35 63812.65 b) Other income 345.31 498.74 761.26 1971.85 2341.04 Total Income 23844.96 16444.94 23026.67 68273.20 66153.69 2 Expenses:
LARSEN & TOUBRO LIMITED Registered Office: L&T House, Ballard Estate, Mumbai CIN : L99999MH1946PLC004768
 3 months ended Year ended 1 (a) Gross Sales/Revenues from operations 3305386 2561602 2793921 10222659 9034676 Less : Excise duty 24162 22887 25209 89054 75708 Net Sales/Revenues from operations 3281224
Larsen & Toubro. Source: Company Data; PL Research
 Domestic execution showing positive trends July 28, 2017 Kunal Sheth kunalsheth@plindia.com +91 22 66322257 Rating BUY Price Rs1,159 Target Price Rs1,328 Implied Upside 14.6% Sensex 32,310 Nifty 10,015
Larsen & Toubro. Decent performance! Source: Company Data; PL Research
 Decent performance! July 30, 2016 Kunal Sheth kunalsheth@plindia.com +91 22 66322257 Samir Bendre samirbendre@plindia.com +91 22 66322256 Rating BUY Price Rs1,558 Target Price Rs1,590 Implied Upside 2.1%
Larsen & Toubro BUY. Performance Highlights. CMP `1,122 Target Price `1,310. 3QFY2016 Result Update Infrastructure
 3QFY2016 Result Update Infrastructure February 2, 2015 Larsen & Toubro Performance Highlights Quarterly highlights - Standalone Y/E March (` cr) 3QFY16 2QFY16 3QFY15 % chg (yoy) % chg (qoq) Net sales 14,774
Townhall Presentation
 Townhall Presentation 1 IDFC Investor Presentation (Q1FY2013) August 14, 2012 2 1. Snapshot 2. Balance Sheet & Financials 3. Concentration and product analysis 4. Borrowings 5. Shareholding 6. Highlights
Larsen & Toubro. CMP: INR1,160 TP: INR1,417 Buy
 BSE SENSEX S&P CNX 16,216 4,908 Bloomberg LT IN Equity Shares (m) 608.9 52-Week Range (INR) 1,868/971 1,6,12 Rel. Perf. (%) -4/-7/12 M.Cap. (INR b) 706.3 M.Cap. (USD b) 13.1 * Consolidated; EPS is fully
Larsen & Toubro Ltd. Result Update Q2 FY16
 Change in Estimates Rating Target Q2 FY16 Larsen & Toubro Ltd LT s Q2 FY16 results were below our estimates on lower margins and lower order inflow Lower than expected EBIT margins in infrastructure segment
Tech Mahindra. 1QFY18 Result Update. Steps in the right direction, compelling valuation. Sector: Technology CMP: ` 385. Recommendation: Buy
 Tech Mahindra 1QFY18 Result Update Steps in the right direction, compelling valuation Sector: Technology CMP: ` 385 Recommendation: Buy Market statistics Current stock price (`) 385 Shares O/S (cr.) 97.5
Larsen & Toubro (LT IN) Shines on all parameters and we get constructive
 Shines on all parameters and we get constructive") INSTITUTIONAL EQUITY RESEARCH Larsen & Toubro (LT IN) Shines on all parameters and we get constructive INDIA CAPITAL GOODS Quarterly Update Top takeaways from 2QFY19 Recurring PAT (Rs 19.4bn, 15% yoy)
INSTITUTIONAL EQUITY RESEARCH Larsen & Toubro (LT IN) Shines on all parameters and we get constructive INDIA CAPITAL GOODS Quarterly Update Top takeaways from 2QFY19 Recurring PAT (Rs 19.4bn, 15% yoy)
FINANCIAL INFORMATION AS OF MARCH 31, 2017
 FINANCIAL INFORMATION AS OF MARCH 31, 2017 KEY MESSAGES & OPERATIONAL UPDATE KEY MESSAGES & OPERATIONAL UPDATE KEY MESSAGES Q1 in line with expectations Sound performance of growth engines Solid operational
KEC International (KECI IN)
") (KECI IN) Rating: BUY CMP: Rs370 TP: Rs425 June 15, 2018 Analyst Meet Update Change in Estimates Target Reco Change in Estimates Current Previous FY19E FY20E FY19E FY20E Rating BUY - Target Price 425 -
(KECI IN) Rating: BUY CMP: Rs370 TP: Rs425 June 15, 2018 Analyst Meet Update Change in Estimates Target Reco Change in Estimates Current Previous FY19E FY20E FY19E FY20E Rating BUY - Target Price 425 -
Third Quarter 2018 Earnings Conference Call. August 7, 2018
 Third Quarter 2018 Earnings Conference Call August 7, 2018 1 Safe Harbor Statement Our commentary and responses to your questions may contain forward-looking statements, including our outlook for the remainder
Larsen & Toubro BUY. Profit +34% YoY as margins expand but order inflows decline. 13 November 2017 India Infrastructure Company Update
 13 November 2017 India Infrastructure Company Update Larsen & Toubro BUY Profit +34% YoY as margins expand but order inflows decline L&T delivered 34% growth YoY in 2QFY18 consolidated net profits, driven
Q4 EARNINGS REPORT Welspun India 25 Apr 17
 Dec-11 Apr-12 Aug-12 Dec-12 Apr-13 Aug-13 Dec-13 Apr-14 Aug-14 Dec-14 Apr-15 Aug-15 Dec-15 Apr-16 Aug-16 Dec-16 Q4 EARNINGS REPORT Welspun India 25 Apr 17 CMP (Rs) 94 TP (Rs) 112 Maintain Outperformer
ABB LTD (INDIA) RESEARCH
 RESEARCH") RESULTS REVIEW Share Data Market Cap Rs. 168.6 bn Price Rs. 795.80 BSE Sensex 16,741.30 Reuters Bloomberg Avg. Volume (52 Week) ABB.BO ABB IN 0.11 mn 52-Week High/Low Rs. 856.95 / 344 Shares Outstanding
RESULTS REVIEW Share Data Market Cap Rs. 168.6 bn Price Rs. 795.80 BSE Sensex 16,741.30 Reuters Bloomberg Avg. Volume (52 Week) ABB.BO ABB IN 0.11 mn 52-Week High/Low Rs. 856.95 / 344 Shares Outstanding
2017 Full Year Results and Outlook March 2018
 207 Full Year Results and Outlook 208 3 March 208 Disclaimer This document contains forward-looking statements. These statements are based on the current views, expectations, assumptions and information
HARALD WILHELM Chief Financial Officer AIRBUS GROUP Q1 RESULTS 2016
 HARALD WILHELM Chief Financial Officer AIRBUS GROUP Q1 RESULTS 2016 SAFE HARBOUR STATEMENT 2 DISCLAIMER This presentation includes forward-looking statements. Words such as anticipates, believes, estimates,
CMP* (Rs) 205 Upside/ (Downside) (%) 12 Bloomberg Ticker. NACO IN Market Cap. (Rs bn) 29 Free Float (%) 27 Shares O/S (mn) 143
 205 Upside/ (Downside) (%) 12 Bloomberg Ticker. NACO IN Market Cap. (Rs bn) 29 Free Float (%) 27 Shares O/S (mn) 143") 1QFY18 Result Update July 25, 2017 Market Cap. (Rs bn) 29 Free Float (%) 27 Shares O/S (mn) 143 Limited DPD Impact; Upgrade to (NCL) has delivered a decent performance in 1QFY18. Surpassing volume growth,
1QFY18 Result Update July 25, 2017 Market Cap. (Rs bn) 29 Free Float (%) 27 Shares O/S (mn) 143 Limited DPD Impact; Upgrade to (NCL) has delivered a decent performance in 1QFY18. Surpassing volume growth,
IDFC : Investor Presentation (Q1FY16) July 30, 2015
 July 30, 2015") IDFC : Investor Presentation (Q1FY16) July 30, 2015 2 1. Snapshot 2. Balance Sheet & Financials 3. Concentration and product analysis 4. Borrowings 5. Shareholding 6. Highlights 3 Balance Sheet Loan Book
IDFC : Investor Presentation (Q1FY16) July 30, 2015 2 1. Snapshot 2. Balance Sheet & Financials 3. Concentration and product analysis 4. Borrowings 5. Shareholding 6. Highlights 3 Balance Sheet Loan Book
FY16 Results Presentation
 Muskrat Falls Hydro Plant, Canada FY16 Results Presentation March 14, 2017 Agenda Warsaw subway Line 2, Poland 2016 Highlights Q4 & FY16 results Appendix 2 Fit for the Future our Strategy Plan Sustainable
Larsen & Toubro (LT IN)
") (LT IN) Rating: BUY CMP: Rs1,321 TP: Rs1,566 July 25, 2018 Company Report Change in Estimates Target Reco Change in Estimates Current Previous FY19E FY20E FY19E FY20E Rating BUY BUY Target Price 1,566
(LT IN) Rating: BUY CMP: Rs1,321 TP: Rs1,566 July 25, 2018 Company Report Change in Estimates Target Reco Change in Estimates Current Previous FY19E FY20E FY19E FY20E Rating BUY BUY Target Price 1,566
L&T Finance Holdings
 Revenues broadly in line; asset quality impairment seasonal July 23, 2015 Nitin Kumar nitinkumar@plindia.com +91 22 66322236 Pritesh Bumb priteshbumb@plindia.com +91 22 66322232 Rating BUY Price Rs72 Target
Q1 Financial Results
 Q1 Financial Results June 19, 2014 Stuart Bradie President and Chief Executive Officer Brian Ferraioli EVP and Chief Financial Officer Zachary Nagle VP Investor Relations Forward Looking Statements Forward
Investor Communiqué Q1 FY2013. Investor Communication Performance overview Q1FY2013
 Investor Communication Performance overview Q1FY2013 Aug 08, 2012 1 Disclaimer This presentation is for information purpose only and does not constitute an offer, solicitation or advertisement with respect
Fiscal Year rd Quarter Earnings Conference Call
 Fiscal Year 2017 3 rd Quarter Earnings Conference Call August 8, 2017 www.jacobs.com worldwide Forward-Looking Statement Disclaimer Certain statements contained in this presentation constitute forward-looking
FY 2016 RESULTS. March 2 nd, 2017
 FY 2016 RESULTS March 2 nd, 2017 AGENDA Key messages & strategy execution Financial update 2017 outlook & conclusion FY2016 RESULTS 2 KEY MESSAGES & STRATEGY EXECUTION KEY MESSAGES 2016 results in line
XYLEM INC. Q EARNINGS RELEASE JULY 31, 2018
 XYLEM INC. Q2 2018 EARNINGS RELEASE JULY 31, 2018 Q2 2018 EARNINGS RELEASE FORWARD-LOOKING STATEMENTS This presentation contains information that may constitute forward-looking statements. within the meaning
Larsen & Toubro (LT IN) Well played on all fronts but for margins
 Well played on all fronts but for margins") INSTITUTIONAL EQUITY RESEARCH Larsen & Toubro (LT IN) Well played on all fronts but for margins INDIA CAPITAL GOODS Quarterly Update Top takeaways from 3QFY19 Recurring PAT (Rs 20.4bn, 36% yoy) was 20%/8%
INSTITUTIONAL EQUITY RESEARCH Larsen & Toubro (LT IN) Well played on all fronts but for margins INDIA CAPITAL GOODS Quarterly Update Top takeaways from 3QFY19 Recurring PAT (Rs 20.4bn, 36% yoy) was 20%/8%
Larsen & Toubro. CMP: INR1,278 TP: INR1,380 Buy
 BSE SENSEX S&P CNX 16,786 5,050 Bloomberg LT IN Equity Shares (m) 608.9 52-Week Range (INR) 1,933/971 1,6,12 Rel. Perf. (%) 20/-19/-11 M.Cap. (INR b) 778.1 M.Cap. (USD b) 15.5 * Consolidated; EPS is fully
AIRBUS Q1 Results 2017
 AIRBUS Q1 Results 2017 27 April 2017 Harald Wilhelm Chief Financial Officer SAFE HARBOUR STATEMENT 2 DISCLAIMER This presentation includes forward-looking statements. Words such as anticipates, believes,
Narnolia Securities Ltd. ADITYA GUPTA 01-Nov-17. Key Highlights of the Report: RoE to decline in FY19E
 Oct16 Nov16 Dec16 Jan17 Feb17 Mar17 Apr17 May17 Jun17 Jul17 Aug17 Sep17 Oct17 01Nov17 INDUSTRY BSE Code 530965 NSE Code IOC NIFTY 10335 OIL MARKETING 145 135 125 115 105 Company Data CMP 414 Target Price
BHEL.BO BHEL IN. Structural story remains weak. Q1FY19 Result Update. Rating: REDUCE CMP: Rs72 TP: Rs73. July 25, 2018
 (BHEL IN) Rating: REDUCE CMP: Rs72 TP: Rs73 July 25, 2018 Q1FY19 Result Update Change in Estimates Target Reco Change in Estimates Current Previous FY19E FY20E FY19E FY20E Rating REDUCE REDUCE Target Price
Bharat Forge. Exports remain subdued, outlook better. Source: Company Data; PL Research
 Exports remain subdued, outlook better November 08, 2016 Rohan Korde rohankorde@plindia.com +91 22 66322235 Rating BUY Price Rs850 Target Price Rs957 Implied Upside 12.6% Sensex 27,591 Nifty 8,544 (Prices
L&T Press Release Issued by Corporate Communications Department
 L&T Press Release Issued by Corporate Communications Department L&T House, Second Floor Ballard Estate, Mumbai 400 001 Tel: 91 22 6752 5656 / 836 Fax: 91 22 6752 5796 Performance for the quarter ended
BHARAT FORGE LIMITED Analyst Update FY 2018 Results
 BHARAT FORGE LIMITED Analyst Update FY 2018 Results BFL 12 MONTH REPORT FY18 has been a record year for the company with revenue growth surpassing underlying demand growth across sectors and geographies.
Larsen & Toubro. Revenues a positive surprise...so is other income! Q1FY13 Result Update
 Revenues a positive surprise...so is other income! July 23, 2012 Rupa Shah rupashah@plindia.com +91-22-66322244 Rating Accumulate Price Rs1,378 Target Price Rs1,517 Implied Upside 10.1% Sensex 16,877 Nifty
HALF-YEAR Investor Presentation
 HALF-YEAR 2015 Investor Presentation AGENDA 1. Performance Highlights HY2015 2. P&L and B/S Details HY2015 3. Outlook 2015 4. Questions & Answers Investors Presentation - HY2015 August 18, 2015 3 PERFORMANCE
Baird 2018 Global Industrial Conference. November 8, 2018
 Baird 2018 Global Industrial Conference November 8, 2018 DISCLAIMER Forward-looking Statements This presentation contains forward-looking statements within the meaning of Section 27A of the Securities
2015 Annual General Meeting. October2015
 2015 Annual General Meeting October2015 FY15 Results Significant restructuring and capital management to support profit recovery in FY16. Statutory EBIT loss of $33.2m Statutory NPAT loss of $36.9m Trading
THE BANKER TO EVERY INDIAN. Annual Results FY
 THE BANKER TO EVERY INDIAN Annual Results FY 2011-12 Healthy Growth in NII and Operating Profit - a Snapshot (1/2) Rs. In Crores Q4 FY11 Q4 FY12 Gr.% FY11 FY12 Gr.% Interest Income 21721 28583 31.59 Interest
1Q 2017 Financial Results
 1Q 2017 Financial Results April 28, 2017 Stuart Bradie President and Chief Executive Officer Mark Sopp Executive Vice President and Chief Financial Officer Nelson Rowe Senior Vice President, Investor Relations
2Q 2017 Financial Results
 2Q 2017 Financial Results August 2, 2017 Stuart Bradie President and Chief Executive Officer Mark Sopp Executive Vice President and Chief Financial Officer Nelson Rowe Senior Vice President, Investor Relations
ICICI Group: Performance & Strategy. May 2016
 ICICI Group: Performance & Strategy May 2016 Agenda Indian economy ICICI Group Key International regulatory business developments 2 India: strong long term fundamentals Key drivers of growth Favourable
KPIT CUMMINS INFOSYSTEMS Ltd.
 KPIT CUMMINS INFOSYSTEMS Ltd. Technology Co with Focus on R&D Attractive Valuations 30 th April-2013 Buy Rating with TP `128 Upside 23% 1 KPIT Cummins Infosystems Ltd Stock Data No. of shares : 19.28 cr
4Q 2016 & Fiscal Year 2016 Financial Results. February 24, 2017
 4Q 2016 & Fiscal Year 2016 Financial Results February 24, 2017 Stuart Bradie President and Chief Executive Officer Mark Sopp Executive Vice President (Incoming CFO) Brian Ferraioli Chief Financial Officer
BHEL SELL RESULTS REVIEW 1QFY15 13 AUG CMP (as on 12 Aug 2014) Rs 224 Target Price Rs 188
 Rs 224 Target Price Rs 188") RESULTS REVIEW 1QFY15 13 AUG 2014 BHEL SELL INDUSTRY CAPITAL GOODS CMP (as on 12 Aug 2014) Rs 224 Target Price Rs 188 Nifty 7,727 Sensex 25,881 KEY STOCK DATA Bloomberg/Reuters BHEL IN/BHEL.BO No. of Shares
RESULTS REVIEW 1QFY15 13 AUG 2014 BHEL SELL INDUSTRY CAPITAL GOODS CMP (as on 12 Aug 2014) Rs 224 Target Price Rs 188 Nifty 7,727 Sensex 25,881 KEY STOCK DATA Bloomberg/Reuters BHEL IN/BHEL.BO No. of Shares
Performance and Outlook. November 2016
 Performance and Outlook November 2016 1 Macro Picture Asset Quality Growth Earnings Quality Retail Franchise 2 Growth in industrial production has slowed in recent months Growth in IIP and Components 14%
Q1-Q Results Presentation. Investor and Analyst Conference Call 14 November 2017
 Q-Q3 207 Results Presentation Investor and Analyst Conference Call 4 November 207 Markus Krebber Chief Financial Officer Gunhild Grieve Head of Investor Relations Disclaimer This document contains forward-looking
Second Quarter 2017 Conference Call Presentation August 3 rd, 2017
 Second Quarter 2017 Conference Call Presentation August 3 rd, 2017 Agenda Forward-looking statements Denis Jasmin, Vice-President, Investor Relations CEO remarks Neil Bruce, President and Chief Executive
Wipro. 3QFY17 Result Update. Guidance subdued, maintain Hold. Sector: Technology CMP: ` 474. Recommendation: Hold
 Wipro 3QFY17 Result Update Guidance subdued, maintain Hold Sector: Technology CMP: ` 474 Recommendation: Hold Market statistics Current stock price (`) 474 Shares O/S (cr.) 243.1 Mcap (` cr) 115,090 52W
AIRBUS FY Results 2017
 AIRBUS FY Results 2017 15 February 2018 Tom Enders Chief Executive Officer Harald Wilhelm Chief Financial Officer SAFE HARBOUR STATEMENT 2 DISCLAIMER This presentation includes forward-looking statements.
Techno Electric & Engineering Limited
 Engineering & Capital Goods Techno Electric & Engineering Limited 3QFY17 Result Update BUY EPC margin expanded despite muted revenue growth... Institutional Research CMP (Rs) 374 Target (Rs) 467 Nifty:
NTPC LIMITED RESEARCH
 RESULTS REVIEW NTPC Limited Buy Share Data Market Cap Rs. 1,248.4 bn Price Rs. 151.4 BSE Sensex 9,839.69 Reuters NTPC.BO Bloomberg NATP IN Avg. Volume (52 Week) 2.50 mn 52-Week High/Low Rs. 291 / 113 Shares
Investor and Analyst presentation Senvion S.A.
 Investor and Analyst presentation Senvion S.A. Nine month results for the period ended on 30 September 2018 14 November 2018 Disclaimer This presentation (the Presentation ) has been prepared by Senvion
L&T Finance Holdings (LTFH)
") Date : 25 th May, L&T Finance Holdings (LTFH) IPO Proceeds Utilization : At the time of the IPO, the company had proposed to utilize the net proceeds to repay inter corporate deposits issued by the Promoters
Date : 25 th May, L&T Finance Holdings (LTFH) IPO Proceeds Utilization : At the time of the IPO, the company had proposed to utilize the net proceeds to repay inter corporate deposits issued by the Promoters
Fiscal year 2011 off to a strong start
 Fiscal year 2011 off to a strong start Peter Löscher, President and CEO Joe Kaeser, CFO Q1 FY 11 Analyst call January 25, 2011 Copyright Siemens AG 2011. All rights reserved. Safe Harbour Statement This
NIIT Technologies. Financial Performance Q2FY15. October 15, NIIT Technologies
 NIIT Technologies Financial Performance Q2FY15 October 15, 2014 Outline Financial Highlights Business Update Financial Statements Income Statement Balance Sheet Business Analysis 2014, NIIT Technologies
Eurozone Economic Watch. November 2017
 Eurozone Economic Watch November 2017 Eurozone: improved outlook, still subdued inflation Our MICA-BBVA model for growth estimates for the moment a quarterly GDP figure of around -0.7% in, after % QoQ
Inox Wind BUY. Performance Highlights. CMP Target Price `242 `286. 4QFY2016 Result Update Capital Goods. 3 year price chart
 4QFY216 Result Update Capital Goods May 11, 216 Inox Wind Performance Highlights Quarterly Data (Consolidated) ( ` cr) 4QFY16 4QFY15 % chg (yoy) 3QFY16 % chg (qoq) Total Income 1,829 93 96.6 941 94.2 EBITDA
Work in hand 4 increased to $42.0 billion
 Highlights Underlying NPATA up 58.9% to $296.5m Up 6.7% on a pro forma basis 1 Guidance met for seventh consecutive year Revenue 2 up 61.5% to $12.6bn (up 16.7% on a pro forma basis) Final dividend increased
Tech Mahindra. 4QFY17 Result Update. Short term blip, compelling valuation. Sector: Technology CMP: ` 429. Recommendation: Buy
 Tech Mahindra 4QFY17 Result Update Short term blip, compelling valuation Sector: Technology CMP: ` 429 Recommendation: Buy Market statistics Current stock price (`) 429 Shares O/S (cr.) 97.1 Mcap (` cr)
CMP* (Rs) 336 Upside/ (Downside) (%) 21 Bloomberg Ticker. MOIL IN Market Cap. (Rs bn) 45 Free Float (%) 24 Shares O/S (mn) 133
 336 Upside/ (Downside) (%) 21 Bloomberg Ticker. MOIL IN Market Cap. (Rs bn) 45 Free Float (%) 24 Shares O/S (mn) 133") 4QFY17 Result Update June 06, 2017 Market Cap. (Rs bn) 45 Free Float (%) 24 Shares O/S (mn) 133 Mixed Quarterly Performance; Volume to Remain Strong has reported a mixed performance in 4QFY17. Its blended
4QFY17 Result Update June 06, 2017 Market Cap. (Rs bn) 45 Free Float (%) 24 Shares O/S (mn) 133 Mixed Quarterly Performance; Volume to Remain Strong has reported a mixed performance in 4QFY17. Its blended
Q Earnings. July 26, 2017
 Q3 2017 Earnings July 26, 2017 Forward-Looking Statements and Non-GAAP Measures Forward-Looking Statements This presentation contains certain forward-looking statements within the meaning of the U.S. Private
Investor presentation Winter 2016
 Investor presentation Winter 2016 Background Ticker: AMFW Listed on LSE and NYSE Market cap: c 1.8bn / $2.3bn Ave liquidity: c 20m/$25m p.d. All Share 250 6% Americas Location of shareholders 58% 36% Europe
Simplex Infrastructures
 May-14 Jul-14 Aug-14 Sep-14 Nov-14 Dec-14 Jan-15 Mar-15 Apr-15 May-15 India Research Infrastructure May 27, 2015 QUARTERLY REVIEW Bloomberg: SINF IN Reuters: SINF.BO HOLD Working capital ease to improve
Financials/Valu FY15 FY16 FY17 FY18E FY19E
 29Aug17 INDUSTRY Eng. & Cons. BSE Code 540047 NSE Code NIFTY DBL 9912 Company Data CMP 625 Target Price 6 Previous Target Price 595 Upside 9% 52wk Range H/L Mkt Capital (Rs Cr) Av. Volume (,000) Superior
Better H results; 2017 EBITDA target revised upwards
 Press release Vallourec reports second quarter and first half 2017 results Better H1 2017 results; 2017 EBITDA target revised upwards Q2 2017 EBITDA positive, at 3 million H1 2017 EBITDA of - 18 million,
The BKW Group «We are shaping the future of energy straightforward, reliable and integrated»
 The BKW Group «We are shaping the future of energy straightforward, reliable and integrated» COMPANY PRESENTATION, LONDON 28.04.2016 ROADSHOW LONDON BKW 28.04.2016 Contents Overview Financial results 2015
Margin PAT (Rs Margin
 4 Recommendation BUY Best bet at current FMCG space, Attractive Valuations; BUY CMP Rs. 345 ITC posted a good quarter in terms of Net Sales/Gross Profit/EBITDA/PAT increased by 11.8%/13.9%/18.4%/18.2%
Kalpataru Power Transmission
 INDUSTRY CAPITAL GOODS CMP (as on 19 May 2017) Rs 352 Target Price Rs 403 Nifty 9,428 Sensex 30,465 KEY STOCK DATA Bloomberg /Reuters KPP IN No. of Shares (mn) 153 MCap (Rs bn) / ($ mn) 54/836 6m avg traded
PTC India Financial Services
 India I Equities BFSI Result Update Change in Estimates Target Reco 2 January 215 PTC India Financial Services Improving sanctions, high NIM, stable asset quality; Buy Key takeaways Strong loan growth,
XYLEM INC. Q EARNINGS RELEASE MAY 1, 2018
 XYLEM INC. Q1 2018 EARNINGS RELEASE MAY 1, 2018 Q1 2018 EARNINGS RELEASE FORWARD-LOOKING STATEMENTS This presentation contains information that may constitute forward-looking statements. Forward-looking
Results presentation For the year ending 31 December 2015
 Results presentation For the year ending 31 December 2015 1 Results Presentation March 2016 Agenda 1 2015 Overview & Business Priorities Update Chris Weston, CEO 2 2015 Financial & Operating Review Carole
Power Mech Projects. Institutional Equities. 2QFY18 Result Update BUY. Strong Business Scalability Likely; Retain Buy
 2QFY18 Result Update Power Mech Projects 23 November 217 Reuters: POMP.BO; Bloomberg: POWM IN Strong Business Scalability Likely; Retain Buy Power Mech Projects (PMPL) posted 2QFY18 consolidated revenues
Building the Future D A.. DAVIDSON DA CONFERENCE SEPTEMBER 11, 2012
 Building the Future D A DAVIDSON CONFERENCE D.A. DAVIDSON CONFERENCE SEPTEMBER 11, 2012 SAFE HARBOR STATEMENT The matters discussed in this presentation may make projections and other forward-looking statements
Analysts Conference Full Year Results 2004 Frankfurt, March 22, pm
 Analysts Conference Full Year Results 2004 Frankfurt, March 22, 2005 3.00pm Page 4 Page 17 Page 32 Presentation of Dr Wolfgang Reitzle President & CEO, Linde AG Presentation of Dr Peter Diesch CFO, Linde
Result Presentation Q1 FY11 13th August 2010
 Suzlon Energy Limited Result Presentation Q1 FY11 13th August 2010 Disclaimer This presentation and the accompanying slides (the Presentation ), which have been prepared by Suzlon Energy Limited (the Company
IL&FS Energy Development Company Limited September 25, Rating 9. CARE BB- [Double B Minus] (credit watch under negative implications)
![IL&FS Energy Development Company Limited September 25, Rating 9. CARE BB- [Double B Minus] (credit watch under negative implications)](/thumbs/93/112168110.jpg "IL&FS Energy Development Company Limited September 25, Rating 9. CARE BB- [Double B Minus] (credit watch under negative implications)") Ratings Facilities Long-Term - Non- - Tranche-I and Tranche II Proposed Long-Term- Non- - Tranche-III Long Term-Inter-Corporate Deposit (ICD) Issue IL&FS Energy Development Company Limited September 25,
Ratings Facilities Long-Term - Non- - Tranche-I and Tranche II Proposed Long-Term- Non- - Tranche-III Long Term-Inter-Corporate Deposit (ICD) Issue IL&FS Energy Development Company Limited September 25,
Siemens Growth Gains Momentum Orders and revenue rise again in all Sectors and regions Strong Q4 completes record year for cash
 Siemens Growth Gains Momentum Orders and revenue rise again in all Sectors and regions Strong Q4 completes record year for cash Peter Löscher, President and Chief Executive Officer of Siemens AG We completed
H FINANCIAL RESULTS. Milan September 18 th, 2018
 H1 2018 FINANCIAL RESULTS Milan September 18 th, 2018 1 AGENDA H1 2018 Highlights o o o Group overview Results by business Outlook Financial results Appendix 2 H1 2018 Financial Highlights Organic sales