Analyst Meet Presentation Q2 FY11. Analyst Meet Presentation Q2 FY11
|
|
|
- Lindsey Greer
- 5 years ago
- Views:
Transcription

1 Analyst Meet Presentation Q2 FY11 Analyst Meet Presentation Q2 FY11
2 Agenda Key Developments Economic and Steel Scenario Performance Highlights Projects Update 2
3 Key Developments Highest ever quarterly sales by volume (1.583mnt) and value (` 6,184 crores) FCD of ` 4800 Crores issued to JFE converted to 32mn equity shares Debt prepayment of ` 2,603 crores ` 2,197 crores currently invested in MFs/FDs will be used in lieu of tied up loans draw down for Capex Coke Oven 4 (Battery A) commissioned on 4th Oct 2010 Generation from 300 MW captive power plant started 3
4 Strengthening Balance Sheet Consolidated total net debt - equity ratio has improved to 0.80 at Sep 2010 end from 1.60 at Jun 2010 end Consolidated weighted average debt cost has come down by 58bps to 6.13% during Q2 FY11 Potential Equity Infusion of ` 2,488 Crores over 21 months ` 1,588 Crores Promoters warrants ` 600 crores 3mn GDRs plus 1mn shares to JFE ` 300 crores 2mn shares to JFE on conversion of outstanding FCCBs Impact of FCCBs conversion Outstanding FCCBs ` 1,230 crores, if converted will simultaneously increase equity and reduce debt. 4

5 Awards Fastest Growing Steel Company from ASAPP Media Information Group Global HR Excellence Awards organisation with innovative practices from APHC Star Performer Basic Iron and Steel Large Enterprise from EEPC Regional Award Gold Trophy Large Enterprise Top Exporter from EEPC APHC - ASIA Pacific Human Resource Management Congress EEPC Engineering Exports Promotion Council 5
6 Economic & Steel Scenario 6
7 Mar-09 Jun-09 Sep-09 Dec-09 Mar-10 Jun Actual Jan-09 Apr-09 Jul-09 Oct-09 Jan-10 Apr-10 Jul-10 Oct-10 Global Economy Global economy remains on recovery path, GDP forecast for 2010 continuously upgraded 10 Actual Quarterly GDP growth (% YoY) Annual GDP growth (% YoY) GDP Forecast Dates World Adv. economies Emg. and developing economies World Adv. economies Emg. and developing economies Source: IMF 7
8 Q4 FY09 Q1 FY10 Q2 FY10 Q3 FY10 Q4 FY10 Q1 FY11 Jan-09 Mar-09 May-09 Jul-09 Sep-09 Nov-09 Jan-10 Mar-10 May-10 Jul-10 Aug % 6.0% 6.5% 8.6% 8.6% 8.8% Indian Economy GDP growth remains robust and domestic consumption growth is intact GDP (% YoY) MMA, Jan 2009 = 100 Vehicle Sales Non-Food Credit Power 90 Source: MOSPI, Reuters, SIAM 8
9 Mar-10 Apr-10 May-10 Jun-10 Jul-10 Aug-10 Sep-10 Global Steel Trends Crude Steel Production (mnt) Steel Demand (% YoY growth) % 14% % 8% 7% % 5% 4% World BRIC China India 2010 E 2011 E Global Steel Demand (mnt) Year World BRIC China India E Source: WSA 2011 E
10 Oct-09 Nov-09 Dec-09 Jan-10 Feb-10 Mar-10 Apr-10 May-10 Jun-10 Jul-10 Aug-10 Sep-10 Oct-10 HRC Prices Producers raised prices in April & May to cover higher raw material costs N.America domestic FOB US Midwest mill Russia Black Sea export FOB Europe import CIF S.European port China export FOB Shanghai Source: SBB (All figures are in USD/ton) 10
11 Oct-09 Nov-09 Dec-09 Jan-10 Feb-10 Mar-10 Apr-10 May-10 Jun-10 Jul-10 Aug-10 Sep-10 Oct-10 Raw Material Prices Indian Iron Ore 63% Fe dry / China import CFR N.China port Scrap / Shredded / Rotterdam export FOB (RHS) Australian Spot HCC FOB (RHS) China Coke export FOB (RHS) Source: SBB, Macquarie Research (All figures are in USD/ton) 11
12 Jul-09 Aug-09 Sep-09 Oct-09 Nov-09 Dec-09 Jan-10 Feb-10 Mar-10 Apr-10 May-10 Jun-10 Jul-10 Aug-10 Sep-10 Jan-10 Feb-10 Mar-10 Apr-10 May-10 Jun-10 Jul-10 Aug-10 Sep Chinese Steel Market Production vs. consumption (mnt) Monthly finished steel production reduced to 46.5mnt in Sep 10 from 54.5mnt in May 10 Monthly Exports (mnt) Withdrawal of export rebate in July coupled with reduced production resulted in lower exports Finished Steel Production Apparent Steel Consumption Source: Mysteel, WSA (All figures are in million tons ) 12
13 Oct' 09 Nov' 09 Dec' 09 Jan' 10 Feb' 10 Mar' 10 Apr' 10 May' 10 Jun' 10 Jul' 10 Aug' 10 Sep' Indian Steel Market H1 Production vs. Consumption (mnt) Monthly Imports (mnt) 10% % Finished Steel Production Apparent Steel Consumption Apr -Sep' 09 Apr - Sep' 10 Source: JPC (All figures are in million tons ) *Production and consumption figures netted off for double counting effect 13
14 Operating & Financial Highlights 14
15 Production Q2 FY % YoY % -- QoQ % % 16% YoY % QoQ % Q2 '10 Q2 '11 Q1 '11 Rolled : Flat % YoY % % QoQ % Q2 '10 Q2 '11 Q1 '11 All numbers are in million tons Crude Steel Q2 '10 Q2 '11 Q1 '11 Rolled : Long 15

16 Production H1 FY 11 32% 8% YoY % YoY % H1 '10 H1 '11 Rolled : Flat 44% YoY % H1'10 Crude Steel All numbers are in million tons H1'11 H1 '10 H1 '11 Rolled : Long 16
17 Saleable Steel Sales Q2 FY % YoY % % QoQ % 40% 41% 19% 30% YoY % QoQ % YoY % QoQ % Q2 '10 Q2' 11 Q1 '11 Rolled : Flat Q2 '10 Q2 '11 Q1 '11 Value Added % YoY % 57% 25% YoY % QoQ % Q2 '10 Q2 '11 Q1 '11 Total Sales % QoQ % All numbers are in million tons Q2 '10 Q2 '11 Q1 '11 Semis Q2 '10 Q2 '11 Q1 '11 Rolled : Long 17
18 Saleable Steel Sales H1 FY % YoY % % YoY % H1 '10 H1 '11 Rolled : Flat H1 '10 H1 '11 Value Added % 51% YoY % YoY % H1 '10 H1 '11 Total Sales All numbers are in million tons H1 '10 H1 '11 Semis H1 '10 H1 '11 Rolled : Long 18

19 Focus on Retail Sales Sales through JSW Shoppe-Q2 FY 11 (In 000 tons) % Share through JSW Shoppe-Q2 FY 11 (Excluding Semis) MnT, % Share 152% % 26% 45% Value Added: Flat % Rolled: Long % Rolled: HR Products Q2 FY 10 Q2 FY 11 JSW Shoppe 19
20 Financials Q2 FY11 (Standalone) Particulars Q2 FY 11 Q2 FY 10 Growth ` Cr. ` Cr. % Net Sales 5,713 4,554 25% Op. EBITDA (excl. Fx Variance) 998 1,189-16% Op. EBITDA Margin (excl. Fx Variance) 17.3% 26.0% EBITDA 1,156 1,167-1% EBITDA Margin 20.0% 25.5% Less: Net Finance Charges % Less: Depreciation % Profit Before Tax % Profit after Tax % 20
21 Financials H1 FY11 (Standalone) Particulars H1 FY 11 H1 FY 10 Growth ` Cr. ` Cr. % Total Income 10,360 8,448 23% Op. EBITDA (Excl. Fx Variance) 2,130 1,940 10% Op. EBITDA Margin (Excl. Fx Variance) 20.4% 22.8% EBITDA 2,190 2,154 2% EBITDA Margin 20.9% 25.4% Less: Net Finance Charges % Less :Depreciation % Profit Before Tax 1,130 1,154-2% Profit After Tax % 21
22 EBITDA MOVEMENT Q2 FY 11 (Standalone) 98 1,167 1, ` Cr (16) (1014) EBIDTA Q2'10 Volume Cost NSR Mix CER/Other Income Fx Variance EBIDTA Q2'11 22
23 Operational & Financial Performance - USA Production (NT) Q2 FY 11 Q2 FY 10 Growth Plate Mill 37,699 48,895-23% Pipe Mill 9,495 16,845-44% Sales (NT) Q2 FY 11 Q2 FY 10 Growth Plate Mill 23,040 38,689-40% Pipe Mill 11,970 17,822-33% USD Mn Particulars Q2 FY 11 Q2 FY 10 Turnover EBITDA + Other Income 0.85 (21.03) Profit After Tax (13.14) (25.13) 23
24 Financials Q2 FY 11 (Consolidated) Particulars Q2 FY 11 Q2 FY 10 Growth ` Cr. ` Cr. % Total Income 5,972 4,757 26% EBITDA 1,186 1,075 10% Less: Net Finance Charges % Less :Depreciation % Profit Before Tax % Profit After Tax % 24
25 Financials H1 FY11 (Consolidated) Particulars H1 FY 11 H1 FY 10 Growth ` Cr. ` Cr. % Total Income 10,830 8,770 23% EBITDA 2,265 2,003 13% Less: Net Finance Charges % Less :Depreciation % Profit Before Tax % Profit After Tax % 25
26 Net Total Debt Movement (Consolidated) 16, (377) ` Cr. (2330) (334) 12,188 (1850) Net Total Debt as on Jun'10 New Loan Taken Repayments Prepayments Fx Variance Movement in FD/MF Net Total Debt as on Sep'10 Cash and Cash equivalent - ` 544 Crs. FD/Mutual Fund - ` 2,477 Crs. 26
27 Financial Ratios Particulars Q2 FY 11 Q2 FY 10 EBITDA Margin 20.0% 25.5% PAT Margin 7.7% 9.9% Diluted EPS (`) -Standalone* ROCE 12.1% 16.3% Particulars Net Total Debt/Equity (x) Net Total Debt/EBITDA (x) Net Total Debt/Equity-Consolidated (x) Net Total Debt/EBITDA-Consolidated (x) * Not Annualized 27
28 Projects Update 28
29 West Bengal Projects overview Projects Zero date Implementation period 4.5 mtpa Greenfield HRC plant Apr months 660 MW power plant (26% stake in SPV) Apr months 2.4 mtpa Kulti Sitarampur coking coal mines development Jan months 2.6 mtpa Ichhapur thermal coal mines development (26% stake in SPV) Jan months 29
30 West Bengal Projects financing Investments ` crores Steel Project cost (Debt to Equity 2:1) 15,350 Equity stake in Power plant SPV - project cost ` 3,300 crores (Debt to Equity 3:1) 215 Equity stake in coking coal mines SPV - project cost ` 1,350 crores (Debt to Equity 3:1) 337 Equity stake in thermal coal mines SPV - project cost ` 1,500 crores (Debt to Equity 3:1) 98 Total 16,000 Means of Financing ` crores Equity JSWSL/Strategic Partners/IPO 5,327 WBIDC/WBMDTC 6 Debt - RTL/FCL/ECB* 10,667 Total 16,000 JSWSL - JSW Steel Limited WBIDC - West Bengal Industrial development corporation limited/ WBMDTC - West Bengal mineral development and trading corporation limited RTL - Rupee term loan, FCL Foreign currency loans, ECB External commercial borrowing 30

31 West Bengal Projects: structure JSWSL JSWEL 74% 94% (Min) WBIDCL/ WBMDTC 6% (Max) JSWBSL 26% JSWEBL Subsidiary 100% Proposed Subsidiary 100% Proposed SPV 1 SPV 2 JSWSL JSW Steel Ltd. JSWEL JSW Energy Ltd. WBIDCL West Bengal Industrial development corporation limited WBMDTC West Bengal mineral development and trading corporation limited JSWBSL JSW Bengal Steel Ltd. (implementing steel project) JSWEBL JSW Energy (Bengal) Ltd. (implementing power project) SPV 1 Implementing development of coking coal mines SPV2 Implementing development of thermal coal mines 31


32 Blast Furnace As on Jun 10 As on Sep 10 32
 As on")

33 SMS (Phase II) As on Jun 10 As on Sep 10 33
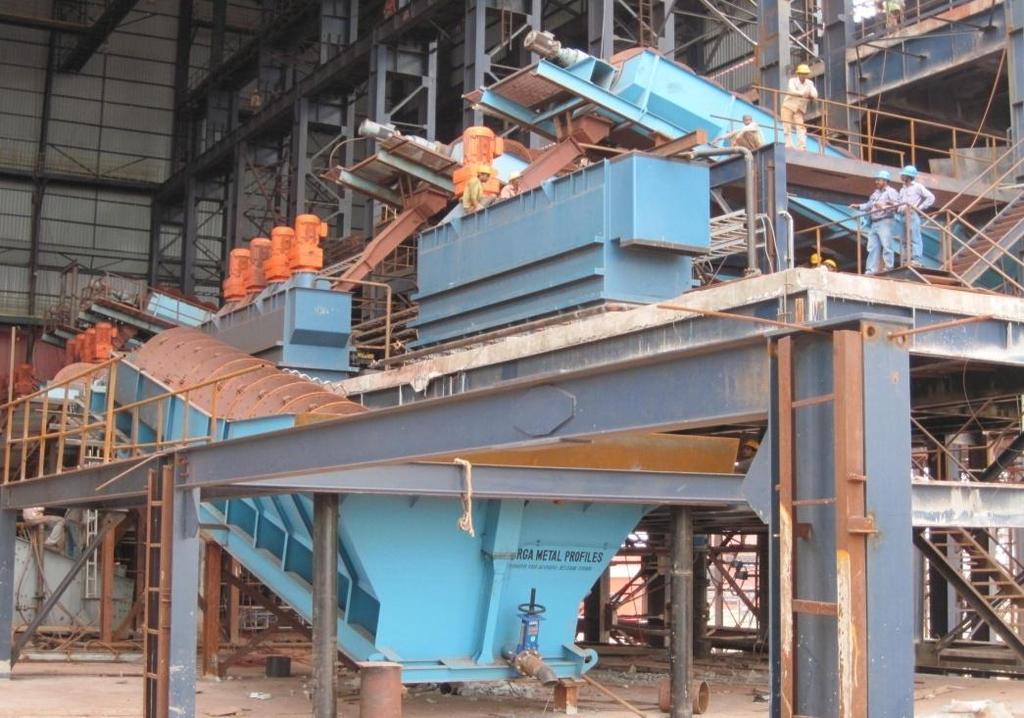
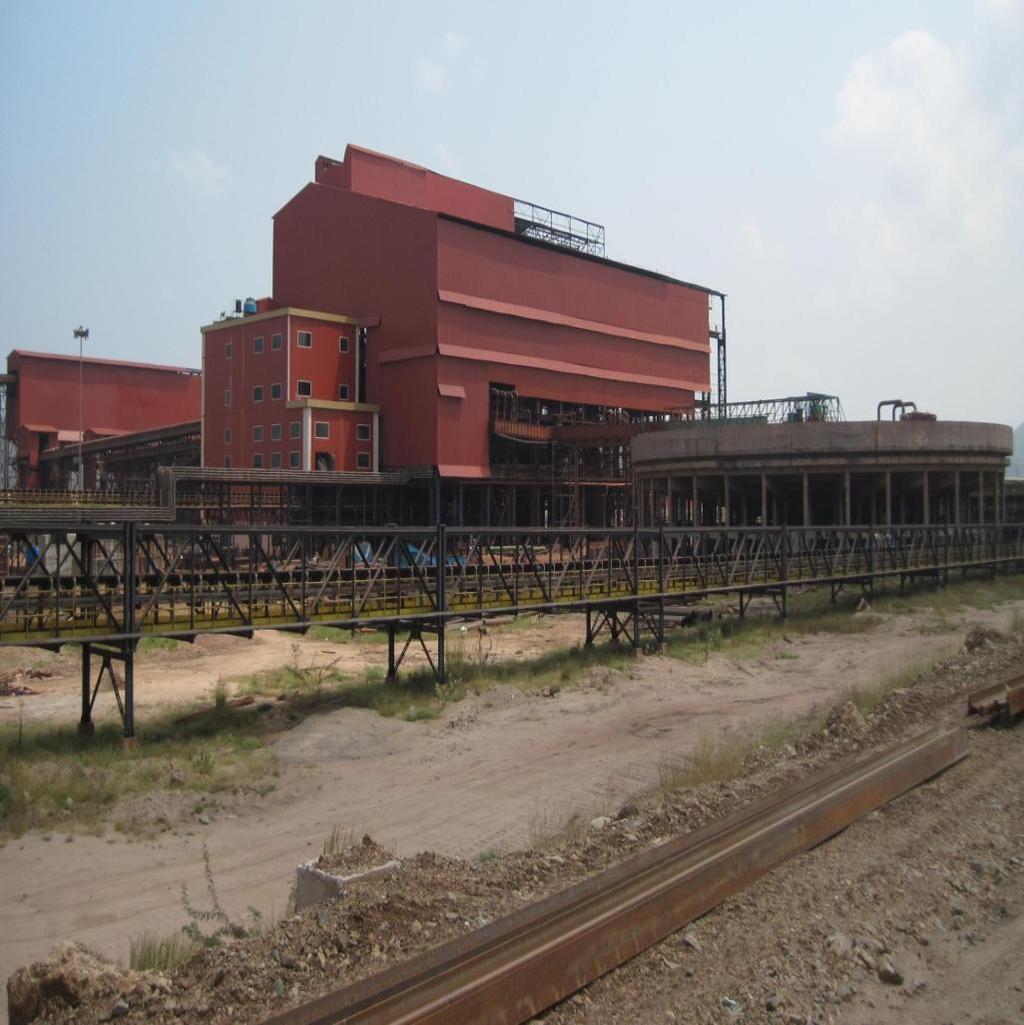
34 Beneficiation Plant As on Jun 10 As on Sep 10 34


35 LCP As on Jun 10 As on Sep 10 35

36 Q & A Session 36
37 Forward Looking and Cautionary Statement Certain statements in this report concerning our future growth prospects are forward looking statements, which involve a number of risks, and uncertainties that could cause actual results to differ materially from those in such forward looking statements. The risk and uncertainties relating to these statements include, but are not limited to risks and uncertainties regarding fluctuations in earnings, our ability to manage growth, intense competition within Steel industry including those factors which may affect our cost advantage, wage increases in India, our ability to attract and retain highly skilled professionals, time and cost overruns on fixed-price, fixed-time frame contracts, our ability to commission mines within contemplated time and costs, our ability to raise the finance within time and cost client concentration, restrictions on immigration, our ability to manage our internal operations, reduced demand for steel, our ability to successfully complete and integrate potential acquisitions, liability for damages on our service contracts, the success of the companies in which the Company has made strategic investments, withdrawal of fiscal/governmental incentives, impact of regulatory measures, political instability, legal restrictions on raising capital or acquiring companies outside India, unauthorized use of our intellectual property and general economic conditions affecting our industry. The company does not undertake to update any forward looking statements that may be made from time to time by or on behalf of the company. 37
38 Thank you 38
Analyst Meet Presentation Standalone Financial Results, Quarter Ended 30 Sep 2011
 Analyst Meet Presentation Standalone Financial Results, Quarter Ended 30 Sep 2011 Agenda Business Environment Key Developments Performance Overview Projects Update Guidance Update 2 Global economy Recovery
Agenda. Overview. Key Highlights. Performance Review. Projects Update and Guidance. Steel Scenario
 May 2011 Agenda Overview Key Highlights Performance Review Projects Update and Guidance Steel Scenario 2 JSW Group Overview A USD 7 billion group with diversified interests in Steel, Energy, Minerals and
Analyst Meet Presentation Q4 FY10
 Analyst Meet Presentation Q4 FY10 Agenda Economic Scenario Steel Scenario Operating Highlights Project Progress Financial Performance 2 Improving Global Outlook 10 0 10 Centre depicts zero and periphery
1QFY14 Results Presentation
 1QFY14 Results Presentation 1 Key highlights 1QFY14 Standalone performance Consolidated performance JSW Steel JSW Ispat merger update Highest ever Crude Steel production: 2.86 million tonnes Saleable Steel
2QFY14 Results Presentation
 2QFY14 Results Presentation 1 Key highlights 3QFY14 Standalone performance Consolidated performance Key update Highest ever Crude Steel production: 3.19 million tonnes Gross Turnover: `12,651 crores Net
JSW Steel Limited Q2 FY Results Presentation October 31, 2017
 JSW Steel Limited Q2 FY 2017-18 Results Presentation October 31, 2017 Key highlights Q2 FY18 Standalone performance Crude Steel production: 3.94 million tonnes Saleable Steel sales: 3.92 million tonnes
JSW Steel Limited Q1 FY Results Presentation July 25, Better Everyday
 JSW Steel Limited Q1 FY 2018-19 Results Presentation July 25, 2018 Better Everyday 1 Key highlights Q1 FY19 Standalone performance Crude Steel production: 4.11 million tonnes, up by 5% YoY Saleable Steel
JSW Steel Limited 2QFY16 Results Presentation October 21, 2015
 JSW Steel Limited 2QFY16 Results Presentation October 21, 2015 Key highlights 2QFY16 Standalone performance Highest ever quarterly Saleable Steel sales: 3.19 million tonnes Crude Steel production: 3.25
JSW Steel Limited 1QFY18 Results Presentation August 01, 2017
 JSW Steel Limited 1QFY18 Results Presentation August 01, 2017 Key highlights 1QFY18 Standalone performance Crude Steel production: 3.91 million tonnes Steel sales: 3.51 million tonnes Quarterly EBITDA
JSW Steel Limited Q2 FY Results Presentation October 25, Better Everyday
 JSW Steel Limited Q2 FY 2018-19 Results Presentation October 25, 2018 Better Everyday 1 Key highlights Q2 FY19 Standalone performance Crude Steel production: 4.18 million tonnes, up by 6% YoY Saleable
Months Consolidated Results. 28 April 2015
 1 28.04.2015 2015 3 Months Consolidated Results 28 April 2015 2 28.04.2015 DISCLAMIER Ereğli Demir Çelik Fabrikaları T.A.Ş. (Erdemir) may, when necessary, make written or verbal announcements about forward-looking
JSW reports flat sales in Q3 FY
 Press Release 28.01.2009 JSW reports flat sales in Q3 FY 2008-09 JSW reported flat sales in the 3rd quarter when the world steel demand and prices fell significantly mainly due to change in the product
O.P. Jindal Group and JSW Group Overview
 July 01, 20091 Group Overview 2 O.P. Jindal Group and JSW Group Overview P R Jindal Sajjan Jindal Ratan Jindal Naveen Jindal Jindal Saw Jindal Stainless Jindal Steel & Power Ltd. Power Steel Infrastructure
JSW Steel post 17% higher EBIDTA at `4,501 crores
 Press Release February 06, 2019 JSW Steel post 17% higher EBIDTA at `4,501 crores Mumbai, India: JSW Steel Limited ( JSW Steel or the Company ) today reported its results for the third quarter and the
Months Consolidated Results. 25 April 2016
 1 25.04.2016 2016 3 Months Consolidated Results 25 April 2016 2 25.04.2016 DISCLAMIER Ereğli Demir Çelik Fabrikaları T.A.Ş. (Erdemir) may, when necessary, make written or verbal announcements about forward-looking
Erdemir Group Months Consolidated Financial Results
 1 / 35 Erdemir Group 2014 9 Months Consolidated Financial Results 28 October 2014 2 / 35 DISCLAIMER Ereğli Demir Çelik Fabrikaları T.A.Ş. (Erdemir) may, when necessary, make written or verbal announcements
Erdemir Group Months Consolidated Financial Results
 1 / 35 Erdemir Group 2014 6 Months Consolidated Financial Results 12 August 2014 2 / 35 DISCLAIMER Ereğli Demir Çelik Fabrikaları T.A.Ş. (Erdemir) may, when necessary, make written or verbal announcements
Erdemir Group 2011 First Quarter Consolidated Financial Results. 06 May 2011
 Erdemir Group 2011 First Quarter Consolidated Financial Results 06 May 2011 2 / 26 DISCLAIMER Ereğli Demir Çelik Fabrikaları T.A.Ş. (Erdemir) may, when necessary, make written or verbal announcements about
Erdemir Group 2009 Consolidated Financial Results
 Erdemir Group 2009 Consolidated Financial Results 22 February 2010 1 /28 DISCLAIMER Ereğli Demir Çelik Fabrikaları T.A.Ş. (Erdemir) may, when necessary, make written or verbal announcements about forward-looking
Erdemir Group Months Consolidated Financial Results. 11 November 2013
 Erdemir Group 2013 9 Months Consolidated Financial Results 11 November 2013 2 / 32 DISCLAIMER Ereğli Demir Çelik Fabrikaları T.A.Ş. (Erdemir) may, when necessary, make written or verbal announcements about
Emerging markets and mining growth
 Emerging markets and mining growth Aditya Mittal CFO and member of Group Management Board Plant Tour Brazil - 24-26 March 21 Disclaimer Forward-Looking Statements This document may contain forward-looking
Tata Steel Reports Consolidated Financial Results for the Quarter and year ended March 31, 2018
 Mumbai, May 16, 2018 For immediate use Tata Steel Reports Consolidated Financial Results for the Quarter and year ended March 31, 2018 Highlights: Health and Safety: LTIFR rate of 0.46 in FY18 compared
Transforming tomorrow
 Transforming tomorrow Bank of America Merrill Lynch Global Metals and Mining Conference May 2010 Disclaimer Forward-Looking Statements This document may contain forward-looking information and statements
1. Executive Summary Chairman s Message Steel Industry Overview Steel Industry Outlook Standalone Financial Performance 7
 Table of Contents 1. Executive Summary 3 2. Chairman s Message 4 3. Steel Industry Overview 5 4. Steel Industry Outlook 6 5. Standalone Financial Performance 7 6. Quarterly Performance Trends 12 7. Graphite
NSE: GRAPHITE, BSE: Q1 FY2019 Earnings Presentation August 6 th, 2018
 NSE: GRAPHITE, BSE: 509488 Q1 FY2019 Earnings Presentation August 6 th, 2018 Discussion Agenda Executive Summary 3 Chairman s Message 4 Steel Industry Overview 5-6 Graphite Electrode Industry Overview
PRESS RELEASE FINANCIAL RESULTS FOR FOURTH QUARTER & FULL YEAR FY
 PRESS RELEASE FINANCIAL RESULTS FOR FOURTH QUARTER & FULL YEAR FY2016-17 JSPL achieves several firsts & new highs in Q4 Sinter plant & Coke Oven batteries of 4MT expansion of Angul Steel Plant commissioned
Q1 FY 19. Industry Update & Key Performance Highlights. 9 th August, 2018
 Q1 FY 19 Industry Update & Key Performance Highlights 9 th August, 2018 This presentation may contain certain forward looking statements concerning JSPL s future business prospects and business profitability,
Q4 FY 17. Industry Update & Key Performance Highlights. 23 rd May, 2017
 Q4 FY 17 Industry Update & Key Performance Highlights 23 rd May, 2017 DISCLAIMER This presentation may contain certain forward looking statements concerning JSPL s future business prospects and business
Results Presentation Financial quarter ended June 30, 2018 August 13, 2018
 Results Presentation Financial quarter ended June 30, 2018 August 13, 2018 1 Safe harbor statement Statements in this presentation describing the Company s performance may be forward looking statements
Metals & Mining. Chinese steel production on declining trend. Monthly Update. ICICI Securities Ltd Retail Equity Research.
 Monthly Update Index Performance Return % 1M 3M 6M 12M BSE Metals 2 9 18 30 BSE 5 2 9 19 NSE 5 1 7 19 Source: Reuters, ICICIdirect.com Research Domestic steel production Month on Month (MT) Jan18 Jan17
Metals & Mining. Traction in Indian, Chinese steel production. Monthly Update. ICICI Securities Ltd Retail Equity Research.
 Monthly Update Index Performance Return % 1M 3M 6M 12M BSE Metals 10 9 6 30 BSE 4 9 18 16 NSE 4 8 18 17 Source: Reuters, ICICIdirect.com Research Domestic steel production Month on Month (MT) YoY % MoM
Positive trend in earnings and strong cash flow
 Positive trend in earnings and strong cash flow Presentation of the Q3/2017 result Martin Lindqvist, President & CEO Håkan Folin, CFO October 25, 2017 Agenda Q3/2017 and performance by division Financials
1. Executive Summary Chairman s Message Steel Industry Overview Standalone Financial Performance 7
 Table of Contents 1. Executive Summary 3 2. Chairman s Message 4 3. Steel Industry Overview 5 4. Standalone Financial Performance 7 5. Quarterly Performance Trends 10 6. Graphite India: At a Glance 12
Metals & Mining. Decline in coking coal prices to ease cost... Monthly Update. ICICI Securities Ltd Retail Equity Research.
 Monthly Update Index Performance Return % 1M 3M 6M 12M BSE Metals 5 5 29 33 BSE 7 9 12 30 NSE 6 8 11 29 Source: Reuters, ICICIdirect.com Research Domestic steel production Month on Month (MT) Dec17 Dec16
Q2 FY 19. Industry Update & Key Performance Highlights. 13 th November, 2018
 Q2 FY 19 Industry Update & Key Performance Highlights 13 th November, 2018 This presentation may contain certain forward looking statements concerning JSPL s future business prospects and business profitability,
Q2 FY2014 Earnings Presentation November 8, 2013
 Q2 FY2014 Earnings Presentation November 8, 2013 Important Notice Forward Looking Statements This presentation contains statements that contain forward looking statements including, but without limitation,
SECTOR UPDATE KEY HIGHLIGHTS: FY 2011 FINANCIAL RESULTS SITE PHOTOGRAPHS
 FY 2011 SECTOR UPDATE KEY HIGHLIGHTS: FY 2011 FINANCIAL RESULTS PROJECT UPDATE STRATEGIC PRIORITIES SITE PHOTOGRAPHS 2 Capacity Build up (GW) Peak Demand/Supply (GW) FY 2011 India: World s 6 th largest
Sesa Goa NEUTRAL. Performance Highlights CMP. `372 Target Price - 2QFY2011 Result Update Mining. Investment Period -
 2QFY211 Result Update Mining October 18, 21 Sesa Goa Performance Highlights Particulars (` cr) 2QFY211 2QFY21 % chg (yoy) 1QFY211 % chg (qoq) Net sales 918 539 7.5 2,413 (61.9) EBITDA 34 153 122.5 1,46
Results Presentation Financial quarter ended September 30, 2018 November 13, 2018
 Results Presentation Financial quarter ended September 30, 2018 November 13, 2018 1 Safe harbor statement Statements in this presentation describing the Company s performance may be forward looking statements
1. Executive Summary Chairman s Message Steel Industry Overview Steel Industry Outlook Standalone Financial Performance 7
 Table of Contents 1. Executive Summary 3 2. Chairman s Message 4 3. Steel Industry Overview 5 4. Steel Industry Outlook 6 5. Standalone Financial Performance 7 6. Quarterly Performance Trends 12 7. Graphite
Note: *HRC Rolling Margin = HRC Spread/average selling price, **Net Debt = Interest Bearing Debt Cash and cash equivalents
 Management s Discussion and Analysis (MD&A) Sahaviriya Steel Industries Public Company Limited, its Subsidiaries and Jointly- Controlled Entities For the Third Quarter of 2012 1. Third Quarter of 2012
Investor Presentation
 March, 2010 1 Disclaimer This document can contain statements which constitute forward-looking statements. Such forward-looking statements are dependent on estimates, data or methods that may be incorrect
AUDITED RESULTS FOR THE YEAR ENDED 31 DECEMBER 2016
 AUDITED RESULTS FOR THE YEAR ENDED 31 DECEMBER 2016 AGENDA 2 1 Opening remarks / market update 2 Financial results 3 Operational review 4 Strategy update 5 Outlook 1 2 3 4 5 OPENING REMARKS / MARKET UPDATE
JSW Energy Limited Acquisition of 1,000 MW Tamnar Power Plant
 JSW Energy Limited Acquisition of 1,000 MW Tamnar Power Plant May 04, 2016 Agenda Acquisition Rationale Target Overview Acquisition Overview 2 Acquisition Rationale for JSWEL Enhances Operational Capacity
Energy Q1 FY 2012 Lighting up the Future 1
 Energy Q1 FY 2012 Lighting up the Future 1 SECTOR UPDATE KEY HIGHLIGHTS FINANCIAL RESULTS PROJECT UPDATE STRATEGIC PRIORITIES SITE PHOTOGRAPHS 2 Capacity Build up (GW) Peak Demand/Supply (GW) Q1 FY 12
Text. improvement in earnings. Textdemand drove continued
 Good Textdemand drove continued improvement in earnings Text Presentation of the Q2/2018 results Martin Lindqvist, President & CEO Håkan Folin, CFO July 20, 2018 Agenda Market and demand trends Performance
Forward looking and cautionary statement
 Merger Presentation September 2012 1 Forward looking and cautionary statement The views expressed here may contain information derived from publicly available sources that have not been independently verified.
Prakash Industries Limited
 Prakash Industries Limited People... Prosperity... Progress Q2 & H1 FY18 Result Presentation Disclaimer This presentation and the accompanying slides (the Presentation ), which have been prepared by Prakash
Investor Presentation
 March, 2010 1 Disclaimer This document can contain statements which constitute forward-looking statements. Such forward-looking statements are dependent on estimates, data or methods that may be incorrect
1 F b e 3 ruary, 2010
 February 3, 2010 1 Forward-looking Statement This presentation contains certain forward-looking statements. The Company has tried, whenever possible, to identify these forward-looking statements using
Commodities Observing the fundamentals Written by: Dwayne Dippenaar, Research Analyst at Laurium Capital
 FUNDS ON FRIDAY b y G l a c i e r R e s e a r c h 24 J u n e 2 0 1 6 V o l u m e 8 6 7 Commodities Observing the fundamentals Written by: Dwayne Dippenaar, Research Analyst at Laurium Capital The South
Longbow Basic Materials Conference. March 2011
 Longbow Basic Materials Conference March 211 Disclaimer Forward-Looking Statements This document may contain forward-looking information and statements about ArcelorMittal and its subsidiaries. These statements
Sanjay Jain Pavas Pethia
 BSE Sensex S&P CNX 19,561 5,923 Bloomberg SAIL IN Equity Shares (m) 4,130.4 M.Cap. (INR b)/(usd b) 334.6/6.2 52-Week Range (INR) 116/76 1,6,12 Rel. Perf. (%) -11/-17/-38 Financials & Valuation (INR b)
Valuation & Recommendation. planning to increase its capacity from the current 6.8mtpa to
 Recommendation SUBSCRIBE Investment rationale: Issue Price Rs. 594 610 Expansion Projects to enhance Capacity: Tata Steel is planning to increase its capacity from the current 6.8mtpa to Bidding Date 19
1H2012 Results Baoshan Iron & Steel Co.,Ltd. August 2012
 H22 Results Baoshan Iron & Steel Co.,Ltd. August 22 Disclaimer The following presentation distributed herewith includes forwardlooking statements. All statements, other than statements of historical facts,
Hindalco Industries Limited. Q2 FY19 Earnings Presentation 02 nd November, 2018
 Hindalco Industries Limited Q2 FY19 Earnings Presentation 02 nd November, 2018 SAFE HARBOUR Certain statements in this report may be forward looking statements within the meaning of applicable securities
Macroeconomic and Financial Development: Mongolia
 Macroeconomic and Financial Development: Mongolia WORKSHOPS ON SUPPORTING ASIA PACIFIC LLDCs AND BHUTAN IN MOBILIZING RESOURCES FOR THE SDGs 14 December 201 Current state of macroeconomic and financial
Core strength, sustainable growth. Lakshmi Mittal, Chairman and CEO Investor Day - 23 September 2011
 Core strength, sustainable growth Lakshmi Mittal, Chairman and CEO Investor Day - 23 September 2011 Disclaimer Forward-Looking Statements This document may contain forward-looking information and statements
FY10/3Q Consolidated Results Highlights
 February 4, 2011 1 Forward-looking Statement This presentation contains certain forward-looking statements. The Company has tried, whenever possible, to identify these forwardlooking statements using words
Business & Financial Presentation FY
 The Great Eastern Shipping Company Ltd. Business & Financial Presentation FY 2004-05 April 29, 2005 1 Forward Looking Statements Except for historical information, the statements made in this presentation
PRESS RELEASE FINANCIAL RESULTS FOR FIRST QUARTER - FY16. Enhanced capacities Pushing up Production & Sales Volumes
 PRESS RELEASE FINANCIAL RESULTS FOR FIRST QUARTER - FY16 Enhanced capacities Pushing up Production & Sales Volumes JSPL Standalone 1QFY16 Performance : Crude Steel Production: 0.86 million tonnes Steel
Press Release Q JSW ENERGY LTD
 Press Release Q1 12-13 20.07.2012 JSW ENERGY LTD The Board of JSW Energy Ltd., at its meeting held today at Mumbai, approved the Results for the quarter ended June 30, 2012. Key highlights for Q1 FY 13
Steel Authority of India
 BSE SENSEX S&P CNX 16,439 4,990 4QFY12 Results Update Sector: Metals Steel Authority of India CMP: INR93 TP: INR99 Sell Bloomberg SAIL IN Equity Shares (m) 4,130.4 52-Week Range (INR) 151/73 1,6,12 Rel.
Yara International ASA Third Quarter results 2013
 Yara International ASA Third Quarter results 213 18 October 213 IR-Date: 213-1-18 1 Summary third quarter Strong results despite weaker commodity fertilizer markets 17% increase in deliveries including
U.S. Steel Market Outlook. Amy Ebben ArcelorMittal USA November 30, 2018
 U.S. Steel Market Outlook Amy Ebben ArcelorMittal USA November 30, 2018 Agenda ArcelorMittal introduction U.S. steel industry performance and trade Global steel industry Review of steel markets 1 About
Yara International ASA. 21 October 2011
 Yara International ASA Third quarter results 211 21 October 211 1 Summary third quarter Strong results driven by improved margins Strong demand outside Europe, satisfactory sales in Europe Sluiskil urea
Investor Presentation. Heavy plate rolling mill starts operating in July at the Ouro Branco mill (MG)
") Investor Presentation Heavy plate rolling mill starts operating in July at the Ouro Branco mill (MG) Agenda Outlook Gerdau Highlights 2 Economic Outlook GDP Growth 2014 2015f 2016f World 3.4% 3.1% 3.4%
Investor Presentation Heavy plate rolling mill starts operating in July at the Ouro Branco mill (MG) Agenda Outlook Gerdau Highlights 2 Economic Outlook GDP Growth 2014 2015f 2016f World 3.4% 3.1% 3.4%
Financial Results: Third Quarter Fiscal June 26, 2018
 Financial Results: Third Quarter Fiscal 2018 June 26, 2018 Safe Harbor SAFE HARBOR Statements and information included in this presentation by Schnitzer Steel Industries, Inc. (the "Company") that are
Equity Research PT Krakatau Steel (Persero)Tbk
Tbk") 20-Jan-17 20-Feb-17 20-Mar-17 20-Apr-17 20-May-17 20-Jun-17 20-Jul-17 20-Aug-17 20-Sep-17 20-Oct-17 20-Nov-17 20-Dec-17 Equity Research PT Krakatau Steel (Persero)Tbk 26 January 2018 Integrated Steel industry,
20-Jan-17 20-Feb-17 20-Mar-17 20-Apr-17 20-May-17 20-Jun-17 20-Jul-17 20-Aug-17 20-Sep-17 20-Oct-17 20-Nov-17 20-Dec-17 Equity Research PT Krakatau Steel (Persero)Tbk 26 January 2018 Integrated Steel industry,
Financial & Business Highlights For the Year Ended June 30, 2017
 Financial & Business Highlights For the Year Ended June, 17 17 16 15 14 13 12 Profit and Loss Account Operating Revenue 858 590 648 415 172 174 Investment gains net 5 162 909 825 322 516 Other 262 146
Sahaviriya Steel Industries PLC. Opportunity Day First Quarter 2014
 Sahaviriya Steel Industries PLC Opportunity Day First Quarter 2014 28 May 2014 Sahaviriya Steel Industries PLC Opportunity Day First Quarter 2014 28 May 2014 Disclaimer The information contained in this
Quarterly Result Analysis
 Recommendation BUY Snapshot CMP (04/02/2011) Rs. 640 Sector Stock Details BSE Code NSE Code Bloomberg Code Market Cap (Rs. cr) Free Float (%) 52 wk HI/Lo Avg. volume BSE (Monthly) Shares o/s (Crs) Metals
Annual Accounts February 1, 2007 Juha Rantanen, CEO.
 Annual Accounts 2006 February 1, 2007 Juha Rantanen, CEO www.outokumpu.com Highlights in 2006 Market development Improvement actions update and strategic direction Annual Accounts 2006 Outlook 2 February
Third quarter r esults results th November 2008
 Third quarter results 2008 5th November 2008 Disclaimer Forward-Looking Statements This document may contain forward-looking information and statements about ArcelorMittal and its subsidiaries. These statements
EVRAZ GROUP. 1H 2010 Financial and Operating Results. 2 September 2010
 EVRAZ GROUP 1H 21 Financial and Operating Results 2 September 21 Disclaimer 2 This document does not constitute or form part of and should not be construed as, an offer to sell or issue or the solicitation
JSW Steel Limited Investor Presentation February 2018
 JSW Steel Limited Investor Presentation February 2018 Agenda Overview Value Proposition Performance Overview Guidance Business Environment 2 JSW Group overview Presence across the core sectors Market cap
Charts on the 1st Quarter , February 13, ThyssenKrupp
 Charts on the 1st Quarter 2006-2007, February 13, 2007 0 Charts on the 1st Quarter 2006-2007, February 13, 2007 1 Q1 2006/2007 Overview Excellent start to fiscal year 2006/2007 Order intake: 13.3 billion,
Hyundai Steel (004020)
") Earnings Review February 1, 213 12M rating BUY (Maintain) 12M TP W111, from W111, Hyundai Steel (42) Astonishing earnings in many aspects Above In line Below Up/downside +34% Stock Data KOSPI (Jan 31,
Earnings Review February 1, 213 12M rating BUY (Maintain) 12M TP W111, from W111, Hyundai Steel (42) Astonishing earnings in many aspects Above In line Below Up/downside +34% Stock Data KOSPI (Jan 31,
Investor Presentation. Heavy plate rolling mill starts operating in July at the Ouro Branco mill (MG)
") Investor Presentation Heavy plate rolling mill starts operating in July at the Ouro Branco mill (MG) Agenda Outlook Gerdau Highlights 2 Economic Outlook GDP Growth 2014 2015f 2016f World 3.4% 3.1% 3.4%
Investor Presentation Heavy plate rolling mill starts operating in July at the Ouro Branco mill (MG) Agenda Outlook Gerdau Highlights 2 Economic Outlook GDP Growth 2014 2015f 2016f World 3.4% 3.1% 3.4%
BHARAT FORGE LIMITED RESEARCH
 EQUITY September 05, 2008 RESULTS REVIEW Share Data Market Cap Rs. 56 bn Price Rs. 250.45 BSE Sensex 14,483.83 Reuters Bloomberg Avg. Volume (52 Week) BFRG.BO BHFC IN 0.1 mn 52-Week High/Low Rs. 389.75/215.05
India Growth Story. Steel Market Asia Conference Ashok Bhardwaj. 19 th -20 th November Intercontinental Grand Stanford - Hong Kong
 India Growth Story Steel Market Asia Conference 2012 19 th -20 th November - 2012 Intercontinental Grand Stanford - Hong Kong Ashok Bhardwaj (Director - Marketing) JSW Steel Limited India Urbanization
Srikalahasti Pipes Ltd.
 February 8, 2016 Srikalahasti Pipes Ltd. Hitting a sweet spot in Water Infrastructure... CMP INR 243 Target INR 353 Result Update - BUY Key Share Data Face Value (INR) 10.0 Equity Capital (INR Mn) 397.6
BUY. Efforts on cost cutting paying off RAMCO CEMENTS. Target Price: Rs 435. Key highlights. Key drivers FY15 FY16E FY17E
 RAMCO S BUY Target Price: Rs 435 Efforts on cost cutting paying off Q2 EBITDA at Rs 2.8 bn (up 30% YoY) was ahead of our estimates due to lower-than-expected costs. Average costs (excluding freight) declined
Key Highlights. YoY (% change) Q1FY10. QoQ % Particulars 2Q FY10 2Q FY09 Realizations per tone 31,899 53,436-40% 30,462 5% Source: Company
 Q1FY10. QoQ % Particulars 2Q FY10 2Q FY09 Realizations per tone 31,899 53,436-40% 30,462 5% Source: Company") 29th October, 2009 Key Data INR CMP 743 Target Price 646 Earlier target price 481 Bloomberg Code JSTL IN Reuters Code JSTL.BO BSE Code 500228 NSE Code JSWSTEEL Face Value (INR) 10 Market Cap (INR bn) 142
29th October, 2009 Key Data INR CMP 743 Target Price 646 Earlier target price 481 Bloomberg Code JSTL IN Reuters Code JSTL.BO BSE Code 500228 NSE Code JSWSTEEL Face Value (INR) 10 Market Cap (INR bn) 142
George Economou CEO, DryShips Inc. The China Effect. Marine Capital Conference September
 George Economou CEO, DryShips Inc. The China Effect Marine Capital Conference September 6 2007 Forward Looking Statements Matters discussed in this presentation may constitute forward-looking statements.
Third quarter 2009 Media Presentation. October 28, 2009
 Third quarter 2009 Media Presentation October 28, 2009 Disclaimer Forward-Looking Statements This document may contain forward-looking information and statements about ArcelorMittal and its subsidiaries.
Economic Outlook: Global and India. Ajit Ranade IEEMA T & D Conclave December 12, 2014
 Economic Outlook: Global and India Ajit Ranade IEEMA T & D Conclave December 12, 2014 Global scenario US expected to drive global growth in 2015 Difference from % YoY Growth October Actual October Projections
JSW Energy Limited. Q2 FY 2016 Results Presentation October 28, 2015
 JSW Energy Limited Q2 FY 2016 Results Presentation October 28, 2015 Agenda Business Environment Operational and Financial Performance Status updates 2 Capacity profile and PLF s Sector-wise Installed Capacity
ThyssenKrupp Steel, London, August ThyssenKrupp Steel
 , London, August 2008 0 , London, August 2008 28 Disclaimer The information set forth and included in this presentation is not provided in connection with an offer or solicitation for the purchase or sale
Solidly on track in achieving our targets
 Solidly on track in achieving our targets Roeland Baan, CEO Credit Suisse Steel & Mining Conference September 12, 2017 Disclaimer This presentation contains, or may be deemed to contain, statements that
First quarter 2009 Media Presentation. 29th April 2009
 First quarter 2009 Media Presentation 29th April 2009 Disclaimer Forward-Looking Statements This document may contain forward-looking information and statements about ArcelorMittal and its subsidiaries.
Third quarter October 28, 2009
 Third quarter 2009 October 28, 2009 Disclaimer Forward-Looking Statements This document may contain forward-looking information and statements about ArcelorMittal and its subsidiaries. These statements
Steel Indexing & Price Transparency
 ISRI Convention & Expo Indexing & Price Transparency Patrick A. McCormick Managing Partner April 20, 2007 1 Price Indexing & Price Transparency New Tools for A New World Economy High Rates of Demand Growth
Results for Quarter III FY
 Results for Quarter III FY 2012-13 Copyright 2012 Tata Consultancy Services Limited 1 Disclaimer Certain statements in this release concerning our future prospects are forward-looking statements. Forward-looking
JSW Steel (JINVIJ) 1176
 1176") Result Update Rating matrix Rating : Hold Target : 1250 Target Period : 12 months Potential Upside : 6% What s Changed? Target Changed from 1225 to 1250 EPS FY15E Changed from 105.5 to 118.3 EPS FY16E
Result Update Rating matrix Rating : Hold Target : 1250 Target Period : 12 months Potential Upside : 6% What s Changed? Target Changed from 1225 to 1250 EPS FY15E Changed from 105.5 to 118.3 EPS FY16E
Firstsource Solutions Limited Q4 and FY2018 Earnings Update
 Firstsource Solutions Limited Q4 and FY2018 Earnings Update May 07, 2018 Proprietary Notice: This document contains proprietary and confidential statement information of Firstsource. No part of this document
Cement and Clinker Price Markers: Med Basin, Persian
 Cement and Clinker Price Markers: Med Basin, Persian Webinar presentation Gulf-Arabian Sea and East Africa Cement & Clinker prices 2Q2017: Price Assessment and Trade Price Update July 13, 2017 CW Group
PRESS RELEASE FINANCIAL RESULTS FOR Q4 & FULL YEAR 14-15
 PRESS RELEASE FINANCIAL RESULTS FOR Q4 & FULL YEAR 14-15 NAVIGATING THROUGH CHALLENGING TIMES JSPL Standalone Performance: Crude Steel Production: 0.81 million tonnes Steel Sales: 0.79 million tonnes Gross
Metals Monthly. Declining Chinese steel exports to augur well. Monthly Update. ICICI Securities Ltd Retail Equity Research.
 Monthly Update Sectoral View Equal Weight Index Performance Return % 1M 3M 6M 12M BSE Metals 0 5 9 33 BSE 2 6 19 17 NSE 2 7 21 17 Source: Reuters, ICICIdirect.com Research Coverage Performance Return (%)
Near-term pressure, but long-term outlook positive
 INDUSTRY IT CMP (as on 2 Nov 2015) Rs 1,812 Target Price Rs 2,050 Nifty 8,051 Sensex 26,559 KEY STOCK DATA Bloomberg ECLX IN No. of Shares (mn) 30 MCap (Rs bn) / ($ mn) 55/843 6m avg traded value (Rs mn)