Analyst Meet Presentation Q4 FY10
|
|
|
- Augustus McCoy
- 5 years ago
- Views:
Transcription

1 Analyst Meet Presentation Q4 FY10
2 Agenda Economic Scenario Steel Scenario Operating Highlights Project Progress Financial Performance 2
3 Improving Global Outlook Centre depicts zero and periphery depicts ten on scale of zero to ten Note: Closer to center signifies less risk, tighter monetary and financial conditions, or reduced risk appetite. GFSR : Global Financial Stability report Source: IMF 3

")


4 Recovery on fast track Real GDP Growth (%) Industrial Production (% y o y) Feb 10 Source: IMF 4


5 Economic indicators on positive trend Employment (% y o y) Headline Inflation (% y o y) Retail sales (% y o y) Source: IMF 5
6 Steel Scenario


 World World ex.")
7 Strong Recovery in Global Crude Steel Production in 1Q CY 2010 with Global steel production approaching 2008 peak % y o y change in Crude Steel Production Jan Mar 09 Vs. Jan Mar 10 Monthly Crude steel Production (MnT) World World ex. China China Source: World steel / Macquarie 7
 Apparent")

8 World Steel Demand rapidly returning to pre crisis level World steel apparent demand (MnT, annualised) Apparent Steel Use (MnT) Steel demand is actually running above early 2008 levels in early 2010 Source: Macquarie/ World steel 8


 CAGR")

9 Strong growth in Steel consumption ahead CAGR 8% CAGR 5% Apparent Steel Use (MnT) CAGR 11% CAGR 6% CAGR 14% Source: World steel 9


10 Chinese production and consumption setting a new high Steel Production Vs. Consumption MnT Chinese net export MnT 24.5% 22.4% Calendar quarter * Crude steel equivalent Source: World steel/ Mysteel.net/ Macquarie 10


11 28.7% India: Strong domestic consumption leading to higher imports of steel Finished Steel Production Vs. Apparent Consumption (MnT) 4.2% 8.1% 23.0% Steel Imports Vs. Exports (MnT) Source: JPC 11


12 Rise in Steel prices in line with hike in Raw material prices 16.5% 15.6% 18.9% 15.8% 30.0% Source: SBB/WSD 12
13 Operating Highlights


14 Production Q4 FY 10 18% 4% YoY % QoQ % 66% 9% YoY % QoQ % Rolled : Flat 255% 36% YoY % QoQ % Crude Steel Rolled : Long All No are in Mn Tonnes 14


15 43% 7% Saleable Steel Sales Q4 FY 10 13% 6% YoY % QoQ % 20% 1% YoY % QoQ % YoY % QoQ % Rolled : Flat 137% 4% YoY % QoQ % Value Added (CR/GI/PPGI) 206% 20% YoY % QoQ % Total Sales All No are in Mn Tonnes Semis Rolled : Long 15
16 Production FY 10 34% YoY % 61% YoY % Rolled : Flat 190% YoY % Crude Steel Rolled : Long All No are in Mn Tonnes 16

 All No are in Mn")
17 Saleable Steel Sales FY 10 28% 198% YoY % YoY % 67% YoY % HR Coils & Plates 130% YoY % Rolled : Long 55% YoY % Total Sales Semis Value Added (CR/GI/PPGI) All No are in Mn Tonnes 17 17
 27% 26% 3.43 67 % 15% 1.")
18 Product Mix Q4 and FY10 Saleable Steel Sales % 1.52 (MnT, % share) 27% 26% % 15% % 31% 19% 8% 36% 9% 47% 50% 38% 16% 22% 10% 17% 18


19 Domestic and Export Mix % share Q4 FY 09 Q4 FY 10 FY 09 FY 10 % share 19


20 Retail Sales (Domestic) JSW Shoppe % Share through JSW Shoppe FY10 (Excl. Semis) (MnT, %Share) No. of Shoppe 84% 16% Sales through JSW Shoppe (In 000 tonnes ) 115% 20
21 Projects Progress


22 New HSM : Phase I commissioned New HSM Phase I commissioned on
23 Project Progress 3.2 MTPA


24 COKE OVEN As on Dec 09 As on Mar 10 Progress till Mar 10 % Progress Civil 64% Structural Fabrication 43% Structural Erection 26% Equipments 8% Technological supplier M/s MECC, China 24


25 SINTER PLANT As on Dec 09 As on Mar 10 Progress till Mar 10 % Progress Civil 78% Structural Fabrication 37% Structural Erection 28% Equipments 5% Technological supplier M/s OUTOTEC, Germany 25


26 STEEL MELTING SHOP As on Dec 09 As on Mar 10 Progress till Mar 10 % Progress Civil 50% Structural Fabrication 83% Structural Erection 67% Equipments 2% Technological supplier M/s SIEMAG, Germany 26


27 BLAST FURNACE As on Dec 09 As on Mar 10 Progress till Mar 10 % Progress Civil 63% Structural Fabrication 42% Structural Erection 19% Technological supplier M/s SEIMENS VAI,UK 27


28 RAW MATERIAL HANDLING SYSTEM As on Dec 09 As on Mar 10 Progress till Mar 10 % Progress Civil 32% Structural Fabrication 13% Structural Erection 4% Technological supplier M/s CSIT, China 28
29 Other Projects


30 New HSM: Phase II Progress till Mar 10 % Progress (Incl. Phase II) Civil 100% Structural Fabrication 89% Structural Erection 86% Equipments 76% Technological supplier M/s Mitsbushi, Hitachi 30


31 BENEFICIATION PLANT As on Dec 09 As on Mar 10 Progress till Mar 10 % Progress Civil 80% Structural Fabrication 90% Structural Erection 72% Equipments 59% Technological supplier M/s CSIT China, M/s SLON China & M/s METSO 31


32 PELLET PLANT As on Dec 09 As As on on Mar Mar Progress till Mar 10 % Progress Civil 16% Structural Fabrication 29% Structural Erection 9% Technological supplier M/s AKER Solutions, USA 32


33 BLOOMING MILL SALEM WORKS Progress till Mar 10 % Progress Civil 96% Structural Fabrication 99% Structural Erection 98% 33
34 Financial Performance
35 Financials Q4 FY 10 Rs. Cr. Q4 FY 10 Q4 FY 09 Growth Net Sales 5,167 3,275 58% EBITDA 1, % EBITDA Margin 27.4% 15.1% Exceptional Items Forex gain/(loss) 18 Less: Interest % Less: Depreciation % Profit Before Tax ,155% Tax % Profit after Tax ,357% Highest ever Profit after Tax 35

 and")
36 EBIDTA Bridge Q4 FY 10 Rs. Cr. * Exceptional item (Forex Gain/loss) and one time/other income 36
37 Financials FY10 Rs. Cr. FY 10 FY 09 Growth Net Sales 18,202 14,001 30% EBITDA 4,806 3,093 55% EBITDA Margin 26.2% 21.8% Exceptional Items Forex gain/(loss) (790) Less: Interest % Less: Depreciation 1, % Profit Before Tax 2, % Tax % Profit after Tax 2, % EPS : Diluted (Rs.) % 37


38 EBIDTA Bridge FY 10 Rs. Cr. * Exceptional items (Forex Gain/loss) and one time/other income 38
39 Operational Performance USA PRODUCTION (NT) Q4 FY 10 Q4 FY 09 Growth (%) FY10 FY09 Growth (%) Plate Mill 69,444 44,061 58% 195, ,691 43% Capacity Utilization 28% 18% 19% 35% Pipe Mill 23,788 9, % 73, ,626 46% Capacity Utilization 17% 7% 13% 25% SALES (NT) Q4 FY 10 Q4 FY 09 Growth (%) FY10 FY09 Growth (%) Plate Mill 42,297 26,986 57% 119, ,861 40% Pipe Mill 25,917 9, % 72, ,608 49% 39
40 Financial Performance USA USD Mio Particulars Q4 FY 10 Q4 FY 09 FY 10 FY 09 Turnover EBITDA + Other Income 2.25 (18.93) (40.92) Write down of inventory (58.35) (58.35) Profit After Tax (12.90) (61.1) (70.03) (36.97) 40
41 Consolidated Financials Q4 FY 10 Q4 FY 10 Q4 FY 09 Growth Total Income 5,481 3,622 51% EBITDA 1, % Exceptional Items Forex gain/(loss) 20 Interest (20%) Depreciation % Profit Before Tax 844 (230) Profit after Tax 611 (40) Rs. Cr. 41
42 Consolidated Financials FY 10 Rs. Cr. FY 10 FY 09 Growth Total Income 19,074 16,105 18% EBITDA 4,607 3,254 42% Exceptional Items Forex gain /(loss) (795) Interest 1,108 1,156 4% Depreciation 1, % Profit Before Tax 2, % Profit after Tax 1, % 42
43 Long term Debt Movement Standalone Rs. Cr. Working Capital loan Rs. 1,086 cr. FD and MF Rs. 162 cr. Cash and Bank Balance Rs. 332 cr. 43


44 Long term Debt Movement Consolidated Rs. Cr. Working Capital loan Rs. 1,868 cr. FD and MF Rs. 169 cr. Cash and Bank Balance Rs. 348 cr. 44
45 Ratios Q4 FY10 Q4 FY09 FY10 FY09 EBITDA Margin 27.3% 14.7% 26.2% 21.8% PAT Margin 13.7% 1.4% 11.0% 3.2% Diluted EPS (Rs.) 37.75* 2.13* ROCE 19.55% 5.30% 16.68% 12.20% Net L.T. Debt/ Equity (x) Net L.T. Debt/ EBITDA (x) Net L.T. Debt/ Equity Consolidated (x) Net L.T. Debt/ EBITDA Consolidated (x) Market Capitalisation (Rs. Cr.) 23,117 4,337 * Not Annualised 45
46 Guidance


47 Guidance for FY11 Production MnT 17% Saleable Steel Sales MnT 18% Saleable Steel Product wise 31% MnT 80% 106% 47
48 M & A
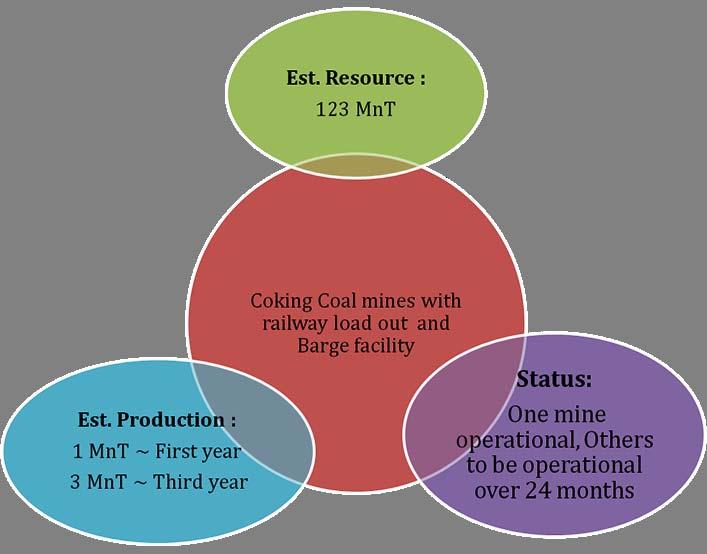

49 Acquisition of Coking Coal Mines in USA 49

50 Q & A 50
51 Forward Looking and Cautionary Statement Certain statements in this report concerning our future growth prospects are forward looking statements, which involve a number of risks, and uncertainties that could cause actual results to differ materially from those in such forward looking statements. The risk and uncertainties relating to these statements include, but are not limited to risks and uncertainties regarding fluctuations in earnings, our ability to manage growth, intense competition within Steel industry including those factors which may affect our cost advantage, wage increases in India, our ability to attract and retain highly skilled professionals, time and cost overruns on fixed price, fixed time frame contracts, our ability to commission mines within contemplated time and costs, our ability to raise the finance within time and cost client concentration, restrictions on immigration, our ability to manage our internal operations, reduced demand for steel, our ability to successfully complete and integrate potential acquisitions, liability for damages on our service contracts, the success of the companies in which the Company has made strategic investments, withdrawal of fiscal/governmental incentives, impact of regulatory measures, political instability, legal restrictions on raising capital or acquiring companies outside India, unauthorized use of our intellectual property and general economic conditions affecting our industry. The company does not undertake to update any forward looking statements that may be made from time to time by or on behalf of the company.
Analyst Meet Presentation Q2 FY11. Analyst Meet Presentation Q2 FY11
 Analyst Meet Presentation Q2 FY11 Analyst Meet Presentation Q2 FY11 Agenda Key Developments Economic and Steel Scenario Performance Highlights Projects Update 2 Key Developments Highest ever quarterly
Analyst Meet Presentation Standalone Financial Results, Quarter Ended 30 Sep 2011
 Analyst Meet Presentation Standalone Financial Results, Quarter Ended 30 Sep 2011 Agenda Business Environment Key Developments Performance Overview Projects Update Guidance Update 2 Global economy Recovery
2QFY14 Results Presentation
 2QFY14 Results Presentation 1 Key highlights 3QFY14 Standalone performance Consolidated performance Key update Highest ever Crude Steel production: 3.19 million tonnes Gross Turnover: `12,651 crores Net
1QFY14 Results Presentation
 1QFY14 Results Presentation 1 Key highlights 1QFY14 Standalone performance Consolidated performance JSW Steel JSW Ispat merger update Highest ever Crude Steel production: 2.86 million tonnes Saleable Steel
JSW Steel Limited Q2 FY Results Presentation October 31, 2017
 JSW Steel Limited Q2 FY 2017-18 Results Presentation October 31, 2017 Key highlights Q2 FY18 Standalone performance Crude Steel production: 3.94 million tonnes Saleable Steel sales: 3.92 million tonnes
JSW reports flat sales in Q3 FY
 Press Release 28.01.2009 JSW reports flat sales in Q3 FY 2008-09 JSW reported flat sales in the 3rd quarter when the world steel demand and prices fell significantly mainly due to change in the product
Agenda. Overview. Key Highlights. Performance Review. Projects Update and Guidance. Steel Scenario
 May 2011 Agenda Overview Key Highlights Performance Review Projects Update and Guidance Steel Scenario 2 JSW Group Overview A USD 7 billion group with diversified interests in Steel, Energy, Minerals and
JSW Steel Limited Q1 FY Results Presentation July 25, Better Everyday
 JSW Steel Limited Q1 FY 2018-19 Results Presentation July 25, 2018 Better Everyday 1 Key highlights Q1 FY19 Standalone performance Crude Steel production: 4.11 million tonnes, up by 5% YoY Saleable Steel
JSW Steel Limited 2QFY16 Results Presentation October 21, 2015
 JSW Steel Limited 2QFY16 Results Presentation October 21, 2015 Key highlights 2QFY16 Standalone performance Highest ever quarterly Saleable Steel sales: 3.19 million tonnes Crude Steel production: 3.25
O.P. Jindal Group and JSW Group Overview
 July 01, 20091 Group Overview 2 O.P. Jindal Group and JSW Group Overview P R Jindal Sajjan Jindal Ratan Jindal Naveen Jindal Jindal Saw Jindal Stainless Jindal Steel & Power Ltd. Power Steel Infrastructure
JSW Steel post 17% higher EBIDTA at `4,501 crores
 Press Release February 06, 2019 JSW Steel post 17% higher EBIDTA at `4,501 crores Mumbai, India: JSW Steel Limited ( JSW Steel or the Company ) today reported its results for the third quarter and the
JSW Steel Limited Q2 FY Results Presentation October 25, Better Everyday
 JSW Steel Limited Q2 FY 2018-19 Results Presentation October 25, 2018 Better Everyday 1 Key highlights Q2 FY19 Standalone performance Crude Steel production: 4.18 million tonnes, up by 6% YoY Saleable
JSW Steel Limited 1QFY18 Results Presentation August 01, 2017
 JSW Steel Limited 1QFY18 Results Presentation August 01, 2017 Key highlights 1QFY18 Standalone performance Crude Steel production: 3.91 million tonnes Steel sales: 3.51 million tonnes Quarterly EBITDA
PRESS RELEASE FINANCIAL RESULTS FOR FOURTH QUARTER & FULL YEAR FY
 PRESS RELEASE FINANCIAL RESULTS FOR FOURTH QUARTER & FULL YEAR FY2016-17 JSPL achieves several firsts & new highs in Q4 Sinter plant & Coke Oven batteries of 4MT expansion of Angul Steel Plant commissioned
SECTOR UPDATE KEY HIGHLIGHTS: FY 2011 FINANCIAL RESULTS SITE PHOTOGRAPHS
 FY 2011 SECTOR UPDATE KEY HIGHLIGHTS: FY 2011 FINANCIAL RESULTS PROJECT UPDATE STRATEGIC PRIORITIES SITE PHOTOGRAPHS 2 Capacity Build up (GW) Peak Demand/Supply (GW) FY 2011 India: World s 6 th largest
Key Highlights. YoY (% change) Q1FY10. QoQ % Particulars 2Q FY10 2Q FY09 Realizations per tone 31,899 53,436-40% 30,462 5% Source: Company
 Q1FY10. QoQ % Particulars 2Q FY10 2Q FY09 Realizations per tone 31,899 53,436-40% 30,462 5% Source: Company") 29th October, 2009 Key Data INR CMP 743 Target Price 646 Earlier target price 481 Bloomberg Code JSTL IN Reuters Code JSTL.BO BSE Code 500228 NSE Code JSWSTEEL Face Value (INR) 10 Market Cap (INR bn) 142
29th October, 2009 Key Data INR CMP 743 Target Price 646 Earlier target price 481 Bloomberg Code JSTL IN Reuters Code JSTL.BO BSE Code 500228 NSE Code JSWSTEEL Face Value (INR) 10 Market Cap (INR bn) 142
Investor Update Q July 2017
 Investor Update Q2 2017 31 July 2017 Hexaware Technologies. All rights reserved. www.hexaware.com Safe Harbor Statement Certain statements on this presentation concerning our future growth prospects are
Valuation & Recommendation. planning to increase its capacity from the current 6.8mtpa to
 Recommendation SUBSCRIBE Investment rationale: Issue Price Rs. 594 610 Expansion Projects to enhance Capacity: Tata Steel is planning to increase its capacity from the current 6.8mtpa to Bidding Date 19
Q2 FY2014 Earnings Presentation November 8, 2013
 Q2 FY2014 Earnings Presentation November 8, 2013 Important Notice Forward Looking Statements This presentation contains statements that contain forward looking statements including, but without limitation,
4Q2010 Conference Call Gerdau S.A. Consolidated IFRS
 4Q2010 Conference Call Gerdau S.A. Consolidated IFRS André Gerdau Johannpeter President and CEO Osvaldo B. Schirmer Vice-President and IRO March 3, 2011 1 Global Context 2010 vs. 2009 Growth of 15% in
PRESS RELEASE FINANCIAL RESULTS FOR THIRD QUARTER & NINE MONTHS FY
 PRESS RELEASE FINANCIAL RESULTS FOR THIRD QUARTER & NINE MONTHS FY 2017-18 Volume & Operating Profit Ramp up Continues Consolidated Revenues up 21% YoY Consolidated EBITDA up 26% YoY JPL EBITDA up 18%
Q4 FY 17. Industry Update & Key Performance Highlights. 23 rd May, 2017
 Q4 FY 17 Industry Update & Key Performance Highlights 23 rd May, 2017 DISCLAIMER This presentation may contain certain forward looking statements concerning JSPL s future business prospects and business
Forward looking and cautionary statement
 Merger Presentation September 2012 1 Forward looking and cautionary statement The views expressed here may contain information derived from publicly available sources that have not been independently verified.
PRESS RELEASE FINANCIAL RESULTS FOR FIRST QUARTER - FY16. Enhanced capacities Pushing up Production & Sales Volumes
 PRESS RELEASE FINANCIAL RESULTS FOR FIRST QUARTER - FY16 Enhanced capacities Pushing up Production & Sales Volumes JSPL Standalone 1QFY16 Performance : Crude Steel Production: 0.86 million tonnes Steel
Q1 FY2014 Earnings Presentation 05 August 2013
 Q1 FY2014 Earnings Presentation 05 August 2013 Important Notice Forward Looking Statements This presentation contains statements that contain forward looking statements including, but without limitation,
Tata Steel NEUTRAL. Performance Highlights CMP. `226 Target Price - 2QFY2016 Result Update Steel. Investment Period - 3-year price chart
 2QFY2016 Result Update Steel November 6, 2015 Tata Steel Performance Highlights Standalone (` cr) 2QFY16 2QFY15 yoy % 1QFY16 qoq % Net revenue 9,531 10,785 (11.6) 9,094 4.8 EBITDA 1,862 3,094 (39.8) 1,689
Investor Update Q3 2015
 Passionate Employees Investor Update Innovative Services Delighted Customers Q3 2015 4 November 2015 Hexaware Technologies. All rights reserved. www.hexaware.com Safe Harbor Statement Certain statements
Press Release Q October 26, 2013 JSW ENERGY LTD
 Press Release Q2 2013-14 October 26, 2013 JSW ENERGY LTD The Board of JSW Energy Ltd., at its meeting held today at Mumbai, approved the results for the quarter ended September 30, 2013. Key highlights
ThyssenKrupp Steel, London, August ThyssenKrupp Steel
 , London, August 2008 0 , London, August 2008 28 Disclaimer The information set forth and included in this presentation is not provided in connection with an offer or solicitation for the purchase or sale
NSE: GRAPHITE, BSE: Q1 FY2019 Earnings Presentation August 6 th, 2018
 NSE: GRAPHITE, BSE: 509488 Q1 FY2019 Earnings Presentation August 6 th, 2018 Discussion Agenda Executive Summary 3 Chairman s Message 4 Steel Industry Overview 5-6 Graphite Electrode Industry Overview
Jindal Steel & Power BUY. CMP Target Price `200 `320. 1QFY2019 Result Update Steel & Power. Performance Update
 Aug-15 Nov-15 Feb-16 May-16 Aug-16 Nov-16 Feb-17 May-17 Aug-17 Nov-17 Feb-18 May-18 Aug-18 1QFY2019 Result Update Steel & Power August 14, 2018 Jindal Steel & Power Performance Update INR Cr. Q1FY19 Q1FY18
PRESS RELEASE FINANCIAL RESULTS FOR Q4 & FULL YEAR 14-15
 PRESS RELEASE FINANCIAL RESULTS FOR Q4 & FULL YEAR 14-15 NAVIGATING THROUGH CHALLENGING TIMES JSPL Standalone Performance: Crude Steel Production: 0.81 million tonnes Steel Sales: 0.79 million tonnes Gross
India Growth Story. Steel Market Asia Conference Ashok Bhardwaj. 19 th -20 th November Intercontinental Grand Stanford - Hong Kong
 India Growth Story Steel Market Asia Conference 2012 19 th -20 th November - 2012 Intercontinental Grand Stanford - Hong Kong Ashok Bhardwaj (Director - Marketing) JSW Steel Limited India Urbanization
PRESS RELEASE FINANCIAL RESULTS FOR FOURTH QUARTER & FULL YEAR FY
 PRESS RELEASE FINANCIAL RESULTS FOR FOURTH QUARTER & FULL YEAR FY 2017-18 JSPL back in Profits ; The Journey has just begun FY18 Revenue Highest Ever 4QFY18 Consolidated Revenues up 27% YoY 4QFY18 Consolidated
Charts on the 1st Quarter , February 13, ThyssenKrupp
 Charts on the 1st Quarter 2006-2007, February 13, 2007 0 Charts on the 1st Quarter 2006-2007, February 13, 2007 1 Q1 2006/2007 Overview Excellent start to fiscal year 2006/2007 Order intake: 13.3 billion,
Company Overview. Performance Highlights. Major Developments. Status of Projects
 FY 2011 Power Drivers Company Overview Performance Highlights Major Developments Status of Projects Way Forward 2 3 Share of World Population Share of World Energy Consumption India makes up 17% of the
Results Presentation Financial quarter ended June 30, 2018 August 13, 2018
 Results Presentation Financial quarter ended June 30, 2018 August 13, 2018 1 Safe harbor statement Statements in this presentation describing the Company s performance may be forward looking statements
Energy Q1 FY 2012 Lighting up the Future 1
 Energy Q1 FY 2012 Lighting up the Future 1 SECTOR UPDATE KEY HIGHLIGHTS FINANCIAL RESULTS PROJECT UPDATE STRATEGIC PRIORITIES SITE PHOTOGRAPHS 2 Capacity Build up (GW) Peak Demand/Supply (GW) Q1 FY 12
Investor Update Q3 2018
 Investor Update Q3 2018 24 th October 2018 Hexaware Technologies. All rights reserved. www.hexaware.com Safe Harbor Statement Certain statements on this presentation concerning our future growth prospects
Hindalco Industries Limited. Q2 FY19 Earnings Presentation 02 nd November, 2018
 Hindalco Industries Limited Q2 FY19 Earnings Presentation 02 nd November, 2018 SAFE HARBOUR Certain statements in this report may be forward looking statements within the meaning of applicable securities
Financial results for the year ended December 2013
 Financial results for the year ended December 2013 Agenda OVERVIEW Results overview and recent developments Results analysis Steel market overview Operating results Finance Other key issues and outlook
Annual Financial Results. for the twelve months ended 31 December 2009
 Annual Financial Results for the twelve months ended 31 December 2009 1 Introduction and overview Nonkululeko Nyembezi-Heita, CEO 2 Overview (2009 vs 2008) Headline loss of R440m Headline loss per share
Tata Steel Reports Consolidated Financial Results for the Quarter and year ended March 31, 2018
 Mumbai, May 16, 2018 For immediate use Tata Steel Reports Consolidated Financial Results for the Quarter and year ended March 31, 2018 Highlights: Health and Safety: LTIFR rate of 0.46 in FY18 compared
For the year ended 31 December 2014 Final Results Presentation. Stock : 697
 For the year ended 31 December 2014 Final Results Presentation Stock : 697 Content Company Overview Industry Overview Financial Highlights Operation Review 1 Company overview Listed in Hong Kong since
1. Executive Summary Chairman s Message Steel Industry Overview Standalone Financial Performance 7
 Table of Contents 1. Executive Summary 3 2. Chairman s Message 4 3. Steel Industry Overview 5 4. Standalone Financial Performance 7 5. Quarterly Performance Trends 10 6. Graphite India: At a Glance 12
Investor Update Q1 2018
 Investor Update Q1 2018 3 rd May 2018 Hexaware Technologies. All rights reserved. www.hexaware.com Safe Harbor Statement Certain statements on this presentation concerning our future growth prospects are
1. Executive Summary Chairman s Message Steel Industry Overview Steel Industry Outlook Standalone Financial Performance 7
 Table of Contents 1. Executive Summary 3 2. Chairman s Message 4 3. Steel Industry Overview 5 4. Steel Industry Outlook 6 5. Standalone Financial Performance 7 6. Quarterly Performance Trends 12 7. Graphite
Steel Authority of India
 BSE SENSEX S&P CNX 16,439 4,990 4QFY12 Results Update Sector: Metals Steel Authority of India CMP: INR93 TP: INR99 Sell Bloomberg SAIL IN Equity Shares (m) 4,130.4 52-Week Range (INR) 151/73 1,6,12 Rel.
Hindalco. Investor Presentation Q4 FY17 Mumbai, May 30, Excellence by Design
 Hindalco Investor Presentation Q4 FY17 Mumbai, May 30, 2017 Forward Looking & Cautionary Statement Certain statements in this report may be forward looking statements within the meaning of applicable securities
IFGL Refractories Limited (Formerly IFGL Exports Limited) Investor Presentation August 2018
 Investor Presentation August 2018") IFGL Refractories Limited (Formerly IFGL Exports Limited) Investor Presentation August 2018 Safe Harbor This presentation and the accompanying slides (the Presentation ), has been prepared by IFGL Refractories
IFGL Refractories Limited (Formerly IFGL Exports Limited) Investor Presentation August 2018 Safe Harbor This presentation and the accompanying slides (the Presentation ), has been prepared by IFGL Refractories
1. Executive Summary Chairman s Message Steel Industry Overview Standalone Financial Performance 7
 Table of Contents 1. Executive Summary 3 2. Chairman s Message 4 3. Steel Industry Overview 5 4. Standalone Financial Performance 7 5. Consolidated Financial Performance 12 6. Segment Performance 13 7.
Investor Presentation. November 2012
 Investor Presentation November 2012 Safe Harbor This presentation and the accompanying slides (the Presentation ), which have been prepared by Balkrishna Industries Limited (the Company ), have been prepared
For the six months ended 30 June 2015 Interim Results Presentation. Stock : 697
 For the six months ended 30 June 2015 Interim Results Presentation Stock : 697 Content Company Overview Industry Overview Financial Highlights Operation Review 1 Company overview Listed in Hong Kong since
Graphite India BUY. Performance Highlights CMP. `93 Target Price `124. 4QFY2012 Result Update Capital Goods. Investment Period 12 Months
 4QFY2012 Result Update Capital Goods May 11, 2012 Graphite India Performance Highlights Y/E March (` cr) 4QFY2012 3QFY2012 % chg (qoq) 4QFY2011 % chg (yoy) Net sales 452 437 3.5 304 48.6 EBITDA 83 90 (7.7)
Q2 FY 19. Industry Update & Key Performance Highlights. 13 th November, 2018
 Q2 FY 19 Industry Update & Key Performance Highlights 13 th November, 2018 This presentation may contain certain forward looking statements concerning JSPL s future business prospects and business profitability,
FISCAL YEAR 2004/05. Investor Relations June
 FISCAL YEAR 2004/05 Investor Relations June 2005 www.voestalpine.com HIGHLIGHTS 2004/05 All-time high sales of 5.8 bn and EBIT of 553 (continued operations) Not included: 50 one-off-costs liquidation Matzner
Sesa Goa NEUTRAL. Performance Highlights CMP. `372 Target Price - 2QFY2011 Result Update Mining. Investment Period -
 2QFY211 Result Update Mining October 18, 21 Sesa Goa Performance Highlights Particulars (` cr) 2QFY211 2QFY21 % chg (yoy) 1QFY211 % chg (qoq) Net sales 918 539 7.5 2,413 (61.9) EBITDA 34 153 122.5 1,46
Erdemir Group 2009 Consolidated Financial Results
 Erdemir Group 2009 Consolidated Financial Results 22 February 2010 1 /28 DISCLAIMER Ereğli Demir Çelik Fabrikaları T.A.Ş. (Erdemir) may, when necessary, make written or verbal announcements about forward-looking
National Fittings Limited
 National Fittings Limited Date: 13 th January, 2016 Stock Performance Details Shareholding Details September 2015 Current Price : ` 100.5^ Face Value : ` 10 per share 52 wk High / Low : ` 107.9 / 57.0
Phillips Carbon Black Ltd
 4 Recommendation BOOK PROFITS Pain not yet over CMP (09/02/2015)* Rs. 131 Phillips Carbon Black (PCB) reported results in line with expectations; with EBITDA margins at 10.0% vs 9.3% in Q2FY15. The company
Highlights of Financial Performance
 Highlights of Financial Performance M. D. Ranganath Chief Financial Officer Safe Harbor Certain statements in this presentation concerning our future growth prospects are forward-looking statements regarding
KEI Industries BUY. Performance Update. Target Price. 3QFY2018 Result Update Cable. Historical share price chart. Key Financials
 3QFY2018 Result Update Cable January 25, 2018 KEI Industries Performance Update Y/E March (` cr) 3QFY18 3QFY17 % yoy 2QFY18 % qoq Net sales 889 715 24 749 19 EBITDA 84 77 10 76 11 EBITDA margin (%) 9.5
Graphite India BUY. Performance Highlights. CMP Target Price `88 `109. 1QFY2012 Result Update Capital Goods
 1QFY2012 Result Update Capital Goods July 25, 2011 Graphite India Performance Highlights Y/E March (` cr) 1QFY2012 4QFY2011 % chg (qoq) 1QFY2011 % chg (yoy) Net sales 319 303 5.1 258 23.3 EBITDA 61 59
Press Release Q JSW ENERGY LTD
 Press Release Q1 12-13 20.07.2012 JSW ENERGY LTD The Board of JSW Energy Ltd., at its meeting held today at Mumbai, approved the Results for the quarter ended June 30, 2012. Key highlights for Q1 FY 13
Press Release Q JSW ENERGY LTD
 Press Release Q3 12-13 23.01.2013 JSW ENERGY LTD The Board of JSW Energy Ltd., at its meeting held today at Mumbai, approved the results for the quarter and nine months ended December 31, 2012. Key highlights
Safe harbor. Copyright 2011 Infosys Technologies Limited
 Safe harbor Certain statements made here concerning Infosys future growth prospects are forward-looking statements which involve a number of risks and uncertainties that could cause actual results to differ
Investor Update Q4 2017
 Investor Update Q4 2017 7 th February 2017 Hexaware Technologies. All rights reserved. www.hexaware.com Safe Harbor Statement Certain statements on this presentation concerning our future growth prospects
Sanjay Jain Pavas Pethia
 BSE Sensex S&P CNX 19,561 5,923 Bloomberg SAIL IN Equity Shares (m) 4,130.4 M.Cap. (INR b)/(usd b) 334.6/6.2 52-Week Range (INR) 116/76 1,6,12 Rel. Perf. (%) -11/-17/-38 Financials & Valuation (INR b)
Months Consolidated Results. 28 April 2015
 1 28.04.2015 2015 3 Months Consolidated Results 28 April 2015 2 28.04.2015 DISCLAMIER Ereğli Demir Çelik Fabrikaları T.A.Ş. (Erdemir) may, when necessary, make written or verbal announcements about forward-looking
production (a return to Q1FY11 production level of 120ktons meeting ( ) E mail:
 E mail:") Recommendation BUY Investment Rationale CMP (23/12/2010) Sector Stock Details BSE Code NSE Code Market Cap (Rs. cr) Free Float (%) 52 wk HI/Lo Avg. volume BSE (Monthly) Dividend Shares o/s (Crs) Rs.70
Recommendation BUY Investment Rationale CMP (23/12/2010) Sector Stock Details BSE Code NSE Code Market Cap (Rs. cr) Free Float (%) 52 wk HI/Lo Avg. volume BSE (Monthly) Dividend Shares o/s (Crs) Rs.70
Note: *HRC Rolling Margin = HRC Spread/average selling price, **Net Debt = Interest Bearing Debt Cash and cash equivalents
 Management s Discussion and Analysis (MD&A) Sahaviriya Steel Industries Public Company Limited, its Subsidiaries and Jointly- Controlled Entities For the Third Quarter of 2012 1. Third Quarter of 2012
1. Executive Summary Chairman s Message Steel Industry Overview Steel Industry Outlook Standalone Financial Performance 7
 Table of Contents 1. Executive Summary 3 2. Chairman s Message 4 3. Steel Industry Overview 5 4. Steel Industry Outlook 6 5. Standalone Financial Performance 7 6. Quarterly Performance Trends 12 7. Graphite
JSW Energy Limited Acquisition of 1,000 MW Tamnar Power Plant
 JSW Energy Limited Acquisition of 1,000 MW Tamnar Power Plant May 04, 2016 Agenda Acquisition Rationale Target Overview Acquisition Overview 2 Acquisition Rationale for JSWEL Enhances Operational Capacity
Q4 FY16 RESULTS UPDATE
 Q4 FY16 RESULTS UPDATE DISCLAIMER Except for the historical information contained here in, statements in this presentation and the subsequent discussions, which include words or phrases such as will, aim,
Investor Presentation
 March, 2010 1 Disclaimer This document can contain statements which constitute forward-looking statements. Such forward-looking statements are dependent on estimates, data or methods that may be incorrect
Godawari Power & Ispat
 BSE SENSEX S&P CNX CMP: INR103 TP: INR185 Buy 17,077 5,158 Bloomberg GODPI IN Equity Shares (m) 31.8 52-Week Range (INR) 200/70 1,6,12 Rel. Perf. (%) 32/-31/-33 M.Cap. (INR b) 3.3 M.Cap. (USD m) 65.3 Consolidated
Second Quarter 2018 Results
 Second Quarter 2018 Results Forward Looking Statements 2 This presentation contains statements that we believe are forward looking statements within the meaning of the Private Securities Litigation Reform
Investor Presentation. Heavy plate rolling mill starts operating in July at the Ouro Branco mill (MG)
") Investor Presentation Heavy plate rolling mill starts operating in July at the Ouro Branco mill (MG) Agenda Outlook Gerdau Highlights 2 Economic Outlook GDP Growth 2014 2015f 2016f World 3.4% 3.1% 3.4%
Investor Presentation Heavy plate rolling mill starts operating in July at the Ouro Branco mill (MG) Agenda Outlook Gerdau Highlights 2 Economic Outlook GDP Growth 2014 2015f 2016f World 3.4% 3.1% 3.4%
ACC NEUTRAL. Performance Highlights. CMP `1,261 Target Price - 4QCY2012 Result Update Cement. Quarterly results (Standalone) Investment Period -
 Investment Period -") 4QCY2012 Result Update Cement February 11, 2013 ACC Performance Highlights Quarterly results (Standalone) Y/E Dec. (` cr) 4QCY2012 3QCY2012 % chg qoq 4QCY2011 % chg yoy Net sales 3,099 2,445 26.8 2,503
4QCY2012 Result Update Cement February 11, 2013 ACC Performance Highlights Quarterly results (Standalone) Y/E Dec. (` cr) 4QCY2012 3QCY2012 % chg qoq 4QCY2011 % chg yoy Net sales 3,099 2,445 26.8 2,503
IFGL Refractories Limited (Formerly IFGL Exports Limited) Investor Presentation February 2018
 Investor Presentation February 2018") IFGL Refractories Limited (Formerly IFGL Exports Limited) Investor Presentation February 2018 Safe Harbor This presentation and the accompanying slides (the Presentation ), has been prepared by IFGL Refractories
IFGL Refractories Limited (Formerly IFGL Exports Limited) Investor Presentation February 2018 Safe Harbor This presentation and the accompanying slides (the Presentation ), has been prepared by IFGL Refractories
Amara Raja Batteries BUY. Performance Highlights. CMP `1,010 Target Price `1,167. 2QFY2017 Result Update Auto Ancillary. 3-year price chart
 2QFY217 Result Update Auto Ancillary November 8, 216 Amara Raja Batteries Performance Highlights BUY CMP `1,1 Target Price `1,167 Y/E March (` cr) 3QFY16 3QFY15 % chg (yoy) 2QFY16 % chg (qoq) Net Sales
Phillips Carbon Black Ltd
 4 Recommendation BUY Snail Pace Recovery CMP (06/02/2013) Rs. 85 Target Price Rs. 110 Sector Stock Details Carbon Black BSE Code 506590 NSE Code Bloomberg Code PHILIPCARB PHCB IN Market Cap (Rs crs) 293
GUJARAT NRE SAILING AHEAD AMID TURBULENT TIMES
 GUJARAT NRE SAILING AHEAD AMID TURBULENT TIMES Steel Development Pattern around the globe India s long term steel development pattern is similar to most countries, following the same pattern of more than
KEI Industries BUY. Performance Update. CMP Target Price `433 `508. 4QFY2018 Result Update Cable. Historical share price chart.
 May- Aug- Oct-15 Jan-16 Apr-16 Jul-16 Oct-16 Jan-17 Apr-17 Jul-17 Oct-17 Jan-18 Apr-18 4QFY2018 Result Update Cable May 21, 2018 KEI Industries Performance Update Y/E March (` cr) 4QFY18 4QFY17 % yoy 3QFY18
Hero MotoCorp ACCUMULATE. Performance Highlights. CMP `3,226 Target Price `3,466. 3QFY2017 Result Update Automobile. 3-year price chart
 3QFY2017 Result Update Automobile February 14, 2017 Hero MotoCorp Performance Highlights ACCUMULATE CMP `3,226 Target Price `3,466 Y/E March (` cr) 2QFY17 2QFY16 % chg (yoy) 1QFY17 % chg (qoq) Investment
Equity Research PT Krakatau Steel (Persero)Tbk
Tbk") 20-Jan-17 20-Feb-17 20-Mar-17 20-Apr-17 20-May-17 20-Jun-17 20-Jul-17 20-Aug-17 20-Sep-17 20-Oct-17 20-Nov-17 20-Dec-17 Equity Research PT Krakatau Steel (Persero)Tbk 26 January 2018 Integrated Steel industry,
20-Jan-17 20-Feb-17 20-Mar-17 20-Apr-17 20-May-17 20-Jun-17 20-Jul-17 20-Aug-17 20-Sep-17 20-Oct-17 20-Nov-17 20-Dec-17 Equity Research PT Krakatau Steel (Persero)Tbk 26 January 2018 Integrated Steel industry,
Ambuja Cements NEUTRAL. Performance Highlights CMP. `184 Target Price - 2QCY2012 Result Update Cement. Quarterly results (Standalone)
") 2QCY2012 Result Update Cement Ambuja Cements Performance Highlights Quarterly results (Standalone) Y/E Dec. (` cr) 2QCY2012 1QCY2012 % chg qoq 2QCY2011 % chg yoy Net Sales 2,566 2,633 (2.6) 2,173 18.1
2QCY2012 Result Update Cement Ambuja Cements Performance Highlights Quarterly results (Standalone) Y/E Dec. (` cr) 2QCY2012 1QCY2012 % chg qoq 2QCY2011 % chg yoy Net Sales 2,566 2,633 (2.6) 2,173 18.1
AUDITED RESULTS FOR THE YEAR ENDED 31 DECEMBER 2016
 AUDITED RESULTS FOR THE YEAR ENDED 31 DECEMBER 2016 AGENDA 2 1 Opening remarks / market update 2 Financial results 3 Operational review 4 Strategy update 5 Outlook 1 2 3 4 5 OPENING REMARKS / MARKET UPDATE
Months Consolidated Results. 25 April 2016
 1 25.04.2016 2016 3 Months Consolidated Results 25 April 2016 2 25.04.2016 DISCLAMIER Ereğli Demir Çelik Fabrikaları T.A.Ş. (Erdemir) may, when necessary, make written or verbal announcements about forward-looking
Coal India ACCUMULATE. Performance Highlights CMP. `338 Target Price `380. Outlook and valuation. 2QFY2016 Result Update Mining
 Coal India Performance Highlights (` cr) % yoy % qoq Net Sales 16,958 15,678 8.2 18,956 (1.5) EBITDA 3,8 2,556 17.7 4,944 (39.2) % margin 17.2 15.8 139bp 25.3 (813bp) Net Profit 2,519 2,188 15.2 3,787
Highlights of Financial and Operational performance for the Third Quarter ended 31 st December 2017
 Highlights of Financial and Operational performance for the Third Quarter ended 31 st December 2017 Announcement of unaudited financial results 24th January 2018 Jindal Saw Limited ( JSAW or the Company
Pioneers of laminated tubes in India. Corporate Presentation
 Pioneers of laminated tubes in India Corporate Presentation M17617 Safe Harbour Certain statements in this presentation concerning our future growth prospects are forward-looking statements. The Company
Financial updates. Rajiv Bansal. Chief Financial Officer Infosys Limited
 Financial updates Rajiv Bansal Chief Financial Officer Safe harbor Certain statements in this presentation concerning our future growth prospects are forward-looking statements regarding our future business
IFGL Refractories Limited (Formerly IFGL Exports Limited) Investor Presentation May 2018
 Investor Presentation May 2018") IFGL Refractories Limited (Formerly IFGL Exports Limited) Investor Presentation May 2018 Safe Harbor This presentation and the accompanying slides (the Presentation ), has been prepared by IFGL Refractories
IFGL Refractories Limited (Formerly IFGL Exports Limited) Investor Presentation May 2018 Safe Harbor This presentation and the accompanying slides (the Presentation ), has been prepared by IFGL Refractories
Hyundai Steel (004020)
") Earnings Review February 1, 213 12M rating BUY (Maintain) 12M TP W111, from W111, Hyundai Steel (42) Astonishing earnings in many aspects Above In line Below Up/downside +34% Stock Data KOSPI (Jan 31,
Earnings Review February 1, 213 12M rating BUY (Maintain) 12M TP W111, from W111, Hyundai Steel (42) Astonishing earnings in many aspects Above In line Below Up/downside +34% Stock Data KOSPI (Jan 31,
Ambuja Cements NEUTRAL. Performance Highlights CMP. `155 Target Price - 1QCY2011 Result Update Cement. Investment Period - Key financials (Standalone)
") 1QCY2011 Result Update Cement April 29, 2011 Ambuja Cements Performance Highlights Y/E Dec. (` cr) 1QCY2011 4QCY2010 % chg qoq 1QCY2010 % chg yoy Net sales 2,207 1,788 23.4 1,990 10.9 Operating profit
1QCY2011 Result Update Cement April 29, 2011 Ambuja Cements Performance Highlights Y/E Dec. (` cr) 1QCY2011 4QCY2010 % chg qoq 1QCY2010 % chg yoy Net sales 2,207 1,788 23.4 1,990 10.9 Operating profit
IFRS Financial Statements for Q4 and FY 2014
 214 ACHIEVEMENTS 1 Record > 1.6 bln USD EBITDA MMK MC Dynamics, mln USD 2 577 2 5 2 Net debt down 1 bln USD -2% 2 63 2 3 FCF yield 37% 1 5 4 Lost opportunity of FMG stake sale in early 214 1 5 Social life:
Q1 FY 19. Industry Update & Key Performance Highlights. 9 th August, 2018
 Q1 FY 19 Industry Update & Key Performance Highlights 9 th August, 2018 This presentation may contain certain forward looking statements concerning JSPL s future business prospects and business profitability,
BUY. Efforts on cost cutting paying off RAMCO CEMENTS. Target Price: Rs 435. Key highlights. Key drivers FY15 FY16E FY17E
 RAMCO S BUY Target Price: Rs 435 Efforts on cost cutting paying off Q2 EBITDA at Rs 2.8 bn (up 30% YoY) was ahead of our estimates due to lower-than-expected costs. Average costs (excluding freight) declined
Third-quarter earnings burdened by raw material-related losses. Group adjusted EBITDA at EUR 56 million
 1 (23) Contents Highlights in the third quarter of 2017... 2 Highlights during the first nine months of 2017... 2 Business and financial outlook for the fourth quarter of 2017... 3 CEO Roeland Baan...