Subscribe with Caution to Varroc Engineering Ltd. Strong fundamentals but valuation not supportive
|
|
|
- Rolf McLaughlin
- 5 years ago
- Views:
Transcription

1 Subscribe with Caution to Varroc Engineering Ltd. Strong fundamentals but valuation not supportive
2 Salient features of the IPO: Aurangabad-based auto component maker Varroc Engineering Ltd. (Varroc) is coming with an IPO by offering 20.22mn share between the price range Rs per share. The IPO size is in the range of Rs. 19,514-19,554.4mn. The issue is fully OFS, the company will not receive any proceeds from it. Key competitive strengths: Strong competitive position in attractive growing markets Strong, long-standing customer relationships Comprehensive product portfolio Low cost, strategically located manufacturing and design footprint Robust in-house technology, innovation and R&D capabilities Consistent track record of operational & financial efficiency Risk and concerns: Subdued economic activities Delay in the proposed geographic expansion Poor ramp up in the domestic business Volatility in the currency rates Valuation & recommendation: At the higher price band of Rs. 967 per share, Varroc s share is valued at a P/E multiple of 29x (to its restated FY18 EPS of Rs. 33.4) as compared to the peers average of 23.1x. Below are few key observations of the issue: (For detailed valuation, refer to page 9 & 10 of the report) 23 rd Jun Recommendation Subscribe with Caution Price Band (Rs.) Rs per Share Face Value (Rs.) Rs. 1 Shares for Fresh Issue (mn) Nil Shares for OFS (mn) 20.22mn Shares Fresh Issue Size (Rs. mn) N/A OFS Issue Size (Rs. mn) Rs. 19,514-19,554.4mn Total Issue Size (Rs. mn) Rs. 19,514-19,554.4mn Bidding Date 26 th Jun th Jun MCAP at Higher Price Band Rs. 130,363mn Enterprise Value at Higher Rs. 136,844mn Price Band Kotak Mahindra Capital Company Ltd., Citigroup Global Book Running Lead Markets India Pvt. Ltd., Credit Manager Suisse Securities (India) Pvt. Ltd. and IIFL Holdings Ltd. Registrar Link Intime India Pvt. Ltd. Sector/Industry Auto Parts & Equipment Promoters Mr. Tarang Jain Pre and post - issue shareholding pattern Varroc is the sixth largest manufacturer in the global exterior Pre Issue Post - Issue automotive lighting space with a market share of around 4%. Also it is Promoter and Promoter 86.30% 85.00% among the top three independent exterior lighting players in the Group globe. Being an independent player, the company has the benefit to Public 13.70% 15.00% target any market with its own product technology. Moreover, in the global premium vehicle market, Varroc has a market share of 6%. In Total % % the electric vehicle market, the company has a market share of 20% Retail Application Money at Higher Cut-Off Price per Lot and is one percent point lower than the market leader. Number of Shares per Lot 15 Its global clientele includes marquee auto manufacturers across the Application Money Rs. 14,505 per Lot premium, mid-range and mass market pricing spectrum and includes Ford, Jaguar Land Rover, the Volkswagen Group, Renault-Nissan- Employee Discount Rs. 48 on the Offer Price Mitsubishi, Groupe PSA, FCA etc. Its domestic customers include Bajaj Analyst Auto, Royal Enfield, Yamaha, Suzuki, Honda, Hero, Piaggio etc. Varroc Rajnath Yadav has strong long standing relationship with many of its customers and this can be demonstrated by the fact that since 1990 not a single Research Analyst ( ; Ext: 912) customer has left the company. rajnath.yadav@choiceindia.com Varroc has global manufacturing footprint with 36 manufacturing facilities spread across seven countries. Its manufacturing facilities are located in low cost countries like Mexico, the Czech Republic, China (through JV) and India, which allows it to serve North America, Europe, China and Indian market. Further to serve the South American market and Southern Europe & North African market, the company is setting up a facility in Brazil and Morocco, which are expected to commence production in FY19. Through these expansions, it would be in a position to target 85% of the global automotive market. During , Varroc s lighting business was the fastest growing among its peer set. This business grew by 27.5% CAGR and was higher by 10.5ppts higher than the second fastest growing company in the same period. We are of the view, that with the above proposed expansion and positive outlook for the global and domestic operations, the company would continue to beat its peer set in terms of business growth. The company has reported a solid financial performance over FY During the period, it reported a 14.3% CAGR rise in the total operating revenue to Rs. 103,784.6mn in FY18. Consolidated EBITDA increased by 12.5% CAGR to Rs. 8,775.7mn in FY18. Average EBITDA margin during the period stood at 7.6%. Reported PAT increased by 226.3% CAGR to Rs. 4,502.6mn in FY18. Average PAT margin during the period stood at 3%. Cash flow from operations remained positive and increased by 103.1% CAGR over FY Total debt declined by 11.3% CAGR, with debt equity ratio improving from 1.3x in FY15 to 0.3x in FY18. Average RoE and RoCE stood at 12.9% and 11.9%, respectively, during the period. Based on our quick estimate, for FY19 we are anticipating a top-line of Rs. 115,361.4mn (a growth of 11.2% over FY18) and an EPS of 36.6 per share (a growth of 9.6% over FY18). EBITDA and PAT margin are anticipated at 8.9% and 4.3%, respectively. In FY20, top-line is expected to grow by 14.3% while EPS to grow by 20.8%. On valuation front, at higher price band, the company is demanding a P/E valuation of 29x (to its restated FY18 EPS of Rs. 33.4) as against the peer average of 23.1x. With respect to FY19 and FY20 EPS too, it is asking a premium valuation to its peers. Thus, the issue seems to be fully priced. However, considering the global market position, future strong growth outlook, low profitability and expensive valuation, we assign a Subscribe with Caution rating to the issue.
3 About the issue: Varroc is coming up with an initial public offering (IPO) with 20.22mn shares (fresh issue: nil; OFS shares: 20.22mn shares) in offering. The offer represents around 15% of its post issue paid-up equity shares of the company. Total IPO size is Rs. 19,514-19,554.4mn. 0.1mn shares are reserved for eligible employees. Thus the net issue comprises of 20.12mn shares. The issue will open on 26 th Jun and close on 28 th Jun The issue is book building with a price band of Rs per share. The employee discount is Rs. 48 per share on the offer price. Since the issue is fully OFS, the company will not receive any proceeds from it. Its promoter holds 86.30% stake in the company and post IPO this will come down to 85.00%. Public holding will increase from current to 15.00%. Pre and Post Issue Shareholding Pattern (%) Pre Issue Post Issue (at higher price band) Promoter & Promoter Group (%) 86.30% 85.00% Public (%) 13.70% 15.00% Indicative IPO Process Time Line: Offer Closes on 28-Jun-2018 Unblocking of ASBA Account 04-Juy-2018 Listing on Stock Exchanges 06-Jul-2018 Offer Opens on 26-Jun-2018 Finalization of Basis of Allotment 03-Jul-2018 Credit to Demat Accounts 05-Jul-2018

4 Company Introduction: Varroc is a global tier-1 (tier-1 companies are companies that directly supply to original equipment manufacturers (OEM)) automotive component group. It designs, manufactures and supply exterior lighting systems, plastic and polymer components, electricals-electronics components, and precision metallic components to passenger car, commercial vehicle, two-wheeler, three-wheeler and off highway vehicle OEMs directly worldwide. The company is the second largest Indian auto component group (by consolidated revenue for FY17) and is a leading tier-1 manufacturer and supplier to Indian twowheeler and three-wheeler OEMs (by consolidated revenue for FY17) (). Also the company is the sixthlargest global exterior automotive lighting manufacturer and one of the top three independent exterior lighting players (by market share in 2016; ). Varroc commenced operations with its polymer business in Initially it grew organically in India by adding new business lines, such as electrical division and metallic division. Subsequently, the company diversified its product offerings and expanded the production capacity through various investments, joint ventures and acquisitions. Most notable acquisitions includes its 2012 acquisition of Visteon's global lighting business, now known as Varroc Lighting Systems (VLS). Prior to the acquisition of Visteon's global lighting business, in 2007 the company acquired I.M.E.S (a manufacturer of hot steel forged parts for the construction and oil & gas industries) in Italy and in 2011 it acquired Triom (a manufacturer of high end lighting systems for global motorcycle OEMs) with operations in Italy, Romania and Vietnam. In 2013, Varroc expanded its global lighting business by acquiring Visteon's holding in a 50/50 joint venture with Beste Motor Co. Ltd. to manufacture automotive lighting in China, namely Varroc TYC. On 13 th Feb. 2018, Varroc entered into a joint venture with Dell'Orto S.p.A. for the development of electronic fuel injection control systems for two-wheelers and three wheelers.

5 Company Introduction (Contd ):
 the design, manufacture and supply of exterior lighting systems to passenger cars OEMs worldwide (Global Lighting Business), which it undertake")
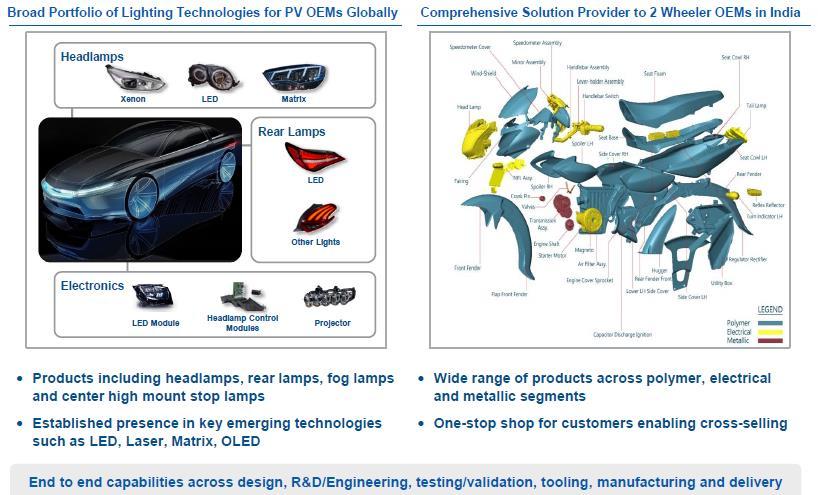
6 Company Introduction (Contd ): Varroc has end-to-end capabilities across design, R&D, engineering, testing, manufacturing and supply of various products across its business. The company has two primary business lines, namely (i) the design, manufacture and supply of exterior lighting systems to passenger cars OEMs worldwide (Global Lighting Business), which it undertake through subsidiaries forming part of the VLS group and (ii) the design, manufacture and supply of a wide range of auto components in India (India Business), primarily to two-wheeler and three-wheeler OEMs, including exports. The India Business offers a diversified set of products across three product lines, namely polymers/plastics, electrical/electronics and metallic components. Additionally, Varroc has other smaller businesses, which include the design, manufacture and supply of two-wheeler lighting to global OEMs, and under carriage forged machine components for off highway vehicles and drill bits for the oil & gas sector (Other Businesses). The company has expanded its manufacturing and R&D footprint by investing in nine manufacturing plants and an additional R&D center in India since As of 31 st Mar. 2018, its Global Lighting Business had 185 patents. It continues to expand its manufacturing and R&D footprint, and is in the process of setting up one manufacturing facility in Brazil and one manufacturing facility in Morocco and intend to set up two manufacturing facilities in India. Varroc intends to continue to improve its manufacturing processes and systems, as well as invest in new technology areas to further expand the business. Varroc s goal is to bring leading technologies to the mainstream markets with high quality, cost competitive solutions. Competition: The automotive component industry is extremely competitive and it faces intense competition both domestically and internationally. The key factors of competition are quality, cost, delivery, development and management. Typically, large suppliers work only with a limited number of OEMs. Consequently, the company do not have a single competitor across all its product ranges.
7 Company Introduction (Contd ): Financial performance: On the back of growth across the segments, Varrco reported a 14.3% CAGR rise in the total operating revenue over FY15-18 to Rs. 103,784.6mn in FY18. Global Lighting Business and India Business reported 12.5% and 19.8% CAGR growth in the business over the same period. Moreover, top-line were also affected by the favorable movement in the currencies of the countries were it is operating. Cost of goods sold, which formed around 60% of the top-line increased by 14.7% CAGR over FY Employee expenses and other expenses increased by 13.3% and 17.2% CAGR, respectively. Consequently, total operating expenses increased inline with top-line to 14.5% CAGR during the period. Consolidated EBITDA increased by 12.5% CAGR over FY15-18 to Rs. 8,775.7mn in FY18. Average EBITDA margin during the period stood at 7.6%. Depreciation & amortization charges increased by 15% CAGR, while finance cost declined by 43.4% CAGR during FY As a result, reported PAT increased by 226.3% CAGR to Rs. 4,502.6mn in FY18. Average PAT margin during the period stood at 3%. Cash flow from operations increased from Rs. 1,283.4mn in FY15 to Rs. 10,748.5mn in FY18, i.e. a growth of 103.1% CAGR over FY Total debt declined by 11.3% CAGR to Rs. 9,800.7mn in FY18. Debt equity ratio improved from 1.3x in FY15 to 0.3x in FY18. Average RoE and RoCE stood at 12.9% and 11.9%, respectively, during the period. FY15 FY16 FY17 FY18 CAGR (%) Y-o-Y (%) Global Lighting Business 44,330 48,198 61,242 63, % 3.1% India Business 21,188 30,807 31,681 36, % 14.9% Other Business 3,989 3,185 3,163 4, % 34.7% Total Operating Revenue 69, , , , % 8.0% EBITDA 6, , , , % 50.8% Reported PAT , , , % 48.6% Restated Adjusted EPS % 48.6% Cash Flow from Operating Activities 1, , , , % 58.9% FCF (1,896.8) 2, % % NOPLAT , , , % 90.4% RoIC (%) 5.1% 11.9% 8.8% 14.5% 934 bps 567 bps Revenue Growth Rate (%) 13.6% 18.2% 16.9% 8.0% EBITDA Growth Rate (%) 54.4% -7.4% 1.9% 50.8% EBITDA Margin (%) 8.9% 6.9% 6.1% 8.5% (42) bps 240 bps EBIT Growth Rate (%) 124.7% -23.2% -12.2% 100.7% EBIT Margin (%) 5.2% 3.4% 2.5% 4.7% (49) bps 219 bps Reported PAT Growth Rate (%) -69.2% % -18.0% 48.6% Reported PAT Margin (%) 0.2% 4.5% 3.2% 4.3% 415 bps 118 bps Inventories Turnover Ratio (x) % -4.1% Trade Receivable Turnover Ratio (x) % -1.2% Accounts Payable Turnover Ratio (x) % -15.6% Fixed Asset Turnover Ratio (x) % -7.4% Total Asset Turnover Ratio (x) % -7.6% Current Ratio (x) % -0.8% Debt to Equity (x) % -44.0% Net Debt to EBITDA (x) % -57.1% RoE (%) 1.2% 20.7% 13.7% 15.8% 1,463 bps 207 bps RoA (%) 0.3% 7.0% 5.2% 6.6% 628 bps 140 bps RoCE (%) 15.9% 10.4% 8.0% 13.3% (252) bps 537 bps


8 Competitive Strengths: Strong competitive position in attractive growing markets Strong, long-standing customer relationships Comprehensive product portfolio Low cost, strategically located manufacturing and design footprint Robust in-house technology, innovation and R&D capabilities Consistent track record of growth and operational and financial efficiency Business Strategy: Focus on high growth markets for Global Lighting Business Focus on increasing customer revenue for the India Business Continue to invest in in R&D, design, engineering and software capabilities in order to capitalize on future trends Pursue strategic joint ventures and inorganic growth opportunities Focus on operational efficiency Risk and Concerns: Subdued economic activities Delay in the proposed geographic expansion Lower or change in the business pattern from the customers Poor ramp up in the domestic business Poor pricing power Volatility in the currency rates CHOICE INSTITUTIONAL RESEARCH
9 Peer Comparison and Valuation: Company Name Currency CMP (Rs.) MCAP (Rs. mn) EV (Rs. mn) Total Operating Revenue (Rs. mn) EBITDA (Rs. mn) PAT (Rs. mn) EBITDA Margin (%) PAT Margin (%) Varroc Engineering Ltd. INR , , , , , % 4.3% Bharat Seats Ltd. INR 176 5,523 5,722 10, % 2.8% Sandhar Technologies Ltd. INR ,887 23,477 19, , % 3.3% Bosch Ltd. INR 17, , , , , , % 11.5% India Nippon Electrical Ltd. INR ,112 9,874 4, % 10.7% Pricol Ltd. INR 67 6,361 10,068 17, % -2.8% Sharda Motor Industries Ltd. INR 1,960 11,655 9,877 12, , % 7.3% Jamna Auto Industries Ltd. INR 87 34,786 35,134 17, , , % 7.1% Lumax Auto Technologies Ltd. INR ,108 9,652 11, , % 4.3% Minda Industries Ltd. INR 1, , ,728 45, , , % 6.8% Motherson Sumi Systems Ltd. INR , , , , , % 2.8% Koito Manufacturing Co., Ltd. JPY 7,770 1,249,416 1,052, , , , % 10.0% Valeo SA EUR 52 12,345 14,842 18, , % 5.1% Stanley Electric Co., Ltd. JPY 3, , , , , , % 8.8% Hella Gmbh & Co. KGaA EUR 54 6,016 6,271 6, , % 5.7% SL Corp. KRW 19, , ,955 1,455, , , % 4.1% Visteon Corporation USD 136 4,025 3,993 3, % 6.7% Average 11.8% 5.9% Company Name Currency EPS (Rs.) BVPS (Rs.) DPS (Rs.) Debt Equity Ratio Fixed Asset Turnover Ratio RoE (%) RoCE (%) P / E (x) P / B (x) EV / Sales (x) EV / EBITDA (x) MCAP / Earnings Sales (x) Yield (%) Varroc Engineering Ltd. INR % 13.3% % Bharat Seats Ltd. INR % 37.2% % Sandhar Technologies Ltd. INR % 16.2% % Bosch Ltd. INR , % 15.6% % India Nippon Electrical Ltd. INR % 16.9% % Pricol Ltd. INR (5.2) % -0.4% (13.0) % Sharda Motor Industries Ltd. INR % 26.2% % Jamna Auto Industries Ltd. INR % 39.5% % Lumax Auto Technologies Ltd. INR % 15.4% % Minda Industries Ltd. INR % 16.0% % Motherson Sumi Systems Ltd. INR % 15.1% % Koito Manufacturing Co., Ltd. JPY , % 20.9% % Valeo SA EUR % 12.5% % Stanley Electric Co., Ltd. JPY , % 11.0% % Hella Gmbh & Co. KGaA EUR % 10.9% % SL Corp. KRW 1, , % 8.6% % Visteon Corporation USD % 18.5% % Average % 17.5% % Note: Market data and per share data in their respective currency; Source: Choice Broking Research At the higher price band of Rs. 967 per share, Varroc s share is valued at a P/E multiple of 29x (to its restated FY18 EPS of Rs. 33.4) as compared to the peers average of 23.1x. Below are few key observations of the issue: Varroc is primarily involved into the design, manufacturing and supply of vehicle lighting. It has products across every lighting technology i.e. halogen, xenon, LED and laser. Because of its diversified vehicle lighting products, the company is in a position to target any market and any OEM from its low cost traditional (halogen, xenon etc.) as well as high end lighting products (LED, laser etc.). It operates this business under the segment Global Lighting Business and is largely sold to the global passenger vehicle OEMs. Over FY15-18, this segment contributed around 60% to the consolidated revenue. CHOICE INSTITUTIONAL RESEARCH
10 Peer Comparison and Valuation (Contd ): The company is also involved in the design, manufacturing and sale of wide auto components in India, primarily catering to the 2Ws and 3Ws OEMs. Its diversified set of auto products includes polymer/plastics, electricals/electronics and metallic components. Over FY15-18, this segment contributed around 35% to the consolidated revenue. Varroc is the sixth largest manufacturer in the global exterior automotive lighting space with a market share of around 4%. Also it is among the top three independent exterior lighting players in the globe. Being an independent player, the company has the benefit to target any market with its own product technology. Also in the global premium vehicle market, Varroc has a market share of 6%. In the electric vehicle market, the company has a market share of 20% and is one percent point lower than the market leader. Its global clientele includes marquee auto manufacturers across the premium, mid-range and mass market pricing spectrum and includes Ford, Jaguar Land Rover, the Volkswagen Group, Renault-Nissan- Mitsubishi, Groupe PSA, FCA, a European multinational car manufacturer and an American electric car manufacturer. Its domestic customers include Bajaj Auto, Royal Enfield, Yamaha, Suzuki, Honda, Hero, Piaggio etc. Varroc has strong long standing relationship with many of its customers and this can be demonstrated by the fact that since 1990 not a single customer has left the company. Through is diversified low cost products, it is continuously adding new customers both in domestic and global market. From FY14 to FY18, the company has increased the number of customers to whom it invoices over Euro 5mn per year from seven to nine. Moreover, there is little revenue concentration risk as its top three customers contribute around 34% and 25% to the global and domestic business, respectively, in FY18. Varroc has global manufacturing footprint with 36 manufacturing facilities spread across seven countries. Its manufacturing facilities are located in low cost countries like Mexico, the Czech Republic, China (through JV) and India, which allows it to serve North America, Europe, China and Indian market. In 2016, these markets accounted for 80% of the global passenger vehicle (PV) and light commercial vehicle (LCV) sales. In FY18, the global facilities were operating at around 80% capacity utilization, while domestic facilities were operating at around 50-60%. Further to serve the South American market and Southern Europe & North African market, the company is setting up a facility in Brazil and Morocco, which are expected to commence production in FY19. Through these expansions, it would be in a position to target 85% of the global automotive market. Additionally, Varroc has signed an agreement to acquire an exterior automotive lighting company based in Turkey and the sale is anticipated to conclude by the end of Jun According to Yole, during , global PV and LCV sales increased by 3.8% CAGR, while global automotive exterior lighting market grew by 4.5%. Over , lighting market is anticipated to grow at 4.3% CAGR as compared to 2% CAGR growth in the PV and LCV sales. Relatively higher growth of auto lighting products as compared to PV sales can be attributed to the increased adoption of LED & other lighting technologies and increase in the value of the lighting products. For the domestic operations, the 2W production is expected to grow at a robust pace of 8-10% CAGR in the next three years. During , Varroc s lighting business was the fastest growing among its peer set. This business grew by 27.5% CAGR and was higher by 10.5ppts higher than the second fastest growing company in the same period. We are of the view, that with the above proposed expansion and positive outlook for the global and domestic operations, the company would continue to beat its peer set in terms of business growth. The company has reported a solid financial performance over FY During the period, it reported a 14.3% CAGR rise in the total operating revenue to Rs. 103,784.6mn in FY18. Consolidated EBITDA increased by 12.5% CAGR to Rs. 8,775.7mn in FY18. Average EBITDA margin during the period stood at 7.6%. Reported PAT increased by 226.3% CAGR to Rs. 4,502.6mn in FY18. Average PAT margin during the period stood at 3%. Cash flow from operations remained positive and increased by 103.1% CAGR over FY Total debt declined by 11.3% CAGR, with debt equity ratio improving from 1.3x in FY15 to 0.3x in FY18. Average RoE and RoCE stood at 12.9% and 11.9%, respectively, during the period. Based on our quick estimate, for FY19 we are anticipating a top-line of Rs. 115,361.4mn (a growth of 11.2% over FY18) and an EPS of 36.6 per share (a growth of 9.6% over FY18). EBITDA and PAT margin are anticipated at 8.9% and 4.3%, respectively. In FY20, top-line is expected to grow by 14.3% to Rs. 131,854.2mn, while EPS to grow by 20.8% to Rs per share. On valuation front, at higher price band, the company is demanding a P/E valuation of 29x (to its restated FY18 EPS of Rs. 33.4) as against the peer average of 23.1x. With respect to FY19 and FY20 EPS too, it is asking a premium valuation to its peers. Thus, the issue seems to be fully priced. However, considering the global market position, future strong growth outlook, low profitability and expensive valuation, we assign a Subscribe with Caution rating to the issue. CHOICE INSTITUTIONAL RESEARCH
11 Financial Statements: Consolidated Profit and Loss Statement (Rs. mn) FY15 CAGR over Annual Growth over FY16 FY17 FY18 (Proforma) FY15-18 (%) FY17 (%) Total Operating Revenue 69, , , , % 8.0% Cost of Goods Sold (41,911.0) (49,906.3) (59,731.2) (63,203.2) 14.7% 5.8% Purchases of Stock in Trade (487.0) (1,098.1) (987.9) (924.0) 23.8% -6.5% Changes in Inventories of Work in Progress, Stock in Trade and Finished Goods % -14.6% Excise Duty (1,807.8) (3,096.8) (3,097.5) (996.3) -18.0% -67.8% Employee Benefits Expense (9,022.5) (10,399.3) (12,037.5) (13,135.2) 13.3% 9.1% Other Expenses (10,578.1) (12,491.0) (14,765.3) (17,050.6) 17.2% 15.5% EBITDA 6, , , , % 50.8% Depreciation / Impairment & Amortization Expenses (2,539.7) (2,922.5) (3,370.8) (3,864.7) 15.0% 14.6% EBIT 3, , , , % 100.7% Finance Costs (4,754.8) (904.0) (861.7) -43.4% -4.7% Share of Net Profits of Investments Accounted for Using the Equity method % -12.8% Other Income % -58.8% Exceptional Items % PBT , , , % 56.7% Tax Expenses (465.4) (219.7) (238.0) (617.9) 9.9% 159.6% PAT Before Minority Interest , , , % 48.6% Minority Interest (38.5) (4.6) (3.8) (5.2) -48.7% 36.9% Reported PAT , , , % 48.6% Consolidated Balance Sheet Statement (Rs. mn) FY15 CAGR over Annual Growth over FY16 FY17 FY18 (Proforma) FY15-18 (%) FY17 (%) Equity and Preference Share Capital % 0.0% Reserves and Surplus 10, , , , % 29.6% Minority Interest % 3.0% Long Term Borrowings 10, , , , % -15.8% Deferred Tax Liabilities (Net) % 291.3% Long Term Provisions , % 35.5% Other Long Term Liabilities % 148.4% Short Term Borrowings 3, , , , % -42.6% Trade Payables 9, , , , % 31.4% Other Current Liabilities 7, , , , % 27.8% Short Term Provisions % -24.9% Total Liabilities 44, , , , % 16.9% Tangible assets 17, , , , % 14.9% Intangible assets 1, , , , % 48.4% Capital Work in Progress 1, , , , % -1.0% Intangible Assets Under Development , % 117.1% Goodwill % 121.9% Investment Properties % -4.0% Investments Accounted for Using the Equity Method 1, , , , % 21.8% Non Current Investments % 0.0% Long Term Loans and Advances % 29.3% Income Tax Assets (Net) % -18.7% Deferred Tax Assets , % Goodwill on Consolidation Other Non Current Assets 1, , , , % 29.5% Current Investments % Inventories 5, , , , % 14.7% Trade Receivables 10, , , , % 23.2% Cash & Cash Equivalents , , , % -7.1% Short Term Loans and Advances , , , % -13.2% Other Current Assets 2, , , , % 17.4% Total Assets 44, , , , % 16.9% CHOICE INSTITUTIONAL RESEARCH
12 Financial Statements (Contd ): Consolidated Cash Flow Statement (Rs. mn) Particulars (Rs. mn) FY15 CAGR over Annual Growth over FY17 FY16 FY17 FY18 (Proforma) FY15-18 (%) (%) Cash Flow from Operating Activities 1, , , , % 58.9% Cash Flow from Investing Activities (2,453.9) (5,785.2) (5,654.4) (6,012.9) 34.8% 6.3% Cash Flow from Financing Activities , (5,231.8) % % Net Cash Flow (467.4) ,047.2 (496.2) 2.0% % Opening Balance of Cash and Bank Balances , , % 259.2% Closing Balance of Cash and Bank Balances , , , % 2.1% Note: Pre-issue data; Consolidated Financial Ratios Particulars (Rs. mn) FY15 (Proforma) FY16 FY17 FY18 Revenue Growth Rate (%) 13.6% 18.2% 16.9% 8.0% EBITDA Growth Rate (%) 54.4% -7.4% 1.9% 50.8% EBITDA Margin (%) 8.9% 6.9% 6.1% 8.5% EBIT Growth Rate (%) 124.7% -23.2% -12.2% 100.7% EBIT Margin (%) 5.2% 3.4% 2.5% 4.7% Reported PAT Growth Rate (%) -69.2% % -18.0% 48.6% Reported PAT Margin (%) 0.2% 4.5% 3.2% 4.3% Liquidity Ratios Current Ratio Debt Equity Ratio Net Debt to EBITDA Turnover Ratios Inventories Days Trade Receivable Days Accounts Payable Days (51.6) (48.8) (51.7) (61.3) Cash Conversion Cycle Days Fixed Asset Turnover Ratio (x) Total Asset Turnover Ratio (x) Return Ratios RoE (%) 1.2% 20.7% 13.7% 15.8% RoA (%) 0.3% 7.0% 5.2% 6.6% RoCE (%) 15.9% 10.4% 8.0% 13.3% Per Share Data Restated Adjusted EPS (Rs.) Restated DPS (Rs.) BVPS (Rs.) Restated Operating Cash Flow Per Share (Rs.) Restated Free Cash Flow Per Share (Rs.) (14.1) 19.2 CHOICE INSTITUTIONAL RESEARCH

13 Disclaimer This is solely for information of clients of Choice Broking and does not construe to be an investment advice. It is also not intended as an offer or solicitation for the purchase and sale of any financial instruments. Any action taken by you on the basis of the information contained herein is your responsibility alone and Choice Broking its subsidiaries or its employees or associates will not be liable in any manner for the consequences of such action taken by you. We have exercised due diligence in checking the correctness and authenticity of the information contained in this recommendation, but Choice Broking or any of its subsidiaries or associates or employees shall not be in any way responsible for any loss or damage that may arise to any person from any inadvertent error in the information contained in this recommendation or any action taken on basis of this information. This report is based on the fundamental analysis with a view to forecast future price. The Research analysts for this report certifies that all of the views expressed in this report accurately reflect his or her personal views about the subject company or companies and its or their securities, and no part of his or her compensation was, is or will be, directly or indirectly related to specific recommendations or views expressed in this report. Choice Broking has based this document on information obtained from sources it believes to be reliable but which it has not independently verified; Choice Broking makes no guarantee, representation or warranty and accepts no responsibility or liability as to its accuracy or completeness. The opinions contained within the report are based upon publicly available information at the time of publication and are subject to change without notice. The information and any disclosures provided herein are in summary form and have been prepared for informational purposes. The recommendations and suggested price levels are intended purely for stock market investment purposes. The recommendations are valid for the day of the report and will remain valid till the target period. The information and any disclosures provided herein may be considered confidential. Any use, distribution, modification, copying, forwarding or disclosure by any person is strictly prohibited. The information and any disclosures provided herein do not constitute a solicitation or offer to purchase or sell any security or other financial product or instrument. The current performance may be unaudited. Past performance does not guarantee future returns. There can be no assurance that investments will achieve any targeted rates of return, and there is no guarantee against the loss of your entire investment. POTENTIAL CONFLICT OF INTEREST DISCLOSURE (as on date of report) Disclosure of interest statement Analyst interest of the stock /Instrument(s): - No. Firm interest of the stock / Instrument (s): - No Choice Equity Broking Pvt. Ltd. Choice House, Shree Shakambhari Corporate Park, Plot No: , J.B. Nagar, Andheri (East), Mumbai
Varroc Engineering Ltd.
 IPO Note Auto ancillary June 25, 2018 Varroc Engineering Ltd. Varroc Engineering Ltd (VEL) is a tier-1 automotive component group. It designs, manufactures and supplies exterior lighting systems, plastic
SUBSCRIBE to Hindustan Aeronautics Ltd. Invest with mid to long term time horizon
 SUBSCRIBE to Hindustan Aeronautics Ltd. Invest with mid to long term time horizon 14 th Mar. 2018 Salient features of the IPO: Hindustan Aeronautics Ltd. (HAL) conferred with the "Navratna" Recommendation
VARROC ENGINEERING LIMITED IPO Note (CAUTIOUS) Analyst: Brijesh Bhatia (Head Research) Rohit Rai Menil Savla
 Analyst: Brijesh Bhatia (Head Research) Rohit Rai Menil Savla") VARROC ENGINEERING LIMITED IPO Note (CAUTIOUS) Analyst: Brijesh Bhatia (Head Research) Rohit Rai Menil Savla 26 June 2018 IPO details Key Data Issue Opens 26-Jun-18 Issue Closes 28-Jun-18 Equity Shares
VARROC ENGINEERING LIMITED IPO Note (CAUTIOUS) Analyst: Brijesh Bhatia (Head Research) Rohit Rai Menil Savla 26 June 2018 IPO details Key Data Issue Opens 26-Jun-18 Issue Closes 28-Jun-18 Equity Shares
SUBSCRIBE to H.G. Infra Engineering Ltd. Strong player in government s renewed focus sector
 SUBSCRIBE to H.G. Infra Engineering Ltd. Strong player in government s renewed focus sector 19 th Feb. 2018 Salient features of the IPO: H.G. Infra Engineering Ltd. (HGIEL) is an infrastructure construction,
June 22, 2018 VARROC ENGINEERING LIMITED. SMC Ranking (2/5) About the Company. Issue Highlights. Strength. Shareholding Pattern (%)
 About the Company. Issue Highlights. Strength. Shareholding Pattern (%)") VARROC ENGINEERING LIMITED June 22, 2018 SMC Ranking (2/5) Book Running Lead Manager Issue Highlights Industry Kotak Mahindra Capital Company Limited Citigroup Global Markets India Private Limited Credit
VARROC ENGINEERING LIMITED June 22, 2018 SMC Ranking (2/5) Book Running Lead Manager Issue Highlights Industry Kotak Mahindra Capital Company Limited Citigroup Global Markets India Private Limited Credit
SUBSCRIBE To ASTRON PAPER & BOARD MILL LTD. Growing business at reasonable valuation
 SUBSCRIBE To ASTRON PAPER & BOARD MILL LTD. Growing business at reasonable valuation 12th Dec 2017 Salient features of the IPO: Astron Paper and Board Mill Lmt. (APBML), incorporated in 2010, is engaged
~~~- _/ Varroc Engineering Limited Regd. & Corp. Office. Vdrroc EXCELLENCE. VARROC/SE/INT / /14 September 05, 2018
 Varroc Engineering Limited Regd. & Corp. Office l-4, MIDC, Industrial Area I Tel +91 240 6653600 Waluj, Aurangabad 431 136 Maharashtra, India Fax +91 240 2564540 VARROC/SE/INT /2018-19/14 September 05,
JOINDRE CAPITAL SERVICES LTD. SEBI REGN NO. INH / INZ
 RESEARCH REPORT 21 st Dec 2018 VARROC ENGINEERING LIMITED BSE : VARROC Sector: AUTO LIGHTING & COMPONENTS BSE: 541578 View - BUY CMP : Rs. 673 Target Price: Rs 1050 (In next 12 to 18 mths) BUSINESS BACKGROUND
Varroc Engineering Ltd.
 Rating: Subscribe Price Band: Rs965967 June 25, 2018 IPO Note Key Financials FY17 FY18 FY19E FY20E Sales (Rs. m) 67,700 79,092 92,988 1,02,788 EBITDA (Rs. m) 6,169 5,709 5,818 8,776 Margin (%) 9.1 7.2
Larsen & Toubro Ltd.
 Reasonably Priced Salient features of the IPO: Larsen and Toubro Infotech Ltd. (L&TIL) is a global IT services and solutions company. Incorporated in 1996, it is headquartered in Mumbai, India. The company
Sandhar Technologies Limited
 IPO Note Auto Ancillary Mar 15, 2018 Sandhar Technologies Limited Sandhar Technologies Ltd. is one of the leading auto component suppliers for safety and security systems such as lock assemblies, mirror
Trident Ltd. Buy & Add on dips
 Trident Ltd. Buy & Add on dips 33,351.8 38,689.6 37,553.3 36,656.6 46,944.2 18-Apr-17 18-May-17 18-Jun-17 18-Jul-17 18-Aug-17 18-Sep-17 18-Oct-17 18-Nov-17 18-Dec-17 18-Jan-18 18-Feb-18 18-Mar-18 Trident
Advisory Desk. TVS Srichakra Ltd. BUY CMP. `355 Target Price `468. Investment rationale. Outlook and valuation. Investment Period 12 Months
 Ltd. Ltd. (TVSSL), a part of TVS Group, is a leading manufacturer of two and three-wheeler tyres with a 25% market share. Two-wheeler demand growth (~16% yoy YTD) continues to be insulated from the current
Gabriel India Ltd. 4 th November, 2014 BUY
 Company Report BROKING DEPOSITORY DISTRIBUTION FINANCIAL ADVISORY Gabriel India Ltd. 4 th November, 2014 BUY CMP(As on 3/11/2014) Rs.83.40 Target Price Rs.115.00 BSE Code 505714 NSE Code GABRIEL Market
Mahindra & Mahindra Ltd.
 May-15 Aug-15 Nov-15 Feb-16 May-16 Aug-16 Nov-16 Feb-17 May-17 Aug-17 Nov-17 Feb-18 4QFY2018 Result Update Automobile May 30, 2018 Mahindra & Mahindra Ltd. Performance Update Y/E March (` cr) 4QFY18 4QFY17
Proud to be part of. Investor presentation
 Proud to be part of. Investor presentation May 2016 Overview SMG overview MSSL overview MSSL performance 02 The 7.2 Billion USD Samvardhana Motherson Group is one of the world s fastest growing specialized
Goodyear India ACCUMULATE. Performance Highlights. CMP Target Price `326 `374. 1QCY2012 Result Update Tyres. Key financials
 1QCY212 Result Update Tyres June 6, 212 Goodyear India Performance Highlights Y/E December (` cr) 1QCY212 1QCY211 % chg (yoy) 4QCY211 % chg (qoq) Net sales 331 336 (1.6) 395 (16.2) EBITDA 2 24 (18.6) 34
BUY. MENON PISTONS LTD Result Update (PARENT BASIS): Q1 FY16 SYNOPSIS. CMP Target Price SEPTEMBER 3 rd, 2015
: Q1 FY16 SYNOPSIS. CMP Target Price SEPTEMBER 3 rd, 2015") BUY CMP 151.00 Target Price 174.00 MENON PISTONS LTD Result Update (PARENT BASIS): Q1 FY16 SEPTEMBER 3 rd, 2015 ISIN: INE650G01011 Stock Details Stock Data Sector Auto Parts & Equipment BSE Code 531727
BUY CMP 151.00 Target Price 174.00 MENON PISTONS LTD Result Update (PARENT BASIS): Q1 FY16 SEPTEMBER 3 rd, 2015 ISIN: INE650G01011 Stock Details Stock Data Sector Auto Parts & Equipment BSE Code 531727
PEER GROUPS CMP MARKET CAP EPS P/E (X) P/BV(X) DIVIDEND Company Name (Rs.) Rs. in mn. (Rs.) Ratio Ratio (%)
 P/BV(X) DIVIDEND Company Name (Rs.) Rs. in mn. (Rs.) Ratio Ratio (%)") BUY CMP 422.40 Target Price 480.00 HARITA SEATING SYSTEMS LTD Result Update (PARENT BASIS): Q2 FY16 NOVEMBER 12 th, 2015 ISIN: INE939D01015 Index Details Stock Data Sector Auto Parts & Equipment BSE Code
BUY CMP 422.40 Target Price 480.00 HARITA SEATING SYSTEMS LTD Result Update (PARENT BASIS): Q2 FY16 NOVEMBER 12 th, 2015 ISIN: INE939D01015 Index Details Stock Data Sector Auto Parts & Equipment BSE Code
Automobiles. Heading Into Strong Earnings Growth Quarter QUARTERLY PREVIEW
 India Research April 19, 2018 QUARTERLY PREVIEW Mar'18 Quarterly PAT Company PAT (Rs mn) Maruti Suzuki 20,605 M&M 10,367 Hero MotoCorp 8,774 Bajaj Auto 11,253 TVS Motor 2,432 Ashok Leyland 6,472 Bharat
Maruti Suzuki India BUY. Performance Update. CMP `9,315 Target Price `10,820. 1QFY2019 Result Update Automobile. Historical share price chart
 Jul-15 Sep-15 Nov-15 Jan-16 Mar-16 May-16 Jul-16 Sep-16 Nov-16 Jan-17 Mar-17 May-17 Jul-17 Sep-17 Nov-17 Jan-18 Mar-18 May-18 1QFY2019 Result Update Automobile July 27, 2018 Maruti Suzuki India Performance
Mahindra & Mahindra Ltd.
 Nov-15 Jan-16 Apr-16 Jul-16 Oct-16 Jan-17 Apr-17 Jul-17 Oct-17 Jan-18 Apr-18 Jul-18 Oct-18 2QFY2019 Result Update Automobile November 15, 2018 Mahindra & Mahindra Ltd. Performance Update Y/E March (` cr)
Cummins India BUY,ADD ON DIPS,
 Cummins India BUY,ADD ON DIPS, 60, 000.00 50, 000.00 40, 000.00 30, 000.00 20, 000.00 10, 000.00 0.0 0 47,961.00 20-Mar-17 20-Apr-17 20-May-17 41,543.80 20-Jun-17 20-Jul-17 20-Aug-17 51,237.50 20-Sep-17
DENSO INDIA LTD.(DENSO)
") DENSO INDIA LTD.(DENSO) Date : 2 th September, 212 Stock Performance Details Current Price : Rs. 46.** Face Value : Rs. 1 per share 52 wk High / Low : Rs. 63.25 / Rs. 43.6 Total Traded Volumes : 24 shares**
DENSO INDIA LTD.(DENSO) Date : 2 th September, 212 Stock Performance Details Current Price : Rs. 46.** Face Value : Rs. 1 per share 52 wk High / Low : Rs. 63.25 / Rs. 43.6 Total Traded Volumes : 24 shares**
CCL Products BUY. Performance Update. CMP Target Price `278 `360. 3QFY2018 Result Update Coffee. Historical share price chart.
 Feb-15 May-15 Aug-15 Oct-15 Jan-16 Apr-16 Jul-16 Oct-16 Jan-17 Apr-17 Jul-17 Oct-17 Jan-18 3QFY2018 Result Update Coffee February 5, 2018 CCL Products Performance Update Y/E March (` cr) Q3FY18 Q3FY17
Mahindra & Mahindra Ltd.
 Jan-16 Apr-16 Jul-16 Oct-16 Jan-17 Apr-17 Jul-17 Oct-17 Jan-18 Apr-18 Jul-18 Oct-18 Jan-19 3QFY2019 Result Update Automobile February 15, 2019 Mahindra & Mahindra Ltd. Performance Update Y/E March (` cr)
National Institute of Research & Advisory We care for your financial goals
 National Institute of Research & Advisory We care for your financial goals Multibagger Investment Plan is our all-time favorite Investmentt service and this service is quite popular amongst our clients
Gabriel India Ltd. Result Update Presentation Q1 FY17
 Gabriel India Ltd. Result Update Presentation Q1 FY17 Safe Harbour This presentation and the accompanying slides (the Presentation ), has been prepared by Gabriel India Limited (the Company ), solely for
Future Supply Chain Solutions Ltd
 IPO Note Financials Dec 04, 2017 Future Supply Chain Solutions Ltd Incorporated in 2006, Future Supply Chain Solutions Ltd (FSCSL) is one of the largest third-party logistics service providers in India.
Goodyear India BUY. Company Update. CMP Target Price `515 `631. Company Update Tyres. 3-year Daily Price Chart. Key Financials
 Company Update Tyres June 10, 2016 Goodyear India Company Update Expectation of normal monsoon to energize stagnant tractor demand: Goodyear India (GIL) is a leader in the farm tyre segment in India with
Hero MotoCorp NEUTRAL. Performance Highlights. CMP `2,245 Target Price - 4QFY2012 Result Update Automobile. Investment Period - Key financials
 4QFY212 Result Update Automobile Hero MotoCorp Performance Highlights Y/E March (` cr) 4QFY12 4QFY11 % chg (yoy) Angel est. % diff NEUTRAL CMP `2,245 Target Price - Investment Period - Net sales 6,35 5,391
Maruti Suzuki India BUY. Performance Update. CMP `6,705 Target Price `8,552. 2QFY2019 Result Update Automobile. Historical share price chart
 Oct-15 Jan-16 Apr-16 Jul-16 Oct-16 Jan-17 Apr-17 Jul-17 Oct-17 Jan-18 Apr-18 Jul-18 Oct-18 2QFY2019 Result Update Automobile November 3, 2018 Maruti Suzuki India Performance Update Y/E March (` cr) 2QFY19
NEUTRAL. Neogen Chemicals Ltd. Issue Open: April 24, 2019 Issue Close: April 26, IPO Note Specialty Chemicals
 IPO Note Specialty Chemicals April 22, 2019 Neogen Chemicals Ltd. NEUTRAL Issue Open: April 24, 2019 Issue Close: April 26, 2019 Neogen Chemicals Limited (NCL) is one of the leading Indian manufacturers
Amara Raja Batteries BUY. Performance Highlights. CMP `1,010 Target Price `1,167. 2QFY2017 Result Update Auto Ancillary. 3-year price chart
 2QFY217 Result Update Auto Ancillary November 8, 216 Amara Raja Batteries Performance Highlights BUY CMP `1,1 Target Price `1,167 Y/E March (` cr) 3QFY16 3QFY15 % chg (yoy) 2QFY16 % chg (qoq) Net Sales
Bajaj Auto Ltd. CMP: Rs.1426 Recommendation: Buy Target Price: Rs March. 1 P age. 21 st July Key Data Financial Year End
 CMP: Rs.1426 Recommendation: Buy Target Price: Rs.1593 Key Data Financial Year End March Market Cap (Rs. Cr.) 41,241 Market Cap (USD Bn.) 9.2 Free Float Factor 0.49 52 Week H/L 1664.5/1189.6 Avg. 12M volumes
Bloomberg Code: ATA IN
 Auto OEM: 3-Wheelers Atul Feb Auto 03, 2015 Ltd India Research Stock Broking Bloomberg Code: ATA IN Stable quarter led by surge in exports volumes (TP revised ) : Operating revenue, EBITDA and PAT grew
Lumax Industries (LUMIND)
") Management Meet Note Rating matrix Rating : Unrated Target : NA Target Period : NA Potential Upside : NA Key Financials Crore FY14 FY15 FY16 FY17 Net Sales 1,117 1,143 1,255 1,300 EBITDA 51 59 89 100 Net
Management Meet Note Rating matrix Rating : Unrated Target : NA Target Period : NA Potential Upside : NA Key Financials Crore FY14 FY15 FY16 FY17 Net Sales 1,117 1,143 1,255 1,300 EBITDA 51 59 89 100 Net
Company Overview. Financial Performance
 Apr/15 May/15 Jun/15 Jul/15 Aug/15 Sep/15 Oct/15 Nov/15 Dec/15 Jan/16 Feb/16 Mar/16 Monarch Networth Capital Limited CMP: 26.00 March 23, 2016 Stock Details BSE code 511551 BSE ID MONARCH Face value (
Newgen Software Technologies Ltd
 IPO Note IT Jan 12, 2018 Newgen Software Technologies Ltd Incorporated in 1992, Newgen Software Technologies Limited (NSTL) is a New Delhi based IT company and a global provider of Business Process Management
MRF BUY. Performance Highlights. CMP `9,407 Target Price `11,343. Company Update Automobile. Key financials
 Company Update Automobile February 22, 212 MRF Performance Highlights Y/E Sept. (` cr) 1QSY12 1QSY11 % chg (yoy) 4QSY11 % chg (qoq) Net sales 2,875 2,167 32.7 2,62 9.8 EBITDA 258 243 5.9 181 42.6 EBITDA
PEER GROUPS CMP MARKET CAP EPS P/E (X) P/BV(X) DIVIDEND Company Name (Rs.) Rs. in mn. (Rs.) Ratio Ratio (%)
 P/BV(X) DIVIDEND Company Name (Rs.) Rs. in mn. (Rs.) Ratio Ratio (%)") BUY CMP 1750.50 Target Price 1995.00 BAJAJ FINSERV LIMITED (CONSOLIDATED) Result Update: Q1 FY16 SEPTEMBER 26 th, 2015 ISIN: INE918I01018 Index Details Stock Data Sector Financial Services BSE Code 532978
BUY CMP 1750.50 Target Price 1995.00 BAJAJ FINSERV LIMITED (CONSOLIDATED) Result Update: Q1 FY16 SEPTEMBER 26 th, 2015 ISIN: INE918I01018 Index Details Stock Data Sector Financial Services BSE Code 532978
IST Ltd BSE Scrip Code:
 IST Ltd BSE Scrip Code: 508807 Other Apparels & Accessories September 13, 2012 Equity Statistics Current Market Price Rs. 170.3 52 Week High / Low Rs. 209/124 Market Capitalisation Rs. crores 98.7 Free
September 21, 2012 Motherson Sumi Systems Limited An emerging global auto-ancillary giant
 Motherson Sumi Systems Limited An emerging global auto-ancillary giant September 21, 2012 Recommendation CMP (Rs.) Sector Stock Details BSE Code Bloomberg Code Market Cap (Rs. cr) Free Float (%) 52- wk
BUY. KDDL LTD Result Update (PARENT BASIS): Q1 FY16 SYNOPSIS. CMP Target Price AUGUST 22 nd 2015 ISIN: INE291D01011
: Q1 FY16 SYNOPSIS. CMP Target Price AUGUST 22 nd 2015 ISIN: INE291D01011") BUY CMP 280.10 Target Price 322.00 KDDL LTD Result Update (PARENT BASIS): Q1 FY16 AUGUST 22 nd 2015 ISIN: INE291D01011 Index Details Stock Data Sector Other Apparels & Accessories BSE Code 532054 Face
BUY CMP 280.10 Target Price 322.00 KDDL LTD Result Update (PARENT BASIS): Q1 FY16 AUGUST 22 nd 2015 ISIN: INE291D01011 Index Details Stock Data Sector Other Apparels & Accessories BSE Code 532054 Face
Endurance Technologies Limited
 IPO Note Auto Ancillary October 3, 2016 Endurance Technologies Limited On Strong footing SUBSCRIBE Issue Open: October 5, 2016 Issue Close: October 7, 2016 Endurance Technologies is an Aurangabad based
Symphony Ltd. RESULT UPDATE 31st October 2017
 . RESULT UPDATE 31st October 2017 Oct-14 Apr-15 Oct-15 Apr-16 Oct-16 Apr-17 Oct-17 India Equity Institutional Research II Result Update Q2FY18 II 31st October 2017. CMP INR 1,465 Target INR 1,700 Potential
PEER GROUPS CMP MARKET CAP EPS P/E (X) P/BV(X) DIVIDEND Company Name (Rs.) Rs. in mn. (Rs.) Ratio Ratio (%)
 P/BV(X) DIVIDEND Company Name (Rs.) Rs. in mn. (Rs.) Ratio Ratio (%)") BUY CMP 412.60 Target Price 454.00 BHARAT FORGE LTD Result Update: Q3 FY14 MARCH 26 th 2014 ISIN: INE465A01025 Index Details Stock Data Sector Industrial Products BSE Code 500493 Face Value 2.00 52wk.
BUY CMP 412.60 Target Price 454.00 BHARAT FORGE LTD Result Update: Q3 FY14 MARCH 26 th 2014 ISIN: INE465A01025 Index Details Stock Data Sector Industrial Products BSE Code 500493 Face Value 2.00 52wk.
BUY. MAGMA FINCORP LIMITED Result Update (CONSOLIDATED BASIS): Q1 FY16 SYNOPSIS. CMP Target Price SEPTEMBER 9 th, 2015 ISIN: INE11C01022
: Q1 FY16 SYNOPSIS. CMP Target Price SEPTEMBER 9 th, 2015 ISIN: INE11C01022") BUY CMP 87.50 Target Price 102.00 MAGMA FINCORP LIMITED Result Update (CONSOLIDATED BASIS): Q1 FY16 SEPTEMBER 9 th, 2015 ISIN: INE11C01022 Index Details Stock Data Sector Finance (NBFCs) BSE Code 524000
BUY CMP 87.50 Target Price 102.00 MAGMA FINCORP LIMITED Result Update (CONSOLIDATED BASIS): Q1 FY16 SEPTEMBER 9 th, 2015 ISIN: INE11C01022 Index Details Stock Data Sector Finance (NBFCs) BSE Code 524000
GNA Axles Limited SUBSCRIBE. IPO Note Attractive on Valuations: Subscribe. Issue Open: September 14, 2016 Issue Close: September 16, 2016
 IPO Note Auto ancillary September 9, 2016 GNA Axles Limited IPO Note Attractive on Valuations: Subscribe GNA Axles Ltd (GNAAL) is a Punjab based manufacturer of rear axle shafts, other shafts and spindles
PEER GROUPS CMP MARKET CAP EPS P/E (X) P/BV(X) DIVIDEND Company Name (Rs.) Rs. in mn. (Rs.) Ratio Ratio (%)
 P/BV(X) DIVIDEND Company Name (Rs.) Rs. in mn. (Rs.) Ratio Ratio (%)") BUY CMP 734.45 Target Price 845.00 WELSPUN INDIA LIMITED Result Update (CONSOLIDATED): Q2 FY16 OCTOBER 24 th 2015 ISIN: INE192B01023 Index Details Stock Data Sector Textiles BSE Code 514162 Face Value
BUY CMP 734.45 Target Price 845.00 WELSPUN INDIA LIMITED Result Update (CONSOLIDATED): Q2 FY16 OCTOBER 24 th 2015 ISIN: INE192B01023 Index Details Stock Data Sector Textiles BSE Code 514162 Face Value
Bharat Forge SYNOPSIS. C.M.P: Rs Target Price: Rs Date: Feb 29 th, 2012 BUY
 Bharat Forge Ltd Result Update: Q3 FY 12 C.M.P: Rs. 308.25 Target Price: Rs. 351.00 Date: Feb 29 th, 2012 BUY Stock Data: Sector: Auto Components Face Value Rs. 2.00 52 wk. High/Low (Rs.) 370.50/231.00
MISHRA DHATU NIGAM Ltd.
 IPO Note Metal Mar 19, 2018 MISHRA DHATU NIGAM Ltd. Incorporated in 1973, with an aim of achieving self-reliance in research and development, and supply of critical alloys and products of national security,
BUY APOLLO TYRES LTD. CMP Target Price AUGUST 12 th, Highlights. Result Update (CONSOLIDATED BASIS): Q1 FY16
: Q1 FY16") BUY CMP 187.50 Target Price 215.00 APOLLO TYRES LIMITED Result Update (CONSOLIDATED BASIS): Q1 FY16 AUGUST 12 th, 2015 ISIN: INE438A01022 Stock Data Sector Tyres & Tubes BSE Code 500877 Face Value 1.00
BUY CMP 187.50 Target Price 215.00 APOLLO TYRES LIMITED Result Update (CONSOLIDATED BASIS): Q1 FY16 AUGUST 12 th, 2015 ISIN: INE438A01022 Stock Data Sector Tyres & Tubes BSE Code 500877 Face Value 1.00
PSP Projects Ltd. 1 P a g e. Subscribe with Long Recommendation. Term View BACKGROUND
 Subscribe with Long Recommendation Term View BACKGROUND Price Band Rs. 205 Rs. 210 (PSP) is a multidisciplinary construction company Bidding Date 17 th Sep - 19 th May 2017 Book Running Lead Manager Registrar
Dr. Lal PathLabs Ltd.
 Dr. Lal Pathlabs Ltd. (DLP) is a provider of diagnostic and related healthcare tests and services in India. It provides a range of diagnostic and related healthcare services which are used in core testing,
BUY. HSIL LTD Result Update(PARENT BASIS): Q2 FY15. CMP Target Price DECEMBER 4 th 2014 SYNOPSIS
: Q2 FY15. CMP Target Price DECEMBER 4 th 2014 SYNOPSIS") BUY CMP 367.10 Target Price 415.00 HSIL LTD Result Update(PARENT BASIS): Q2 FY15 DECEMBER 4 th 2014 ISIN: INE415A01038 Stock Details Stock Data Sector Containers & Packaging BSE Code 500187 Face Value
BUY CMP 367.10 Target Price 415.00 HSIL LTD Result Update(PARENT BASIS): Q2 FY15 DECEMBER 4 th 2014 ISIN: INE415A01038 Stock Details Stock Data Sector Containers & Packaging BSE Code 500187 Face Value
BUY APOLLO TYRES LTD. Highlights. CMP Target Price AUGUST 22 nd, Result Update (PARENT BASIS): Q1 FY15 ISIN: INE438A01022
: Q1 FY15 ISIN: INE438A01022") BUY CMP 169.95 Target Price 204.00 APOLLO TYRES LIMITED Result Update (PARENT BASIS): Q1 FY15 AUGUST 22 nd, 2014 ISIN: INE438A01022 Stock Data Sector Tyres & Tubes BSE Code 500877 Face Value 1.00 52wk.
BUY CMP 169.95 Target Price 204.00 APOLLO TYRES LIMITED Result Update (PARENT BASIS): Q1 FY15 AUGUST 22 nd, 2014 ISIN: INE438A01022 Stock Data Sector Tyres & Tubes BSE Code 500877 Face Value 1.00 52wk.
South Indian Bank Ltd.
 23-Jun-15 23-Aug-15 23-Oct-15 23-Dec-15 23-Feb-16 23-Apr-16 23-Jun-16 23-Aug-16 23-Oct-16 23-Dec-16 23-Feb-17 23-Apr-17 South Indian Bank Ltd. Q1 FY18 RESULT UPDATE Low provisioning to boost profitability
SUBSCRIBE. ICICI Lombard General Insurance Co Ltd. Issue Open: Sept 15, 2017 Issue Close: Sept 19, IPO Note Insurance
 IPO Note Insurance Sept 14, 2017 ICICI Lombard General Insurance Co Ltd ICICI Lombard is the largest non-life private sector insurer in India. It is a JV between ICICI Bank and Fairfax Financial Holdings
Avenue Supermarts Limited
 IPO Note Retail March 4, 2017 Avenue Supermarts Limited A retailer with a growth appetite Avenue Supermarts Ltd (ASL), founded in 2002, is the owner of well established supermarket chain D-Mart. ASL is
Hero MotoCorp ACCUMULATE. Performance Highlights. CMP `3,718 Target Price `4,130. 1QFY2018 Result Update Automobile. 3-year price chart
 1QFY2018 Result Update Automobile July 27, 2017 Hero MotoCorp Performance Highlights ACCUMULATE CMP `3,718 Target Price `4,130 Y/E March (` cr) 1QFY18 1QFY17 % chg (yoy) 4QFY17 % chg (qoq) Investment Period
TVS Motor Company BUY. Performance Highlights. CMP Target Price `39 `45. 2QFY2013 Result Update Automobile. Quarterly highlights (Standalone)
") 2QFY2013 Result Update Automobile November 1, 2012 TVS Motor Company Performance Highlights Quarterly highlights (Standalone) Y/E March (` cr) 2QFY13 2QFY12 % chg (yoy) 1QFY13 % chg (qoq) Net Sales 1,691
2QFY2013 Result Update Automobile November 1, 2012 TVS Motor Company Performance Highlights Quarterly highlights (Standalone) Y/E March (` cr) 2QFY13 2QFY12 % chg (yoy) 1QFY13 % chg (qoq) Net Sales 1,691
GAIL India NEUTRAL. Performance Highlights CMP. `363 Target Price - 2QFY2013 Result Update Oil & Gas. Investment Period -
 2QFY2013 Result Update Oil & Gas October 26, 2012 GAIL India Performance Highlights Quarterly highlights (Standalone) Y/E March (` cr) 2QFY2013 2QFY2012 % chg (yoy) 1QFY2013 % chg (qoq) Net sales 11,361
Bharat Forge. Result Update. Q4FY13 Result Highlights. Valuation. No Respite in Sight May 29, Institutional Research 1
 [ Result Update Equity India Forging & Industrials Bharat Forge Ltd. No Respite in Sight May 29, 2013 CMP (`) Target (`) 241 238 Potential Upside Absolute Rating (1.24)% HOLD Market Info (as on May 28,
Apollo Micro Systems Ltd
 IPO Note Financials Jan 08, 2018 Apollo Micro Systems Ltd Incorporated in 1997, Apollo Micro Systems Limited (AMSL) is a Hyderabad based company engaged in the business of electronic, electro-mechanical,
Suprajit Engineering. Synergies to accrue BUY COMPANY UPDATE 16 SEP 2016
 COMPANY UPDATE 16 SEP 016 Suprajit Engineering INDUSTRY AUTOS CMP(as on 15 Sept 016) Rs 199 Target Price Rs 4 Nifty 8,743 Sensex 8,413 KEY STOCK DATA Bloomberg SEL IN No. of Shares (mn) 131 MCap (Rsbn)
Autoline Industries Ltd.
 Autoline Industries Ltd. CMP 151.7 TARGET 193.0 Buy Sensex 19,091.2 Nifty 5,729.1 STOCK DETAILS Sector Auto Ancillary Market Cap. (Rs Cr) 185.1 Beta 0.7 52 Week High/Low 279.8/106.0 Face Value (Rs) 10
Wipro. 3QFY18 Result Update. Still not of the woods, maintain Hold. Sector: Technology CMP: ` 328. Recommendation: Hold
 Wipro 3QFY18 Result Update Still not of the woods, maintain Hold Sector: Technology CMP: ` 328 Recommendation: Hold Market statistics Current stock price (`) 328 Shares O/S (cr.) 452.3 Mcap (` cr) 148,571
KEI Industries BUY. Performance Update. Target Price. 3QFY2018 Result Update Cable. Historical share price chart. Key Financials
 3QFY2018 Result Update Cable January 25, 2018 KEI Industries Performance Update Y/E March (` cr) 3QFY18 3QFY17 % yoy 2QFY18 % qoq Net sales 889 715 24 749 19 EBITDA 84 77 10 76 11 EBITDA margin (%) 9.5
MRF BUY. Performance Highlights. CMP `40,703 Target Price `47,548. 1QSY2015 Result Update Tyre
 1QSY2015 Result Update Tyre February 13, 2015 MRF Performance Highlights Y/E Sept. (` cr) 1QSY2015 1QSY2014 % chg (yoy) 4QSY2014 % chg (qoq) Net sales 3,353 3,201 4.8 3,361 (0.2) EBITDA 626 419 49.5 608
Wipro. 4QFY18 Result Update. Still not of the woods, maintain Hold. Sector: Technology CMP: ` 287. Recommendation: Hold
 Wipro 4QFY18 Result Update Still not of the woods, maintain Hold Sector: Technology CMP: ` 287 Recommendation: Hold Market statistics Current stock price (`) 287 Shares O/S (cr.) 452.3 Mcap (` cr) 129,927
Akzo Nobel India Ltd.
 Q2 FY16 RESULT ANALYSIS Akzo Nobel India Ltd. Waiting for revival in demand scenario Buy Nov 3, 2015 Akzo Nobel India Ltd. (AKZO) reported 8% YoY revenue growth in Q2FY16 mainly driven by increase in the
Company Research Report FAG Bearings India Ltd
 Stock Data Industry Automotive Market Cap (Rs.Mn) 36,499 CMP Rs.2373 Stock Return Year 50% to Date BSE-Sensex Return 16.12% Year to Date EPS(Annualised) 96.87 (CY14E) P/E (CY14E) 24.5 Recommendation -
Rallis India NEUTRAL. Performance Highlights CMP. `215 Target Price - 3QFY2017 Result Update Agrichemical. Investment Period - 3-year price chart
 3QFY2017 Result Update Agrichemical January 25, 2017 Rallis India Performance Highlights Y/E March (` cr) 3QFY2017 2QFY2017 % chg (qoq) 3QFY2016 % chg (yoy) Net sales 326 540 (39.7) 306 6.5 Other income
PEER GROUPS CMP MARKET CAP EPS P/E (X) P/BV(X) DIVIDEND Company Name (Rs.) Rs. in mn. (Rs.) Ratio Ratio (%)
 P/BV(X) DIVIDEND Company Name (Rs.) Rs. in mn. (Rs.) Ratio Ratio (%)") BUY CMP 2125.00 Target Price 2330.00 CERA SANITARYWARE LTD Result Update (PARENT BASIS): Q1 FY16 JULY 15 th 2015 ISIN: INE739E01017 Index Details Stock Data Sector Furniture & Furnishing BSE Code 532443
BUY CMP 2125.00 Target Price 2330.00 CERA SANITARYWARE LTD Result Update (PARENT BASIS): Q1 FY16 JULY 15 th 2015 ISIN: INE739E01017 Index Details Stock Data Sector Furniture & Furnishing BSE Code 532443
PEER GROUPS CMP MARKET CAP EPS P/E (X) P/BV(X) DIVIDEND Company Name (Rs.) Rs. in mn. (Rs.) Ratio Ratio (%)
 P/BV(X) DIVIDEND Company Name (Rs.) Rs. in mn. (Rs.) Ratio Ratio (%)") BUY CMP 1189.45 Target Price 1350.00 CUMMINS INDIA LTD Result Update (PARENT BASIS): Q1 FY16 AUGUST 10 th, 2015 ISIN: INE298A01020 Index Details Stock Data Sector Industrial Machinery BSE Code 500480 Face
BUY CMP 1189.45 Target Price 1350.00 CUMMINS INDIA LTD Result Update (PARENT BASIS): Q1 FY16 AUGUST 10 th, 2015 ISIN: INE298A01020 Index Details Stock Data Sector Industrial Machinery BSE Code 500480 Face
Bajaj Auto Ltd Scoring on investments
 Bajaj Auto Ltd Scoring on investments BSE Code 500490 NSE Code BAJAJAUTO Bloomberg Code BJA@IN Face Value 10 CMP Rs 850 Market Cap Rs 86000mn Share Holding Pattern 1% 24% 29% Promoters/ associates NRI/OCB/Banks
CCL Products BUY. Brewing Steadily. CMP Target Price `300 `360. Initiating Coverage Coffee. January 4, year price chart
 5-Jan 5-Apr 5-Jul 5-Oct 5-Jan 5-Apr 5-Jul 5-Oct 5-Jan 5-Apr 5-Jul 5-Oct CCL Products Brewing Steadily CCL Products Limited (CCL) is the largest Indian manufacturer and exporter of instant coffee. With
Tech Mahindra. 1QFY18 Result Update. Steps in the right direction, compelling valuation. Sector: Technology CMP: ` 385. Recommendation: Buy
 Tech Mahindra 1QFY18 Result Update Steps in the right direction, compelling valuation Sector: Technology CMP: ` 385 Recommendation: Buy Market statistics Current stock price (`) 385 Shares O/S (cr.) 97.5
Bharat Forge Ltd. Rating: BUY. Auto Ancillaries. Bharat Forge STOCK IDEA
 Bharat Forge Ltd. Auto Ancillaries Date Jul 23, 2014 CMP (Rs.) 708 Target (Rs.) 828 Potential Upside 17% BSE Sensex 26026 NSE Nifty 7768 Scrip Code Bloomberg BHFC IN Reuters BFRG.BO BSE Group A BSE Code
Rallis India NEUTRAL. Performance Highlights CMP. `237 Target Price - 1QFY2018 Result Update Agrichemical. Investment Period - 3-year price chart
 Jan-12 Jul-12 Jan-13 Jul-13 Jan-14 Jul-14 Jan-15 Jul-15 Jan-16 Jul-16 Jan-17 1QFY2018 Result Update Agrichemical July 26, 2017 Rallis India Performance Highlights Y/E March (` cr) 1QFY2018 4QFY2017 % chg
KEI Industries BUY. Performance Update. CMP Target Price `433 `508. 4QFY2018 Result Update Cable. Historical share price chart.
 May- Aug- Oct-15 Jan-16 Apr-16 Jul-16 Oct-16 Jan-17 Apr-17 Jul-17 Oct-17 Jan-18 Apr-18 4QFY2018 Result Update Cable May 21, 2018 KEI Industries Performance Update Y/E March (` cr) 4QFY18 4QFY17 % yoy 3QFY18
INDIA NIPPON ELECTRICALS LTD Result Update (PARENT BASIS): Q3 FY18
: Q3 FY18") INDIA NIPPON ELECTRICALS LTD Result Update (PARENT BASIS): Q3 FY18 Index Details Stock Data Sector Auto Parts & Equipment BSE Code 532240 Face Value 10.00 52wk. High / Low (Rs.) 1424.80/505.00 Volume (2wk.
INDIA NIPPON ELECTRICALS LTD Result Update (PARENT BASIS): Q3 FY18 Index Details Stock Data Sector Auto Parts & Equipment BSE Code 532240 Face Value 10.00 52wk. High / Low (Rs.) 1424.80/505.00 Volume (2wk.
Garware Wall Ropes ACCUMULATE. Performance Highlights CMP. `550 Target Price `618. 2QFY2017 Result Update Textile. Investment Period 12 months
 2QFY217 Result Update Textile November 16, 216 Garware Wall Ropes Performance Highlights Quarterly Data (`cr) 2QFY17 2QFY16 % yoy 1QFY17 % qoq Revenue 232 214 8.5 225 3.3 EBITDA 4 26 5.9 31 29.4 Margin
Religare Investment Call
 BUY CMP (Rs) Target Price (Rs) Potential Upside Sensex Nifty Key Stock data BSE Code NSE Code Bloomberg Shares o/s, Cr (FV 2) Market Cap (Rs Cr) 3M Avg Volume 52 week H/L Shareholding Pattern (%) Promoter
Honeywell Automation India Ltd
 4 Recommendation SUBSCRIBE SUBSCRIBE FROM A LONG TERM VIEW CMP (14/12/2012) Rs. 2,335 Target Price Sector Stock Details N/A Automation BSE Code 500033 NSE Code Bloomberg Code HONAUT HWA IN Market Cap (Rs
Bharat Dynamics Ltd SUBSCRIBE. Issue Open: Mar 13, 2018 Issue Close: Mar 15, IPO Note Defence. Key Financials
 IPO Note Defence Mar 09, 2018 Bharat Dynamics Ltd Incorporated in 1970, Bharat Dynamics Limited (BDL), a Government of India (GOI) Enterprise under the Ministry of Defense (MOD) was established in Hyderabad
SpiceJet ACCUMULATE. Performance Highlights. 4QFY2010 Result Update I Aviation
 4QFY2010 Result Update I Aviation June 3, 2010 SpiceJet Performance Highlights For 4QFY2010, SpiceJet s Top-line grew 34.3% yoy but fell 12.8% qoq to Rs560cr, slightly lower than our estimate of Rs590cr.
Amber Enterprises India Ltd
 3QFY2019 Result Update Consumer Durable February 16, 2019 Amber Enterprises India Ltd Performance Update (` cr) 3QFY19 3QFY18 % yoy 2QFY19 % qoq Revenue 388.8 338.4 14.9 226.3 71.8 EBITDA 22.1 24.1 (8.2)
Rallis India NEUTRAL. Performance Highlights CMP. `242 Target Price - 4QFY2017 Result Update Agrichemical. Investment Period - 3-year price chart
 Jan-12 Jul-12 Jan-13 Jul-13 Jan-14 Jul-14 Jan-15 Jul-15 Jan-16 Jul-16 Jan-17 4QFY2017 Result Update Agrichemical May 2, 2017 Rallis India Performance Highlights Y/E March (` cr) 4QFY2017 3QFY2017 % chg
PNB Housing Finance Ltd. Robust play in Indian HFC sector SUBSCRIBE 24th Oct, 2016
 PNB Housing Finance Ltd. Robust play in Indian HFC sector SUBSCRIBE 24th Oct, 2016 PNB Housing Finance Ltd (PNBHFL) is the fifth largest housing finance company (in terms of loan portfolio) and the second
Maruti Suzuki (MSIL IN)
") (MSIL IN) Rating: BUY CMP: Rs6,513 TP: Rs7,600 January 28, 2019 Q3FY19 Result Update Change in Estimates Target Reco Change in Estimates Current Previous FY20E FY21E FY20E FY21E Rating BUY BUY Target Price
(MSIL IN) Rating: BUY CMP: Rs6,513 TP: Rs7,600 January 28, 2019 Q3FY19 Result Update Change in Estimates Target Reco Change in Estimates Current Previous FY20E FY21E FY20E FY21E Rating BUY BUY Target Price
Minda Industries Ltd.
 Recommendation BUY Riding On Growth!!! CMP 810 Target Price 1,193 Sector Stock Details Auto Parts & Equipment BSE Code 532539 NSE Code Bloomberg Code MINDAIND MNDA IN Market Cap (Rs cr) 1,284 Free Float
Key estimate revision. Year FY14 23,28,609 3,48,027 1,40, FY15E 25,74,029 3,94,133 1,69,
 : price: EPS: How does our one year outlook change? We retain our positive stance on TTMT driven by continued strong performance at JLR on both revenues & margins and expected reduction in losses at standalone
ACC NEUTRAL. Performance Highlights. CMP `1,261 Target Price - 4QCY2012 Result Update Cement. Quarterly results (Standalone) Investment Period -
 Investment Period -") 4QCY2012 Result Update Cement February 11, 2013 ACC Performance Highlights Quarterly results (Standalone) Y/E Dec. (` cr) 4QCY2012 3QCY2012 % chg qoq 4QCY2011 % chg yoy Net sales 3,099 2,445 26.8 2,503
4QCY2012 Result Update Cement February 11, 2013 ACC Performance Highlights Quarterly results (Standalone) Y/E Dec. (` cr) 4QCY2012 3QCY2012 % chg qoq 4QCY2011 % chg yoy Net sales 3,099 2,445 26.8 2,503
Music Broadcast BUY. Performance Update. CMP Target Price `293 `475. 3QFY2019 Result Update Media. Stock Info Sector Market Cap (Rs cr) Media
 Media") Mar-17 May-17 Jul-17 Sep-17 Nov-17 Jan-18 Mar-18 May-18 Jul-18 Sep-18 Nov-18 Jan-19 3QFY2019 Result Update Media January 31, 2019 Music Broadcast Performance Update Y/E March (` cr) 3QFY19 3QFY18 % yoy
Mar-17 May-17 Jul-17 Sep-17 Nov-17 Jan-18 Mar-18 May-18 Jul-18 Sep-18 Nov-18 Jan-19 3QFY2019 Result Update Media January 31, 2019 Music Broadcast Performance Update Y/E March (` cr) 3QFY19 3QFY18 % yoy
Minda Corporation Ltd. 29 th December, 2015 BUY
 Company Report BROKING DEPOSITORY DISTRIBUTION FINANCIAL ADVISORY Minda Corporation Ltd. 29 th December, 2015 BUY CMP Rs.89.40 Target Price Rs.120.00 BSE Code 538962 Market Cap (Rs Cr.) 1871.14 52 Week
Fineotex Chemical Ltd
 Company Update Decent Performance under Macroeconomic Pressure; Business Traction to Continue: Fineotex Chemical recorded decent set of result as consolidated sales grew by 1.1% YoY (largely in line) to
L&T Infotech Limited
 IPO NOTE Key Details: July 5, 2016 Issue Key Highlights: Price*: `705 - `710 Issue Opens: 11 th July 2016 Issue Size*: `1228 - `1236 Cr Issue Close: 13 th July 2016 *A discount of Rs.10/- per share will
Music Broadcast BUY. Performance Update. CMP Target Price `329 `475. 2QFY2019 Result Update Media. Historical share price chart.
 Mar-17 May-17 Jul-17 Sep-17 Nov-17 Jan-18 Mar-18 May-18 Jul-18 Sep-18 2QFY2019 Result Update Media November 3, 2018 Music Broadcast Performance Update Y/E March (` cr) 2QFY19 2QFY18 % yoy 1QFY19 % qoq