Company Overview. Financial Performance
|
|
|
- Barnard Benson
- 6 years ago
- Views:
Transcription
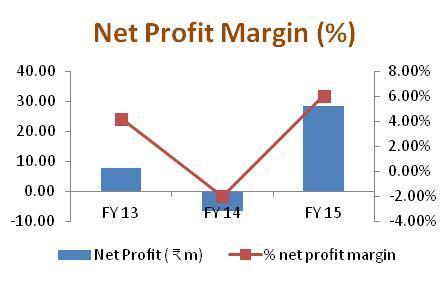
1 Apr/15 May/15 Jun/15 Jul/15 Aug/15 Sep/15 Oct/15 Nov/15 Dec/15 Jan/16 Feb/16 Mar/16 Monarch Networth Capital Limited CMP: March 23, 2016 Stock Details BSE code BSE ID MONARCH Face value ( ) 10 No of shares (m) week H/L 51.80/25.00 Market cap ( m) days avg vol (No) 2,172 Free float ( m) Stock performance (%) 1M 3M 12M Absolute -6.83% % -0.87% Rel. to Sensex -13.1% -37.2% 9.7% Shareholding Pattern* (%) Promoters FIIs DIIs Others 66.77% 0.0% 0.0% 33.23% *As of December 2015 Relative Chart Monarch Networth Stock Broking Limited Sensex 30,000 29,000 28,000 27,000 26,000 25,000 24,000 23,000 22,000 Company Overview Monarch Networth Capital Ltd is a financial services and information providing firm. The company is engaged in providing stock broking, management services, market maker services, depository and merchant banking services to institutional and retail clients in India. Industry Overview India s diversified financial services sector is witnessing swift expansion, both in terms of strong growth of incumbent financial services firms and new players entering the market. All financial entities constitutes to financial services sector. According to the India Brand Equity Foundation it s been noticed that the country s gross domestic savings (GDS) as a percentage of Gross Domestic Product (GDP) has remained above 30 per cent since 2004 and it is expected to reach $1,272 billion by Financial Performance Monarch Networth Capital Ltd revenues from operations for FY 15 rose 42.9% to million compared to million in the previous year. The company has reported a net profit of 28.5 million in FY 15, representing 529.1% gain when compared to the loss of 6.6 million in FY 14. On Q-o-Q basis Monarch Networth Capital Ltd revenues increased 1.3% to million in Q3 16 from million in Q3 15. Table1: Key Financials (Y/e March) FY 13 FY 14 FY 15 3Q FY15 3Q FY 16 Sales ( m) YoY Growth (%) -6.9% 77.0% 42.9% 183.7% 1.3% EBITDA ( m) Source: Bloomberg EBITDA Margin 18.5% 20.1% 28.1% 24.4% 18.8% PAT ( m) 7.8 (6.6) EPS ( ) 0.69 (0.59) YoY Growth (%) 127.2% % 259.3% 160.5% -82.6% Source: Company, Karvy Investment Advisory *Auditors opinion; = Qualified Qualified; When auditors have concerns about accounting treatment of financial items. Unqualified; When auditors find accounting treatment of financial items is in compliance with respect to accounting standards. 1
2 Background and Business Description Monarch Networth Capital Ltd is engaged in the business of offering financial services to institutional and retail clients in India, which include stock broking, management services, market maker services, depository and merchant banking services. The company has its presence in 350 centers across India and approximately serving 100,000 clients. Key Strengths Diversified service offerings Risks & Concerns Intense competition Economic slowdown Board of Directors Table 2: Composition of Board Name Mr. Suresh P. Jain Mr. Manish Ajmera Mr. Mohit Agrawal Mr. Praveen Toshniwal Mr. Sanjay Motta Mr. Randhir Singh Sisodiya Source: Company Relation with Company Chairman Executive Director & CFO Independent Director Independent Director Independent Director Executive Director 2
3 Industry Overview India s financial services sector has been an important contributor to the country s gross domestic product (GDP) accounting for nearly 6 per cent share in It consists of the capital markets, insurance sector and non-banking financial companies (NBFCs). As per a joint report by KPMG-CII, the country is projected to become the fifth largest banking sector globally by The Government of India has implemented several reforms to liberalize, regulate and enhance this industry. The Government and the Reserve Bank of India (RBI) have taken various measures to facilitate easy access to finance for micro, small and medium enterprises (MSMEs). These measures include launching credit guarantee fund scheme for micro and small enterprises, issuing guideline to banks regarding collateral requirements and setting up a Micro Units Development and Refinance Agency (MUDRA). The combined support from both government and private sector is paving the way for India to prevail as one of the world's most vibrant capital markets. According to India Brand Equity Foundation, the asset management industry in India is deemed to be one among the fastest growing industries in the world. Total assets under management (AUM) of the mutual fund industry grew at a robust compound annual growth rate (CAGR) of 12.05% over FY07-15 to reach $179.6 billion. Corporate investors hold around 45.9% of total AUM in India, while high net worth individuals (HNWI) and retail investors accounts for 28.6% and 22.9%, respectively. In recent years, the India s equity market turnover has witnessed a significant increase. The annual turnover value on the National Stock Exchange (NSE) clocked a CAGR of 20.7% between FY 96 FY 15 to reach $718 billion. It is also noted that there have been about 360 million insurance policies are already in place and expects the policies to witness a compounded annual growth rate (CAGR) of 12-15% over the next five years to touch $ billion by 2020, India s life insurance sector is the biggest in the world. Competition analysis Company CMP ( ) Mcap ( m) Rev ( m) OPM (%) EPS ( ) PE (x) Monarch Networth Capital Ltd % Arihant Capital Markets Ltd % Edelweiss Financial Services Ltd , , % Source: BSE 3
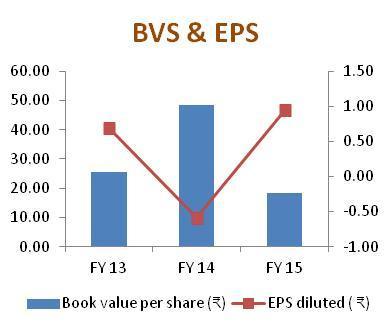
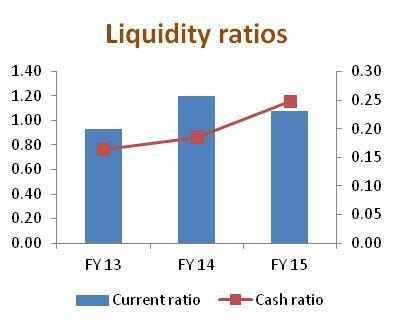
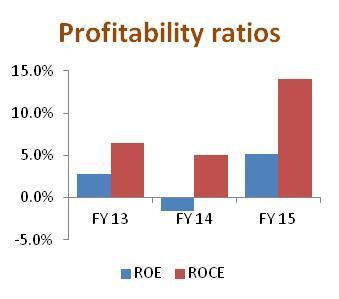
4 Financial Analysis For the period ending 31 March, 2015, Monarch Networth Capital Ltd reported revenues of million, representing 42.9% increase when compared to the revenues in FY 14. The company s EBITDA stood at million in FY 15 and its EBITDA margin improved 800 bps to 28.1% in FY 15 compared to 20.1% in the previous year. Year end March FY 13 FY 14 FY 15 Income statement ( million) Revenue % growth -6.9% 77.0% 42.9% EBITDA % EBITDA margin 18.5% 20.1% 28.1% Depreciation and amortisation EBIT Interest PBT 2.9 (20.5) 44.4 Tax (credit) expense (4.9) (13.8) 15.8 Net profit 7.8 (6.6) 28.5 % growth net profit 127.3% % 529.1% Balance sheet ( million) Shareholder fund Long term liabilities Current liabilities Fixed assets Current assets Cash & cash equivalents Cash flow statement Cash flow operations Cash flow from investing Cash flow from financing Per share data EPS ( ) CEPS ( ) DPS ( ) NA NA NA BVPS ( ) Financial Ratios % ROE 2.8% -1.6% 5.2% ROCE 6.4% 5.0% 14.0% Debt/Equity 0.0% 31.4% 28.2% Interest coverage ratio Current ratio Cash ratio Source: Company, Karvy Investment Advisory 4


5 Financial Snapshot Source: Karvy Investment Advisory 5
6 DISCLAIMER Karvy Investment Advisory Services Ltd (KIASL), an entity of the Karvy Group, has taken utmost care to ensure accuracy and objectivity while writing this report based on publicly available information or from sources considered reliable. However, neither the accuracy nor completeness of information contained in this report is guaranteed. Opinions expressed herein are our current opinions as on the date of this report. Nothing in this report can be construed as either investment or any other advice or any solicitation, whatsoever. The subscriber/user assumes the entire risk of any use made of this report or data herein. KIASL specifically states that it or any of its entities or employees do not have any financial liabilities whatsoever to the subscribers / users of this report. This report is for personal information of the authorized recipient in India only. This report or any part of it should not be reproduced or redistributed or communicated directly or indirectly in any form to any other person or published or copied for any purpose. DISCLOSURE Associates of KIASL might have received compensation from the subject company mentioned in the report during the period preceding twelve months from the date of this report for investment banking or merchant banking or brokerage services from the subject company in the past twelve months or for services rendered as stock broker, Registrar and Share Transfer Agent, Commodity Broker, Currency and forex broker, merchant banker and underwriter, Investment Advisory services, insurance repository services, consultancy and advisory services, realty services, data processing, profiling and related services or in any other capacity. KIASL encourages independence in research report preparation and strives to minimize conflict in preparation of research report. Compensation of KIASL Research Analysts is not based on any specific merchant banking, investment banking or brokerage service transactions. KIASL generally prohibits its analysts, persons reporting to analysts and their relatives from maintaining a financial interest in the securities or derivatives of any companies that the analysts cover. KIASL and/or its subsidiaries and /or its group companies collectively or Research Analysts do not own 1% or more of the equity securities of the Company mentioned in the report as of the last day of the month preceding the publication of the research report. KIASL or its analysts did not receive any compensation or other benefits from the companies mentioned in the report or third party in connection with preparation of the research report and have no financial interest in the subject company mentioned in this report. Accordingly, neither KIASL nor Research Analysts have any material conflict of interest at the time of publication of this report. It is confirmed that KIASL and Research Analysts primarily responsible for this report and whose name(s) is/ are mentioned therein of this report have not received any compensation from the subject company mentioned in the report in the preceding twelve months. PUBLISHED BY KIASL is a part of the Karvy Group, a premier integrated financial services provider. We offer a wide array of investment advisory services including Comprehensive Financial Planning, Wealth Review and Investment Strategy services, Equity Review and Investment Strategy, Mutual Fund Review and Investment Strategy, Wealth Advice Package, and Wealth Planning for Retired Individuals. Head Office: 46, Avenue 4, Street No.1, Banjara Hills, Hyderabad, , Telangana, India. Tel:
Company Overview. Financial Performance
 Feb/15 Mar/15 Apr/15 May/15 Jun/15 Jul/15 Aug/15 Sep/15 Oct/15 Nov/15 Dec/15 Jan/16 CMP: 32.30 February 11, 2016 Stock Details BSE code 526558 BSE ID JAMEHOT Face value ( ) 10 No of shares (m) 8.0 52 week
Company Overview. Industry Overview. Financial Performance
 Feb/15 Mar/15 Apr/15 May/15 Jun/15 Jul/15 Aug/15 Sep/15 Oct/15 Nov/15 Dec/15 Jan/16 Trade Wings Limited CMP: 105.00 January 29, 2016 Stock Details BSE code 509953 BSE ID TRADWIN Face value ( ) 10 No of
Company Overview. Financial Performance
 Feb/15 Mar/15 Apr/15 May/15 Jun/15 Jul/15 Aug/15 Sep/15 Oct/15 Nov/15 Dec/15 Jan/16 Eastern Treads Ltd CMP: 91.20 February 11, 2016 Stock Details BSE code 531346 BSE ID EASTRED Face value ( ) 10 No of
Company Overview. Industry Overview. Financial Performance
 Jan/15 Feb/15 Mar/15 Apr/15 May/15 Jun/15 Jul/15 Aug/15 Sep/15 Oct/15 Nov/15 Dec/15 CMP: 27.80 January 20, 2016 Stock Details BSE code 534623 BSE ID JUPITERIN Face value ( ) 10 No of shares (m) 10 52 week
Company Overview. Financial Performance
 Jan-15 Feb-15 Mar-15 Apr-15 May-15 Jun-15 Jul-15 Aug-15 Sep-15 Oct-15 Nov-15 Dec-15 Anisha Impex Ltd CMP: 11.85 December 31, 2015 Stock Details BSE code 537785 BSE ID Face value ( ) 10 No of shares (m)
Company Overview. Financial Performance
 CMP: 14.00 February 11, 2016 Stock Details BSE code 521167 BSE ID FRONTBUSS Face value ( ) 5 No of shares (m) 21.3 52 week H/L 31.3/12.1 Market cap ( m) 298.5 30 days avg vol (No) 42,670 Free float ( m)
Company Overview. Financial Performance
 Jan/15 Feb/15 Mar/15 Apr/15 May/15 Jun/15 Jul/15 Aug/15 Sep/15 Oct/15 Nov/15 Dec/15 KMC Speciality Hospitals India Ltd CMP: 7.61 January 21, 2015 Stock Details BSE code 524520 BSE ID KMCSHIL Face value
Company Overview. Financial Performance
 Dec-14 Jan-15 Feb-15 Mar-15 Apr-15 May-15 Jun-15 Jul-15 Aug-15 Sep-15 Oct-15 Nov-15 Nimbus Projects Limited CMP: 34. December 4, 15 Stock Details BSE code 511714 BSE ID NIMBSPROJ Face value ( ) 1 No of
Company Overview. Industry Overview. Financial Performance
 CMP: 6.31 January 25, 2016 Stock Details BSE code 533100 BSE ID PEIL Face value ( ) 10 No of shares (m) 41 52 week H/L 17.70/4.03 Market cap ( m) 261 30 days avg vol (No) 1,156 Free float ( m) 89 Stock
Company Overview. Financial Performance
 Dec-14 Jan-15 Feb-15 Mar-15 Apr-15 May-15 Jun-15 Jul-15 Aug-15 Sep-15 Oct-15 Nov-15 CMP: 25.20 December 30, 2015 Stock Details BSE code 524440 BSE ID CAMEXLTD Face value ( ) 10 No of shares (m) 10.2 52
Company Overview. Financial Performance
 Jan/15 Feb/15 Mar/ Apr/15 May/ Jun/15 Jul/15 Aug/15 Sep/15 Oct/15 Nov/ Dec/15 Parnax Lab Limited CMP: 53.90 January 08, 2016 Stock Details BSE code 506128 BSE ID PARNAXLAB Face value ( ) 10 No of shares
Company Overview. Industry Overview. Financial Performance
 Feb/15 Mar/15 Apr/15 May/15 Jun/15 Jul/15 Aug/15 Sep/15 Oct/15 Nov/15 Dec/15 Jan/16 Chemtech Industrial Valves Limited CMP: 25.00 February 02, 2016 Company Overview Stock Details BSE code 537326 BSE ID
Company Overview. Financial Performance
 Dec-14 Jan-15 Feb-15 Mar-15 Apr-15 May-15 Jun-15 Jul-15 Aug-15 Sep-15 Oct-15 Nov-15 Superior Industrial Enterprises Limited CMP: 19.6 December 24, 215 Stock Details BSE code 519234 BSE ID SIEL Face value
Company Overview. Financial Performance
 Jan-15 Feb-15 Mar-15 Apr-15 May-15 Jun-15 Jul-15 Aug-15 Sep-15 Oct-15 Nov-15 Dec-15 Jan-16 Shri Jagdamba Polymers Ltd. CMP: 44.2 January 15, 216 Stock Details BSE code 512453 BSE ID SHRJAGP Face value
Company Overview. Industry Overview. Financial Performance
 Jan/15 Feb/15 Mar/15 Apr/15 May/15 Jun/15 Jul/15 Aug/15 Sep/15 Oct/15 Nov/15 Dec/15 CMP: 6.22 January 18, 2016 Stock Details BSE code 526735 BSE ID EXCAST Face value ( ) 2 No of shares (m) 41 52 week H/L
Company Overview. Financial Performance
 Jan-15 Feb-15 Mar-15 Apr-15 May-15 Jun-15 Jul-15 Aug-15 Sep-15 Oct-15 Nov-15 Dec-15 Consolidated Securities Ltd CMP: 78 December 31, 2015 Stock Details BSE code 530067 BSE ID CNSDSEC Face value (र ) 10
Company Overview. Industry Overview. Financial Performance
 CMP: 30.50 January 29, 2016 Stock Details BSE code 537669 BSE ID SIVI Face value ( ) 10 No of shares (m) 6 52 week H/L 49.50/20 Market cap ( m) 175 30 days avg vol (No) 300 Free float ( m) 49 Stock performance
Company Overview. Financial Performance
 Jan-15 Feb-15 Mar-15 Apr-15 May-15 Jun-15 Jul-15 Aug-15 Sep-15 Oct-15 Nov-15 Dec-15 CMP: 31.25 December 24, 2015 Stock Details BSE code 523878 BSE ID TOTEX Face value ( ) 10 No of shares (m) 8.1 Market
Company Overview. Financial Performance
 CMP: 7.89 January 28, 2016 Stock Details BSE code 539046 BSE ID MNKCMILTD Face value ( ) 1 No of shares (m) 66 52 week H/L 18.85/2.33 Market cap ( m) 261 30 days avg vol (No) 12,435 Free float ( m) 89
Company Overview. Financial Performance
 Jan/15 Feb/15 Mar/15 Apr/15 May/15 Jun/15 Jul/15 Aug/15 Sep/15 Oct/15 Nov/15 Dec/15 CMP: 43.00 January 11, 2015 Stock Details BSE code 526301 BSE ID MEDINOV Face value ( ) 10 No of shares (m) 9 52 week
Company Overview. Financial Performance
 Jan-15 Feb-15 Mar-15 Apr-15 May- Jun-15 Jul-15 Aug-15 Sep-15 Oct-15 Nov-15 Dec-15 TCM Limited CMP: 9.25 January 7, 216 Stock Details BSE code 524156 BSE ID TCMLMTD Face value ( ) 1 No of shares (m) 3.39
Fineotex Chemical Ltd
 Company Update Decent Performance under Macroeconomic Pressure; Business Traction to Continue: Fineotex Chemical recorded decent set of result as consolidated sales grew by 1.1% YoY (largely in line) to
Visaka Industries Ltd
 Company Update Superior Product Mix & New Age Markets to Aid Growth New investments to aid growth: Visaka continues to give a good set of numbers. YoY EPS grew at 142% aided by a revenue growth of 1.5%
SQS India BFSI Ltd HOLD. Impact of Macro Headwinds Still Hurting; Revenue from US May Pick up in FY18E
 Company Update Impact of Macro Headwinds Still Hurting; Revenue from US May Pick up in FY18E EBITDA Margins recovered by 618 bps QoQ: The company has witnessed many challenges over the year FY17 starting
Cummins India Ltd Bloomberg Code: KKC IN
 Company Update Margins Under Pressure; Domestic Recovery Underway Half-yearly revenue was flat; margins were under pressure: Cummins India revenue, EBITDA and PAT for H1FY17 reached to Rs.24,784mn, Rs.4,649mn
Hindustan Unilever (RHS)
") Jul-14 Aug-14 Oct-14 Nov-14 Dec-14 Feb-15 Mar-15 Apr-15 Jun-15 Jul-15 India Research FMCG July 22, 2015 QUARTERLY REVIEW Bloomberg: HUVR IN Reuters: HLL.BO SELL Higher A&P drove volume growth HUL s Q1FY16
Jul-14 Aug-14 Oct-14 Nov-14 Dec-14 Feb-15 Mar-15 Apr-15 Jun-15 Jul-15 India Research FMCG July 22, 2015 QUARTERLY REVIEW Bloomberg: HUVR IN Reuters: HLL.BO SELL Higher A&P drove volume growth HUL s Q1FY16
Ahluwalia Contracts (India)
") May-14 Jul-14 Aug-14 Sep-14 Oct-14 Dec-14 Jan-15 Feb-15 Apr-15 May-15 India Research Infrastructure May 22, 215 QUARTERLY REVIEW Bloomberg: AHLU IN Reuters: AHLU.BO BUY Better performance ahead ACIL posted
May-14 Jul-14 Aug-14 Sep-14 Oct-14 Dec-14 Jan-15 Feb-15 Apr-15 May-15 India Research Infrastructure May 22, 215 QUARTERLY REVIEW Bloomberg: AHLU IN Reuters: AHLU.BO BUY Better performance ahead ACIL posted
Simplex Infrastructures
 May-14 Jul-14 Aug-14 Sep-14 Nov-14 Dec-14 Jan-15 Mar-15 Apr-15 May-15 India Research Infrastructure May 27, 2015 QUARTERLY REVIEW Bloomberg: SINF IN Reuters: SINF.BO HOLD Working capital ease to improve
HCC BUY. Infrastructure April 10, QIP step in the right direction EVENT UPDATE. India Research. Bloomberg: HCC IN Reuters: HCNS.
 Jan-14 Mar-14 Apr-14 May-14 Jul-14 Aug-14 Sep-14 Nov-14 Dec-14 Jan-15 India Research Infrastructure April 10, 2015 EVENT UPDATE Bloomberg: IN Reuters: HCNS.BO BUY QIP step in the right direction has successfully
Punjab National Bank
 Nov-14 Dec-14 Jan-15 Mar-15 Apr-15 May-15 Jul-15 Aug-15 Sep-15 Nov-15 India Research Banking November 09, 2015 QUARTERLY REVIEW Bloomberg: PNB IN Reuters: PNBK.BO SELL Asset quality improves but recovery
Pidilite Industries Ltd
 Company Update De-stocking as an initial response to GST implementation caused subdued performance; Brighter long term business prospects ahead The company has recorded sales of Rs. 16693 Mn in as against
Vakrangee Ltd BUY. Speciality Retail. Company Update. Aug 07, Vakrangee Ltd. Recommendation (Rs.)
") Company Update Speciality Retail Addition of Service Offerings will Ramp up the Business PAT increased by 38.3% YoY on strong revenue growth: During Q1FY18, the revenue stood at Rs. 13047 Mn as against
Company Update Speciality Retail Addition of Service Offerings will Ramp up the Business PAT increased by 38.3% YoY on strong revenue growth: During Q1FY18, the revenue stood at Rs. 13047 Mn as against
Bharat Electronics Ltd
 Company Update Excellent Margins Led by Strong Revenue Growth Revenue Analysis: Total order backlog as on Oct 1, 216 stood at Rs. 347 Bn, out of this, export order back log is US$.1 Bn. Incremental orders
Bloomberg Code: ATA IN
 Auto OEM: 3-Wheelers Atul Feb Auto 03, 2015 Ltd India Research Stock Broking Bloomberg Code: ATA IN Stable quarter led by surge in exports volumes (TP revised ) : Operating revenue, EBITDA and PAT grew
Amber Enterprises India Ltd
 3QFY2019 Result Update Consumer Durable February 16, 2019 Amber Enterprises India Ltd Performance Update (` cr) 3QFY19 3QFY18 % yoy 2QFY19 % qoq Revenue 388.8 338.4 14.9 226.3 71.8 EBITDA 22.1 24.1 (8.2)
HOLD. Deleveraging story playing out RAMCO CEMENTS. Target Price: Rs 503. Q4 performance
 RAMCO S HOLD Target Price: Rs 503 Deleveraging story playing out Ramco Cements total debt reduced by a massive Rs 5 bn to Rs 22 bn in FY16. The company generated total EBITDA of Rs 11.5 bn in FY16 and
Company Overview. FY15 and recent performance. Company declared dividend of INR1.0 per share for FY15. Table 1: Key financials
 Comm. Trading & Distribution l SME Research Ricoh India Ltd. CMP: INR945.25 Stock data BSE code 517496 BSE ID RICOHQ Face value (INR) 10 No of shares (m) 39.8 Market cap (INRm) 37,590.9 3m avg. daily vol
Symphony Ltd. RESULT UPDATE 31st October 2017
 . RESULT UPDATE 31st October 2017 Oct-14 Apr-15 Oct-15 Apr-16 Oct-16 Apr-17 Oct-17 India Equity Institutional Research II Result Update Q2FY18 II 31st October 2017. CMP INR 1,465 Target INR 1,700 Potential
The Byke Hospitality Ltd
 Consumer Discretionary-Gaming, Lodging & Restaurants Bloomberg Code: BYKE IN India Research - Stock Broking Unique Asset Light Business Model Continues to Scale New Heights Room inventory addition to drive
Company Overview. FY15 and recent performance. Table 1: Key financials. Source: Company, Varhad Research
 Movies & Entertainment l BSE Research JMD Telefilms Industries Ltd. The Varhad Group CMP: INR2.82 Stock data BSE code 511092 BSE ID JMDTELEFILM Face value (INR) 1 No of shares (m) 144.3 Market cap (INRm)
Company Overview. FY15 and recent performance. The company has operating profit of INR65.2m in Q2FY16. Table 1: Key financials
 IT Software Products l BSE Research ABM Knowledgeware Ltd. The Varhad Group CMP: INR265.40 Stock data BSE code 531161 BSE ID ABMKNO Face value (INR) 10.0 No of shares (m) 10.0 Market cap (INRm) 2,654.3
Blue Star Ltd BUY. Performance Update. CMP Target Price `703 `867. 1QFY2019 Result Update Cons. Durable. 3-year price chart.
 Aug-15 Oct-15 Dec-15 Feb-16 Apr-16 Jun-16 Aug-16 Oct-16 Dec-16 Jan-17 Apr-17 May-17 Jul-17 Sep-17 Nov-17 Jan-18 Mar-18 May-18 Jul-18 1QFY2019 Result Update Cons. Durable August 10, 2018 Blue Star Ltd Performance
Garware Wall Ropes ACCUMULATE. Performance Highlights CMP. `550 Target Price `618. 2QFY2017 Result Update Textile. Investment Period 12 months
 2QFY217 Result Update Textile November 16, 216 Garware Wall Ropes Performance Highlights Quarterly Data (`cr) 2QFY17 2QFY16 % yoy 1QFY17 % qoq Revenue 232 214 8.5 225 3.3 EBITDA 4 26 5.9 31 29.4 Margin
Company Overview. FY15 and recent performance. In Q2FY16, revenue has increased by 18% YoY to INR801.8m. Table 1: Key financials
 Edible Oils l BSE Research Kriti Nutrients Ltd. CMP: INR20.90 Stock data BSE code 533210 BSE ID KRITINUT Face value (INR) 1 No of shares (m) 50.1 Market cap (INRm) 1,047.2 3m avg. daily vol (No) 23,990.3
ITC Ltd. RESULT UPDATE 27th October, 2017
 . RESULT UPDATE 27th October, 2017 Oct-14 Apr-15 Oct-15 Apr-16 Oct-16 Apr-17 Oct-17 India Equity Institutional Research II Result Update - II 27th October, 2017 CMP INR 269 Target INR 349 Potential Upside
Maruti Suzuki India Ltd.
 Nov-17 Dec-17 Jan-18 Feb-18 Mar-18 Apr-18 May-18 Jun-18 Jul-18 Aug-18 Sep-18 Oct-18 Nov-18. Volume No.. I Issue No. 192 Maruti Suzuki India Ltd. November 19, 2018 BSE Code: 532500 NSE Code: MARUTI Reuters
Adani Ports & SEZ Rating: Target price: EPS:
 Adani Ports & SEZ : price: EPS: Volume traction continues in a seasonally good quarter; maintain Adani Ports & SEZ reported a good quarter with total operating revenues (standalone) of Rs. 8.02bn and PAT
MCX Ltd. Rating: Target price: EPS: Tepid volume growth continues. Target. Rating CMP. Rs. 1,080 SELL. Rs. 1,176
 : price: EPS: Tepid volume growth continues 4QFY15 traded volumes in MCX showed a small improvement sequentially whereas declined yoy. FY15 traded Values are at a sever year low. We retain our cautious
Company Overview. FY15 and recent performance. Table 1: Key financials. Source: Company, Varhad Research
 Plastic Products l BSE Research Caprihans India Ltd. The Varhad Group CMP: INR92.15 Stock data BSE code 509486 BSE ID CAPRIHANS Face value (INR) 10 No of shares (m) 13.1 Market cap (INRm) 1,210.3 3m avg.
Company Overview. FY15 and recent performance. Table 1: Key financials. Source: Company, Varhad Research
 Electronic Components l BSE Research SPEL Semiconductor Ltd. CMP: INR13.88 Stock data BSE code 517166 BSE ID SPELS Face value (INR) 10.0 No of shares (m) 46.1 Market cap (INRm) 640.1 3m avg. daily vol
Larsen & Toubro Ltd.
 Feb-17 Mar-17 Apr-17 May-17 Jun-17 Jul-17 Aug-17 Sep-17 Oct-17 Nov-17 Dec-17 Jan-18 Feb-18 Volume No.. III Issue No. 163. Larsen & Toubro Ltd. February 26, 2018 BSE Code: 500510 NSE Code: LT Reuters Code:
BUY. Efforts on cost cutting paying off RAMCO CEMENTS. Target Price: Rs 435. Key highlights. Key drivers FY15 FY16E FY17E
 RAMCO S BUY Target Price: Rs 435 Efforts on cost cutting paying off Q2 EBITDA at Rs 2.8 bn (up 30% YoY) was ahead of our estimates due to lower-than-expected costs. Average costs (excluding freight) declined
ITC ACCUMULATE. Performance Highlights CMP. `257 Target Price `284. 3QFY2017 Result Update FMCG. Investment Period 12 Months
 3QFY2017 Result Update FMCG January 30, 2017 ITC Performance Highlights Quarterly result (Standalone) (` cr) 3QFY17 3QFY16 % yoy 2QFY17 %qoq Revenue 9,248 8,867 4.3 9,661 (4.3) EBITDA 3,546 3,475 2.1 3,630
ITC Ltd. BUY CMP (Rs.) 304 Target (Rs.) 336 Potential Upside(%) 11% Valuation: Investment Rationale. For private circulation only
 304 Target (Rs.) 336 Potential Upside(%) 11% Valuation: Investment Rationale. For private circulation only") Aug-17 Sep-17 Oct-17 Nov-17 Dec-17 Jan-18 Feb-18 Mar-18 Apr-18 May-18 Jun-18 Jul-18 Aug-18. Volume No.. I Issue No. 186 ITC Ltd September 21, 2018 BSE Code: 500875 NSE Code: ITC Reuters Code: ITC.NS Bloomberg
Aug-17 Sep-17 Oct-17 Nov-17 Dec-17 Jan-18 Feb-18 Mar-18 Apr-18 May-18 Jun-18 Jul-18 Aug-18. Volume No.. I Issue No. 186 ITC Ltd September 21, 2018 BSE Code: 500875 NSE Code: ITC Reuters Code: ITC.NS Bloomberg
Maruti Suzuki India BUY. Performance Update. CMP `9,315 Target Price `10,820. 1QFY2019 Result Update Automobile. Historical share price chart
 Jul-15 Sep-15 Nov-15 Jan-16 Mar-16 May-16 Jul-16 Sep-16 Nov-16 Jan-17 Mar-17 May-17 Jul-17 Sep-17 Nov-17 Jan-18 Mar-18 May-18 1QFY2019 Result Update Automobile July 27, 2018 Maruti Suzuki India Performance
NOW ON APP Research at your finger tips
 NOW ON APP Research at your finger tips 15 FEB 2018 Quarterly Update BUY Target Price: Rs 470 ODC project takes breather; to rebound in Q4 Q3 pre-sales declined QoQ to Rs 1 bn (Rs 1.7 bn in Q2) on lower
Religare Investment Call
 v-17 Dec-17 Jan-18 Feb-18 Mar-18 Apr-18 May-18 Jun-18 Jul-18 Aug-18 Sep-18 Oct-18 v-18 Q2FY19 Result Update Q2FY19 Result Update BUY CMP (Rs) 5,813 Target Price (Rs) 6,519 Potential Upside 12.1% Sensex
Key estimate revision. Financial summary. Year FY14 391,088 45,198 34, FY15E 354,262 35,426 23,
 : price: EPS: How does our one year outlook change? We retain our negative stance on the stock. We expect s revenue to de-grow by 9% y-o-y on the back of muted execution (client side and clearance delays)
SHRIRAM TRANSPORT FINANCE COMPANY LTD
 27 June 2017 SHRIRAM TRANSPORT FINANCE COMPANY LTD CMP INR 975 Initiating Coverage (BUY) Target Price INR 1225 Stock Details Industry Finance (including NBFCs) Bloomberg Code SHTF:IN BSE Code 511218 Face
HFC NEUTRAL. Performance Highlights CMP. `678 Target Price - 1QFY2013 Result Update HFC. Investment Period - Key financials
 1QFY2013 Result Update HFC July 11, 2012 HDFC Performance Highlights Particulars (` cr) 1QFY13 4QFY12 % chg (qoq) 1QFY12 % chg (yoy) NII 1,258 1,681 (25.1) 998 26.0 Preprov. profit 1,420 1,849 (23.2) 1194
Religare Investment Call
 v-17 v-17 Dec-17 Jan-18 Jan-18 Feb-18 Mar-18 Mar-18 Apr-18 May-18 May-18 Jun-18 Jul-18 Aug-18 Aug-18 Sep-18 Oct-18 Oct-18 Q2FY19 Result Update Q2FY19 Result Update BUY CMP (Rs) 282 Target Price (Rs) 321
Astra Microwave Products
 Aug-13 Oct-13 Dec-13 Feb-14 Apr-14 Jun-14 Aug-14 Research Desk Stock Broking Capital Goods - Defence August 4, 2014 RESULT REVIEW Bloomberg: ASTM@IN Reuters: ASTM.BO Results in-line with expectation-maintain
MRF BUY. Performance Highlights. CMP `9,407 Target Price `11,343. Company Update Automobile. Key financials
 Company Update Automobile February 22, 212 MRF Performance Highlights Y/E Sept. (` cr) 1QSY12 1QSY11 % chg (yoy) 4QSY11 % chg (qoq) Net sales 2,875 2,167 32.7 2,62 9.8 EBITDA 258 243 5.9 181 42.6 EBITDA
Goodyear India ACCUMULATE. Performance Highlights. CMP Target Price `326 `374. 1QCY2012 Result Update Tyres. Key financials
 1QCY212 Result Update Tyres June 6, 212 Goodyear India Performance Highlights Y/E December (` cr) 1QCY212 1QCY211 % chg (yoy) 4QCY211 % chg (qoq) Net sales 331 336 (1.6) 395 (16.2) EBITDA 2 24 (18.6) 34
Indag Rubber Ltd Bloomberg Code: IDR IN
 Industrials-Transportation Equipment-Commercial Vehicles Bloomberg Code: IDR IN India Research - Stock Broking Set to Ride on Commercial Vehicle Growth with Strong Cash Flows and Balance Sheet Recovery
Religare Investment Call
 BUY CMP (Rs) Target Price (Rs) Potential Upside Sensex Nifty 378 430 13.7% 31,159 9,625 Future looks promising Wonderla Holidays Ltd's Q4FY17 result was a mixed bag as the company reported healthy growth
Religare Investment Call
 Q3FY18 Result Update Consumer Durables Symphony Ltd. BUY CMP (Rs) Target Price (Rs) Potential Upside Sensex Nifty Key Stock data BSE Code NSE Code Bloomberg Shares o/s, Cr (FV 2) Market Cap (Rs Cr) 3M
Parag Milk Foods BUY. Performance Update CMP. `256 Target Price `330. 2QFY2019 Result Update Dairy Products. Investment Period 12 Months
 2QFY2019 Result Update Dairy Products November 6, 2018 Parag Milk Foods Performance Update Y/E March (` cr) Q2FY19 Q2FY18 % yoy Q1FY19 % qoq Net sales 573 505 13.7% 549 4.4% EBITDA 58 50 16.3% 60-2.7%
The Varhad Group. Prag Bosimi Synthetics Ltd. Company Overview. FY15 and recent performance CMP: INR5.56. Stock data. Stock performance (%)
") Textiles l BSE Research Prag Bosimi Synthetics Ltd. CMP: INR5.56 Stock data BSE code 500192 BSE ID PRAGBOS Face value (INR) 10.0 No of shares (m) 74.4 Market cap (INRm) 413.6 3m avg. daily vol (No) 2,491.6
Textiles l BSE Research Prag Bosimi Synthetics Ltd. CMP: INR5.56 Stock data BSE code 500192 BSE ID PRAGBOS Face value (INR) 10.0 No of shares (m) 74.4 Market cap (INRm) 413.6 3m avg. daily vol (No) 2,491.6
MCX Ltd. Rating: Target price: EPS: Is commodity option a game changer for MCX? - Unlikely. Target. Rating CMP. Rs. 1,080 SELL. Rs.
 : price: EPS: Is commodity option a game changer for MCX? - Unlikely In the union budget 2015-16, the Finance Minister announced the much anticipated merger of SEBI and FMC. Given the powers accorded to
Religare Investment Call
 Oct-17 v-17 Dec-17 Jan-18 Feb-18 Mar-18 Apr-18 May-18 Jun-18 Jul-18 Aug-18 Sep-18 Oct-18 BUY CMP (Rs) 190 Target Price (Rs) 247 Potential Upside 29.7% Sensex 33,349 Nifty 10,030 Key Stock data BSE Code
Maruti Suzuki. Source: Company Data; PL Research
 Healthy operating performance; Accumulate October 28, 2016 Rohan Korde rohankorde@plindia.com +91 22 66322235 Rating Accumulate Price Rs5,860 Target Price Rs6,356 Implied Upside 8.5% Sensex 27,916 Nifty
Mahindra & Mahindra Ltd.
 Nov-15 Jan-16 Apr-16 Jul-16 Oct-16 Jan-17 Apr-17 Jul-17 Oct-17 Jan-18 Apr-18 Jul-18 Oct-18 2QFY2019 Result Update Automobile November 15, 2018 Mahindra & Mahindra Ltd. Performance Update Y/E March (` cr)
BHEL.BO BHEL IN. Structural story remains weak. Q1FY19 Result Update. Rating: REDUCE CMP: Rs72 TP: Rs73. July 25, 2018
 (BHEL IN) Rating: REDUCE CMP: Rs72 TP: Rs73 July 25, 2018 Q1FY19 Result Update Change in Estimates Target Reco Change in Estimates Current Previous FY19E FY20E FY19E FY20E Rating REDUCE REDUCE Target Price
HOLD. Margins to improve from Q2 AMBUJA CEMENTS. Target Price: Rs 232. Other highlights
 AMBUJA S 4 MAY 2017 Quarterly Update HOLD Target Price: Rs 232 Margins to improve from Q2 Q1CY17standalone EBITDA at Rs 4.0 bn was in line withconsensus estimate.volume was up 3% YoY to 6 mnt. Realization
Skipper Ltd. May 17, Towering high. CMP INR 205 Target INR 238 Result Update - BUY. Company Background. Investment Rationale
 May 17, 2017 Skipper Ltd. Towering high CMP INR 205 Target INR 238 Result Update - BUY Key Share Data Face Value (INR) 1.0 Equity Capital (INR Mn) 102.3 Market Cap (INR Mn) 20,979.9 52 Week High/Low (INR)
GAIL India NEUTRAL. Performance Highlights CMP. `363 Target Price - 2QFY2013 Result Update Oil & Gas. Investment Period -
 2QFY2013 Result Update Oil & Gas October 26, 2012 GAIL India Performance Highlights Quarterly highlights (Standalone) Y/E March (` cr) 2QFY2013 2QFY2012 % chg (yoy) 1QFY2013 % chg (qoq) Net sales 11,361
Colgate-Palmolive India Ltd.
 RESULT UPDATE 5th February, 2018 Feb-15 Aug-15 Feb-16 Aug-16 Feb-17 Aug-17 Feb-18 India Equity Institutional Research II Result Update - Q3FY18 II 5th February, 2018 CMP INR 1,120 MARKET DATA Target INR
Mahindra & Mahindra Ltd.
 Jan-16 Apr-16 Jul-16 Oct-16 Jan-17 Apr-17 Jul-17 Oct-17 Jan-18 Apr-18 Jul-18 Oct-18 Jan-19 3QFY2019 Result Update Automobile February 15, 2019 Mahindra & Mahindra Ltd. Performance Update Y/E March (` cr)
CCL Products BUY. Performance Update. CMP Target Price `278 `360. 3QFY2018 Result Update Coffee. Historical share price chart.
 Feb-15 May-15 Aug-15 Oct-15 Jan-16 Apr-16 Jul-16 Oct-16 Jan-17 Apr-17 Jul-17 Oct-17 Jan-18 3QFY2018 Result Update Coffee February 5, 2018 CCL Products Performance Update Y/E March (` cr) Q3FY18 Q3FY17
Nestlé India Outlook Hazy; Valuations Prohibitive
 Nestlé India Outlook Hazy; Valuations Prohibitive Nestlé India s net sales, EBITDA and net profit surged by 35% yoy, 67% yoy & 116% yoy to Rs23.5bn, Rs4.5bn & Rs2.7bn, respectively in 3QCY16. This growth
Quick take. Ruchira Papers Ltd. BUY. Creating value through paper. Target Price. Investment Period 12 Months. 3 year daily price chart.
 Ltd. Creating value through paper Limited (RPL) manufactures writing paper, printing paper and Kraft paper. The company's white writing and printing paper is used in making notebooks and writing material,
KEI Industries BUY. Performance Update. CMP Target Price `433 `508. 4QFY2018 Result Update Cable. Historical share price chart.
 May- Aug- Oct-15 Jan-16 Apr-16 Jul-16 Oct-16 Jan-17 Apr-17 Jul-17 Oct-17 Jan-18 Apr-18 4QFY2018 Result Update Cable May 21, 2018 KEI Industries Performance Update Y/E March (` cr) 4QFY18 4QFY17 % yoy 3QFY18
BUY. White cement steals the show JK CEMENT. Target Price: Rs 1,220. Other highlights
 JK 20 NOV 2017 Quarterly Update BUY Target Price: Rs 1,220 White cement steals the show JK Cement s (JKCE) Q2FY18 EBITDA at Rs 2.1 bn (up 30% YoY) was higher than our and consensus estimates, mainly due
Religare Investment Call
 Q3FY18 Result Update Auto Ancillary BUY CMP (Rs) Target Price (Rs) Potential Upside Sensex Nifty Key Stock data BSE Code NSE Code Bloomberg Shares o/s, Cr (FV 10) Market Cap (Rs Cr) 3M Avg Volume 52 week
KEI Industries BUY. Performance Update. Target Price. 3QFY2018 Result Update Cable. Historical share price chart. Key Financials
 3QFY2018 Result Update Cable January 25, 2018 KEI Industries Performance Update Y/E March (` cr) 3QFY18 3QFY17 % yoy 2QFY18 % qoq Net sales 889 715 24 749 19 EBITDA 84 77 10 76 11 EBITDA margin (%) 9.5
BUY. At inflection point NTPC. Target Price: Rs 197. Key highlights. Financial summary (Standalone) Y/E March FY16 FY17 FY18E FY19E.
 Y/E March FY16 FY17 FY18E FY19E.") At inflection point Q2FY18 adjusted PAT grew 12% YoY at Rs 27 bn (vs. our estimate Rs 26 bn) in tandem with 17% YoY rise in regulated equity. Core RoE is still healthy at 20.2% though it contracted ~174
At inflection point Q2FY18 adjusted PAT grew 12% YoY at Rs 27 bn (vs. our estimate Rs 26 bn) in tandem with 17% YoY rise in regulated equity. Core RoE is still healthy at 20.2% though it contracted ~174
Parag Milk Foods BUY. Performance Update CMP. `324 Target Price `410. 1QFY2019 Result Update Dairy Products. Investment Period 12 Months
 1QFY2019 Result Update Dairy Products August 8, 2018 Parag Milk Foods Performance Update Y/E March (` cr) Q1FY19 Q1FY18 % yoy Q4FY18 % qoq Net sales 549 413 32.9 518 5.9 EBITDA 60 29 103% 55 8.4% EBITDA
Apollo Hospitals Enterprise Ltd.
 Dec-16 Jan-17 Feb-17 Mar-17 Apr-17 May-17 Jun-17 Jul-17 Aug-17 Sep-17 Oct-17 Nov-17 Dec-17. Volume No.. I Issue No. 154 Apollo Hospitals Enterprise Ltd. December 19, 2017 BSE Code: 508869 NSE Code: APOLLOHOSP
Prabhat Dairy Ltd. RESULT UPDATE 8th June, 2018
 RESULT UPDATE 8 th June, 2018 Sep-15 Jan-16 May-16 Sep-16 Jan-17 May-17 Sep-17 Jan-18 May-18 India Equity Institutional Research II Result Update - Q4FY18 II 8 th June, 2018 2 Under Expansion Mode CMP
Bayer Cropscience (BYRCS IN)
") (BYRCS IN) Rating: ACCUMULATE CMP: Rs4,258 TP: Rs4,517 February 4, 2019 Q3FY19 Result Update Change in Estimates Target Reco Change in Estimates Current Previous FY20E FY21E FY20E FY21E Rating ACCUMULATE
(BYRCS IN) Rating: ACCUMULATE CMP: Rs4,258 TP: Rs4,517 February 4, 2019 Q3FY19 Result Update Change in Estimates Target Reco Change in Estimates Current Previous FY20E FY21E FY20E FY21E Rating ACCUMULATE
Mahindra & Mahindra Ltd.
 May-15 Aug-15 Nov-15 Feb-16 May-16 Aug-16 Nov-16 Feb-17 May-17 Aug-17 Nov-17 Feb-18 4QFY2018 Result Update Automobile May 30, 2018 Mahindra & Mahindra Ltd. Performance Update Y/E March (` cr) 4QFY18 4QFY17
Procter & Gamble Hygiene & Health Care
 3QFY216 Result Update FMCG May 6, 216 Procter & Gamble Hygiene & Health Care Performance Highlights Quarterly Data (` cr) 3QFY16 3QFY15 % yoy 2QFY16 % qoq Revenue 614 555 1.5 714 (14.) EBITDA 133 123 8.5
Religare Investment Call
 BUY CMP (Rs) Target Price (Rs) Potential Upside Sensex Nifty Key Stock data BSE Code NSE Code Bloomberg Shares o/s, Cr (FV 1) Market Cap (Rs Cr) 3M Avg Volume 52 week H/L Shareholding Pattern (%) Dec-16
S R K Industries Ltd. BSE Scrip Code:
 S R K Industries Ltd. BSE Scrip Code: 531307 Textiles March 15, 2013 Equity Statistics Current Market Price Rs. 28.4 52 Week High/Low Rs. 32.65/2.90 Market Capitalisation Rs. Crores 10.71 Free Float Rs.
FY17 FY18 FY19E FY20E
 3-Aug-15 3-Oct-15 3-Dec-15 3-Feb-16 3-Apr-16 3-Jun-16 3-Aug-16 3-Oct-16 3-Dec-16 3-Feb-17 3-Apr-17 3-Jun-17 3-Aug-17 3-Oct-17 3-Dec-17 3-Feb-18 3-Apr-18 3-Jun-18 Result Update STRONG BUY * August 6, 218
Ramco Cement. Rating: Target price: EPS: Rating CMP. Target BUY. Rs.415. Rs. 360
 : price: EPS: How does our one year outlook change? We maintain our positive stance on s (TRCL). The company is one of the largest cement producers in South and remains among the best plays on Southern
Religare Investment Call
 BUY CMP (Rs) Target Price (Rs) Potential Upside Sensex Nifty Key Stock data BSE Code NSE Code Bloomberg Shares o/s, Cr (FV 2) Market Cap (Rs Cr) 3M Avg Volume 52 week H/L Shareholding Pattern (%) Promoter
Religare Investment Call
 BUY CMP (Rs) Target Price (Rs) Potential Upside Sensex Nifty 412 463 12.3% 31,305 9,658 Key Stock data BSE Code NSE Code Bloomberg Shares o/s, Cr (FV 5) Market Cap (Rs Cr) 3M Avg Volume 52 week H/L 500870
BUY MULTI COMMODITY EXCHANGE OF INDIA. Demonetization,GST uncertainty impact Q4. Target Price: Rs 1,397. Concall highlights
 09 MAY 2017 Quarterly Update BUY Target Price: Rs 1,397 Demonetization,GST uncertainty impact Q4 Revenue declined 12% QoQ at Rs 874 mn due to lower traded value (down 10% QoQ). Bullion (~35% of traded