How did Too Big to Fail become such a problem for broker-dealers? Speculation by Andy Atkeson March 2014
|
|
|
- Barbara Armstrong
- 6 years ago
- Views:
Transcription
1 How did Too Big to Fail become such a problem for broker-dealers? Speculation by Andy Atkeson March 2014
2 Proximate Cause By 2008, Broker Dealers had big balance sheets Historical experience with rapid contraction of broker dealer balance sheets and bank runs raised unpleasant memories for central bankers No satisfactory legal or administrative procedure for resolving failed broker dealers So the Fed wrestled with the question of whether broker dealers were too big to fail
3 Why do Central Bankers care? Historically, deposit taking Banks held three main assets Non-financial commercial paper Government securities Demandable collateralized loans to broker-dealers Much like money market mutual funds (MMMF s) today Many historical (pre-fed) banking crises (runs) associated with sharp changes in the volume and interest rates on loans to broker dealers Similar to what happened with MMMF s after Lehman? Much discussion of directions for central bank policy and regulation New York Clearing House 1873 National Monetary Commission 1910 Pecora Hearings 1933 Friedman and Schwartz 1963
4 Questions I want to consider How would you fit Broker Dealers into the growth model? What economic function do they perform in facilitating trade of securities and financing margin and short positions in securities? What would such a theory say about the size of broker dealer value added and balance sheets? What would be lost (socially) if we dramatically reduced broker dealer balance sheets by regulation? Are broker-dealer liabilities the right asset for banks to hold? Chari-Phelan/Farhi-Golosov-Tsyvinski/Jacklin on tradable assets in Diamond Dybvig
5 Example: how do we put real estate brokers into the growth model? Households have a motivation to trade houses Real Estate Broker adds value in facilitating transaction Measured in NIPA as broker s commissions as part of residential investment Real estate brokers typically do not provide financing of transactions so they have small balance sheets Real Estate Developers do need to finance new construction (typically with bank loans)

6 Real Estate Brokers in NIPA
7 Securities Broker Dealers vs. Real Estate Brokers Traditional Investment Banking (underwriting and mergers and acquisitions) Brokerage commissions and fees Dealers bid-ask spreads
8 Value Added of Securities, Commodities Contracts, and Investments industry as a percentage of GDP 1.8# 1.6# 1.4# 1.2# 1.0# 0.8# 0.6# 0.4# 0.2# 0.0# 1997# 1998# 1999# 2000# 2001# 2002# 2003# 2004# 2005# 2006# 2007# 2008# 2009# 2010# 2011# 2012#
9 Facts to be presented today Since the founding of the Fed, most of the time, securities broker dealers have small balance sheets Two episodes of big increase and decrease in the size of the balance sheet of broker dealers the past 20 years Crash of 1929
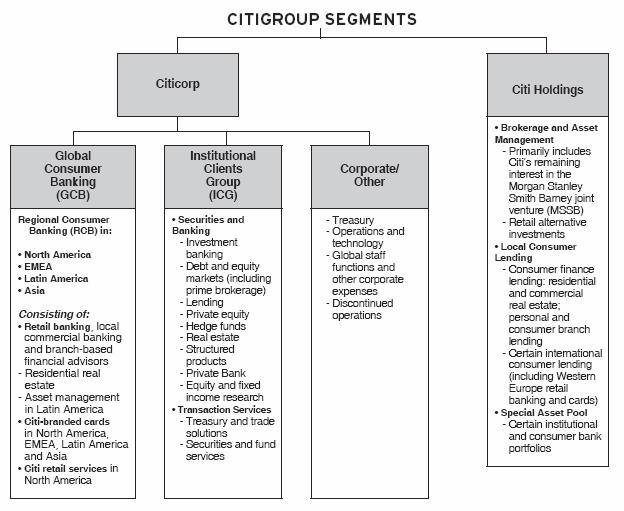
10 Outline of the talk Structure of a modern big bank (Citibank and Goldman Sachs) Growth of balance sheets of Securities Broker Dealers (Flow of Funds 1952-now) A look at a broker dealer s balance sheet by function (What does a broker-dealer do?) Comparison to data on broker dealer balance sheets, funding sources, and failures from including the Crash of 1929
11 What do big banks do these days? Holding Company Traditional Retail Banking Traditional Investment Banking Asset Management Securities Brokering and Dealing
12 What does a Big Bank do?
13 Traditional Retail Banking
14 Securities Brokering and Dealing
15 And Goldman Sachs
16 Traditional I-Banking
17 Asset Management

18 Securities Brokering and Dealing
19 How has the scale of these businesses changes since 1952 A look at balance sheets in the Flow of Funds
20 The growth of balance sheets in Securities B-D 25%# Securi'es)B+D)Assets/GDP)(L)128)) 20%# 15%# 10%# 5%# 0%# Mar*52# May*55# Jul*58# Sep*61# Nov*64# Jan*68# Mar*71# May*74# Jul*77# Sep*80# Nov*83# Jan*87# Mar*90# May*93# Jul*96# Sep*99# Nov*02# Jan*06# Mar*09# May*12#
21 Traditional I-Banking did not need a balance sheet 25%# Securi'es)B+D)Assets/GDP)(L)128)) 20%# 15%# 10%# 5%# 0%# Mar*52# May*55# Jul*58# Sep*61# Nov*64# Jan*68# Mar*71# May*74# Jul*77# Sep*80# Nov*83# Jan*87# Mar*90# May*93# Jul*96# Sep*99# Nov*02# Jan*06# Mar*09# May*12#
22 Summary of Broker Dealer Balance Sheet Table 1 Assets Cash Instruments owned Reverse repo/securities borrowing Brokerage receivables Liabilities and Equity Equity Instruments sold but not yet owned Repo/securities lending Brokerage payables
23 Cash will generally include the dealer s own funds that are held in an account with a bank, such as a deposit with a bank within the same bank holding company, a Federal Reserve Bank, or a third-party bank. Cash will also include funds deposited with a bank that are fully segregated on behalf of a customer of the dealer. Financial instruments owned will reflect the fair value of Table 1 Assets Cash Instruments owned Reverse repo/securities borrowing Brokerage receivables Liabilities and Equity Equity Instruments sold but not yet owned Repo/securities lending Brokerage payables
24 Financial instruments owned will reflect the fair value of risky positions owned by the bank, such as securities, physical commodities, principal investments, and derivative contracts. In concept, the fair value reflects the cash that could be obtained upon sale of the instrument. Reverse repurchase agreements (reverse repo)/securities borrow- Table 1 Assets Cash Instruments owned Reverse repo/securities borrowing Brokerage receivables Liabilities and Equity Equity Instruments sold but not yet owned Repo/securities lending Brokerage payables
25 Instruments sold but not yet owned reflect the dealer s own short positions in a financial instrument, such as a security, physical commodity, or derivative contract. Repurchase agreements (repos)/securities lending generally Table 1 Assets Cash Instruments owned Reverse repo/securities borrowing Brokerage receivables Liabilities and Equity Equity Instruments sold but not yet owned Repo/securities lending Brokerage payables
26 Reverse repurchase agreements (reverse repo)/securities borrowing generally reflects a cash outlay and a receipt of a financial instrument as collateral, such as a security. 4 The reverse repo is recorded on the balance sheet as the value of the cash outlay, not the collateral. These collateralized transactions are governed by specific SIFMA 5 forms. (For a more detailed discus- Table 1 Assets Cash Instruments owned Reverse repo/securities borrowing Brokerage receivables Liabilities and Equity Equity Instruments sold but not yet owned Repo/securities lending Brokerage payables
27 Repurchase agreements (repos)/securities lending generally reflects a cash receipt and a pledge of a financial instrument, such as a security. These are similar to the reverse repo/securities borrowing transactions described above, but in these the dealer bank takes the opposing side of the trade. Brokerage payables are economically similar to repos/se- Table 1 Assets Cash Instruments owned Reverse repo/securities borrowing Brokerage receivables Liabilities and Equity Equity Instruments sold but not yet owned Repo/securities lending Brokerage payables
28 Brokerage receivables are economically similar to reverse repos/securities borrowing, but are generally related to other forms of collateralized lending, such as brokerage customer margin loans and collateral posted in connection with derivatives. Table 1 Assets Cash Instruments owned Reverse repo/securities borrowing Brokerage receivables Liabilities and Equity Equity Instruments sold but not yet owned Repo/securities lending Brokerage payables
29 Brokerage payables are economically similar to repos/securities lending, but are generally related to other collateralized borrowings, such as brokerage customer credit balances and collateral received in connection with derivative transactions. Table 1 Assets Cash Instruments owned Reverse repo/securities borrowing Brokerage receivables Liabilities and Equity Equity Instruments sold but not yet owned Repo/securities lending Brokerage payables
30 Main Liabilities: Collateralized Borrowings 25%# Securi'es)BD)Repo)and)Securi'es)Credit/GDP)(L)128)) 20%# 15%# 10%# Total Assets/GDP 5%# 0%# Mar*52# Apr*55# May*58# Jun*61# Jul*64# Aug*67# Sep*70# Oct*73# Nov*76# Dec*79# Jan*83# Feb*86# Mar*89# Apr*92# May*95# Jun*98# Jul*01# Aug*04# Sep*07# Oct*10#
31 Two different data slices to compare to data Gross versus net balance sheet Flow of Funds L 128 shows only net repo liabilities Underlying detail show gross repo Gross data comparable to data Scale of financing coming from deposit taking institutions and money market mutual funds
32 Broker Dealer Gross Collateralized Assets and Liabilities/GDP 60%% 50%% 40%% 30%% 20%% Assets% LiabiliBes% Net% Total%Assets% 10%% 0%%!10%%!20%%!30%%!40%%!50%% Mar!52% May!55% Jul!58% Sep!61% Nov!64% Jan!68% Mar!71% May!74% Jul!77% Sep!80% Nov!83% Jan!87% Mar!90% May!93% Jul!96% Sep!99% Nov!02% Jan!06% Mar!09% May!12%
33 Net Collateralized Borrowing 1.5%& 1.0%& 0.5%& 0.0%&!0.5%&!1.0%& Mar!52& May!55& Jul!58& Sep!61& Nov!64& Jan!68& Mar!71& May!74& Jul!77& Sep!80& Nov!83& Jan!87& Mar!90& May!93& Jul!96& Sep!99& Nov!02& Jan!06& Mar!09& May!12&!1.5%& Net&!2.0%&!2.5%&!3.0%&!3.5%&
34 Securities BD holdings of securities and short positions Flow of Funds data on securities owned/gdp 14%$ 12%$ 10%$ 8%$ 6%$ Long$ Short$ Net$ 4%$ 2%$ 0%$!2%$!4%$!6%$ M!52$ M!55$ J!58$ S!61$ N!64$ J!68$ M!71$ M!74$ J!77$ S!80$ N!83$ J!87$ M!90$ M!93$ J!96$ S!99$ N!02$ J!06$ M!09$ M!12$
35 Summary Big growth of broker dealer intermediation of credit to facilitate investors buying securities on margin and selling short Big change from old business of fee income and no balance sheet Big drop in gross balance sheets in fall of 2008
36 Have we seen this movie before? Maybe big growth and collapse in the balance sheets of securities broker dealers and non-bank lending to broker dealers. But few apparent systemic consequences from all of this turmoil (Neither brokers nor New York banks failed in 1929/30)
37 9" 8" 7" 6" 5" 4" 3" 2" 1" 0" Sep/18" NYSE Brokers Borrowings Historical Banking and Monetary Statistics Sep/19" Sep/20" Sep/21" Sep/22" Broker's(Loans(by(Groups(of(Lenders( in(billions(of(dollars( Sep/23" Sep/24" Sep/25" Sep/26" Sep/27" Sep/28" Sep/29" Sep/30" Sep/31" Sep/32" Sep/33" Total" NY"City"Banks" Total"from"banks" Sep/34" Sep/35" Sep/36" Sep/37" Sep/38"
38 9" 8" 7" 6" 5" 4" 3" 2" 1" 0" Sep/18" NYSE Brokers Borrowings Historical Banking and Monetary Statistics Borrowings reported by members of the NYSE Sep/19" Sep/20" Sep/21" Sep/22" Broker's(Loans(by(Groups(of(Lenders( in(billions(of(dollars( Sep/23" Sep/24" Sep/25" Sep/26" Sep/27" Sep/28" Sep/29" Sep/30" Sep/31" Sep/32" Sep/33" Total" NY"City"Banks" Total"from"banks" Sep/34" Sep/35" Sep/36" Sep/37" Sep/38"
39 9" 8" 7" 6" 5" 4" 3" 2" 1" 0" Sep/18" NYSE Brokers Borrowings Historical Banking and Monetary Statistics Sep/19" Sep/20" Sep/21" Sep/22" Broker's(Loans(by(Groups(of(Lenders( in(billions(of(dollars( Lending to Call Market reported by banks Sep/23" Sep/24" Sep/25" Sep/26" Sep/27" Sep/28" Sep/29" Sep/30" Sep/31" Sep/32" Sep/33" Total" NY"City"Banks" Total"from"banks" Sep/34" Sep/35" Sep/36" Sep/37" Sep/38"
40 9" 8" 7" 6" 5" 4" 3" 2" 1" 0" Sep/18" NYSE Brokers Borrowings Historical Banking and Monetary Statistics Sep/19" Sep/20" Sep/21" Sep/22" Broker's(Loans(by(Groups(of(Lenders( in(billions(of(dollars( Run on Shadow banking? Sep/23" Sep/24" Sep/25" Sep/26" Sep/27" Sep/28" Sep/29" Sep/30" Sep/31" Sep/32" Sep/33" Total" NY"City"Banks" Total"from"banks" Sep/34" Sep/35" Sep/36" Sep/37" Sep/38"
41 No run on New York Banks with Crash of " 10" 8" Broker's(Loans(and(Deposits(in(New(York(Money(Center(Banks( in(billions(of(dollars( Brokers'"Loans" Deposits"in"New"York" City"Banks" 6" 4" 2" 0" Sep+18" Sep+19" Sep+20" Sep+21" Sep+22" Sep+23" Sep+24" Sep+25" Sep+26" Sep+27" Sep+28" Sep+29" Sep+30" Sep+31" Sep+32" Sep+33" Sep+34" Sep+35" Sep+36" Sep+37" Sep+38"
42 Bank runs came later 70" 60" Broker's(Loans(and(Deposits(in(billions(of(dollars( Brokers'"Loans" Deposits"in"New"York"City"Banks" All"Fed"Member"Banks" All"Banks" 50" 40" 30" 20" Bank Runs Come Later 10" 0" Sep-18" Sep-19" Sep-20" Sep-21" Sep-22" Sep-23" Sep-24" Sep-25" Sep-26" Sep-27" Sep-28" Sep-29" Sep-30" Sep-31" Sep-32" Sep-33" Sep-34" Sep-35" Sep-36" Sep-37" Sep-38"
43 What was different in 1929? Sprague (1910): pre-fed banking crises had their origination in the New York Call Money Market 1873 Failure of Jay Cooke underwriting railroad bonds spread to banks. Concern about similar exposure to railroads 1907 Run on Trust Companies spread to banks through call market National Monetary Commission advocated creation of central bank in part to eliminate the transmission of crises from the call money market to banks Common Hypothesis: The experience in the Crash of 1929 was different due to intervention of New York Fed So why didn t this work in 2008?
44 Motivations for Borrowing and Lending Securities Some investors want to go short a particular security Dispersion in beliefs drives size dispersion of positions Security-Market line / Two-fund theorem Some investors want a levered position in the market as a whole Others want mostly cash Volume of margin lending driven by differences in risk aversion and margin requirements Could consider asset pricing and welfare considerations of margin requirements
45 L.120 Money Market Mutual Funds (1) Billions of dollars; amounts outstanding end of period, not seasonally adjusted Q3 Q4 Q1 Q2 Q3 Q4 1 Total financial assets Foreign deposits Checkable deposits and currency Time and savings deposits Security repurchase agreements Credit market instruments Open market paper Treasury securities Agency- and GSE-backed securities Municipal securities Corporate and foreign bonds Miscellaneous assets Total shares outstanding (liabilities) (1) Open-end investment companies; excludes funding vehicles for variable annuities, which are included in the life insurance sector (table L.115). Assets in Banks
46 L.120 Money Market Mutual Funds (1) Billions of dollars; amounts outstanding end of period, not seasonally adjusted Q3 Q4 Q1 Q2 Q3 Q4 1 Total financial assets Foreign deposits Checkable deposits and currency Time and savings deposits Security repurchase agreements Credit market instruments Open market paper Treasury securities Agency- and GSE-backed securities Municipal securities Corporate and foreign bonds Miscellaneous assets Total shares outstanding (liabilities) (1) Open-end investment companies; excludes funding vehicles for variable annuities, which are included in the life insurance sector (table L.115). Assets in Repos
47 L.120 Money Market Mutual Funds (1) Billions of dollars; amounts outstanding end of period, not seasonally adjusted Q3 Q4 Q1 Q2 Q3 Q4 1 Total financial assets Foreign deposits Checkable deposits and currency Time and savings deposits Security repurchase agreements Credit market instruments Open market paper Treasury securities Agency- and GSE-backed securities Municipal securities Corporate and foreign bonds Miscellaneous assets Total shares outstanding (liabilities) (1) Open-end investment companies; excludes funding vehicles for variable annuities, which are included in the life insurance sector (table L.115). Assets in Credit Market Instruments
48 Bank and MMMF lending to Broker Dealers / GDP 8%# 7%# 6%# 5%# 4%# Bank# Bank#and#MMMF# 3%# 2%# 1%# 0%# Mar/52# Mar/55# Mar/58# Mar/61# Mar/64# Mar/67# Mar/70# Mar/73# Mar/76# Mar/79# Mar/82# Mar/85# Mar/88# Mar/91# Mar/94# Mar/97# Mar/00# Mar/03# Mar/06# Mar/09# Mar/12#
49 L.207 Federal Funds and Security Repurchase Agreements Billions of dollars; amounts outstanding end of period, not seasonally adjusted Banks net 1 Total liabilities Rest of the world Monetary authority Private depository institutions (net) U.S.-chartered depository institutions (net) Foreign banking offices in U.S. (net) Credit unions (net) Property-casualty insurance companies Life insurance companies Government-sponsored enterprises REITs Brokers and dealers (net) Holding companies ROW Broker Dealers net 14 Total assets Nonfinancial corporate business State and local governments Rest of the world Monetary authority Property-casualty insurance companies Life insurance companies Private pension funds State and local govt. retirement funds Money market mutual funds Mutual funds Government-sponsored enterprises Holding companies Funding corporations Discrepancy--unallocated assets MMMF GSEs
50 Two Fund Theorem
51 Treasury Repo Rates Often Exceed T-Bill Rates 6# 5# 4#week#T!Bill#Rate# Treasury#Repo#Rate# 4# 3# 2# 1# 0#!1# Jan!07# Mar!07# May!07# Jul!07# Sep!07# Nov!07# Jan!08# Mar!08# May!08# Jul!08# Sep!08# Nov!08#
52 At short horizons, Treasuries are risky: Daily returns on ishares 7-10 year Treasury ETF (IEF) 2.0%& 1.5%& 1.0%& 0.5%&!1.0%&!1.5%&!2.0%& M ar ch! 14 & 13 & M ar ch! 12 & ar ch! M M ar ch! 11 & 10 & M ar ch! 09 & ar ch! M 08 & ar ch! M!0.5%& M ar ch! 07 & 0.0%&
53 A Theory of Repo Haircuts and Rates Collateralized borrowing is limited (rationed) by haircut Constrains how far out capital market line risk tolerant investor can go Repo lender faces credit risk in event of double default Collateral falls in value Borrower defaults Repo terms split the surplus to be shared from high shadow value of borrowing for risk tolerant investor versus high concern about credit risk in lending from risk averse lender Repo terms should depend on both the counterparty and the collateral
54 Missing elements from the theory A theory of the investment horizon Overnight Repo vs. Five year swaps A theory of the instruments used The market portfolio should be the only risky portfolio repo d Equities vs. Fixed Income General Equilibrium
55 General Equilibrium Focus on the allocation of consumption Allocate aggregate endowment of consumption Agents have different utility functions Solve a social planning problem Lagrange multipliers on the resource constraints correspond to equilibrium state prices for consumption What portfolios implement the optimal outcome?
56 A two period model States: z 2 Z = {z 1,z 2,...} Probabilities: (z) Utilities u i (c i 0)+ i X z u i (c i 1(z)) (z) " #
57 A Social Planning X Problem " X max i u i (c i 0)+ c i 0,ci 1 (z) i i X z u i (c i 1(z)) (z) # subject to: Y 0 X i c i 0 and, for all z, Y 1 (z) X c i 1(z) i
58 Optimal allocation of consumption Equate MRS across states and dates across agents With quadratic or negative exponential utility, optimal consumption allocation is linear in aggregate consumption with different slope and intercept depending on agent s risk aversion General Equilibrium version of the Two-Fund Theorem: Risk tolerant investors hold a levered claim on aggregate consumption, risk averse agents hold riskless claim and small exposure to aggregate consumption Basic insight should generalize except portfolio implementation may be messier Optimal consumption is simple because it is done state-by-state
59 GE Example Linear Sharing Rule exp( u i (c i )= i (c i X i exp( i )) = exp( i (c i i )) j (c j j )) X X n i c i = Y i c i = i Pk n k k (Y X n k k )+ i k
60 Implement with Constant Portfolios of Consol Bond and Share of Aggregate Endowment X B i = i i P k n k k k n k k S i = P i k n k k ng is necessary over time. But what about credit risk?
61 Bounds on Consumption Optimal allocation with linear consumption sharing rules has negative consumption for risk tolerant agents in bad aggregate states If planner faces lower bounds on consumption (and finite marginal utility at those bounds), these bounds will bind for risk tolerant agents in bad aggregate states. In optimal allocation, further downside aggregate consumption risk is pushed onto risk averse agents
62 Implications for Repo/Financial Crises Use standard Lucas-tree logic to price any asset given optimal allocation of consumption and Lagrange multipliers on state-by-state resource constraints. Interpret agent s hitting the lower bound on consumption as default (refusing to take further losses as aggregate consumption falls) Repo failure: double default of levered (risk tolerant agents) and fall in value of claim on aggregate consumption perfectly correlated Financial Crisis: Optimal allocation has perfectly correlated default across all risk tolerant agents at once when aggregate consumption falls Shift further losses in aggregate consumption onto risk averse agents Repo looks safe until it isn t
63 Research Directions How do broker dealers fit into the growth model framework? What is the appropriate size of broker-dealer balance sheets? What would be lost (socially) if we dramatically reduced their balance sheets by regulation? Are broker-dealer liabilities the right asset for banks to hold? Chari-Phelan/Farhi-Golosov-Tsyvinski on tradable assets in Diamond Dybvig
Transparency in the U.S. Repo Market
 Transparency in the U.S. Repo Market Antoine Martin Federal Reserve Bank of New York October 11, 2013 The views expressed in this presentation are my own and may not represent the views of the Federal
Shadow Maturity Transformation and Systemic Risk. Sandra Krieger Executive Vice President and Chief Risk Officer, Federal Reserve Bank of New York
 Shadow Maturity Transformation and Systemic Risk Sandra Krieger Executive Vice President and Chief Risk Officer, Federal Reserve Bank of New York 8 March 2011 Overview of discussion What is shadow bank
The Private-Money View of Financial Crises. Gary Gorton, Yale and NBER
 The Private-Money View of Financial Crises Gary Gorton, Yale and NBER Financial Crises Doug Diamond: Financial crises are everywhere and always due to problems of short-term debt (and to the reasons why
Executive Summary. July 17, 2015
 Executive Summary July 17, 2015 The Revenue Estimating Conference adopted interest rates for use in the state budgeting process. The adopted interest rates take into consideration current benchmark rates
Shadow Banking and Financial Stability
 Shadow Banking and Financial Stability Tobias Adrian, November 8, 2013 The views expressed here are those of the author exclusively and do not necessarily represent those of the Federal Reserve Bank of
BOMA National Advisory Council Meeting Seaport Hotel, Boston MA
 BOMA National Advisory Council Meeting Seaport Hotel, Boston MA May 5, 2017 Jeff Fuhrer, EVP and Senior Policy Advisor Federal Reserve Bank of Boston 1 Raising rates? Raising rates more this year? Next?
Chapter 10. The Great Recession: A First Look. (1) Spike in oil prices. (2) Collapse of house prices. (2) Collapse in house prices
 Spike in oil prices. (2) Collapse of house prices. (2) Collapse in house prices") Discussion sections this week will meet tonight (Tuesday Jan 17) to review Problem Set 1 in Pepper Canyon Hall 106 5:00-5:50 for 11:00 class 6:00-6:50 for 1:30 class Course web page: http://econweb.ucsd.edu/~jhamilto/econ110b.html
Discussion sections this week will meet tonight (Tuesday Jan 17) to review Problem Set 1 in Pepper Canyon Hall 106 5:00-5:50 for 11:00 class 6:00-6:50 for 1:30 class Course web page: http://econweb.ucsd.edu/~jhamilto/econ110b.html
Outstanding debt in all sectors of the US fixed income market has gone from $4.6 trillion in 1985 to $33 trillion in 2008.
 US Fixed Income Debt Outstanding and Issuance, Selected Years Outstanding debt in all sectors of the US fixed income market has gone from $4.6 trillion in 1985 to $33 trillion in 2008. In 2008, NYSE total
Credit, Housing, Commodities and the Economy Chartered Financial Analysts Institute Annual Conference
 Credit, Housing, Commodities and the Economy Chartered Financial Analysts Institute Annual Conference May 13, 2008 Janet L. Yellen President and CEO Federal Reserve Bank of San Francisco Overview Financial
LECTURE 8 Monetary Policy at the Zero Lower Bound. October 19, 2011
 Economics 210c/236a Fall 2011 Christina Romer David Romer LECTURE 8 Monetary Policy at the Zero Lower Bound October 19, 2011 I. PAUL KRUGMAN, IT S BAAACK: JAPAN S SLUMP AND THE RETURN OF THE LIQUIDITY
The Fall of Bagehot: An Inductive Approach to Understanding Monetary Policy Implementation
 The Fall of Bagehot: An Inductive Approach to Understanding Monetary Policy Implementation Adjunct professor Jesper Berg, Managing Director, Nykredit Bank Friday the 28 th of August, 2015 Please note that
Lecture 5. Notes on the Current Crisis
 Lecture 5 Notes on the Current Crisis Mark Gertler NYU June 29 .4 Real GDP growth.3.2.1.1.2.3 1975 198 1985 199 1995 2 25 18 16 core inflation federal funds rate 14 12 1 8 6 4 2 1975 198 1985 199 1995
Policy Implementation with a Large Central Bank Balance Sheet
 Policy Implementation with a Large Central Bank Balance Sheet Antoine Martin The views expressed herein are my own and may not reflect the views of the Federal Reserve Bank of New York or the Federal Reserve
Multi-Dimensional Monetary Policy
 Multi-Dimensional Monetary Policy Michael Woodford Columbia University John Kuszczak Memorial Lecture Bank of Canada Annual Research Conference November 3, 2016 Michael Woodford (Columbia) Multi-Dimensional
Asset Classes and Financial Instruments
 Chapter 2 Asset Classes and Financial Instruments Bodie, Kane, and Marcus Essentials of Investments Tenth Edition 2.1 Asset Classes 2 2.1 The Money Market: Instruments Treasury Bills Certificates of Deposit
2012 Review and Outlook: Plus ça change... BY JASON M. THOMAS
 Economic Outlook 2012 Review and Outlook: Plus ça change... September 10, 2012 BY JASON M. THOMAS Over the past several years, central banks have taken unprecedented actions to suppress both short-andlong-term
Intermediary Balance Sheets Tobias Adrian and Nina Boyarchenko, NY Fed Discussant: Annette Vissing-Jorgensen, UC Berkeley
 Intermediary Balance Sheets Tobias Adrian and Nina Boyarchenko, NY Fed Discussant: Annette Vissing-Jorgensen, UC Berkeley Objective: Construct a general equilibrium model with two types of intermediaries:
Interest on Reserves, Interbank Lending, and Monetary Policy: Work in Progress
 Interest on Reserves, Interbank Lending, and Monetary Policy: Work in Progress Stephen D. Williamson Federal Reserve Bank of St. Louis May 14, 015 1 Introduction When a central bank operates under a floor
Written Testimony of Eric S. Rosengren President & Chief Executive Officer Federal Reserve Bank of Boston
 Written Testimony of Eric S. Rosengren President & Chief Executive Officer Federal Reserve Bank of Boston Field hearing of the Committee on Financial Services of the U.S. House of Representatives: Seeking
Investment Research. Maintaining Liquidity in Corporate Cash Accounts. Strategy
 Strategy October 27, 2011 Revised: August 5, 2014 Revised: August 10, 2015 Contacts Marc St. André Senior Portfolio Manager Main: 617.630.8100 mstandre@capitaladvisors.com Maintaining Liquidity in Corporate
Global Financial Crisis. Econ 690 Spring 2019
 Global Financial Crisis Econ 690 Spring 2019 1 Timeline of Global Financial Crisis 2002-2007 US real estate prices rise mid-2007 Mortgage loan defaults rise, some financial institutions have trouble, recession
TERMS OF REFERENCE FOR THE INVESTMENT COMMITTEE
 I. PURPOSE The purpose of the Investment Committee (the Committee ) is to recommend to the Board the investment policy, including the asset mix policy and the appropriate benchmark for both ICBC and any
Short-term debt and financial crises: What we can learn from U.S. Treasury supply
 Short-term debt and financial crises: What we can learn from U.S. Treasury supply Arvind Krishnamurthy Northwestern-Kellogg and NBER Annette Vissing-Jorgensen Berkeley-Haas, NBER and CEPR 1. Motivation
The August 9 FOMC Decision Ineffective at Best, Dangerous at Worst
 Northern Trust Global Economic Research 5 South LaSalle Street Chicago, Illinois 663 Paul L. Kasriel Chief Economist 312.444.4145 312.557.2675 fax plk1@ntrs.com The August 9 FOMC Decision Ineffective at
Comments on The Fd Federal lr Reserve s Primary Dealer Credit Facility Tobias Adrian and James McAndrews
 Comments on The Fd Federal lr Reserve s Primary Dealer Credit Facility Tobias Adrian and James McAndrews SGE Session on The Fed s New Lending Facilities ASSA Meetings San Francisco John B. Taylor Stanford
Banking, Liquidity Transformation, and Bank Runs
 Banking, Liquidity Transformation, and Bank Runs ECON 30020: Intermediate Macroeconomics Prof. Eric Sims University of Notre Dame Spring 2018 1 / 30 Readings GLS Ch. 28 GLS Ch. 30 (don t worry about model
Interest Rate Policies for the People s Republic of China: Some Considerations
 Interest Rate Policies for the People s Republic of China: Some Considerations 1.The Objectives of Interest Rate Policies The rate of interest (and its term structure) is an extremely important instrument
Too Big to Fail Causes, Consequences and Policy Responses. Philip E. Strahan. Annual Review of Financial Economics Conference.
 Too Big to Fail Causes, Consequences and Policy Responses Philip E. Strahan Annual Review of Financial Economics Conference October, 13 Too Big to Fail is a credibility problem Markets expect creditors
JUPITER POLICE OFFICER'S RETIREMENT FUND INVESTMENT PERFORMANCE PERIOD ENDING SEPTEMBER 30, 2008
 JUPITER POLICE OFFICER'S RETIREMENT FUND INVESTMENT PERFORMANCE PERIOD ENDING SEPTEMBER 30, 2008 NOTE: For a free copy of Part II (mailed w/i 5 bus. days from request receipt) of Burgess Chambers and Associates,
Understanding the Policy Response to the Financial Crisis. Macroeconomic Theory Honors EC 204
 Understanding the Policy Response to the Financial Crisis Macroeconomic Theory Honors EC 204 Key Problems in the Crisis Bank Solvency Declining home prices and rising mortgage defaults put banks in danger
Division of Bond Finance Interest Rate Calculations. Revenue Estimating Conference Interest Rates Used for Appropriations, including PECO Bond Rates
 Division of Bond Finance Interest Rate Calculations Revenue Estimating Conference Interest Rates Used for Appropriations, including PECO Bond Rates November 16, 2018 Division of Bond Finance Calculation
Lecture notes on risk management, public policy, and the financial system Forms of leverage
 Lecture notes on risk management, public policy, and the financial system Allan M. Malz Columbia University 2018 Allan M. Malz Last updated: March 12, 2018 2 / 18 Outline 3/18 Key postwar developments
Who Borrows from the Lender of Last Resort? 1
 Who Borrows from the Lender of Last Resort? 1 Itamar Drechsler, Thomas Drechsel, David Marques-Ibanez and Philipp Schnabl NYU Stern and NBER ECB NYU Stern, CEPR, and NBER November 2012 1 The views expressed
Monetary policy of the ECB, its concepts and tools
 Monetary policy of the ECB, its concepts and tools Frankfurt am Main, 20 September 2011 Markus A. Schmidt Directorate Monetary Policy 1 Disclaimer The views expressed are those of the presenter and should
Effective Investment Policy and Strategies
 Agenda for Today Effective Policy and Strategies For Today s Economic Environment Objectives and Goals Decisions Policy Permissible s Strategy Implementation Case Studies 2 Objectives & Goals Making Informed
ABI MONTHLY REPORT 1 July 2018 (Main evidence)
") ABI MONTHLY REPORT 1 July 2018 (Main evidence) LOANS AND DEPOSITS 1. In June 2018, loans to customers granted by banks operating in Italy, totalling 1,773.8 billion euro (cf. Table 1) was 37 billion higher
ABI MONTHLY REPORT 1 July 2018 (Main evidence) LOANS AND DEPOSITS 1. In June 2018, loans to customers granted by banks operating in Italy, totalling 1,773.8 billion euro (cf. Table 1) was 37 billion higher
Part III. Cycles and Growth:
 Part III. Cycles and Growth: UMSL Max Gillman Max Gillman () AS-AD 1 / 56 AS-AD, Relative Prices & Business Cycles Facts: Nominal Prices are Not Real Prices Price of goods in nominal terms: eg. Consumer
Federal Reserve as Lender of Last Resort In Pictures September 26, 2008
 Northern Trust Global Economic Research 5 South LaSalle Chicago, Illinois 663 northerntrust.com Asha G. Bangalore agb3@ntrs.com Federal Reserve as Lender of Last Resort In Pictures September 26, 28 The
Big Walnut Local School District
 Big Walnut Local School District Monthly Financial Report for the month ended September 30, 2013 Prepared By: Felicia Drummey Treasurer BIG WALNUT LOCAL SCHOOL DISTRICT SUMMARY OF YEAR TO DATE FINANCIAL
Shanghai Market Turning the Corner
 Shanghai Market Turning the Corner C. H. Kwan Senior Fellow, Nomura Institute of Capital Markets Research When the Lehman Shock hit major global stock markets in mid-september 2008, the Shanghai Composite
Common stock prices 1. New York Stock Exchange indexes (Dec. 31,1965=50)2. Transportation. Utility 3. Finance
2. Transportation. Utility 3. Finance") Digitized for FRASER http://fraser.stlouisfed.org/ Federal Reserve Bank of St. Louis 000 97 98 99 I90 9 9 9 9 9 9 97 98 99 970 97 97 ""..".'..'.."... 97 97 97 97 977 978 979 980 98 98 98 98 98 98 987 988
Digitized for FRASER http://fraser.stlouisfed.org/ Federal Reserve Bank of St. Louis 000 97 98 99 I90 9 9 9 9 9 9 97 98 99 970 97 97 ""..".'..'.."... 97 97 97 97 977 978 979 980 98 98 98 98 98 98 987 988
ABI MONTHLY REPORT 1 March 2018 (Main evidence)
") ABI MONTHLY REPORT 1 March 2018 (Main evidence) LOANS AND DEPOSITS 1. In February 2018, loans to customers granted by banks operating in Italy, totalling 1,777.2 billion euro (cf. Table 1) was almost 70
ABI MONTHLY REPORT 1 March 2018 (Main evidence) LOANS AND DEPOSITS 1. In February 2018, loans to customers granted by banks operating in Italy, totalling 1,777.2 billion euro (cf. Table 1) was almost 70
ncia THE WEEK'S HIGHLIGHTS:
 December 17, 1992 U.S. Fk>EC vo Bank [ 982Data 2 1 ncia THE WEEK'S HIGHLIGHTS: Privately owned housing starts rose from a seasonally adjusted annual rate of1,224,000 units in October to 1,242,000 units
The Real Effects of Disrupted Credit Evidence from the Global Financial Crisis
 The Real Effects of Disrupted Credit Evidence from the Global Financial Crisis Ben S. Bernanke Distinguished Fellow Brookings Institution Washington DC Brookings Papers on Economic Activity September 13
Macroeconomic Risks for Farmer Cooperatives
 Macroeconomic Risks for Farmer Cooperatives KFSA Directors & Management Meeting Hutchinson, KS November 21 st, 2011 Brian C. Briggeman Associate Professor and Director of the Arthur Capper Cooperative
The U.S. Economic Paradox after the 2008 Financial Crisis: Expansion of Money without Inflation
 The U.S. Economic Paradox after the 2008 Financial Crisis: Expansion of Money without Inflation Jay Pham Dr. Tanya Bennett Honors 3000 Fall 2017 A. Introduction In modern economies, regardless if you are
Euro GC Pooling. Continues Dynamic Growth. Frankfurt, February 29, 2008
 Continues Dynamic Growth Frankfurt, February 29, 2008 Agenda Introduction Eurex Repo: Latest Development Euro GC Pooling: Overview and latest Development Outlook Page 2 Eurex Repo Development of Outstanding
Implementing Monetary Policy: Transition Tools
 Implementing Monetary Policy: Transition Tools Julie Remache Central Banking Seminar Oct 6, 2015 The views expressed in this presentation reflect the author s and do not necessarily reflect that of the
Security Analysis: Performance
 Security Analysis: Performance Independent Variable: 1 Yr. Mean ROR: 8.72% STD: 16.76% Time Horizon: 2/1993-6/2003 Holding Period: 12 months Risk-free ROR: 1.53% Ticker Name Beta Alpha Correlation Sharpe
QUARTERLY REPORT AND CERTIFICATION OF THE COUNTY TREASURER For Quarter Ending June 30, 2009 COMPLIANCE CERTIFICATION
 QUARTERLY REPORT AND CERTIFICATION OF THE COUNTY TREASURER For Quarter Ending June 30, 2009 The Government Code requires the County Treasurer to render a Quarterly Report to the County Administrator, the
Financial Crises, Dollarization and Lending of Last Resort in Open Economies
 Financial Crises, Dollarization and Lending of Last Resort in Open Economies Luigi Bocola Stanford, Minneapolis Fed, and NBER Guido Lorenzoni Northwestern and NBER Restud Tour Reunion Conference May 2018
Investment Tips & Techniques
 Investment Tips & Techniques Ohio Association of Public Treasurers June 15, 2017 Presented by Jason Click President, Public Funds Meeder Investment Management Jason Headings Sr. Vice President, Director
Algo Trading System RTM
 Year Return 2016 15,17% 2015 29,57% 2014 18,57% 2013 15,64% 2012 13,97% 2011 55,41% 2010 50,98% 2009 48,29% Algo Trading System RTM 89000 79000 69000 59000 49000 39000 29000 19000 9000 2-Jan-09 2-Jan-10
LIQUIDITY PROVISION DURING THE CRISIS OF 1914: PRIVATE AND PUBLIC SOURCES
 LIQUIDITY PROVISION DURING THE CRISIS OF 1914: PRIVATE AND PUBLIC SOURCES BY MARGARET M. JACOBSON* ELLIS W. TALLMAN** For presentation at: the Workshop on Monetary and Financial History held at the Federal
HUD NSP-1 Reporting Apr 2010 Grantee Report - New Mexico State Program
 HUD NSP-1 Reporting Apr 2010 Grantee Report - State Program State Program NSP-1 Grant Amount is $19,600,000 $9,355,381 (47.7%) has been committed $4,010,874 (20.5%) has been expended Grant Number HUD Region
FUEL PRICE RISK MANAGEMENT POLICY REPORT "FUEL HEDGE"
 FUEL PRICE RISK MANAGEMENT POLICY REPORT "FUEL HEDGE" Sep-18 FUEL PRICE RISK MANAGEMENT POLICY REPORT Sep-18 (Office of Management and Budget 09/30/2018) The Fuel Price Risk Management Policy approved
Big Walnut Local School District
 Big Walnut Local School District Monthly Financial Report for the month ended September 30, 2012 Prepared By: Felicia Drummey Treasurer BIG WALNUT LOCAL SCHOOL DISTRICT SUMMARY OF YEAR-TO-DATE FINANCIAL
Liquidity is Relevant Again
 Liquidity is Relevant Again April 2019 Not FDIC Insured May Lose Value No Bank Guarantee Not NCUA or NCUSIF insured. May lose value. No credit union guarantee. For institutional use only. l 2019 FMR LLC.
Asset Liability Management Report 4 Q 2018
 Asset Liability Management Report 4 Q 2018 Performance Indicators and Key Measures Cash, Investment and Debt Balances Book Value ($M) Restricted Cash and Investments 529.8 Unrestricted Cash and Investments
Global Securities Lending Business and Market Update
 NORTHERN TRUST 2009 INSTITUTIONAL CLIENT CONFERENCE GLOBAL REACH, LOCAL EXPERTISE Global Securities Lending Business and Market Update Michael A. Vardas, CFA Managing Director Quantitative Management and
Financial Markets Fall 2008 Economic Update
 Financial Markets Fall 28 Economic Update October 7, 28 Jeff Rubin Chief Economist, Chief Strategist Avery Shenfeld Managing Director, Senior Economist Crash in Commodity Prices Exaggerates Growth Slowdown
SEPTEMBER 2017 MARKET COMMENTARY
 SEPTEMBER 2017 MARKET COMMENTARY The Liquidity Risk Premium in Corporate Credit 1 The Liquidity Risk Premium in Corporate Credit By Jason M. Thomas and Mark Jenkins Between 2001 and June 2017, middle-market
Weathering Uncertain Markets
 Weathering Uncertain Markets Key principles for lifetime investing Introduction Managing an investment portfolio for the long term is partly a test of willpower. Your emotions and instincts will be urging
Choosing a Cell Phone Plan-Verizon Investigating Linear Equations
 Choosing a Cell Phone Plan-Verizon Investigating Linear Equations I n 2008, Verizon offered the following cell phone plans to consumers. (Source: www.verizon.com) Verizon: Nationwide Basic Monthly Anytime
Development of the contemporary financial system
 Lecture notes on risk management, public policy, and the financial system Development of the contemporary financial system Allan M. Malz Columbia University 2018 Allan M. Malz Last updated: March 14, 2018
Review of Membership Developments
 RIPE Network Coordination Centre Review of Membership Developments 7 October 2009/ GM / Lisbon http://www.ripe.net 1 Applications development RIPE Network Coordination Centre 140 120 100 80 60 2007 2008
XML Publisher Balance Sheet Vision Operations (USA) Feb-02
 Feb-02") Page:1 Apr-01 May-01 Jun-01 Jul-01 ASSETS Current Assets Cash and Short Term Investments 15,862,304 51,998,607 9,198,226 Accounts Receivable - Net of Allowance 2,560,786
Page:1 Apr-01 May-01 Jun-01 Jul-01 ASSETS Current Assets Cash and Short Term Investments 15,862,304 51,998,607 9,198,226 Accounts Receivable - Net of Allowance 2,560,786
Investec Structured Return Note. 10 January 2019
 Investec Structured Return Note 10 January 2019 Table of contents Page Introduction and overview 3 Investec Structured Return Note pay-off 5 Return comparison to inflation, rates, equity and balance funds
Factors Impacting Investment Opportunities. Market Environment. Agenda. Economic Update and Investment Tips
 Agenda Economic Update and Investment Tips Presented to: Ohio Association of Public Treasurers June 16, 2016 Current economic factors Portfolio right-sizing Municipal securities Brokered CDs Step-up agency
Managing Global Shocks: The Case of Indonesia
 Managing Global Shocks: The Case of Indonesia Dr. Hartadi A. Sarwono Deputy Governor IIF Asian Regional Economic Forum Singapore, March 5, 2009 Outline 2 1. Crisis highlights 2. Macroconomic Condition
Article from: Risk Management. March 2015 Issue 32
 Article from: Risk Management March 2015 Issue 32 VIX & Tails: Hedging With Volatility By Rocky Fishman 9 8 7 6 5 4 3 1 REGIME: SINGLE-DIGIT RV RARE Apr-04 Jan-05 Sep-05 Jun-06 Mar-07 Dec-07 Sep-08 Jun-09
Should Unconventional Monetary Policies Become Conventional?
 Should Unconventional Monetary Policies Become Conventional? Dominic Quint and Pau Rabanal Discussant: Annette Vissing-Jorgensen, University of California Berkeley and NBER Question: Should LSAPs be used
Stylized Financial System
 Procyclicality and Capital Flows: Emerging Market Perspective Hyun Song Shin Bank of Thailand International Symposium 2010: Challenges to Central Banks in the Era of the New Globalization October 14 15,
GS Global ECS Credit Strategy Research. March 31, Alberto Gallo, CFA Goldman, Sachs & Co
 The Goldman Sachs Group, Inc. Goldman Sachs Research The CLO market shows signs of life GS Global ECS Credit Strategy Research March 31, 11 Alberto Gallo, CFA Goldman, Sachs & Co. 1-917-33-31 alberto.gallo@gs.com
Financial Crises and the Great Recession
 Financial Crises and the Great Recession ECON 30020: Intermediate Macroeconomics Prof. Eric Sims University of Notre Dame Spring 2018 1 / 40 Readings GLS Ch. 33 2 / 40 Financial Crises Financial crises
Exchange Rates and Agricultural Commodity Prices
 Exchange Rates and Agricultural Commodity Prices Philip Abbott, Exchange Rates, Prices, and Agricultural Trade: What Have We Learned? IATRC sponsored International Track session, AAEA Annual Meeting Denver,
5 th ANNUAL SKBI CONFERENCE 2015ON "DIGITAL BANKING, FINANCIAL INCLUSION AND IMPACT INVESTING" P2P in China
 5 th ANNUAL SKBI CONFERENCE 2015ON "DIGITAL BANKING, FINANCIAL INCLUSION AND IMPACT INVESTING" P2P in China Dr. Rui, Oliver Meng(CFA, FRM) Professor of Finance and Accounting Director Ph.D. Program Co-director
Investing in Municipal Bonds in a Rising Rate Environment
 Investing in Municipal Bonds in a Rising Rate Environment February, 2015 The value of patience and active management to bond fund investors After 32 years of generally downward trending interest rates,
Discussion of The Great Escape? A Quantitative Evaluation of the Fed s Non- Standard Policies by Del Negro, Eggertsson, Ferrero, and Kiyotaki
 Discussion of The Great Escape? A Quantitative Evaluation of the Fed s Non- Standard Policies by Del Negro, Eggertsson, Ferrero, and Kiyotaki Zheng Liu, FRB San Francisco March 5, 2010 The opinions expressed
+1 = + +1 = X 1 1 ( ) 1 =( ) = state variable. ( + + ) +
 1 =( ) = state variable. ( + + ) +") 26 Utility functions 26.1 Utility function algebra Habits +1 = + +1 external habit, = X 1 1 ( ) 1 =( ) = ( ) 1 = ( ) 1 ( ) = = = +1 = (+1 +1 ) ( ) = = state variable. +1 ³1 +1 +1 ³ 1 = = +1 +1 Internal?
26 Utility functions 26.1 Utility function algebra Habits +1 = + +1 external habit, = X 1 1 ( ) 1 =( ) = ( ) 1 = ( ) 1 ( ) = = = +1 = (+1 +1 ) ( ) = = state variable. +1 ³1 +1 +1 ³ 1 = = +1 +1 Internal?
Illinois Job Index Note: BLS revised its estimates for the number of jobs and seasonal adjustment method at the beginning of 2010.
 Illinois Job Index Release Data Issue 4/21/2010 Jan 1990 / Mar 2010 Note: BLS revised its estimates for the number of jobs and seasonal adjustment method at the beginning of 2010. For April Illinois Job
CREDIT UNION TRENDS REPORT
 CREDIT UNION TRENDS REPORT CUNA Mutual Group Economics March 1 (January 1 Data) Highlights During January, credit unions picked up 3, in new memberships, and loan and savings balances grew at an 11.% and.%
The Financial Crisis. Yale. Marinus van Reymerswaele, 1567
 The Financial Crisis Gary Gorton Yale Marinus van Reymerswaele, 1567 What is the crisis? What you saw: firms fail, get acquired, or get bailed out (Lehman Brothers, Bear Stearns, Merrill Lynch, AIG); people
Annual Investment Report
 Annual Investment Report Snyder Independent School District As of August 31, 2013 Snyder Independent School District Annual Investment Report As of August 31, 2013 In addition to monthly investment reports
Repurchase Agreements
 Repurchase Agreements Educational Session May 13, 2015 AMERICAN COUNCIL OF LIFE INSURERS 101 Constitution Ave., N.W., Washington, DC 20001-2133 OVERVIEW 2 What Is A Repurchase Transaction? Short-term collateralized
Presentation at the 2011 Philadelphia Fed Policy Forum December 2, University of Maryland & NBER
 Presentation at the 2011 Philadelphia Fed Policy Forum December 2, 2011 Enrique G. Mendoza Enrique G. Mendoza University of Maryland & NBER 1. Short: May/Dec. 2010 Greece, Ireland plans 2. Tall: July 2011
The ECB s Strategy in Good and Bad Times Massimo Rostagno European Central Bank
 The ECB s Strategy in Good and Bad Times Massimo Rostagno European Central Bank The views expressed herein are those of the presenter only and do not necessarily reflect those of the ECB or the European
Microeconomics of Banking: Lecture 2
 Microeconomics of Banking: Lecture 2 Prof. Ronaldo CARPIO September 25, 2015 A Brief Look at General Equilibrium Asset Pricing Last week, we saw a general equilibrium model in which banks were irrelevant.
New Risk Management Strategies
 Moderator: Jon Najarian, Co-Founder, optionmonster.com New Risk Management Strategies Wednesday, May 4, 2011; 2:30 PM - 3:45 PM Speakers: Jim Lenz, Chief Credit and Risk Officer, Wells Fargo Advisors John
Mortgage REITs and Reaching for yield. Aurel Hizmo, Stijn Van Nieuwerburgh and James Vickery
 Mortgage REITs and Reaching for yield Aurel Hizmo, Stijn Van Nieuwerburgh and James Vickery 1 Financial intermediation and low interest rates Important for policymakers to monitor emerging financial system
Arbitrage, liquidity and exit: The repo and federal funds market before, during, and after the financial crisis
 Arbitrage, liquidity and exit: The repo and federal funds market before, during, and after the financial crisis Morten Bech (FRBNY), Elizabeth Klee (FRB), and Viktors Stebunovs (FRB) May 21, 2011 The views
Quarterly Chartbook. June 30, What happened, where are we now, and what do we expect?
 Quarterly Chartbook June 30, 2009 What happened, where are we now, and what do we expect? What happened? At the end of the day, the market events of the past twenty-four months can be attributed to poor
Membership Report November 2018
 Membership Report November 2018 Agenda Financial Commentary 2018 Budget/Actual Net Income Actual/Budget Variance Total Managed Assets On- & Off-Balance Sheet Liquidity Commentary Historical Member Overnight
Japan Securities Finance Co.,Ltd
 Japan Securities Finance Co.,Ltd \ mil ( )ratio of OR Mar-13 Mar-14 Securities Finance Bussiness 14,093 16,363 Margin Loan Business 6,625 9,240 (37.5%) (47.2%) Interest on Loans 1,760 4,012 Interest
Challenges of financial globalisation and dollarisation for monetary policy: the case of Peru
 Challenges of financial globalisation and dollarisation for monetary policy: the case of Peru Julio Velarde During the last decade, the financial system of Peru has become more integrated with the global
Calendar of Releases. Titles for the current week are links to their respective releases. Retail Sales (Sep) Business Inventories (Aug) PPI (Sep)
 Business Inventories (Aug) PPI (Sep)") USFinancialData MONDAY* Calendar of Releases Titles for the current week are links to their respective releases. October 10, 2008 Final Edition TUESDAY WEDNESDAY THURSDAY* FRIDAY October 6 October 7 October
USFinancialData MONDAY* Calendar of Releases Titles for the current week are links to their respective releases. October 10, 2008 Final Edition TUESDAY WEDNESDAY THURSDAY* FRIDAY October 6 October 7 October
ABI MONTHLY REPORT 1 January 2017 (Main evidence)
") ABI MONTHLY REPORT 1 January 2017 (Main evidence) LOANS AND DEPOSITS 1. At the end of 2016, loans to customers granted by banks operating in Italy, totalling 1,807.7 billion euro (cf. Table 1) was nearly
ABI MONTHLY REPORT 1 January 2017 (Main evidence) LOANS AND DEPOSITS 1. At the end of 2016, loans to customers granted by banks operating in Italy, totalling 1,807.7 billion euro (cf. Table 1) was nearly
Leandro Conte UniSi, Department of Economics and Statistics. Money, Macroeconomic Theory and Historical evidence. SSF_ aa
 Leandro Conte UniSi, Department of Economics and Statistics Money, Macroeconomic Theory and Historical evidence SSF_ aa.2017-18 Learning Objectives ASSESS AND INTERPRET THE EMPIRICAL EVIDENCE ON THE VALIDITY
Executive Board meeting. 14 December 2011
 Executive Board meeting December EU measures ECB Key policy rate has been reduced to. percent Measures: Liquidity operation with a maturity of months Reserve requirements reduced from to per cent Reduced
Payments, Credit & Asset Prices
 Payments, Credit & Asset Prices Monika Piazzesi Stanford & NBER Martin Schneider Stanford & NBER CITE August 13, 2015 Piazzesi & Schneider Payments, Credit & Asset Prices CITE August 13, 2015 1 / 31 Dollar