Disclosure Statement. Page 2
|
|
|
- Ethelbert Bell
- 5 years ago
- Views:
Transcription
1
2 Disclosure Statement Page 2 This presentation and the accompanying slides (the Presentation ) which have been prepared by Samsonite International S.A. ( Samsonite or the Company ) do not constitute any offer or invitation to purchase or subscribe for any securities, and shall not form the basis for or be relied on in connection with any contract or binding commitment whatsoever. This Presentation has been prepared by the Company based on information and data which the Company considers reliable, but the Company makes no representation or warranty, express or implied, whatsoever, on the truth, accuracy, completeness, fairness and reasonableness of the contents of this Presentation. This Presentation may not be all-inclusive and may not contain all of the information that you may consider material. Any liability in respect of the contents of or any omission from this Presentation is expressly excluded. Certain matters discussed in this presentation may contain statements regarding the Company s market opportunity and business prospects that are individually and collectively forward-looking statements. Such forward-looking statements are not guarantees of future performance and are subject to known and unknown risks, uncertainties and assumptions that are difficult to predict. The Company s actual results, levels of activity, performance or achievements could differ materially and adversely from results expressed in or implied by this Presentation, including, amongst others: whether the Company can successfully penetrate new markets and the degree to which the Company gains traction in these new markets; the sustainability of recent growth rates; the anticipation of the growth of certain market segments; the positioning of the Company s products in those segments; the competitive environment; general market conditions and potential impacts on reported results of foreign currency fluctuations relative to the U.S. dollar. The Company is not responsible for any forward-looking statements and projections made by third parties included in this Presentation.
3 Agenda Results Highlights Business Overview Financial Overview Outlook and Strategy for 2016 Q&A Page 3


4 2015 Results Highlights Record net sales with constant currency growth of 11.9% +11.7% on a constant currency basis, excluding FX gain/loss and sharebased compensation expenses % Constant Currency Growth +11.8% Constant Currency Growth +12.6% Constant Currency Growth +9.5% Constant Currency Growth Constant currency net sales growth of US$280 million, partly offset by negative currency translation impact of US$198 million. Gross margin was down 30bp from 2014 largely due to the negative impact of currency on US Dollar purchases and higher proportion of B2B sales. Adjusted EBITDA margin improved by 10bp from 2014 to 2015 mainly driven by reduced advertising spend as a percentage of net sales, partly offset by slightly lower gross margins. Excluding FX gain/loss and share-based compensation expense, Adjusted Net Income as a percentage of net sales was up 30bp from 9.5% in 2014 to 9.8% in 2015 largely due to higher Adjusted EBITDA as a percentage of net sales and lower effective tax rate. Page 4 Indicates % of net sales FX gain/(loss) represents the realized and unrealized net loss on the balance sheet translation of amounts not denominated in local currencies
5 2015 Business Overview 2015 marketing spend of US$132.1 million was 5.4% of net sales, down from 6.2% in 2014 to help offset currency pressure. Sustained investment in brands Strong constant currency growth of 22.5% in total direct-to-consumer channel net sales with retail up 21.1% and direct-to-consumer e-commerce up 30.8%. Total e-commerce net sales (direct-toconsumer e-commerce and wholesale to e-retailers) constitutes 8.5% of total net sales, up 190bp from 6.6% in Multi-channel strategy Strong growth in all regions Operating cash flow of US$259.0 million and net cash position at December 31, 2015 of US$116.6 million provides solid platform to execute future growth plans. Multicategory strategy Strong constant currency net sales growth in all regions: Asia: +12.8% North America: +7.4% Europe: +17.7% Latin America: +8.6% (+14.9% excluding Brazil) Multi-brand strategy Core brands showing strong constant currency net sales growth: Samsonite: +5.7% American Tourister: +16.7% Strong constant currency net sales growth across all product categories: Travel: +8.7% Business: +16.3% Casual: +10.8% Accessories: +35.0% Page 5 Strong results underscore the resilience of our multi-brand, multicategory and multi-channel strategy
 North America: +3.4% Latin America: +8.6% Incremental net sales of US$61.1 million from 2014 acquired brands coming from: Speck: +US$26.1 million Gregory: +US$24.1 million Lipault: +US$10.")
6 Strong Net Sales growth partly offset by currency translation pressure US$m Net Sales bridge to 2015 Organic net sales growth of 9.8% (2) coming from: Asia: +11.1% (2) Europe: +15.9% (2) North America: +3.4% Latin America: +8.6% Incremental net sales of US$61.1 million from 2014 acquired brands coming from: Speck: +US$26.1 million Gregory: +US$24.1 million Lipault: +US$10.9 million Currency translation had an adverse impact of US$198.2 million on reported net sales as nearly all currencies devalued significantly to the US Dollar compared to Page 6 Stated on a constant currency basis (2) Includes additional net sales from the purchase of Rolling Luggage and Chic Accent retail chains.
7 Negative currency translation impact of US$198 million on Net Sales and US$32 million on Adjusted EBITDA US$M 2015 Currency Impact vs. Prior Year Currency Deval. vs. PY Net Sales EBITDA Canada -13.6% $ (6.6) $ (1.2) North America (6.6) (1.2) Chile -13.0% (8.6) (1.1) Mexico -16.1% (7.5) (0.8) Brazil -31.7% (3.6) 1.0 Other Latin America (1.7) (0.1) Latin America (21.4) (1.0) All regions were negatively impacted by currency devaluation to the US Dollar, reducing reported net sales and Adjusted EBITDA growth by US$198.2 million and US$31.6 million, respectively. Page 7 Eurozone countries -16.5% (71.9) (13.4) Russia -37.3% (16.6) (2.4) UK -7.2% (4.9) (0.3) Other Europe (18.3) (2.8) Europe (111.7) (18.9) Japan -12.3% (13.5) (1.3) Korea -7.2% (14.0) (2.4) Australia -17.0% (11.6) (2.5) India -4.8% (6.8) (1.6) China -1.7% (4.3) (0.9) Other Asia (8.3) (1.8) Asia (58.5) (10.5) Total Samsonite $ (198.2) $ (31.6) Excluding impact of currency translation, 2015 Adjusted EBITDA would have been US$432.8 million, up 12.6% from US$384.3 million in 2014.


8 Significant increase in Adjusted EBITDA margin from 1 st half to 2 nd half Constant currency net sales growth slowed in the 2 nd half due largely to the anniversarying of 2014 acquired brands. Excluding acquired brands, constant currency net sales growth slowed from 11.0% in 1 st half of 2015 to 8.6% in 2 nd half of 2015, mainly due to the timing of B2B sales in China as well as recent market headwinds in the greater China market. Adjusted EBITDA as a percentage of net sales increased by 120bp from 15.9% in 1 st half of 2015 to 17.1% in 2 nd half of 2015, largely driven by: Gross margin improvement of 120bp from 52.0% in 1 st half of 2015 to 53.2% in 2 nd half of 2015 due mainly to channel mix, selective price increases in certain markets implemented in the 2 nd half to help offset product cost increases due to currency devaluation to the USD, lower commodity prices and cost reductions in the Speck business; Advertising spend as a percentage of net sales decreased by 90bp from 5.9% in 1 st half of 2015 to 5.0% in 2 nd half of 2015 because Europe invested more in American Tourister marketing in the 1 st half to help drive higher sales in the peak summer selling season; Page 8 Indicates % of net sales Partly offset by higher selling expenses as a percentage of net sales due to fixed expenses associated with net new retail stores.
9 Asia Continued strong net sales and profit growth led by China, Japan, Australia and India +12.8% Constant Currency Growth Excluding brand acquisitions, constant currency net sales growth of 11.1% (2). Indicates % of net sales Strong full year constant currency net sales growth of 12.8% (2), despite a Q4 slowdown, was driven by: Strong net sales growth of 17.7% (2) in direct-to-consumer channels with: Retail store net sales growth of 10.8% (2) coming from 39 net new company operated stores added in 2015, including 10 net new Rolling Luggage stores, and the full year impact of 41 net new stores added during This was partly offset by a 6.5% decrease in same store comps due largely to adverse retail conditions in Hong Kong and Macau from fewer Chinese tourists and the MERS outbreak in Korea; Direct-to-consumer e-commerce net sales growth of 48.5%. Net sales growth of 11.8% in wholesale channels with 73.2% growth in net sales to e-retailers; Samsonite net sales growth of 9.6%, with Samsonite Red up 23.8% as the brand expanded into new key markets within the region and all other Samsonite brands up 7.7% ; American Tourister net sales growth of 9.0% ; Acquired brands gaining sales traction with High Sierra up 28.4%, Hartmann new to the region with net sales of US$5.4 million and Gregory with net sales of US$18.5 million; Travel category net sales increased by 10.4%, while Casual is up 18.0%, driven mostly by Samsonite Red, Gregory and High Sierra. The business category was up 16.7%. Continued strong Adjusted EBITDA margin of 21.2% with; 110bp reduction in advertising as a percentage of net sales to help offset translation impact of currency; Leveraging higher sales on a relatively fixed cost structure; Partly offset by 170bp reduction in gross margin largely due to the negative impact of currency on product costing and increased B2B sales. Stated on a constant currency basis (2) Includes additional net sales from the purchase of the Rolling Luggage retail chain in February Page 9
10 Asia Continued strong net sales, despite recent headwinds in certain markets Strong net sales growth in China of 13.0% in 2015 was largely driven by B2B +49.5% and total e-commerce +92.3%. After sharp net sales growth of 29.8% in the 1 st half, largely bolstered by timing of B2B sales, growth in China slowed in the 2 nd half. Excluding the timing of B2B sales, net sales growth of 2.6% in the 2 nd half was well below 1 st half net sales growth of 11.5%, largely attributable to weaker consumer sentiment. South Korea net sales growth of 4.5% in 2015 was softened by the MERS outbreak. 2 nd half net sales growth of 4.3% was down slightly from 4.8% growth in the 1 st half. India strong net sales growth of 12.0% in 2015, with 1 st half net sales growth of 13.0% reduced slightly to 10.9% in the 2 nd half. Sharp net sales growth of 37.7% in Japan was partly attributable to the full year impact of Gregory. Excluding Gregory, Japan net sales were still up a very strong 26.7% driven by the Samsonite, American Tourister and Hartmann brands. The combined markets of Hong Kong and Macau had net sales growth of 3.1%, which was softened by same store sales comps of -24.2% due to lower Chinese tourist arrivals. Australia net sales growth of 39.4% was partly due to the addition of six Rolling Luggage stores. Excluding net sales from the Rolling Luggage stores, the market s net sales growth was still a strong 31.3%, largely driven by growth in American Tourister +88.3%, Samsonite +16.0% and High Sierra +30.1%. Stated on a constant currency basis Page 10

11 China Strong full year performance despite net sales growth decelerating in 2 nd half China Net Sales by Channel 2015 constant currency net sales growth of 13.0% was driven by: 92.3% increase in total e-commerce net sales; and 49.5% increase in B2B sales. Net sales deceleration in the 2 nd half of 2015 is due to: Timing of large B2B orders was front-end loaded in 2015 but back-end loaded in 2014; and Other channels slowing due to weaker consumer sentiment and business migrating online. Samsonite net sales growth of 19.4% driven by Samsonite Red with net sales up 58.3% and all other Samsonite brands up 14.6%. American Tourister net sales grew by 1.9%. High Sierra net sales up 112.9% and Hartmann up 237.6% with expanded distribution. Kamiliant and Lipault launched in 2 nd half of Travel category net sales increased by 5.9%, while Casual was up 53.7% and Business was up 23.5%. Stated on a constant currency basis Page 11

12 North America Strong net sales growth in wholesale with challenges in retail due to decreased tourism as a result of strengthened US Dollar +7.4% Constant Currency Growth Excluding brand acquisitions, constant currency net sales growth of 3.4%. Indicates % of net sales Net sales increased 7.4% driven by: Excluding brand acquisitions, net sales growth in the wholesale channel was driven by 3.3% increase in the U.S., with sell-throughs continuing to outpace the category in most key accounts, and 14.9% increase in Canada wholesale net sales. Excluding brand acquisitions, direct-to-consumer channel net sales were relatively flat year-over-year as: The retail channel was down 1.9%, challenged by a 6.0% decrease in same store sales comps due mainly to lower foreign tourist arrivals as a result of the strong US Dollar, partly offset by 16 net new stores 2015 and the full year impact of 8 net new stores in 2014; Direct-to-consumer e-commerce net sales increased by 14.7% (+18.3% including acquisitions). Samsonite net sales +3.4% and American Tourister net sales +18.3%. High Sierra and Hartmann net sales were down 8.4% and 5.6%, respectively, due to off-price sales in 2014 not repeated in Full year impact from 2014 acquisitions of Speck and Gregory, delivering incremental net sales of US$26.1 million and US$8.0 million, respectively. Travel, Business and Casual category net sales growth of 5.2%, 3.9% and 0.4%, respectively, with 38.6% growth in Accessories due mainly to Speck smartphone protective cases. Adjusted EBITDA as a percentage of net sales was flat year-on-year with decreased profitability in the retail channel due to lower same store sales comps offset by substantial improvements in Speck s gross margins through product and fixed cost reductions. Stated on a constant currency basis Page 12
13 Europe Strong net sales growth of 17.7% on a constant currency basis +17.7% Constant Currency Growth Excluding brand acquisitions, constant currency net sales growth of 15.9% (2)(3). Indicates % of net sales Constant currency net sales growth of 17.7%, led by UK (+41.5% (2) ), Germany (+17.4% (2) ), and Italy (+18.9% (3) ). Russia net sales growth of 9.0%, despite macroeconomic and geopolitical challenges. Strong growth of 48.9% in direct-to-consumer channels with: Retail up 51.6% (2)(3), driven by +8.3% same store comps, 79 net new company operated stores opened in 2015, including 21 net new Rolling Luggage stores and 30 net new Chic Accent stores, and the full year impact of 25 net new stores opened during 2014; Direct-to-consumer e-commerce net sales increased by 24.3%. Samsonite net sales up 4.6% and American Tourister net sales increased 88.3% as a result of a strategic initiative to accelerate American Tourister brand penetration in the region; Acquired brands gaining sales traction with Lipault %, High Sierra % and Hartmann new to the region with net sales of US$1.5 million in 2015; Net sales for the Travel category increased by 10.9% (2) ; Business category net sales increased by 39.0% due to the success of new product introductions and Casual category net sales increased by 26.6%, largely due to the growth of High Sierra and contribution of Gregory. Accessories increased by 55.4% mainly due to additional sales through the acquired retail businesses. Adjusted EBITDA margin decreased by 10bp due largely to the impact of the acquired retail businesses during the integration phase. Excluding the impact of Rolling Luggage and Chic Accent, Europe s Adjusted EBITDA margin increased by 50bp. Stated on a constant currency basis (2) Includes additional net sales from the purchase of the Rolling Luggage retail chain in February 2015 (3) Includes additional net sales from the purchase of the Chic Accent retail chain in September 2015 Page 13
14 Latin America Investment in retail expansion, team and infrastructure to position the region for future growth +8.6% Constant Currency Growth Indicates % of net sales Net sales increased 8.6% on strong growth in Mexico (+17.4% (2) ) and Chile (+12.9% ), partly offset by Brazil (-28.2% ). Net sales in Brazil were down due to challenging economic market conditions. Also, 2014 included approximately US$6.0 million of net sales from inventory reductions not repeated in Excluding Brazil, net sales in the region are up 14.9% ; Retail channel net sales growth of 18.5% coming from 28 net new company owned stores opened during 2015, the full year impact of 11 net new stores opened during 2014 and same store comps up 2.6%. Excluding Brazil, comps were up 3.8%. Wholesale channel net sales increased by 4.5% ; Samsonite net sales increased 3.1%, as strong increases in Mexico +10.8% and Colombia +82.3% were offset by decreases in Brazil -16.4% ; Strong net sales growth in Xtrem (+21.1% ), Saxoline (+12.9% ) and Secret (+14.4% ), while American Tourister remained relatively flat and High Sierra decreased 17.6% as Xtrem became the primary casual bag brand for the region. Adjusted EBITDA as a percentage of net sales was up 70bp mainly driven by: 270bp improvement in gross margin largely due to inventory reductions in Brazil in 2014 not repeated in 2015, partly offset by the negative impact of currency on product costing; 70bp increase in advertising as a percentage of net sales to drive market share increases, particularly in Brazil, Colombia, Panama and Peru; Higher operating expenses associated with investing in retail expansion, team and infrastructure to position the region for strong growth in the coming years. Page 14 Stated on a constant currency basis (2) Mexico, excluding export sales
15 Strong constant currency Net Sales growth in all key markets Page 15 Includes Macau

16 Continued brand penetration driving constant currency Net Sales growth in most emerging markets Strong constant currency growth, however US$16.6 million decrease in net sales due to currency translation Includes approximately US$6.0 million disposal of inventory from former distributors. US$3.6 million decrease due to currency translation Page 16 Mexico, excluding export sales


17 Strong growth in e-commerce and targeted retail expansion Rolling Luggage - Sydney Airport, Australia Japan e- commerce website Net sales growth of 40.4% in e-commerce was driven by: 30.8% growth in direct-to-consumer e-commerce platform net sales, included within the Direct to Consumer channel. 48.1% growth in net sales to e-retailers, included within the Wholesale channel. Net sales growth of 21.1% in retail stores was driven by targeted retail expansion, mainly focused on airport locations, multi-brand concepts and a broader presence in Brazil: Added 162 net new company operated stores during 2015, including 31 net new Rolling Luggage stores and 30 net Chic Accent stores. Full year impact of 85 net new stores added during Same store constant currency sales comps were roughly flat compared to prior year due to a challenging retail environment, particularly in U.S. tourist gateway markets, Hong Kong, Macau and South Korea. Stated on a constant currency basis House of Samsonite - Jakarta, Indonesia U.S. e-commerce website U.S. e-commerce website Page 17 Chic Accent Rimini, Italy Belgium e-commerce website Lipault Madrid, Spain
. The acquisition provides a significant retail footprint in some of the leading airports in Europe and the Asia Pacific region.")
18 Rolling Luggage and Chic Accent contribute to growth in the retail channel On February 16, 2015, the assets and certain liabilities of Rolling Luggage were purchased for a total of GBP 15.0 million (US$23.0 million). The acquisition provides a significant retail footprint in some of the leading airports in Europe and the Asia Pacific region. The Rolling Luggage acquisition provides a great multi-brand platform to showcase our brands and collections to the travelling consumer. From the date of acquisition, Rolling Luggage contributed US$27.6 million of net sales to the consolidated financial results of the Group for the year ended December 31, Integration progressing according to plan. On September 30, 2015, the business and substantially all of the assets of Chic Accent were purchased for a final cash consideration of EUR6.4 million (US$7.1 million). The acquisition provides the Group with 30 prime retail store locations in Italy dedicated to premium accessories, ladies handbags, travel luggage and business products, and further expands the Group s portfolio of retail store locations. From the date of acquisition, Chic Accent contributed US$5.6 million of net sales to the consolidated financial results of the Group for the year ended December 31, Integration progressing according to plan. Page 18
19 All brands delivering strong Net Sales growth Constant Currency Growth Net Sales growth by brand Continued growth in Samsonite with net sales up 5.7% on a constant currency basis: 5.7% 16.7% n/m -1.5% Brands acquired since IPO contributed US$272.5 million of net sales in (2) (2) (2) n/m 30.9% n/m 45.1% Asia +9.6%, Europe +4.6%, North America +3.4% and Latin America +3.1%. American Tourister net sales up 16.7% on a constant currency basis as the brand continues to grow in established markets while further penetrating into European markets: Asia +9.0%, North America +18.3% ; Focus on further globalizing the brand has resulted in strong growth in Europe +88.3%. High Sierra net sales up in Asia and Europe by US$2.1 million and US$1.2 million, respectively, as the brand began to gain some traction in new markets. Hartmann net sales up in Asia and Europe by US$4.2 million and US$1.1 million, respectively, supported by investment in product development and advertising. Speck, Gregory and Lipault were all up substantially to prior year due largely to the full year impact in 2015 as the brands were acquired during 2014 (2). Constant currency growth of 45.1% in Other brands is driven mainly by increased net sales of Secret, Saxoline and Xtrem brands in Latin America, more 3 rd party brands as a result of the Rolling Luggage and Chic Accent acquisitions and the introduction of Kamiliant, a new entry level value brand, in Asia. Stated on a constant currency basis. (2) Speck, Gregory and Lipault brands were acquired in May 2014, July 2014 and April 2014, respectively. Page 19


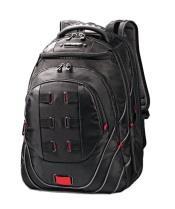
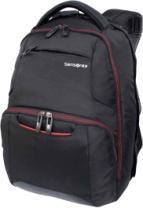
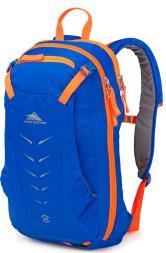
20 Brands Acquired in Update Lipault is a youthful, vibrant and chic French luggage brand known for its functional and fashionable designs. Executing on strategy to expand the brand into Asia and North America, appealing to the female fashion consumer. Contributed US$13.8 million of net sales in Speck produces a diverse range of sleek, stylish, and functionally innovative products that provide superior military-grade protection for mobile devices and is particularly well-known for its slim protection designs. Profitability dramatically improved through sourcing and packaging cost savings and SG&A expense reductions. Contributed US$117.7 million of net sales in Gregory is an iconic technical outdoor backpack brand that is known as a pioneer in its field and is well-respected by active outdoor and adventure enthusiasts. Gregory is also a popular brand for lifestyle products in Japan and represents a unique opportunity to further develop and replicate the success of the premium lifestyle fashion brand in other key Asian markets. Profitability improved through SG&A expense reductions, largely in the U.S. Contributed US$34.3 million of net sales in Page 20


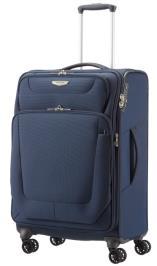
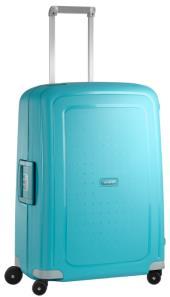

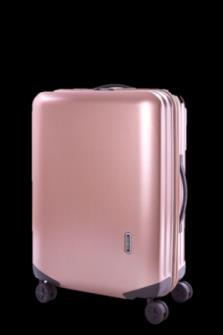
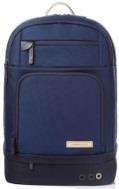
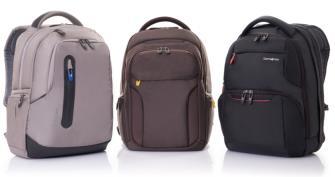
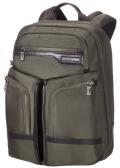
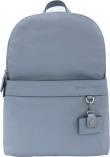
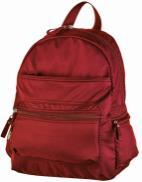
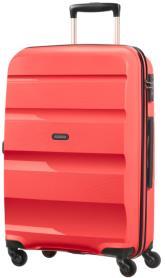
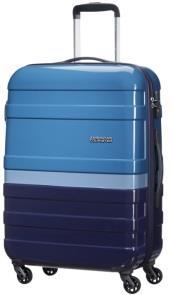
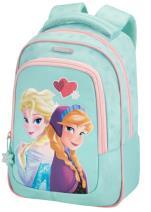
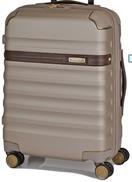
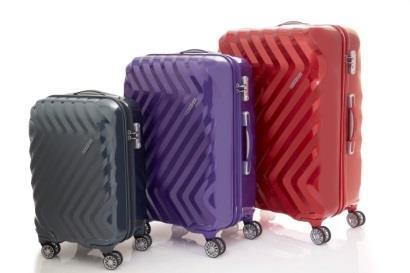
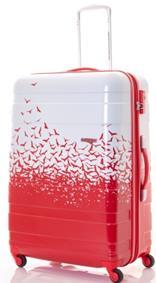

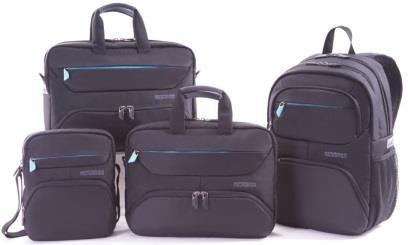
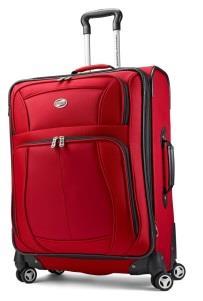
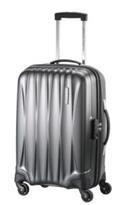
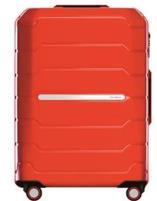
21 Key Product Assortment North America Europe Asia North America Asia Europe Latin America Page 21

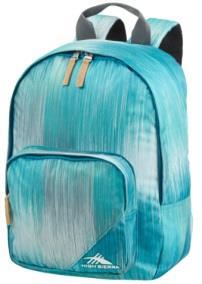
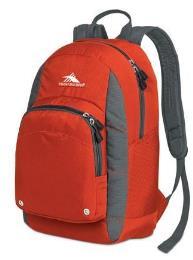
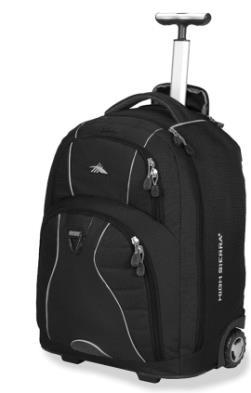
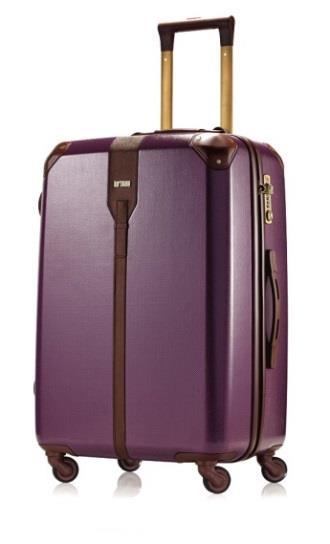


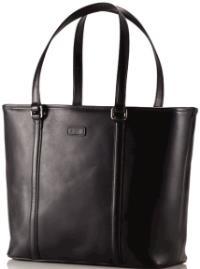
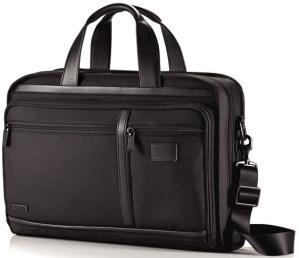
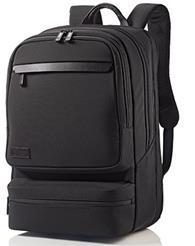
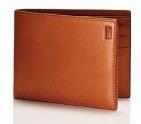

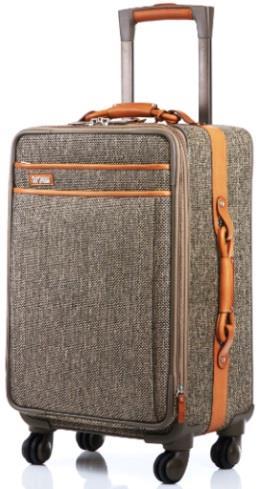
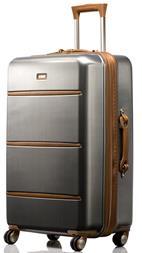
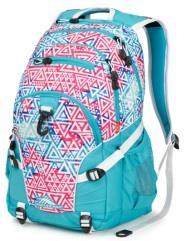

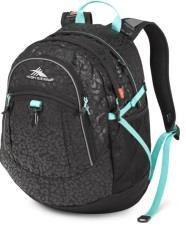


22 Key Product Assortment North America Asia Europe Page 22
23 Strong Net Sales growth in all product categories Constant Currency Growth Net Sales growth by product category Non-Travel categories constitute US$771.6 million of net sales in 2015, representing 31.7% of total net sales compared to US$414.7 million, or 23.4% of total net sales in % 16.3% 10.8% 35.0% 37.2% Travel remains our largest product category and traditional strength with all regions contributing to its growth of 8.7%. Non-travel net sales increased from 29.6% of total net sales in 2014 to 31.7% of total net sales in 2015: Net sales in the Business category increased by 16.3%, largely due strong growth in Asia (+16.7%) and Europe (+39.0%) ; Casual category net sales increased by 10.8% driven by the acquisition of Gregory, growth of Samsonite Red in Asia, and the extension of High Sierra in Asia and Europe; Growth of 35.0% in the Accessories category was mainly attributable to the acquisition of Speck as well as strong growth in Europe (+55.4%, including Chic Accent), Latin America (+19.6% driven mainly by Secret) and Asia (+8.4% ); Growth in the Other category was driven largely by net sales of 3 rd party products in Rolling Luggage stores. Stated on a constant currency basis Page 23

24 Advertising spend was roughly flat on a constant currency basis Advertising spend Indicates % of net sales Total advertising spend was roughly flat to prior year on a constant currency basis. As a percentage of net sales, total constant currency advertising spend was 5.5%, 70bp lower than prior year to help mitigate the negative impact of currency translation on the Group s Adjusted EBITDA. Europe advertising as a percentage of net sales was down 110bp from prior year partly due to higher net sales from Rolling Luggage and Chic Accent and to help offset negative impact of currency translation. Latin America advertising as a percentage of net sales was up 70bp from prior year to drive further brand awareness in markets where we are extending our retail presence. Page 24


25 Targeted Brand Advertising Samsonite Business Airport - India American Tourister North America Samsonite Travel Adelaide Airport, Australia Hartmann Europe Page 25 High Sierra Asia American Tourister Europe
26 Key Financial Highlights Page 26 Strong constant currency net sales growth of US$280 million, or 11.9%, partly offset by US$198 million reduction of reported net sales due to currency translation. Excluding impact of currency translation, 2015 Adjusted EBITDA was US$432.8 million, up 12.6% from US$384.3 million in Strong operating cash flow generation of US$259.0 million, up 12.7% compared to prior year of US$229.9 million. Solid balance sheet with a net cash position of US$116.6 million with borrowing capacity on the revolving credit facility of US$449.3 million as of December 31, Net working capital efficiency of 11.8% continued to run favorable to target level of 14% and better than last year of 12.7%. Capital expenditure of US$68.5 million in 2015 was largely focused on the Group s continuing strategy to pursue targeted retail expansion and lead the industry in new product innovations. Excluding FX gain/loss and share-based compensation expense, Adjusted Net Income as a percentage of net sales was up 30bp from 2014 driven by stronger Adjusted EBITDA margin and 190bp reduction in the effective tax rate from 27.3% in 2014 to 25.4% in On March 16, 2016, the Company s Board of Directors recommended that a cash distribution of US$93.0 million or approximately US$ per share be paid in July 2016, up 5.7% from the US$88.0 million distribution paid in July FX gain/loss represents the realized and unrealized net gain/loss on the balance sheet translation of amounts not denominated in local currencies
27 Strong Balance Sheet US$m December 31, December 31, Cash and cash equivalents % Trade and other receivables, net (7.3) -2.5% Inventories, net % Other current assets % Non-current assets 1, , % Total Assets 2, , % Current liabilities (excluding debt) % Non-current liabilities (excluding debt) (15.3) -6.9% Total borrowings (2.4) -3.6% Total equity 1, , % Total Liabilities and Equity 2, , % Total Net Cash (Debt) % Total Net Cash (Debt) excludes deferred financing costs, which are included in total borrowings. $ C hg D ec-15 vs. D ec-14 % C hg D ec-15 vs. D ec-14 Net cash increased by US$43.7 million to US$116.6 million at December 31, 2015 with cash flows from operations of US$259.0 million reduced by outflows for acquisitions (Rolling Luggage approximately US$23.0 million, purchase of the non-controlling interest of the Russia JV US$15.7 million, and acquisition of Chic Accent US$7.1 million), capital expenditures of US$68.5 million and cash distribution of US$88.0 million. Continued strong working capital efficiency of 11.8%. At December 31, 2015, US$449.3 million of the US$500 million revolving credit facility is available for borrowing. Page 27
28 Efficiently managing Working Capital US$m December 31, December 31, $ Chg dec-15 % Chg dec vs. dec-14 vs. dec-14 Working Capital Items Inventories $ $ $ % Trade and Other Receivables $ $ $ (7.3) -2.5% Trade Payables $ $ $ % Net Working Capital $ $ $ (19.5) -6.4% % of Net Sales 12.7% 11.8% Turnover Days Inventory Days Trade and Other Receivables Days Trade Payables Days Net Working Capital Days net working capital as a percentage of net sales and turnover days are adjusted for pro forma first half and full year net sales and cost of sales of Lipault, Speck and Gregory Working capital continued to be managed efficiently at 11.8% of net sales at December 31, 2015, favorable to targeted 14% level. Inventory turnover of 111 days was up 5 days from the year ended December 31, 2014 due to timing of inventory purchases mainly in North America and Europe, partly driven by an earlier Chinese New Year in Trade and other receivables turnover of 43 days was one day less than the year ended December 31, 2014, partly due to slightly higher proportion of net sales coming from direct-to-consumer channels. Trade payables turnover of 109 days was up 9 days from the year ended December 31, 2014 due largely to the timing of inventory purchases and payments as well as rolling out vendor financing programs to more vendors. Inventory turnover days calculated as ending inventory balance divided by cost of sales for the period and multiplied by the number of days in the period Trade and other receivables turnover days calculated as ending trade and other receivables balance divided by net sales for the period and multiplied by the number of days in the period Trade payables turnover days calculated as ending trade payables balance divided by cost of sales for the period and multiplied by the number of days in the period Net working capital efficiency (% of net sales) is calculated as net working capital divided by annualized net sales Page 28
29 Capital Expenditure Capital Expenditure by project type US$m Retail Product Development / R&D/ Supply Information Services and Facilities Other Total Capital Expenditures $69.6 $ retail capex consisted of new stores and remodels in Asia of US$12.8 million, Europe of US$9.7 million, North America of US$6.4 million and Latin America of US$4.8 million. Capex on Product Development / R&D / Supply includes US$2.1 million on manufacturing facilities and equipment and US$5.1 million on product tooling and molds in Europe. US$5.1 million was spent on tooling and equipment for Speck in North America. In Asia US$8.4 million was spent towards a project to rebuild our warehouse and service-after-sales facility in China, expected to be completed in Information Services and Facilities included US$1.4 million for office relocations and renovations in China and Japan and US$1.2 million for additional ERP system licenses. Page 29
30 Engines Of Future Growth Increase in disposable incomes and living standards in developing countries, growing popularity of outdoor and adventure sports and growth of the tourism industry are all expected to drive growth of the global luggage market at a CAGR of 5.8% through 2020 : Continue to develop the Company into a well-diversified multi-brand, multi-category and multi-channel luggage, bag and accessories business. Tactfully deploy multiple brands to operate at broader price points and wider consumer demographics in each category. Increase the proportion of net sales from our direct-to-consumer channels by growing our e- commerce net sales and through targeted expansion of our retail presence. Continue to invest in our core brands with exciting and innovative new products, new materials and effective marketing spend. Invest in newly acquired brands to further diversify our product offering into Non-Travel categories. Source: Global Luggage Market , Technavio, 2015 Page 30
Disclosure Statement. Page 2
 Disclosure Statement Page 2 This presentation and the accompanying slides (the Presentation ) which have been prepared by Samsonite International S.A. ( Samsonite or the Company ) do not constitute any
Disclosure Statement. Page 2
 Disclosure Statement Page 2 This presentation and the accompanying slides (the Presentation ) which have been prepared by Samsonite International S.A. ( Samsonite or the Company ) do not constitute any
Disclosure Statement. Page 2
 Disclosure Statement This presentation and the accompanying slides (the Presentation ) which have been prepared by Samsonite International S.A. ( Samsonite or the Company ) do not constitute any offer
2017 Interim Results
 2017 Interim Results Disclosure Statement Page 2 This presentation and the accompanying slides (the Presentation ) which have been prepared by Samsonite International S.A. ( Samsonite or the Company )
2017 Third Quarter Results
 Samsonite International S.A. HKEX Stock Code: 1910 2017 Third Quarter Results November 13, 2017 Disclosure Statement Page 2 This presentation and the accompanying slides (the Presentation ) which have
Disclosure Statement. Page 2
 Disclosure Statement Page 2 This presentation and the accompanying slides (the Presentation ) which have been prepared by Samsonite International S.A. ( Samsonite or the Company ) do not constitute any
Disclosure Statement. Page 2
 Disclosure Statement Page 2 This presentation and the accompanying slides (the Presentation ) which have been prepared by Samsonite International S.A. ( Samsonite or the Company ) do not constitute any
Samsonite International S.A. Publishes 2017 Third Quarter Report
 Samsonite International S.A. Publishes 2017 Third Quarter Report Double-digit Constant Currency Net Sales Growth Reported Across All Regions for the Three Months Ended September 30, 2017 HONG KONG, November
2018 First Quarter Results May 14, Samsonite International S.A. Stock Code 1910
 2018 First Quarter Results May 14, 2018 Samsonite International S.A. Stock Code 1910 Disclosure Statement Page 2 This presentation and the accompanying slides (the Presentation ) which have been prepared
(Incorporated in Luxembourg with limited liability) (Stock code: 1910)
 (Stock code: 1910)") (Incorporated in Luxembourg with limited liability) (Stock code: 1910) Samsonite International S.A. Announces 2014 Final Results Double-digit Revenue and EBITDA Growth for the Fifth Consecutive Year Net
(Incorporated in Luxembourg with limited liability) (Stock code: 1910) Samsonite International S.A. Announces 2014 Final Results Double-digit Revenue and EBITDA Growth for the Fifth Consecutive Year Net
Samsonite International S.A.
 Samsonite International S.A. 13 15 avenue de la Liberté, L-1931 Luxembourg R.C.S. Luxembourg: B 159.469 (Incorporated under the laws of Luxembourg with limited liability) Consolidated financial statements
SAMSONITE INTERNATIONAL S.A.
 Hong Kong Exchanges and Clearing Limited and The Stock Exchange of Hong Kong Limited take no responsibility for the contents of this announcement, make no representation as to its accuracy or completeness
Samsonite International S.A Avenue de la Liberte, L-1931, Luxembourg RCS Luxembourg: B (Incorporated under the laws of Luxembourg with
 Samsonite International S.A. 13 15 Avenue de la Liberte, L-1931, Luxembourg RCS Luxembourg: B159469 (Incorporated under the laws of Luxembourg with limited liability) Consolidated financial statements
Samsonite International S.A. Announces 2013 Interim Results
 Samsonite International S.A. Announces 2013 Interim Results Highlights Samsonite s net sales for the six months ended June 30, 2013 increased by 16.5% 1 to another record US$983.6 million with growth across
Samsonite International S.A. Announces 2013 Final Results Net sales top a record US$2 billion for the first time
 (Incorporated in Luxembourg with limited liability) (Stock code: 1910) Samsonite International S.A. Announces 2013 Final Results Net sales top a record US$2 billion for the first time Highlights Samsonite
Samsonite International S.A. Announces 2018 Annual Results Net Sales Hits New Record of US$3.8 Billion
 Samsonite International S.A. Announces 2018 Annual Results Net Sales Hits New Record of US$3.8 Billion HONG KONG, March 13, 2019 Samsonite International S.A. ( Samsonite or the Company, together with its
Interim Results. For the six months ended June 30, 2011
 Interim Results For the six months ended June 30, 2011 Agenda Business and Financial Highlights Business Overview Financial Overview Concluding Remarks 2 Business Highlights in 1H 2011 Significant sales
Samsonite International S.A Interim Report. * For identification purposes only
 Samsonite International S.A. 2013 Interim Report * For identification purposes only Stock Code 1910 Contents 02 Corporate Information 03 Corporate Profile and Strategy 04 Financial Highlights 06 Chairman
(Stock code: 1910) Operating profit increased by US$16.2 million, or 11.9%, year-on-year to US$152.3 million.
 Operating profit increased by US$16.2 million, or 11.9%, year-on-year to US$152.3 million.") Hong Kong Exchanges and Clearing Limited and The Stock Exchange of Hong Kong Limited take no responsibility for the contents of this announcement, make no representation as to its accuracy or completeness
Hong Kong Exchanges and Clearing Limited and The Stock Exchange of Hong Kong Limited take no responsibility for the contents of this announcement, make no representation as to its accuracy or completeness
SAMSONITE INTERNATIONAL S.A.
 Hong Kong Exchanges and Clearing Limited and The Stock Exchange of Hong Kong Limited take no responsibility for the contents of this announcement, make no representation as to its accuracy or completeness
SAMSONITE INTERNATIONAL S.A.
 Hong Kong Exchanges and Clearing Limited and The Stock Exchange of Hong Kong Limited take no responsibility for the contents of this announcement, make no representation as to its accuracy or completeness
Full Year 2018 Results. 27 February 2019
 Full Year 2018 Results 27 February 2019 1. Key Highlights and Financial Summary Strong financial performance across all segments and progress made on all aspects of the strategic framework Financial Highlights
SAMSONITE INTERNATIONAL S.A. 新秀麗國際有限公司
 Hong Kong Exchanges and Clearing Limited and The Stock Exchange of Hong Kong Limited take no responsibility for the contents of this announcement, make no representation as to its accuracy or completeness
CONTINUING CONNECTED TRANSACTIONS IN RELATION TO THE SAMSONITE CHINA FRAMEWORK AGREEMENT
 Hong Kong Exchanges and Clearing Limited and The Stock Exchange of Hong Kong Limited take no responsibility for the contents of this announcement, make no representation as to its accuracy or completeness
July 26, 2017 LafargeHolcim Ltd 2015
 Second Quarter 2017 Results Beat Hess, Chairman and Interim CEO Roland Köhler, Interim COO and Regional Head of Europe, Australia/NZ & Trading Ron Wirahadiraksa, CFO July 26, 2017 LafargeHolcim Ltd 2015
IMCD reports 25% EBITA growth in 2018
 Press release IMCD reports 25% EBITA growth in 2018 Rotterdam, The Netherlands (1 March 2019) - IMCD N.V. ( IMCD or Company ), a leading distributor of speciality chemicals and food ingredients, today
CONTINUING CONNECTED TRANSACTIONS IN RELATION TO THE TAINWALA LEAVE AND LICENSE AGREEMENT
 Hong Kong Exchanges and Clearing Limited and The Stock Exchange of Hong Kong Limited take no responsibility for the contents of this announcement, make no representation as to its accuracy or completeness
Roadshow Zurich // MainFirst. HUGO BOSS Company Handout August 6, Roadshow Zurich // MainFirst HUGO BOSS August 7, / 52
 Roadshow Zurich // MainFirst HUGO BOSS Company Handout August 6, 2014 Roadshow Zurich // MainFirst HUGO BOSS August 7, 2014 2 / 52 Agenda Half Year Results 2014 Update on Key Strategic Initiatives Outlook
Roadshow Scandinavia // equinet
 Roadshow Scandinavia // equinet HUGO BOSS Company Handout August 12-14, 2014 Dennis Weber, Head of Investor Relations Roadshow Scandinavia // equinet HUGO BOSS August 12-14, 2014 2 / 52 Agenda Half Year
Interim results. for the half-year ended 30 September 2010
 Interim results for the half-year ended 30 September 2010 Agenda Results Highlights Strategic Review and Future Prospects 2 1. Results Highlights (million ) Net sales Operating profit Net profit 1 400
Roadshow London // Deutsche Bank
 Roadshow London // Deutsche Bank HUGO BOSS Company Handout August 6, 2014 Mark Langer (CFO) & Dennis Weber (Head of Investor Relations) Roadshow London // Deutsche Bank HUGO BOSS August 6, 2014 2 / 52
Roadshow Frankfurt // Kepler Cheuvreux
 Roadshow Frankfurt // Kepler Cheuvreux HUGO BOSS Company Handout August 5, 2014 Mark Langer (CFO) & Dennis Weber (Head of Investor Relations) Roadshow Frankfurt // Kepler Cheuvreux HUGO BOSS August 5,
L OCCITANE EN PROVENCE EN PROVENCE. Final results. for the year ended 31 March 2011
 Final results for the year ended 31 March 2011 Agenda Results Highlights Strategic Review and Future Prospects 2 1. Results Highlights (million ) Net sales Operating profit Net profit 900 800 +26.1%, +
HUGO BOSS First Half Year Results 2014
 HUGO BOSS First Half Year Results 2014 Claus-Dietrich Lahrs (CEO), Mark Langer (CFO) Metzingen, July 31, 2014 Conference Call, First Half Year Results 2014 HUGO BOSS July 31, 2014 2 / 42 Agenda Half Year
Samsonite International S.A. (Société Anonyme)
") Samsonite International S.A. (Société Anonyme) Annual accounts As at December 31, 2015 (with the report of the Réviseur d'entreprises Agréé thereon) Address of the registered office: 13 15, Avenue de la
Samsonite International S.A. (Société Anonyme) Annual accounts As at December 31, 2015 (with the report of the Réviseur d'entreprises Agréé thereon) Address of the registered office: 13 15, Avenue de la
COACH, INC. REPORTS FISCAL 2016 FIRST QUARTER RESULTS
 COACH, INC. REPORTS FISCAL 2016 FIRST QUARTER RESULTS First Quarter Net Sales Increased 3% Over Prior Year In Constant Currency; Down 1% On A Reported Basis First Quarter Non-GAAP Earnings Per Share was
1H 2018 Results Update Analyst Presentation
 1H 2018 Results Update Analyst Presentation July 31, 2018-6.00 PM CET Disclaimer This presentation contains forward-looking statements regarding future events and results of the Company that are based
901 S. Central Expressway, Richardson, TX 75080
 901 S. Central Expressway, Richardson, TX 75080 FOSSIL GROUP REPORTS THIRD QUARTER RESULTS Net Sales Increase 18% to $810 Million Diluted EPS Increases 25% to $1.58 Maintains Full Year EPS Guidance and
Financial Information
 Financial Information H1 revenues reached 12.8bn up 9.8%, flat org. in Q2 Adj. EBITA reached 1.6bn, up 6.4%, Adj. EBITA margin flat excl. Invensys in a challenging environment 2015 targets: Around flat
Investor Meeting Presentation
 September 2015 HUGO BOSS September 2015 2 Agenda Financial Review First Half Year 2015 Strategic Outlook 2015 and beyond Financial Outlook 2015 HUGO BOSS September 2015 3 Agenda Financial Review First
901 S. Central Expressway, Richardson, TX 75080
 901 S. Central Expressway, Richardson, TX 75080 FOSSIL GROUP REPORTS RECORD SECOND QUARTER RESULTS Net Sales Increase 11% to a Record $706 Million EPS Increases 25% to a Record $1.15 Provides Third Quarter
SAMSONITE INTERNATIONAL S.A.
 Hong Kong Exchanges and Clearing Limited and The Stock Exchange of Hong Kong Limited take no responsibility for the contents of this announcement, make no representation as to its accuracy or completeness
Full-Year 2016 Results
 7 Full-Year 2016 Results This version published on March 24 th, 2017 solves a printing problem on page 8 of the version dated March 2 nd, 2017 and put online at this date Adjusted revenue up +5.8% to 3,392.8
FINAL RESULTS ANNOUNCEMENT FOR THE YEAR ENDED 31 MARCH 2010 FINANCIAL HIGHLIGHTS. Own stores number reached 764, increased by 11.
 Hong Kong Exchanges and Clearing Limited and The Stock Exchange of Hong Kong Limited take no responsibility for the contents of this announcement, make no representation as to its accuracy or completeness
Q Results. Lars Brorsen (CEO) Christoph Hobo (CFO) November 22, 2018
 Christoph Hobo (CFO) November 22, 2018") Q3 2018 Results Lars Brorsen (CEO) Christoph Hobo (CFO) November 22, 2018 Agenda 1. Highlights Q3 2018 2. Market outlook 3. Detailed results review 4. Company outlook 5. Q&A Appendix 1 Business summary
Q3 2018 Results Lars Brorsen (CEO) Christoph Hobo (CFO) November 22, 2018 Agenda 1. Highlights Q3 2018 2. Market outlook 3. Detailed results review 4. Company outlook 5. Q&A Appendix 1 Business summary
1H FY19 RESULTS PRESENTATION 25 February 2019
 RELIANCE WORLDWIDE CORPORATION LIMITED ACN 610855877 1H FY19 RESULTS PRESENTATION 25 February 2019 INVESTOR PRESENTATION 1H FY19 RESULTS PAGE 0 Important Notice This presentation contains general information
SAMSONITE INTERNATIONAL S.A.
 Hong Kong Exchanges and Clearing Limited and The Stock Exchange of Hong Kong Limited take no responsibility for the contents of this announcement, make no representation as to its accuracy or completeness
FY 2017 Results Update Analyst Presentation
 FY 2017 Results Update Analyst Presentation March 8, 2018-6.00 PM CET Disclaimer This presentation contains forward-looking statements regarding future events and results of the Company that are based
Quarterly Statement for Q Metzingen, November 6, 2018
 Quarterly Statement for Q3 2018 Metzingen, November 6, 2018 HUGO BOSS records solid sales growth in the third quarter Full-year sales and earnings guidance confirmed Currency-adjusted sales up 1% in the
Press release 8 March RESULTS
 2011 RESULTS Slight growth in sales, supported by emerging markets Current Operating Income of 2.2bn Net income, Group share, down 14%, impacted by significant one off elements Net debt reduced by more
EAST BALT BAKERIES July 2017 ACQUISITION
 EAST BALT BAKERIES July 2017 ACQUISITION E AST BA LT AT A G L A N C E Leading foodservice-focused company that supplies baked goods to Quick Service Restaurants ( QSR ) across the world Operates 21 bakeries
COACH, INC. REPORTS FISCAL 2017 SECOND QUARTER RESULTS; DRIVES DOUBLE-DIGIT EARNINGS GROWTH
 COACH, INC. REPORTS FISCAL 2017 SECOND QUARTER RESULTS; DRIVES DOUBLE-DIGIT EARNINGS GROWTH Second Quarter Net Sales Increased 4% Over Prior Year Despite North America Wholesale Strategic Repositioning
Third Quarter 2017 Results Jan Jenisch, CEO Ron Wirahadiraksa, CFO. October 27, 2017 LafargeHolcim Ltd 2015
 Third Quarter 2017 Results Jan Jenisch, CEO Ron Wirahadiraksa, CFO October 27, 2017 LafargeHolcim Ltd 2015 01 Initial views Q3 2017 and Outlook Jan Jenisch, Chief Executive Officer 2017 LafargeHolcim 2
Investor Presentation Q Results. 21 May 2015
 Investor Presentation 2015 Results 21 May 2015 1 Forward-looking statements This presentation contains forward-looking statements, including, but not limited to, the statements and expectations contained
Quarterly Statement for Q Metzingen, May 2, gets off to a successful start for HUGO BOSS
 Quarterly Statement for 2018 Metzingen, May 2, 2018 2018 gets off to a successful start for HUGO BOSS Currency-adjusted Group sales up 5% in the first quarter Retail comp store sales up 7% Online business
Quarterly Statement for Q Metzingen, May 3, HUGO BOSS starts the year with higher sales and earnings
 Quarterly Statement for 2017 Metzingen, May 3, 2017 HUGO BOSS starts the year with higher sales and earnings Currency-adjusted sales growth of 1% in the first quarter Positive development in Europe and
First Quarter 2016, Champion Europe and Knights Apparel FAQs
 First Quarter 2016, Champion Europe and Knights Apparel FAQs Updated April 21, 2016 New or updated information is in red First Quarter 2016 and HBI related FAQs Q: Can you provide an update on your various
Agenda. Company Overview Annual Financial Results. Business Review and Prospects
 Disclaimer This presentation and the accompanying slides (the Presentation ) which have been prepared by IGG INC (the Company ) do not constitute any offer or invitation to purchase or subscribe for any
SPREADING PARISIAN CHIC ACROSS THE WORLD. December, 2017
 SPREADING PARISIAN CHIC ACROSS THE WORLD December, 2017 TODAY S TEAM Daniel Lalonde President & CEO Philippe Gautier CFO & Operations Director / 2 OUR INTERNATIONAL SUCCESS STORY #1 CREATION OF SANDRO
SABMiller plc. Full year results Twelve months ended 31 March Graham Mackay, Chief Executive Jamie Wilson, Chief Financial Officer.
 SABMiller plc Full year results Twelve months ended 31 March 2012 Graham Mackay, Chief Executive Jamie Wilson, Chief Financial Officer 24 May 2012 Forward looking statements This presentation includes
Investor Meeting Presentation
 Investor Meeting Presentation November 2014 Investor Meeting Presentation HUGO BOSS November 2014 2 / 54 Agenda Update on Key Strategic Initiatives Nine Months Results 2014 Outlook Investor Meeting Presentation
Presentation 22 August 2018
 Presentation 22 August 2018 Exceeded 3YP targets in 2017, but 2018 is challenging due to continued destocking, store closures and bankruptcies Profit attributable to shareholders (like-for-like) down 19%
Forward-Looking Statements
 SEPTEMBER 15, 2009 Forward-Looking Statements Certain statements in this presentation may contain forward-looking statements. These forward-looking statements are identified by the use of terms and phrases
SABMiller plc. Full year results Twelve months ended 31 March Jamie Wilson, Chief Financial Officer Gary Leibowitz, SVP, Investor Relations
 SABMiller plc Full year results Twelve months ended 31 March 2012 Jamie Wilson, Chief Financial Officer Gary Leibowitz, SVP, Investor Relations 24 May 2012 Forward looking statements This presentation
3Q 2017 net sales. Milan, October 23, 2017
 3Q 2017 net sales Milan, October 23, 2017 FORWARD-LOOKING STATEMENT Certain statements in this investor presentation may constitute forward-looking statements as defined in the Private Securities Litigation
HUGO BOSS confirms full-year sales and earnings forecast substantial progress made in implementing strategic realignment
 Quarterly Statement for Q2 2017 Metzingen, August 2, 2017 HUGO BOSS confirms full-year sales and earnings forecast substantial progress made in implementing strategic realignment Currency-adjusted sales
HY 2018 Results. Record EBITDA & free cash flow generation. August 3, 2018
 HY 2018 Results Record EBITDA & free cash flow generation August 3, 2018 Legal Disclaimer Information in this presentation may involve guidance, expectations, beliefs, plans, intentions or strategies regarding
Q EARNINGS CALL
 Tom Goeke Chief Executive Officer Q2 2017 EARNINGS CALL JULY 27, 2017 IMPORTANT INFORMATION Forward Looking Statements These slides contain (and the accompanying oral discussion will contain) forward looking
TELECONFERENCE FY 2014 FINANCIAL RESULTS
 TELECONFERENCE FY 2014 FINANCIAL RESULTS 10:00 CET, 17 February 2015 1 DISCLAIMER Certain statements in this presentation constitute forward-looking statements. Forward-looking statements are statements
Interim results FOR THE six months ENDED 30 September 2011
 Interim results FOR THE six months ENDED 30 September 2011 1 2 1 FINANCIAL REVIEW Creative culture AND innovation SUSTAINING COMPETITIVE ADVANTAGE QUESTIONS 3 First half achievements RECORD FIRST HALF
Bernstein Strategic Decisions Conference // London
 Bernstein Strategic Decisions Conference // London HUGO BOSS Company Handout September 17, 2014 Dennis Weber, Head of Investor Relations Bernstein Strategic Decisions Conference // London HUGO BOSS September
IGG Inc. March Annual Results
 IGG Inc. March 2017 Annual Results Disclaimer This presentation and the accompanying slides (the Presentation ) which have been prepared by IGG INC (the Group ) do not constitute any offer or invitation
Quarterly Statement for Q Metzingen, November 2, HUGO BOSS increases pace of growth in own retail
 Quarterly Statement for Q3 2017 Metzingen, November 2, 2017 HUGO BOSS increases pace of growth in own retail Currency-adjusted sales up 3% in the third quarter Retail comp store sales up 5% EBITDA before
For the year ended 31 March Change. Net sales 1, , % Net sales growth at constant FX rates +4.6%
 Highlights For the year ended 31 March 2017 2018 Change (million ) Net sales 1,323.2 1,319.4-0.3% Net sales growth at constant FX rates +4.6% Gross profit margin 83.3% 83.3% - Operating profit margin 12.7%
BIC GROUP 9 MONTHS 2012 RESULTS. Regulatory News: BIC (Paris:BB):
:") BIC GROUP 9 MONTHS 2012 RESULTS Regulatory News: BIC (Paris:BB): NET SALES UP 4.0% ON A COMPARATIVE BASIS AT 1,434.6 MILLION EUROS NORMALIZED IFO: 298.9 MILLION EUROS NORMALIZED IFO MARGIN: 20.8% o EXCLUDING
BIC GROUP 9 MONTHS 2012 RESULTS Regulatory News: BIC (Paris:BB): NET SALES UP 4.0% ON A COMPARATIVE BASIS AT 1,434.6 MILLION EUROS NORMALIZED IFO: 298.9 MILLION EUROS NORMALIZED IFO MARGIN: 20.8% o EXCLUDING
Important Notice. The sum totals throughout this presentation may not add exactly due to rounding differences.
 Important Notice This presentation contains general information about Reliance Worldwide Corporation Limited s activities at the date of presentation (26 February 2018). It is information given in summary
FY2018 RESULTS PRESENTATION 27 August 2018
 RELIANCE WORLDWIDE CORPORATION LIMITED ACN 610855877 FY2018 RESULTS PRESENTATION 27 August 2018 INVESTOR PRESENTATION FY18 RESULTS PAGE 0 Important Notice This presentation contains general information
TELECONFERENCE Q FINANCIAL RESULTS
 TELECONFERENCE FINANCIAL RESULTS 10:00 CET, 13 May 2014 1 AGENDA AGENDA Business highlights: Key developments in Market development and sales-out Performance of newly launched products Guidance 2014 Financial
Picture area. HSBC Commercial Banking. Citibank Investor Presentation. Alan Keir Group Managing Director and Global Head, Commercial Banking
 Picture area HSBC Commercial Banking Citibank Investor Presentation Alan Keir Group Managing Director and Global Head, Commercial Banking March 2012 Forward-looking statements This presentation and subsequent
INTERIM MANAGEMENT STATEMENT QUARTER ENDED 31 MARCH 2012
 INTERIM MANAGEMENT STATEMENT QUARTER ENDED 31 MARCH 2012 12 April 2012 Financial summary Growth in net fees for the quarter ended 31 March 2012 (Q3) (versus the same period last year) Actual Growth LFL*
Investor Presentation. Domino s Pizza
 Investor Presentation Domino s Pizza July 2005 Forward-Looking Statements This presentation and our accompanying comments may contain forward-looking statements. These statements relate to future events
TIFFANY & CO. NEWS RELEASE
 TIFFANY & CO. NEWS RELEASE Fifth Avenue & 57 th Street New York, N.Y. 10022 Contact: Mark L. Aaron 212-230-5301 mark.aaron@tiffany.com TIFFANY REPORTS THIRD QUARTER RESULTS: GROWTH IN ALL REGIONS DRIVEN
Fourth Quarter & Fiscal 2015 Business Update. February 25, 2016
 Fourth Quarter & Fiscal 2015 Business Update February 25, 2016 Fourth Quarter 2015 Highlights Net Sales Comparable to LY $ in millions, except EPS Adjusted Operating Income* (Adjusted Operating Margin)
Wedbush Morgan California Dreamin Santa Monica, CA December 9, 2008
 Wedbush Morgan California Dreamin 2008 Santa Monica, CA December 9, 2008 GUESS?, Inc. Carlos Alberini President & Chief Operating Officer 2 Safe Harbor Statement Except for historical information contained
ANNUAL RESULTS ANNOUNCEMENT FOR THE YEAR ENDED 31 MARCH 2012
 Hong Kong Exchanges and Clearing Limited and The Stock Exchange of Hong Kong Limited take no responsibility for the contents of this announcement, make no representation as to its accuracy or completeness
Investor Presentation. May 2015
 Investor Presentation May 2015 AGENDA 1 - Our markets, a significant opportunity 2 Cnova is built on two strong companies: Cdiscount and Cnova Brasil 3 - The development of marketplaces: a key element
Investor Presentation Q3 Results. 12 November 2014
 Investor Presentation Q3 Results 12 November 2014 1 Forward-looking statements This presentation contains forward-looking statements, including, but not limited to, the statements and expectations contained
Year End Report 2017 February 13, Magnus Welander, CEO Lennart Mauritzson, CFO
 Year End Report 2017 Magnus Welander, CEO Lennart Mauritzson, CFO 2017/Q4 Continued good performance in smallest quarter of the year Net sales of SEK 1,006m (983) +2.3% (+6.5% excluding currency effects)
For personal use only
 RELIANCE WORLDWIDE CORPORATION LIMITED ACN 610855877 www.rwc.com FY2016 RESULTS PRESENTATION 29 August 2016 Important notice This presentation contains general information about s activities at the date
For the six months ended 30 September Change (million ) Net sales % Gross profit %
 Net sales % Gross profit %") Highlights For the six months ended 30 September 2016 2017 Change (million ) Net sales 551.7 548.2-0.6% Gross profit 453.4 453.9 +0.1% Gross profit margin 82.2% 82.8% +0.6 pp Operating profit 19.4 13.8-28.9%
Highlights For the six months ended 30 September 2016 2017 Change (million ) Net sales 551.7 548.2-0.6% Gross profit 453.4 453.9 +0.1% Gross profit margin 82.2% 82.8% +0.6 pp Operating profit 19.4 13.8-28.9%
TELECONFERENCE Q2 2018
 TELECONFERENCE Q2 2018 Copenhagen, 9 August 2018 1 Disclaimer Certain statements in this presentation constitute forwardlooking statements. Forward-looking statements are statements (other than statements
ANSELL LIMITED Half Year Results to December Magnus Nicolin Chief Executive Officer Neil Salmon Chief Financial Officer
 ANSELL LIMITED Half Year Results to December 2014 Magnus Nicolin Chief Executive Officer Neil Salmon Chief Financial Officer Disclaimer The following presentation has been prepared by Ansell Limited for
FY2017 Earnings presentation. Landis+Gyr June 5, 2018
 FY2017 Earnings presentation Important notices This presentation includes forward-looking information and statements including statements concerning the outlook for our businesses. These statements are
Q2 FISCAL 2019 EARNINGS PRESENTATION. October 19, 2018
 Q2 FISCAL 2019 EARNINGS PRESENTATION October 19, 2018 SAFE HARBOR STATEMENT Certain statements included in this presentation are "forward-looking statements" within the meaning of the federal securities
Insuring Trade Default Risk Awareness in the Market
 Insuring Trade Default Risk Awareness in the Market How can Insurers Increase Consciousness about this Sensitive Topic? November 2015 Contents 1. Global Trade Outlook 2. Global Insolvencies and Country
ROADSHOW Hong Kong // Credit Suisse
 ROADSHOW Hong Kong // Credit Suisse HUGO BOSS Company Handout Hong Kong, July 3, 2015 HUGO BOSS July 3, 2015 2 Agenda Financial Review First Quarter 2015 Strategic Outlook 2015 and beyond Financial Outlook
KION Q3 UPDATE CALL Gordon Riske, CEO Thomas Toepfer, CFO Wiesbaden, 14 November 2013
 KION Q3 UPDATE CALL 2013 Gordon Riske, CEO Thomas Toepfer, CFO Wiesbaden, 14 November 2013 AGENDA 1 Highlights 2013 Gordon Riske 2 Financial Update Thomas Toepfer 3 Outlook Gordon Riske 14 November 2013
TELECONFERENCE Q FINANCIAL RESULTS
 TELECONFERENCE FINANCIAL RESULTS 10:00 CET, 12 August 2014 1 AGENDA AGENDA Business highlights: Key developments in Market development and sales-out Performance of newly launched products Guidance 2014
Interim Report Q2/2018 July 19, Magnus Welander, CEO Lennart Mauritzson, CFO
 Interim Report Q2/2018 July 19, 2018 Magnus Welander, CEO Lennart Mauritzson, CFO 2018/Q2 Strong performance in Europe Net sales of SEK 2,155m (1,955) +10.2% (+7.0% excluding currency effects) Region Europe
Financial Information
 Accelerating & profit in H1: Revenue up +4% reported, Adj. EBITA +8%, Net Income +18%, FCF +15% H1 revenue of 12.2bn, +2.7% organic, +4.1% outside Infrastructure H1 adj. EBITA margin up 60bps 1 org., to