Disclosure Statement. Page 2
|
|
|
- Ashlie Tate
- 6 years ago
- Views:
Transcription
1
2 Disclosure Statement Page 2 This presentation and the accompanying slides (the Presentation ) which have been prepared by Samsonite International S.A. ( Samsonite or the Company ) do not constitute any offer or invitation to purchase or subscribe for any securities, and shall not form the basis for or be relied on in connection with any contract or binding commitment whatsoever. This Presentation has been prepared by the Company based on information and data which the Company considers reliable, but the Company makes no representation or warranty, express or implied, whatsoever, on the truth, accuracy, completeness, fairness and reasonableness of the contents of this Presentation. This Presentation may not be all-inclusive and may not contain all of the information that you may consider material. Any liability in respect of the contents of or any omission from this Presentation is expressly excluded. Certain matters discussed in this presentation may contain statements regarding the Company s market opportunity and business prospects that are individually and collectively forward-looking statements. Such forward-looking statements are not guarantees of future performance and are subject to known and unknown risks, uncertainties and assumptions that are difficult to predict. The Company s actual results, levels of activity, performance or achievements could differ materially and adversely from results expressed in or implied by this Presentation, including, amongst others: whether the Company can successfully penetrate new markets and the degree to which the Company gains traction in these new markets; the sustainability of recent growth rates; the anticipation of the growth of certain market segments; the positioning of the Company s products in those segments; the competitive environment; general market conditions and potential impacts on reported results of foreign currency fluctuations relative to the U.S. Dollar. The Company is not responsible for any forward-looking statements and projections made by third parties included in this Presentation.
3 Agenda Results Highlights Business Overview Financial Highlights Outlook and Company Strategy Q&A Page 3


4 2017 Results Highlights Record Net Sales of US$3.5 billion +23.3% Constant Currency Growth +27.9% Constant Currency Growth +18.2% Constant Currency Growth +0.7% Constant Currency Constant currency net sales growth of 23.3% was partly driven by incremental Tumi net sales of US$346.6 million from January through July of 2017 and net sales from the addition of ebags. Constant currency net sales growth in Tumi operations for August through December was 14.5%. Excluding Tumi and the contribution from ebags, constant currency net sales growth was 6.3%. Gross margin increased by 200bp from 2016 largely due to an extra seven months of contribution from Tumi in 2017, as well as increased gross margin in the Tumi business year-over-year. Excluding Tumi, gross margin increased by 70bp mainly due to a higher proportion of net sales coming from direct-toconsumer channels. Adjusted EBITDA increased by US$94.7 million despite US$62.2 million higher advertising spend. Adjusted EBITDA margin decreased by 70bp from 2016 largely due to advertising spend as a percentage of net sales increasing by 80bp from 5.1% in 2016 to 5.9% in Adjusted Net Income increased slightly despite seven additional months of interest expense associated with financing the Tumi acquisition. Profit attributable to equity holders, excluding the tax impacts of U.S. tax reform and Tumi legal entity reorganization in 2017 and pension liquidation in 2016, increased by 12.1% from prior year. Tumi was accretive to earnings in the first full year after acquisition. Page 4 Indicates % of net sales
5 2017 Business Overview Advertising and promotion spend of US$206.0 million (5.9% of net sales) is 43.3%, or US$62.2 million, higher than 2016 spend of US$143.8 million (5.1% of net sales) as the Group continues to maintain its investments behind its brands. Strong constant currency growth of 57.4% (+32.1% excluding Tumi, +12.2% further excluding ebags) in total directto-consumer channel net sales with retail up 41.7% (+10.1% excluding Tumi) and direct-to-consumer e-commerce up 138.0% (+22.4% excluding Tumi and ebags). Total e-commerce net sales (direct-toconsumer e-commerce and wholesale net sales to e-retailers) comprised 14.0% of total net sales, up 450bp from 9.5% in 2016, largely due to the addition of ebags. Sustained investment in brands Multi-channel strategy Strong growth in all regions Profit attributable to equity holders increased by US$78.6 million, or 30.7%, from prior year. Excluding the impact of U.S. tax reform and other one-time tax items, the increase was US$24.1 million, or 12.1%. The Group generated operating cash flow of US$341.3 million in 2017 compared to US$260.8 million recorded in the previous year, notwithstanding a US$30.3 million increase in cash interest payments primarily associated with the Tumi acquisition. Multicategory strategy Strong constant currency net sales growth in all regions: North America: +35.4% (+16.2% excluding Tumi and +3.3% further excluding ebags) Asia: +16.0% (+4.8% excluding Tumi) Europe: +16.8% (+10.5% excluding Tumi) Latin America: +18.6% Multi-brand strategy Continuing to drive strong results while making progress on multibrand, multi-category and multi-channel strategy Constant currency net sales growth bolstered by diversified brand portfolio: Samsonite: +6.1% Tumi: +12.6% (1) American Tourister: +6.5% Speck: +4.6% Gregory: +18.6% Kamiliant: +68.4% Lipault: +12.9% Strong constant currency net sales growth across all product categories: Travel: +15.8% (+8.4% excluding Tumi) Business: +60.4% (+7.8% excluding Tumi) Casual: +20.1% (+26.6% excluding Tumi) Accessories: +23.8% (+11.2% excluding Tumi) Page 5 (1) Comparative figures for Tumi s prior year are based on Tumi s internal management reporting, adjusted as necessary to align with 2017 reporting of brand net sales.
6 Strong net sales growth plus full year impact of Tumi Net Sales Bridge 2016 to 2017 US$268.8 million Constant currency increase excluding Tumi US$387.4 million Tumi constant currency increase Net sales growth excluding Tumi operations of US$268.8 million (at constant currency rates), or 10.6% (1)(2) coming from: North America: +16.2% (1)(2) (+3.3% (1) further excluding ebags) Asia: +4.8% (1) Europe: +10.5% (1) Latin America: +18.6% (1) Excluding Tumi operations and the contribution from ebags, constant currency net sales growth was 6.3%. Incremental net sales of US$387.4 (1) million from Tumi with US$346.6 million of incremental net sales from January through July of 2017 (US$347.4 million at constant currency rates) and constant currency growth for August through December of US$39.9 million, or 14.5% (1). Currency translation had a positive impact of US$24.3 million on reported net sales due to the weaker US Dollar compared to prior year. Page 6 (1) Stated on a constant currency basis. (2) Includes ebags net sales of US$114.1 million since the acquisition in May 2017.
7 Growth in Adjusted Net Income (ANI) +0.7% Constant Currency Growth Page 7 Note: The main items that are adjusted out of net income when calculating Adjusted Net Income are amortization, acquisition costs, joint venture put option expense and the estimated tax impact on these items. In 2016, income tax benefit of US$56.8 million related to the liquidation of the pension plan and US$5.8 million ticking fees on Tumi acquisition debt were also adjusted out. In 2017, the tax benefit related to U.S. tax reform of US$118.8 million and the tax expense of US$7.6m on the Tumi legal entity reorganization were also adjusted out.
8 2017 Results Highlights Excluding Tumi Operations +10.6% Constant Currency Growth Constant currency net sales growth of 10.6% with North America +16.2%, Asia +4.8%, Europe +10.5% and Latin America +18.6%. Excluding the impact of ebags, constant currency growth in North America was 3.3% and for total company was 6.3%. Gross margin increased by 70bp due mainly to a higher proportion of net sales from direct-to-consumer channels as well as lower freight-in costs and lower promotional activity. Advertising spend as a percentage of net sales is 100bp higher than prior year, focusing on categories where there is opportunity to significantly increase market share. Adjusted EBITDA margin decreased by 100bp from 2016 mainly driven by higher advertising spend as a percentage of net sales and higher retail operating expenses as a percentage of net sales, partly offset by higher gross margins. Page 8 Indicates % of net sales
9 2017 Results Highlights Tumi Operations (Pro-forma 2016)* +12.6% Constant Currency Growth Constant currency net sales growth of 12.6% includes the positive impact of buying back distributors in Asia. Excluding the impact of Asia distributor buybacks, constant currency net sales growth was approximately 8.0%, with North America +6.6%, Asia +12.4% and Europe +8.0%. Gross margin increased by 400bp due to less promotional activity in retail stores and Tumi.com, sourcing synergies beginning to be realized and lower freight-in costs. Assuming direct control of distribution in certain Asian markets also had a positive impact on gross margins. Advertising spend increased by 36.3% from prior year levels (up 100bp as a percentage of net sales) in order to accelerate brand awareness and drive future sales growth. Indicates % of net sales Adjusted EBITDA margin increased by 80bp mainly due to higher gross margin and cost savings from synergies, partly offset by higher advertising spend as a percentage of net sales and higher operating expenses associated with assuming direct control of distribution in certain Asian markets. Page 9 * Comparative figures for Tumi for 2016 are based on Tumi s internal management reporting, adjusted as necessary to align with 2017 financial reporting. Europe net sales in 2016 are adjusted to exclude net sales to Samsonite s multi-brand retail stores in order to be comparable to 2017.
, wholesale (+9.6%) and retail (+3.8%). Retail growth was attributable to same store comps of +1.")

10 Tumi Net Sales by Region (Pro-forma 2016)* +6.6% Constant Currency Growth +33.0% Constant Currency Growth +8.0% Constant Currency Growth Net sales growth of 6.7% was mainly driven by direct-to-consumer e- commerce (+28.5%), wholesale (+9.6%) and retail (+3.8%). Retail growth was attributable to same store comps of +1.0% as well as 7 net new stores added in 2017 and the full year impact of net new stores opened in Constant currency net sales growth of 33.0% includes the positive impact of assuming direct control of distribution in South Korea, China, Hong Kong, Macau, Thailand and Indonesia. Excluding the impact of Asia distributor buybacks, constant currency sales growth was approximately 12.4%. Constant currency net sales growth of 8.0% was mainly driven by direct-toconsumer e-commerce (+11.0%) (1) and retail (+11% approximately) (1), while wholesale was up 1.4% (1). Overall growth was led by France (+13%) (1) and UK (+7%) (1). (1) Stated on a constant currency basis. Page 10 * Comparative figures for Tumi for 2016 are based on Tumi s internal management reporting, adjusted as necessary to align with 2017 financial reporting. Europe net sales in 2016 are adjusted to exclude net sales to Samsonite s multi-brand retail stores in order to be comparable to 2017.
11 North America Tumi driving significant increase in net sales and profitability. Page % Constant Currency Growth Indicates % of net sales Net sales increased by 35.4% (1) including US$214.7 million of incremental Tumi net sales from January to July 2017 and 6.9% (1) growth in Tumi net sales from August to December Excluding Tumi, net sales growth was 16.2% (1),or 3.3% (1) further excluding the ebags acquisition with stronger growth in 2H of 4.2% (1) compared to 2.5% in 1H (1). Strong growth in core brands of Samsonite (+5.1% (1) ) and American Tourister (+7.3% (1) ). Net sales growth excluding Tumi was driven by: Net sales growth in the wholesale channel of 1.8% (1) including 8.3% (1)(2) increase in net sales to e-retailers; Direct-to-consumer channel net sales were up 77.7% (1) year-over-year: Direct-to-consumer e-commerce net sales increased by 337.4% (1) largely due to the acquisition of ebags in May (+11.0% (1) excluding ebags); The retail channel was up 4.9% (1), with a 2.5% (1) increase in same store sales plus 3 net new stores in 2017 and the full year impact of 5 net new stores in Mixed performance amongst non-core brands with Speck +4.7% (1), High Sierra -11.1% (1) due to non-recurrence of a backpack program at a wholesale customer that ran in Gregory +9.9% (1), Hartmann -5.0% (1), and Lipault +26.8% (1) ; Travel, casual, accessories and business category net sales were up 10.9% (1), 45.0% (1), 18.0% (1), and 16.2% (1), respectively. Strong growth in casual category net sales was driven by the ebags acquisition. Adjusted EBITDA as a percentage of net sales was down 50bp from prior year. Excluding Tumi, Adjusted EBITDA margin decreased by 140bp driven by 130bp increase in advertising as a percentage of net sales and 90bp higher nonadvertising operating expenses as a percentage of net sales (3) due largely to the addition of ebags, partly offset by 80bp improvement in gross margin. (1) Stated on a constant currency basis. (2) Compared to 2016 adjusted to exclude wholesale sales to ebags to align with 2017 reporting. (3) Non-advertising operating expenses as a percentage of net sales excludes EBITDA add back items such as depreciation, amortization and stock comp expenses.
12 Asia Strong net sales and profit growth led by the full year impact of Tumi and supported by improving growth in the organic business % Constant Currency Growth Indicates % of net sales Constant currency net sales growth of 16.0% (1) includes US$91.3 million of incremental Tumi net sales from January through July of 2017 and US$84.5 million of Tumi net sales from August through December of 2017 (growth of 44.9% (1) over the August through December period of 2016). Excluding Tumi, net sales growth of 4.8% (1) was led by China +7.2% (1), Japan +12.4% (1) and India +4.6% (1), while South Korea was down 2.5% (1). Excluding South Korea, Asia growth was 6.4% (1). Excluding Tumi: Strong net sales growth of 9.9% (1) in direct-to-consumer channels with: Retail store net sales growth of 5.1% (1) coming from 16 net new companyoperated stores added during 2017, and the full year impact of 26 net new stores added during Same store comp growth excluding South Korea was 0.4%; Direct-to-consumer e-commerce net sales growth of 23.2% (1) was driven by China and South Korea with growth of 25.9% (1) and 18.1% (1), respectively. Net sales growth of 3.8% (1) in the wholesale channel including 37.8% (1) growth in net sales to e-retailers; Samsonite net sales growth of 3.0% (1), American Tourister net sales increased by 1.4% (1), which was negatively impacted by decreased TV home shopping channel net sales in South Korea and a shift in certain licensed product net sales and B2B sales to other brands; Net sales of Kamiliant increased by 68.3% (1) and contributed US$36.8 million of 2017 net sales; Strong growth of 27.1% (1) in Lipault net sales as the brand continued to successfully expand throughout the Asia region; Gregory growth of 22.0% (1) mainly from Japan and South Korea; Travel and casual category net sales growth of 4.4% (1) and 10.5% (1), respectively. Business category net sales decreased very slightly by 0.8% (1) due to a shift in B2B sales to the casual category. Adjusted EBITDA margin of 21.9% was down 30bp from 2016 mainly due to a 90bp increase in advertising as a percentage of net sales and 70bp increase in other nonadvertising operating expenses (2), partly offset by a 130bp increase in gross margins. Page 12 (1) Stated on a constant currency basis. (2) Non-advertising operating expenses as a percentage of net sales excludes EBITDA add back items such as depreciation, amortization and stock comp expenses.
13 Europe Strong net sales growth of 16.8% (1) driven by solid increase in organic net sales and full year impact of Tumi. Page % Constant Currency Growth Indicates % of net sales Constant currency net sales growth of 16.8% including US$40.0 million incremental Tumi net sales from January to July 2017 and 4.1% (1) growth in Tumi net sales from August to December Excluding Tumi, net sales growth was 10.5% on a constant currency basis led by Russia +29.6% (1), Turkey +42.9% (1), Germany +7.7% (1), and Italy +8.7% (1). This was driven by: Strong growth of 14.8% (1) in direct-to-consumer channels with: Retail up 12.3% (1) driven by +6.9% (1) same store comps, 30 net new company-operated stores opened in 2017 and the full year impact of 6 net new stores opened during 2016; Direct-to-consumer e-commerce net sales increased by 39.1% (1). Wholesale net sales growth of 8.3% (1), including 40.7% (1) increase in net sales to e-retailers; Strong net sales growth in core brands with Samsonite up 9.0% (1) and American Tourister up 24.8% (1). American Tourister comprised 14.8% of the net sales in the European region excluding Tumi during 2017, compared to 13.1% during 2016 and 11.7% in 2015, as the Group continues to expand the presence of this brand in Europe; Lipault net sales were roughly flat at -1.4% (1) as 2017 was a transition year to place greater emphasis on women s accessories compared to luggage; Gregory was up by 30.3% (1) ; Net sales for the travel category increased by 9.6% (1). Business and casual category net sales increased by 13.9% (1) and 36.6% (1), respectively, due to successful new product introductions. The accessories category net sales increased by 8.2% (1). Adjusted EBITDA margin decreased by 100bp. Excluding Tumi, Adjusted EBITDA margin decreased by 80bp mainly due to 200bp higher non-advertising operating expense as a percentage of net sales (2) and 40bp higher advertising as a percentage of net sales, partly offset by 160bp improvement in gross margin. (1) Stated on a constant currency basis. (2) Non-advertising operating expenses as a percentage of net sales excludes EBITDA add back items such as depreciation, amortization and stock comp expenses.
 and Mexico +11.4% (1)(3). Strong growth of 28.1% (1) in direct-to-consumer channels with retail up 27.2% (1) on same store comp growth of 13.")
14 Latin America Strong growth in constant currency net sales and profitability +18.6% Constant Currency Growth Net sales increased by 18.6% (1) on strong growth in Brazil +52.0% (1), Chile +9.7% (1) and Mexico +11.4% (1)(3). Strong growth of 28.1% (1) in direct-to-consumer channels with retail up 27.2% (1) on same store comp growth of 13.0% (1) as well as 29 net new company-operated stores opened during 2017 and the full year impact of 37 net new stores opened during Direct-to-consumer e-commerce sites were launched in Chile, Brazil and Mexico during the year; Wholesale channel net sales growth of 12.5% (1) was driven mainly by Mexico, Argentina and Chile. In Argentina there has been higher availability of product due to lower import restrictions than in prior years; Samsonite net sales increased by 21.0% (1) and American Tourister net sales grew by 34.9% (1) following launch of the American Tourister brand in Brazil in the middle of the year; Strong net sales growth in brands that are specific to the Latin America region, with Xtrem +12.6% (1), Saxoline +11.1% (1) and Secret +7.5% (1) ; Strong net sales growth in the two major categories in the region with travel and casual up 21.8% (1) and 33.7% (1), respectively. Casual net sales growth is largely due to strong back-to-school sales in the early part of the year. Business category was up 19.8% (1). Adjusted EBITDA as a percentage of net sales was up 180bp mainly driven by 260bp higher gross margin and 30bp lower non-advertising operating expenses as a percentage of net sales (2), partially offset by 110bp higher advertising as a percentage of net sales. Gross margin improvement was attributable to channel mix shift towards direct-to-consumer channels, strong back-to-school sales in the early part of the year, lower freight costs and price increases. Page 14 Indicates % of net sales (1) Stated on a constant currency basis. (2) Non-advertising operating expenses as a percentage of net sales excludes EBITDA add back items such as depreciation, amortization and stock comp expenses. (3) Mexico, excluding export sales.
15 Constant currency net sales growth in all key markets 3.0% excluding Tumi and ebags Due to fewer visitors from mainland China (1) (2) (3) Page 15 (1) Hong Kong includes Macau and sales to Tumi distributors in certain Asian countries. (2) Net sales in Germany included all wholesale and ecommerce net sales of the Tumi brand for the Europe region until April 30, Beginning on May 1, 2017, Tumi brand net sales through the wholesale channel in Europe are no longer accounted for in Germany. (3) UK includes Ireland.

16 Continued brand penetration drove constant currency net sales growth in most emerging markets with combined constant currency growth of 17.8% excluding Tumi (1) Page 16 (1) Mexico, excluding export sales


17 Direct-To-Consumer Retail outlets expansion in 2017 Samsonite Winnipeg, Canada. May 2017 TUMI Elements, Hong Kong. Oct 2017 American Tourister E-Mart Gayang, Seoul, Korea. Aug 2017 TUMI South Coast Plaza, California, US. Sep 2017 Samsonite RED + Lipault MIXC, Shanghai, China. Sep 2017 Page 17 TUMI Milan Linate Airport, Italy. Sep 2017 Kamiliant Selangor, Malaysia. Sep 2017


18 Direct-To-Consumer E-Commerce Boost Total direct-to-consumer e-commerce +138% in 2017 on a constant currency basis Page 18
, with: (1) Stated on a constant currency basis. (2) 2017 includes ebags net sales of US$114.1 million since the acquisition in May 2017.")
19 Direct-to-consumer channel net sales accelerated with the acquisitions of Tumi and ebags (2) 26% Directto-consumer 33% Directto-consumer Wholesale Retail Excluding Tumi, direct-to-consumer net sales growth was 32.1% (1), with: (1) Stated on a constant currency basis. (2) 2017 includes ebags net sales of US$114.1 million since the acquisition in May D-T-C e-commerce Strong retail net sales growth of 10.1% (1), driven by same store comps of 4.3% (1) and the addition of 78 net new stores in 2017 and the full year impact of 74 net new stores added in Strong direct-to-consumer e-commerce net sales growth of 139.2% (1) driven by the addition of ebags and 22.4% organic growth excluding ebags. Excluding Tumi, total e-commerce net sales increased by 67.3% (1) and made up 14.5% of total net sales in 2017, up from 9.6% of total net sales in 2016, largely due to the addition of ebags. This included 19.1% (1) growth in net sales to e-retailers, included within the wholesale channel. Tumi total pro-forma e-commerce net sales increased by 25.8% (1) and made up 11.6% of total net sales in 2017, up from 10.3% of total net sales in This included direct-to-consumer e-commerce net sales growth of 26.8% (1), and 23.7% growth in net sales to e-retailers, included within the wholesale channel. Page 19
20 Diversified brand portfolio continues to generate strong net sales growth Constant Currency Growth Page 20 Net Sales growth by brand 6.1% 145.3% 6.5% 4.6% -10.6% 18.6% 68.4% 12.9% 4.0% 85.7% (1) Stated on a constant currency basis. (2) 2017 includes US$14.0 million of Tumi brand net sales made through Rolling Luggage and other Samsonite multi-brand stores as well as ebags, compared to US$6.6 million through Rolling Luggage and other Samsonite multi-brand stores in 2016, which were classified under Other brands reflects amounts recognized subsequent to the acquisition completed August 1 st (3) 2016 net sales are based on Tumi s internal management reporting adjusted to align with 2017 financial reporting. Strong growth in Samsonite with net sales up 6.1% on a constant currency basis: Europe +9.0% (1), North America +5.1% (1), Asia +3.0% (1), and Latin America +21.0% (1). Tumi net sales increased by 12.6% (1)(3) compared to 2016 on a proforma basis. American Tourister net sales growth of 6.5% on a constant currency basis with continued strong growth in Europe +24.8% (1) as well as North America +7.3% (1) and Latin America +34.9% (1) where the brand is being launched in new markets. Asia had moderate growth of +1.4% (1). Speck net sales growth of 4.6% is largely due to successful new product launches related to new electronic device introductions and expanded distribution. Growth in the 4 th quarter was constrained due to delayed launch and lack of device availability for iphone X. Net sales of the High Sierra brand decreased as the focus has been on growing Samsonite backpacks worldwide, as well as Gregory in Europe and Asia and local backpack brand Xtrem in Latin America. The decrease is also due to non-recurrence of a backpack program at a U.S. wholesale customer that ran in Strong net sales growth for Gregory driven by double-digit growth in Asia and Europe. Kamiliant, the value-conscious entry level brand launched at the end of 2015 that is sold in Asia, grew 68.4% (1) over the prior year. Lipault net sales up 12.9% (1) over 2016 driven by expansion in Asia and North America. Hartmann net sales were up in Asia, partially offset by slight decreases in Europe and North America. Constant currency net sales growth of 85.7% in Other brands is mainly due to additional sales of third party brands sold through ebags as well as increased net sales of the Xtrem, Secret and Saxoline brands in Latin America.
21 ebags acquisition will accelerate growth in the E-commerce channel and strengthen digital capabilities ebags is a leading online retailer of bags and related accessories for travel, providing consumers with a diverse offering of travel bags and accessories including luggage, backpacks, handbags, business bags, travel accessories and apparel. Despite discontinuing sales of certain lower margin brands, 2017 pro-forma net sales of US$165.4 million (1) reflects growth of 4.4% from US$158.5 (2) million in the prior year. The acquisition provides a strong platform to help accelerate the growth of the Group s direct-toconsumer e-commerce business in North America and worldwide. It also provides the Group with immediate resources and digital expertise to strengthen the Group s existing digital capabilities. The acquisition purchase price of US$105.0 million was financed by internal resources of the Group in May Strategy to increase the share of net sales from Group-owned brands through the ebags website (currently approximately 10% of ebags total net sales) as well as the ebags private label brand (currently approximately 24% of ebags total net sales) will increase profitability of the business. Integration into the Group is proceeding as planned. Financial system integration is expected to complete by Q (1) Based on ebags internal management reporting to date of acquisition plus post-acquisition net sales of US$114.1 million. (2) Extracted from the unaudited financial statements of ebags for the fiscal year ended December 25, Page 21


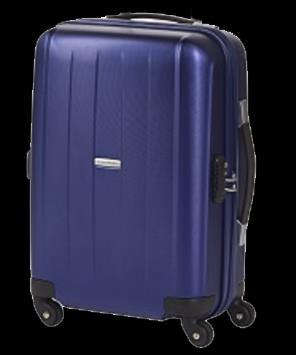
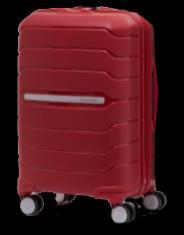
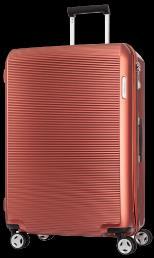


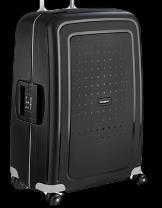


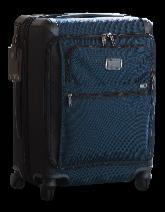
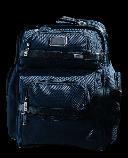
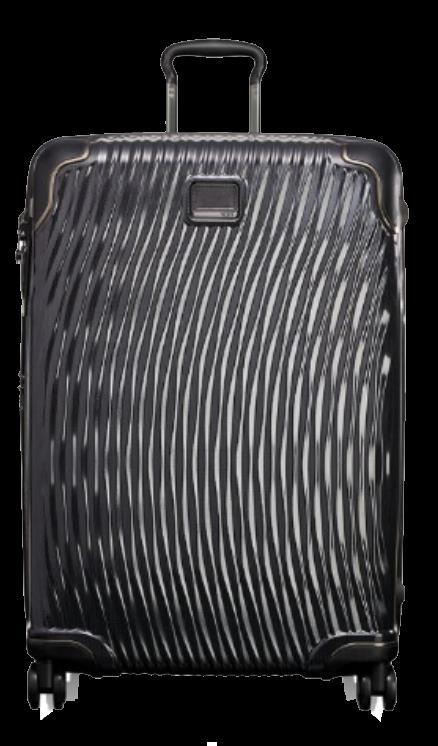
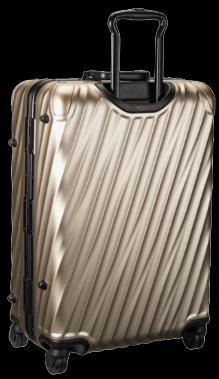
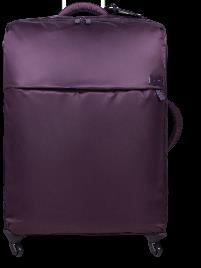
22 Key Product Assortment North American Europe Asia Latin American Page 22


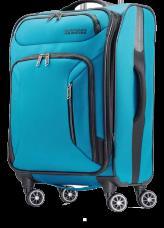
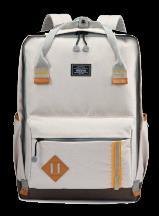
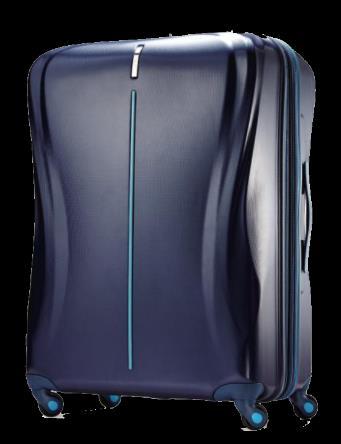

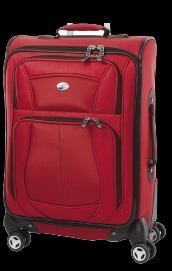


23 Key Product Assortment North American Europe Asia Latin American Page 23


24 Page 24 Key Product Assortment


25 Page 25 Key Product Assortment


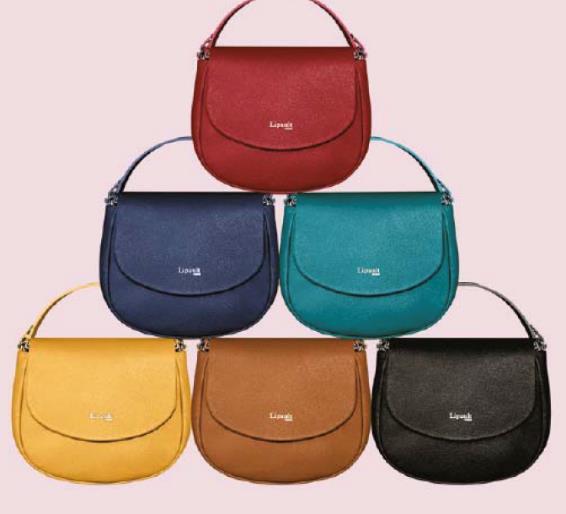
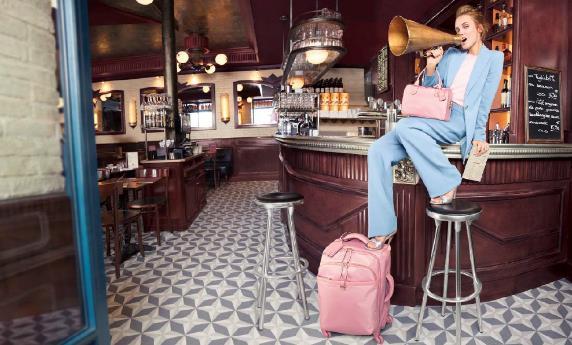

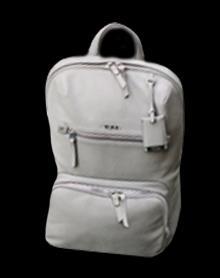
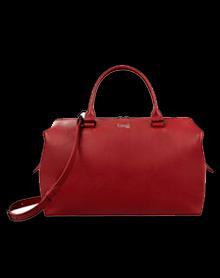
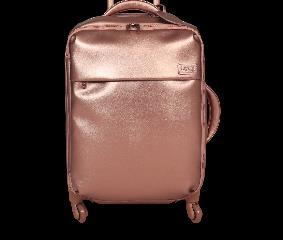
26 Page 26 Products designed to appeal to women
27 All key categories contributed to Net Sales growth Net Sales growth by product category Non-Travel categories constituted US$1,370.8 million of net sales in 2017, representing 39.3% of total net sales compared to US$992.7 million, or 35.3% of net sales in Travel remained our largest product category and traditional strength with all regions contributing to its growth of 8.4% (1), excluding Tumi. Non-travel net sales increased from 35.3% of total net sales in 2016 to 39.3% of total net sales in Excluding Tumi: Net sales in the business category increased by 7.8% (1) due to strong growth in North America +16.2% (1), Europe +13.9% (1) and Latin America +19.8% (1), while Asia was down slightly -0.8% (1) ; Casual category net sales increased by 26.6% (1), driven by strong growth in all regions, including the impact of the ebags acquisition in North America; Growth of 11.2% (1) in the accessories category was mainly attributable to the acquisition of ebags. Const. Curr. Growth 15.8% 60.4% 20.1% 23.8% 34.8% Const. Curr. Growth excl. Tumi 8.4% 7.8% 26.6% 11.2% 10.7% Page 27 (1) Stated on a constant currency basis
 and the additional advertising from the acquisition of ebags.")
28 43.3% increase in global advertising spend to drive sales growth across brands Indicates % of net sales Total advertising spend increased by US$62.2 million, or 43.3%, including the full year impact of Tumi (7 additional months compared to prior year) and the additional advertising from the acquisition of ebags. On a constant currency basis, excluding Tumi, advertising spend increased by US$41.9 million, or 33.4%, compared to As a percentage of net sales, excluding Tumi, total advertising spend of 5.9% is 100bp higher than This is the result of the Group returning to more normalized advertising as a percentage of net sales after temporarily scaling back advertising in Tumi advertising was US$38.0 million for 2017, or 5.7% of net sales. This represents a significant increase over the amounts that Tumi was investing in advertising prior to the acquisition. In 2016, prior to acquisition, Tumi spent approximately 2.9% of net sales on advertising based on Tumi s internal management reporting. Page 28

29 Page 29 Targeted Brand Advertising

30 Page 30 Targeted Brand Advertising
31 Financial Highlights Net sales increased to a record level of US$3,490.9 million, with net sales growth of 23.3% (1). Excluding Tumi operations, strong net sales growth of 10.6% (1). Net sales growth for Tumi operations from August through December was 14.5% (1) compared to the same period in the previous year. Adjusted Net Income increased by US$2.7 million from prior year despite a full year of interest expense associated with acquiring the Tumi business and increased advertising spend. Operating cash flow of US$341.3 million in 2017 compared to US$260.8 million recorded in 2016, an increase of US$80.6 million, notwithstanding a US$30.3 million increase in cash interest payments primarily associated with the Tumi acquisition. The Company was in compliance with all debt covenants as of December 31, Pro-forma total net leverage ratio (2) of 2.74:1.00, compared to 2.84:1.00 as of December 31, 2016 as the Group continued to deleverage despite US$105.0 million acquisition of ebags, US$64.9 million to acquire Tumi distributors in certain Asian countries and US$31.9 million to buy out the 30% non-controlling interest in Australia along with a US$97.0 million distribution to shareholders. Net working capital efficiency of 12.4% as of December 31, 2017 continued to run favorable to target level of 14%. Tumi working capital now in line with existing business. Capital expenditures of US$94.6 million in 2017 were largely focused on the Group s continuing strategy to pursue targeted retail expansion and store modifications and lead the industry in new product innovations. Excluding favorable one-time tax impacts in both 2016 and 2017, the operational effective tax rate was 26.3% in 2017, compared to 27.8% in The Group recorded a non-cash tax benefit of US$118.8 million in conjunction with the U.S. tax reform law that was enacted in December On March 14, 2018, the Company s Board of Directors recommended that a cash distribution in the amount of US$110.0 million, or approximately US$ per share, be made to the Company s shareholders, a 13.4% increase from the US$97.0 million distribution paid in Page 31 (1) Stated on a constant currency basis. (2) Per the terms of the debt agreement, net leverage ratio is calculated as (total loans and borrowings total unrestricted cash)/ltm Adj. EBITDA. LTM Adj. EBITDA is calculated on a pro-forma basis to include pro-forma run-rate cost synergies expected at August 1, 2018.
32 High Level Bridge of Underlying Growth in Profit Attributable to Equity Holders +US$24.1 million Page 32 (1) Change in one-time tax items consists of US$118.8 million U.S. tax reform impact on deferred taxes, US$(7.6) million tax impact of Tumi legal entity reorganization and US$(56.8) million from the non-recurrence of a tax benefit in 2016 associated with the pension plan liquidation.
33 One-time tax benefits resulting in a -7.3% effective tax rate. Operational Effective Tax Rate (ETR) reduced by 150bp Operational Effective Tax Rate (1) 27.8% Change in organic profit mix -0.5% Change in reserves, non-deductibles and tax credits -2.0% Change in tax incentives 1.0% 2017 Operational Effective Tax Rate 26.3% One-time items: U.S. tax reform -35.9% Tumi Europe legal entity reorganization 2.3% 2017 Reported Effective Tax Rate -7.3% (1) 2016 reported effective tax rate of -0.8% included one-time items, including impact of pension plan liquidation on deferred tax liabilities (-20.8%), impact of Tumi acquisition costs (-4.5%) and impact of Luxembourg rate change on deferred tax liabilities (-3.3%) Outlook Operational ETR 27.8% 26.3% 25%-27% Reported ETR -0.8% -7.3% Page 33
34 Strong Balance Sheet US$m December 31, December 31, Cash and cash equivalents (24.1) -6.5% Trade and other receivables, net % Inventories, net % Other current assets % Non-current assets 3, , % Total Assets 4, , % Current liabilities (excluding debt) % Non-current liabilities (excluding debt) (145.8) -26.2% Total borrowings 1, , % Total equity 1, , % Total Liabilities and Equity 4, , % Total Net Cash (Debt) (1) (1,571.2) (1,609.1) (37.9) 2.4% (1) Total Net Cash (Debt) excludes deferred financing costs, which are included in total borrowings. (2) The sum of the line items in the table may not equal the total due to rounding. $ C hg D ec-17 vs. D ec-16 % C hg D ec-17 vs. D ec-16 (3) Per the terms of the debt agreement, net leverage ratio is calculated as (total loans and borrowings total unrestricted cash)/ltm Adj. EBITDA. LTM Adj. EBITDA is calculated on a pro-forma basis to include pro-forma run-rate cost synergies expected at August 1, Cash flows from operations were US$341.3 million, offset by outflows for capital expenditures of US$94.6 million, the purchase of ebags for US$105.0 million, costs associated with assuming direct control of distribution of Tumi products in South Korea, China, Hong Kong/Macau, Thailand and Indonesia for a total of US$64.9 million, acquisition of the 30% non-controlling interest in our Australian subsidiary for US$31.9 million and a cash distribution to shareholders of US$97.0 million. Pro-forma total net leverage ratio (3) of 2.74:1.00 is improved from 2.84:1.00 as of December 31, US$432.6 million of availability on the US$500 million revolving credit facility. Continued strong working capital efficiency of 12.4% as of December 31, Page 34
35 Efficiently managing working capital US$m December 31, December 31, Working Capital Items Inventories $ $ $ % Trade and Other Receivables $ $ $ % Trade Payables $ $ $ % Net Working Capital $ $ $ % % of Net Sales 12.6% 12.4% Turnover Days Inventory Days Trade and Other Receivables Days Trade Payables Days Net Working Capital Days (1) December 31, 2016 net working capital as a percentage of net sales and turnover days are adjusted for pro-forma full year net sales and COGS of Tumi. (2) December 31, 2017 net working capital as a percentage of net sales and turnover days are adjusted for pro-forma full year net sales and COGS of ebags. Inventory turnover days calculated as ending inventory balance divided by cost of sales for the period and multiplied by the number of days in the period Trade and other receivables turnover days calculated as ending trade and other receivables balance divided by net sales for the period and multiplied by the number of days in the period Trade payables turnover days calculated as ending trade payables balance divided by cost of sales for the period and multiplied by the number of days in the period Net working capital efficiency (% of net sales) is calculated as net working capital divided by annualized net sales (1) (2) $ Chg Dec-17 vs. Dec-16 % Chg Dec-17 vs. Dec-16 Working capital continued to be managed efficiently at 12.4% of net sales at December 31, 2017, favorable to targeted 14% level. Inventory turnover of 136 days as of December 31, Increased inventory days was due to heightened inventory levels to reduce risk of stock outs on fast selling lines during the holiday season and to provide coverage for anticipated marketing and promotional campaigns in Q Trade and other receivables turnover of 42 days were comparable with prior year. Trade payables turnover of 129 days was 29 days higher than prior year. The increase in payable days follows the increase in inventory days. Page 35
36 Capital Expenditures Capital Expenditure by project type US$m Retail Product Development / R&D/ Supply Information Services and Facilities Other Total Capital Expenditures $69.6 $94.6 The sum of the line items in the table may not equal the total due to rounding capex includes US$20.4 million for Tumirelated capex, mainly on retail projects, compared to US$7.9 million for the 5 month period of Tumi ownership in retail capex consisted of new stores and remodels in North America of US$18.9 million, Asia of US$17.0 million, Europe of US$11.9 million and Latin America of US$3.9 million. Capex on Product Development / R&D / Supply includes US$7.1 million on extension of our manufacturing facility in Hungary and US$5.1 million on product tooling and molds in Europe. US$4.5 million was spent on tooling and equipment for Speck in North America. US$4.5 million was spent during the year on the rebuilding and fitting out of our warehouse/office in China. Information Services and Facilities includes US$1.1 million for Tumi POS server upgrades in North America and US$1.5 million capex in ebags. Page 36
37 Outlook and Company Strategy According to the United Nations World Tourism Organization ( UNWTO ) World Tourism Barometer, international tourist arrivals grew by 7% in This growth is expected to continue in 2018 at a rate of 4% to 5%. The Company aims to increase shareholder value through sustainable revenue and earnings growth and free cash flow generation. In order to achieve this objective, the Company has adopted the following principal strategies: Page 37 Deploy multiple brands to operate at wider price points in both the travel and non-travel product categories. Within the non-travel product categories, greater emphasis will be placed on products that appeal to female consumers as part of the Company s Women First initiative. Increase the proportion of net sales from the direct-to-consumer channel by growing the Company s direct-toconsumer e-commerce net sales and through targeted expansion of its bricks-and-mortar retail presence. Sustain the Company s investment in marketing to support the global expansion of Tumi while continuing to drive visibility for Samsonite, American Tourister and other brands. Leverage the Company's regional management structure, sourcing and distribution expertise and marketing engine to extend it s brands into new markets and penetrate deeper into existing channels. Continue to invest in research and development to develop lighter and stronger new materials, advanced manufacturing processes, exciting new designs, as well as innovative functionalities that deliver real benefits to consumers. Continue to develop the Company into a well-diversified multi-brand, multi-category and multi-channel luggage, bag and accessories business.
2017 Interim Results
 2017 Interim Results Disclosure Statement Page 2 This presentation and the accompanying slides (the Presentation ) which have been prepared by Samsonite International S.A. ( Samsonite or the Company )
Disclosure Statement. Page 2
 Disclosure Statement This presentation and the accompanying slides (the Presentation ) which have been prepared by Samsonite International S.A. ( Samsonite or the Company ) do not constitute any offer
Disclosure Statement. Page 2
 Disclosure Statement Page 2 This presentation and the accompanying slides (the Presentation ) which have been prepared by Samsonite International S.A. ( Samsonite or the Company ) do not constitute any
2017 Third Quarter Results
 Samsonite International S.A. HKEX Stock Code: 1910 2017 Third Quarter Results November 13, 2017 Disclosure Statement Page 2 This presentation and the accompanying slides (the Presentation ) which have
Disclosure Statement. Page 2
 Disclosure Statement Page 2 This presentation and the accompanying slides (the Presentation ) which have been prepared by Samsonite International S.A. ( Samsonite or the Company ) do not constitute any
Disclosure Statement. Page 2
 Disclosure Statement Page 2 This presentation and the accompanying slides (the Presentation ) which have been prepared by Samsonite International S.A. ( Samsonite or the Company ) do not constitute any
2018 First Quarter Results May 14, Samsonite International S.A. Stock Code 1910
 2018 First Quarter Results May 14, 2018 Samsonite International S.A. Stock Code 1910 Disclosure Statement Page 2 This presentation and the accompanying slides (the Presentation ) which have been prepared
Disclosure Statement. Page 2
 Disclosure Statement Page 2 This presentation and the accompanying slides (the Presentation ) which have been prepared by Samsonite International S.A. ( Samsonite or the Company ) do not constitute any
SAMSONITE INTERNATIONAL S.A.
 Hong Kong Exchanges and Clearing Limited and The Stock Exchange of Hong Kong Limited take no responsibility for the contents of this announcement, make no representation as to its accuracy or completeness
Samsonite International S.A.
 Samsonite International S.A. 13 15 avenue de la Liberté, L-1931 Luxembourg R.C.S. Luxembourg: B 159.469 (Incorporated under the laws of Luxembourg with limited liability) Consolidated financial statements
Samsonite International S.A. Publishes 2017 Third Quarter Report
 Samsonite International S.A. Publishes 2017 Third Quarter Report Double-digit Constant Currency Net Sales Growth Reported Across All Regions for the Three Months Ended September 30, 2017 HONG KONG, November
Samsonite International S.A Avenue de la Liberte, L-1931, Luxembourg RCS Luxembourg: B (Incorporated under the laws of Luxembourg with
 Samsonite International S.A. 13 15 Avenue de la Liberte, L-1931, Luxembourg RCS Luxembourg: B159469 (Incorporated under the laws of Luxembourg with limited liability) Consolidated financial statements
(Incorporated in Luxembourg with limited liability) (Stock code: 1910)
 (Stock code: 1910)") (Incorporated in Luxembourg with limited liability) (Stock code: 1910) Samsonite International S.A. Announces 2014 Final Results Double-digit Revenue and EBITDA Growth for the Fifth Consecutive Year Net
(Incorporated in Luxembourg with limited liability) (Stock code: 1910) Samsonite International S.A. Announces 2014 Final Results Double-digit Revenue and EBITDA Growth for the Fifth Consecutive Year Net
Samsonite International S.A. Announces 2018 Annual Results Net Sales Hits New Record of US$3.8 Billion
 Samsonite International S.A. Announces 2018 Annual Results Net Sales Hits New Record of US$3.8 Billion HONG KONG, March 13, 2019 Samsonite International S.A. ( Samsonite or the Company, together with its
Samsonite International S.A. Announces 2013 Final Results Net sales top a record US$2 billion for the first time
 (Incorporated in Luxembourg with limited liability) (Stock code: 1910) Samsonite International S.A. Announces 2013 Final Results Net sales top a record US$2 billion for the first time Highlights Samsonite
Samsonite International S.A. Announces 2013 Interim Results
 Samsonite International S.A. Announces 2013 Interim Results Highlights Samsonite s net sales for the six months ended June 30, 2013 increased by 16.5% 1 to another record US$983.6 million with growth across
Interim Results. For the six months ended June 30, 2011
 Interim Results For the six months ended June 30, 2011 Agenda Business and Financial Highlights Business Overview Financial Overview Concluding Remarks 2 Business Highlights in 1H 2011 Significant sales
SAMSONITE INTERNATIONAL S.A.
 Hong Kong Exchanges and Clearing Limited and The Stock Exchange of Hong Kong Limited take no responsibility for the contents of this announcement, make no representation as to its accuracy or completeness
Samsonite International S.A Interim Report. * For identification purposes only
 Samsonite International S.A. 2013 Interim Report * For identification purposes only Stock Code 1910 Contents 02 Corporate Information 03 Corporate Profile and Strategy 04 Financial Highlights 06 Chairman
SAMSONITE INTERNATIONAL S.A.
 Hong Kong Exchanges and Clearing Limited and The Stock Exchange of Hong Kong Limited take no responsibility for the contents of this announcement, make no representation as to its accuracy or completeness
SAMSONITE INTERNATIONAL S.A.
 Hong Kong Exchanges and Clearing Limited and The Stock Exchange of Hong Kong Limited take no responsibility for the contents of this announcement, make no representation as to its accuracy or completeness
FINAL RESULTS ANNOUNCEMENT FOR THE YEAR ENDED 31 MARCH 2010 FINANCIAL HIGHLIGHTS. Own stores number reached 764, increased by 11.
 Hong Kong Exchanges and Clearing Limited and The Stock Exchange of Hong Kong Limited take no responsibility for the contents of this announcement, make no representation as to its accuracy or completeness
SAMSONITE INTERNATIONAL S.A.
 Hong Kong Exchanges and Clearing Limited and The Stock Exchange of Hong Kong Limited take no responsibility for the contents of this announcement, make no representation as to its accuracy or completeness
SAMSONITE INTERNATIONAL S.A.
 Hong Kong Exchanges and Clearing Limited and The Stock Exchange of Hong Kong Limited take no responsibility for the contents of this announcement, make no representation as to its accuracy or completeness
COACH, INC. REPORTS FISCAL 2016 FIRST QUARTER RESULTS
 COACH, INC. REPORTS FISCAL 2016 FIRST QUARTER RESULTS First Quarter Net Sales Increased 3% Over Prior Year In Constant Currency; Down 1% On A Reported Basis First Quarter Non-GAAP Earnings Per Share was
1H 2018 Results Update Analyst Presentation
 1H 2018 Results Update Analyst Presentation July 31, 2018-6.00 PM CET Disclaimer This presentation contains forward-looking statements regarding future events and results of the Company that are based
Investor Meeting Presentation
 Investor Meeting Presentation November 2014 Investor Meeting Presentation HUGO BOSS November 2014 2 / 54 Agenda Update on Key Strategic Initiatives Nine Months Results 2014 Outlook Investor Meeting Presentation
CONTINUING CONNECTED TRANSACTIONS IN RELATION TO THE SAMSONITE CHINA FRAMEWORK AGREEMENT
 Hong Kong Exchanges and Clearing Limited and The Stock Exchange of Hong Kong Limited take no responsibility for the contents of this announcement, make no representation as to its accuracy or completeness
901 S. Central Expressway, Richardson, TX 75080
 901 S. Central Expressway, Richardson, TX 75080 FOSSIL GROUP REPORTS RECORD SECOND QUARTER RESULTS Net Sales Increase 11% to a Record $706 Million EPS Increases 25% to a Record $1.15 Provides Third Quarter
901 S. Central Expressway, Richardson, TX 75080
 901 S. Central Expressway, Richardson, TX 75080 FOSSIL GROUP REPORTS THIRD QUARTER RESULTS Net Sales Increase 18% to $810 Million Diluted EPS Increases 25% to $1.58 Maintains Full Year EPS Guidance and
Quarterly Statement for Q Metzingen, November 6, 2018
 Quarterly Statement for Q3 2018 Metzingen, November 6, 2018 HUGO BOSS records solid sales growth in the third quarter Full-year sales and earnings guidance confirmed Currency-adjusted sales up 1% in the
July 26, 2017 LafargeHolcim Ltd 2015
 Second Quarter 2017 Results Beat Hess, Chairman and Interim CEO Roland Köhler, Interim COO and Regional Head of Europe, Australia/NZ & Trading Ron Wirahadiraksa, CFO July 26, 2017 LafargeHolcim Ltd 2015
Roadshow Zurich // MainFirst. HUGO BOSS Company Handout August 6, Roadshow Zurich // MainFirst HUGO BOSS August 7, / 52
 Roadshow Zurich // MainFirst HUGO BOSS Company Handout August 6, 2014 Roadshow Zurich // MainFirst HUGO BOSS August 7, 2014 2 / 52 Agenda Half Year Results 2014 Update on Key Strategic Initiatives Outlook
Roadshow Scandinavia // equinet
 Roadshow Scandinavia // equinet HUGO BOSS Company Handout August 12-14, 2014 Dennis Weber, Head of Investor Relations Roadshow Scandinavia // equinet HUGO BOSS August 12-14, 2014 2 / 52 Agenda Half Year
Roadshow London // Deutsche Bank
 Roadshow London // Deutsche Bank HUGO BOSS Company Handout August 6, 2014 Mark Langer (CFO) & Dennis Weber (Head of Investor Relations) Roadshow London // Deutsche Bank HUGO BOSS August 6, 2014 2 / 52
For the six months ended 30 September Change (million ) Net sales % Gross profit %
 Net sales % Gross profit %") Highlights For the six months ended 30 September 2016 2017 Change (million ) Net sales 551.7 548.2-0.6% Gross profit 453.4 453.9 +0.1% Gross profit margin 82.2% 82.8% +0.6 pp Operating profit 19.4 13.8-28.9%
Highlights For the six months ended 30 September 2016 2017 Change (million ) Net sales 551.7 548.2-0.6% Gross profit 453.4 453.9 +0.1% Gross profit margin 82.2% 82.8% +0.6 pp Operating profit 19.4 13.8-28.9%
Quarterly Statement for Q Metzingen, November 2, HUGO BOSS increases pace of growth in own retail
 Quarterly Statement for Q3 2017 Metzingen, November 2, 2017 HUGO BOSS increases pace of growth in own retail Currency-adjusted sales up 3% in the third quarter Retail comp store sales up 5% EBITDA before
Financial Information
 Financial Information H1 revenues reached 12.8bn up 9.8%, flat org. in Q2 Adj. EBITA reached 1.6bn, up 6.4%, Adj. EBITA margin flat excl. Invensys in a challenging environment 2015 targets: Around flat
1H 2018 results. Milan, July 23, 2018
 Milan, July 23, 2018 FORWARD-LOOKING STATEMENT Certain statements in this investor presentation may constitute forward-looking statements as defined in the Private Securities Litigation Reform Act of 1995.
HUGO BOSS First Half Year Results 2014
 HUGO BOSS First Half Year Results 2014 Claus-Dietrich Lahrs (CEO), Mark Langer (CFO) Metzingen, July 31, 2014 Conference Call, First Half Year Results 2014 HUGO BOSS July 31, 2014 2 / 42 Agenda Half Year
IGG Inc. March Annual Results
 IGG Inc. March 2017 Annual Results Disclaimer This presentation and the accompanying slides (the Presentation ) which have been prepared by IGG INC (the Group ) do not constitute any offer or invitation
Roadshow Frankfurt // Kepler Cheuvreux
 Roadshow Frankfurt // Kepler Cheuvreux HUGO BOSS Company Handout August 5, 2014 Mark Langer (CFO) & Dennis Weber (Head of Investor Relations) Roadshow Frankfurt // Kepler Cheuvreux HUGO BOSS August 5,
2010 Results. Paris - March 2, 2011
 2010 Results Paris - March 2, 2011 > Highlights of 2010 > Financial results > Strategy and outlook 2010 Results 2 2010: A Year of Acceleration Highlights of 2010 Revenue of 3,892m, up 19.1% Operating profit
(Stock code: 1910) Operating profit increased by US$16.2 million, or 11.9%, year-on-year to US$152.3 million.
 Operating profit increased by US$16.2 million, or 11.9%, year-on-year to US$152.3 million.") Hong Kong Exchanges and Clearing Limited and The Stock Exchange of Hong Kong Limited take no responsibility for the contents of this announcement, make no representation as to its accuracy or completeness
Hong Kong Exchanges and Clearing Limited and The Stock Exchange of Hong Kong Limited take no responsibility for the contents of this announcement, make no representation as to its accuracy or completeness
Investor Meeting Presentation
 September 2015 HUGO BOSS September 2015 2 Agenda Financial Review First Half Year 2015 Strategic Outlook 2015 and beyond Financial Outlook 2015 HUGO BOSS September 2015 3 Agenda Financial Review First
TELECONFERENCE Q FINANCIAL RESULTS
 TELECONFERENCE Q3 2013 FINANCIAL RESULTS 10:00 CET, 12 November 2013 1 AUGUST 2013 INVESTOR PRESENTATION AGENDA AGENDA Business highlights: Key developments in Q3 2013 Market development and sales-out
TELECONFERENCE Q2 2018
 TELECONFERENCE Q2 2018 Copenhagen, 9 August 2018 1 Disclaimer Certain statements in this presentation constitute forwardlooking statements. Forward-looking statements are statements (other than statements
Quarterly Statement for Q Metzingen, May 3, HUGO BOSS starts the year with higher sales and earnings
 Quarterly Statement for 2017 Metzingen, May 3, 2017 HUGO BOSS starts the year with higher sales and earnings Currency-adjusted sales growth of 1% in the first quarter Positive development in Europe and
Full Year 2018 Results. 27 February 2019
 Full Year 2018 Results 27 February 2019 1. Key Highlights and Financial Summary Strong financial performance across all segments and progress made on all aspects of the strategic framework Financial Highlights
Interim results. for the half-year ended 30 September 2010
 Interim results for the half-year ended 30 September 2010 Agenda Results Highlights Strategic Review and Future Prospects 2 1. Results Highlights (million ) Net sales Operating profit Net profit 1 400
Presentation 22 August 2018
 Presentation 22 August 2018 Exceeded 3YP targets in 2017, but 2018 is challenging due to continued destocking, store closures and bankruptcies Profit attributable to shareholders (like-for-like) down 19%
FOSSIL GROUP, INC. REPORTS FIRST QUARTER FISCAL 2015 RESULTS; First Quarter Net Sales of $725 Million; Diluted EPS of $0.75
 FOSSIL GROUP, INC. REPORTS FIRST QUARTER FISCAL 2015 RESULTS; First Quarter Net Sales of $725 Million; Diluted EPS of $0.75 Maintains Full Year Constant Currency Guidance and Provides Second Quarter Guidance
Financial Information
 Accelerating & profit in H1: Revenue up +4% reported, Adj. EBITA +8%, Net Income +18%, FCF +15% H1 revenue of 12.2bn, +2.7% organic, +4.1% outside Infrastructure H1 adj. EBITA margin up 60bps 1 org., to
Wedbush Morgan California Dreamin Santa Monica, CA December 9, 2008
 Wedbush Morgan California Dreamin 2008 Santa Monica, CA December 9, 2008 GUESS?, Inc. Carlos Alberini President & Chief Operating Officer 2 Safe Harbor Statement Except for historical information contained
HUGO BOSS Nine Months Results 2014
 HUGO BOSS Nine Months Results 2014 Mark Langer (CFO) Metzingen, November 4, 2014 Conference Call, Nine Months Results 2014 HUGO BOSS November 4, 2014 2 / 27 BOSS Womenswear fashion show in New York receives
Agenda. 1. Highlights 9M 2013 Results. 2. Financials. 3. Conclusion
 1November 2013 Legal Disclaimer Information in this presentation may involve guidance, expectations, beliefs, plans, intentions or strategies regarding the future. These forward-looking statements involve
McCormick & Company, Inc. 4th Quarter 2018 Financial Results and 2019 Outlook
 McCormick & Company, Inc. 4th Quarter 2018 Financial Results and 2019 Outlook January 24 th 2019 The following slides accompany a January 24 th 2019, earnings release conference call. This information
INVESTOR PRESENTATION JANUARY 2018
 INVESTOR PRESENTATION JANUARY 2018 0 FORWARD-LOOKING STATEMENTS Forward-Looking Statements This presentation contains forward-looking statements that are subject to risks and uncertainties. All statements
For personal use only
 Quarterly Business Review Q2 FY19 Strong December Quarter revenue growth. Jayride has now achieved 22 consecutive quarters of revenue growth. Quarter Highlights Over 20 new countries launched, Over 170
TELECONFERENCE Q FINANCIAL RESULTS
 TELECONFERENCE FINANCIAL RESULTS 10:00 CET, 13 May 2014 1 AGENDA AGENDA Business highlights: Key developments in Market development and sales-out Performance of newly launched products Guidance 2014 Financial
TELECONFERENCE Q FINANCIAL RESULTS
 TELECONFERENCE FINANCIAL RESULTS 10:00 CET, 11 November 2014 1 12 AUGUST 2014 AGENDA AGENDA Business highlights: Key developments in Market development and sales-out Performance of newly launched products
Fourth Quarter & Fiscal 2015 Business Update. February 25, 2016
 Fourth Quarter & Fiscal 2015 Business Update February 25, 2016 Fourth Quarter 2015 Highlights Net Sales Comparable to LY $ in millions, except EPS Adjusted Operating Income* (Adjusted Operating Margin)
McCormick & Company, Inc. 3rd Quarter 2017 Financial Results and Outlook September 28, 2017
 McCormick & Company, Inc. 3rd Quarter 2017 Financial Results and Outlook September 28, 2017 1 The following slides accompany a September 28, 2017 earnings release conference call. This information should
COACH, INC. REPORTS FISCAL 2017 SECOND QUARTER RESULTS; DRIVES DOUBLE-DIGIT EARNINGS GROWTH
 COACH, INC. REPORTS FISCAL 2017 SECOND QUARTER RESULTS; DRIVES DOUBLE-DIGIT EARNINGS GROWTH Second Quarter Net Sales Increased 4% Over Prior Year Despite North America Wholesale Strategic Repositioning
McCormick & Company, Inc. 2nd Quarter 2017 Financial Results and Outlook June 29, 2017
 McCormick & Company, Inc. 2nd Quarter 2017 Financial Results and Outlook June 29, 2017 1 The following slides accompany a June 29, 2017 presentation to investment analysts. This information should be read
Q Results. Strong start in May 3, 2016
 Q1 2016 Results Strong start in 2016 May 3, 2016 Legal Disclaimer Information in this presentation may involve guidance, expectations, beliefs, plans, intentions or strategies regarding the future. These
AXA. Henri de Castries. Chairman & CEO. London - October 2, Sanford C. Bernstein Strategic Decisions Conference
 AXA Henri de Castries Chairman & CEO London - October 2, 2013 Sanford C. Bernstein Strategic Decisions Conference Cautionary note concerning forward-looking statements Certain statements contained herein
Third Quarter 2017 Results Jan Jenisch, CEO Ron Wirahadiraksa, CFO. October 27, 2017 LafargeHolcim Ltd 2015
 Third Quarter 2017 Results Jan Jenisch, CEO Ron Wirahadiraksa, CFO October 27, 2017 LafargeHolcim Ltd 2015 01 Initial views Q3 2017 and Outlook Jan Jenisch, Chief Executive Officer 2017 LafargeHolcim 2
Agenda. 1. Highlights FY 2012 Results. 2. Operational Performance Priorities for Financials. 5. Conclusion
 1MARCH 2013 Legal Disclaimer Information in this presentation may involve guidance, expectations, beliefs, plans, intentions or strategies regarding the future. These forward-looking statements involve
Q Results. Lars Brorsen (CEO) Christoph Hobo (CFO) November 22, 2018
 Christoph Hobo (CFO) November 22, 2018") Q3 2018 Results Lars Brorsen (CEO) Christoph Hobo (CFO) November 22, 2018 Agenda 1. Highlights Q3 2018 2. Market outlook 3. Detailed results review 4. Company outlook 5. Q&A Appendix 1 Business summary
Q3 2018 Results Lars Brorsen (CEO) Christoph Hobo (CFO) November 22, 2018 Agenda 1. Highlights Q3 2018 2. Market outlook 3. Detailed results review 4. Company outlook 5. Q&A Appendix 1 Business summary
Third Quarter Results 2017
 Third Quarter Results 2017 Mark Langer, CEO Metzingen High profile events and campaigns drive brand awareness Own Your Journey Social media campaign Gallery Collection BOSS Womenswear Bread & Butter by
HUGO BOSS First Nine Months Results 2011
 HUGO BOSS First Nine Months Results 2011 Mark Langer (CFO) November 2, 2011 Conference Call, First Nine Months Results 2011 HUGO BOSS November 2, 2011 2 / 30 AGENDA OPERATIONAL HIGHLIGHTS FIRST NINE MONTHS
TELECONFERENCE FY 2014 FINANCIAL RESULTS
 TELECONFERENCE FY 2014 FINANCIAL RESULTS 10:00 CET, 17 February 2015 1 DISCLAIMER Certain statements in this presentation constitute forward-looking statements. Forward-looking statements are statements
Quarterly Statement for Q Metzingen, May 2, gets off to a successful start for HUGO BOSS
 Quarterly Statement for 2018 Metzingen, May 2, 2018 2018 gets off to a successful start for HUGO BOSS Currency-adjusted Group sales up 5% in the first quarter Retail comp store sales up 7% Online business
HY 2018 Results. Record EBITDA & free cash flow generation. August 3, 2018
 HY 2018 Results Record EBITDA & free cash flow generation August 3, 2018 Legal Disclaimer Information in this presentation may involve guidance, expectations, beliefs, plans, intentions or strategies regarding
CONTINUING CONNECTED TRANSACTIONS IN RELATION TO THE TAINWALA LEAVE AND LICENSE AGREEMENT
 Hong Kong Exchanges and Clearing Limited and The Stock Exchange of Hong Kong Limited take no responsibility for the contents of this announcement, make no representation as to its accuracy or completeness
McCormick & Company, Inc. 1 st Quarter 2018 Financial Results and Outlook
 McCormick & Company, Inc. 1 st Quarter 2018 Financial Results and Outlook March 27, 2018 The following slides accompany a March 27, 2018, earnings release conference call. This information should be read
TELECONFERENCE Q FINANCIAL RESULTS
 TELECONFERENCE FINANCIAL RESULTS 10:00 CET, 12 August 2014 1 AGENDA AGENDA Business highlights: Key developments in Market development and sales-out Performance of newly launched products Guidance 2014
Assurant and The Warranty Group: Creating a Leading Global Lifestyle Provider
 Assurant and The Warranty Group: Creating a Leading Global Lifestyle Provider 1 Safe Harbor Statement Some of the statements included in this presentation, particularly those with respect to the proposed
Press release 8 March RESULTS
 2011 RESULTS Slight growth in sales, supported by emerging markets Current Operating Income of 2.2bn Net income, Group share, down 14%, impacted by significant one off elements Net debt reduced by more
Results First Quarter 2012
 Results First Quarter 2012 Harrie Noy, Chief Executive Officer Renier Vree, Chief Financial Officer Amsterdam, the Netherlands, Imagine the result DISCLAIMER Statements included in this presentation that
McCormick & Company, Inc. 2 nd Quarter 2018 Financial Results and Outlook
 McCormick & Company, Inc. 2 nd Quarter 2018 Financial Results and Outlook June 28, 2018 The following slides accompany a June 28, 2018, earnings release conference call. This information should be read
FY 2017 Results Update Analyst Presentation
 FY 2017 Results Update Analyst Presentation March 8, 2018-6.00 PM CET Disclaimer This presentation contains forward-looking statements regarding future events and results of the Company that are based
Third-quarter 2018 results November 9, 2018
 ` Third-quarter 018 results November 9, 018 ` 1 Disclaimer This presentation may contain forward-looking statements. Such statements are not statements of historical fact, and reflect the beliefs and expectations
L OCCITANE EN PROVENCE EN PROVENCE. Final results. for the year ended 31 March 2011
 Final results for the year ended 31 March 2011 Agenda Results Highlights Strategic Review and Future Prospects 2 1. Results Highlights (million ) Net sales Operating profit Net profit 900 800 +26.1%, +
INVESTOR PRESENTATION JUNE 2018
 INVESTOR PRESENTATION JUNE 2018 0 FORWARD-LOOKING STATEMENTS Forward-Looking Statements This presentation contains forward-looking statements that are subject to risks and uncertainties. All statements
2280 North Greenville Avenue, Richardson, TX 75082
 2280 North Greenville Avenue, Richardson, TX 75082 Contact: Investor Relations: Mike Kovar Chief Financial Officer Fossil, Inc. (972) 699-6811 Allison Malkin Integrated Corporate Relations (203) 682-8200
KION Q3 UPDATE CALL Gordon Riske, CEO Thomas Toepfer, CFO Wiesbaden, 14 November 2013
 KION Q3 UPDATE CALL 2013 Gordon Riske, CEO Thomas Toepfer, CFO Wiesbaden, 14 November 2013 AGENDA 1 Highlights 2013 Gordon Riske 2 Financial Update Thomas Toepfer 3 Outlook Gordon Riske 14 November 2013
Final Results Announcement for the Year Ended December 31, 2011
 Hong Kong Exchanges and Clearing Limited and The Stock Exchange of Hong Kong Limited take no responsibility for the contents of this announcement, make no representation as to its accuracy or completeness
PPG Industries, Inc. Third 2016 Financial Results Earnings Brief October 20, 2016
 PPG Industries, Inc. Third 2016 Financial Results Earnings Brief October 20, 2016 Third Quarter 2016 Financial Highlights PPG net sales for the third quarter 2016 were $3.8 billion, up almost 2 percent
FY 2012 Results. March 12 th, 2013
 FY 2012 Results March 12 th, 2013 Fiscal Year 2012 Results Highlights FY 2012 results showing top line growth and profitability increase*, in line with company expectations Net Revenues up 15.1% to 279.3mln
SAMSONITE INTERNATIONAL S.A. 新秀麗國際有限公司
 Hong Kong Exchanges and Clearing Limited and The Stock Exchange of Hong Kong Limited take no responsibility for the contents of this announcement, make no representation as to its accuracy or completeness
Bernstein Strategic Decisions Conference // London
 Bernstein Strategic Decisions Conference // London HUGO BOSS Company Handout September 17, 2014 Dennis Weber, Head of Investor Relations Bernstein Strategic Decisions Conference // London HUGO BOSS September
Full Year Results 2014
 Legal disclaimer Information in this presentation may involve guidance, expectations, beliefs, plans, intentions or strategies regarding the future. These forward-looking statements involve risks and uncertainties.
BAML Conference - Miami
 BAML Conference - Miami Francois Luscan, President & CEO Xavier Leclerc de Hauteclocque, CFO December 3, 2013 Forward Looking Statement This presentation may include forward-looking statements. Forward-looking
Herbalife Ltd. Reports Record Second-Quarter Net Sales; Second-Quarter Diluted Earnings Per Share of $0.49 Increased 54.4 Percent
 Reports Record Second-Quarter Net Sales; Second-Quarter Diluted Earnings Per Share of $0.49 Increased 54.4 Percent LOS ANGELES--(BUSINESS WIRE)--Aug. 2, 2006-- (NYSE:HLF) today reported record second-quarter
Agenda. Company Overview Annual Financial Results. Business Review and Prospects
 Disclaimer This presentation and the accompanying slides (the Presentation ) which have been prepared by IGG INC (the Company ) do not constitute any offer or invitation to purchase or subscribe for any
HUGO BOSS confirms full-year sales and earnings forecast substantial progress made in implementing strategic realignment
 Quarterly Statement for Q2 2017 Metzingen, August 2, 2017 HUGO BOSS confirms full-year sales and earnings forecast substantial progress made in implementing strategic realignment Currency-adjusted sales
Interim results FOR THE six months ENDED 30 September 2011
 Interim results FOR THE six months ENDED 30 September 2011 1 2 1 FINANCIAL REVIEW Creative culture AND innovation SUSTAINING COMPETITIVE ADVANTAGE QUESTIONS 3 First half achievements RECORD FIRST HALF
Press Release HUGO BOSS First Half Year Results HUGO BOSS accelerates growth in second quarter of 2015
 Press Release HUGO BOSS First Half Year Results HUGO BOSS accelerates growth in second quarter of Sales rise by 16% in reporting currency and 7% currency-adjusted 6% increase in retail comp store sales