Disclosure Statement. Page 2
|
|
|
- Marshall Scott Norman
- 6 years ago
- Views:
Transcription
1
2 Disclosure Statement Page 2 This presentation and the accompanying slides (the Presentation ) which have been prepared by Samsonite International S.A. ( Samsonite or the Company ) do not constitute any offer or invitation to purchase or subscribe for any securities, and shall not form the basis for or be relied on in connection with any contract or binding commitment whatsoever. This Presentation has been prepared by the Company based on information and data which the Company considers reliable, but the Company makes no representation or warranty, express or implied, whatsoever, on the truth, accuracy, completeness, fairness and reasonableness of the contents of this Presentation. This Presentation may not be all-inclusive and may not contain all of the information that you may consider material. Any liability in respect of the contents of or any omission from this Presentation is expressly excluded. Certain matters discussed in this presentation may contain statements regarding the Company s market opportunity and business prospects that are individually and collectively forward-looking statements. Such forward-looking statements are not guarantees of future performance and are subject to known and unknown risks, uncertainties and assumptions that are difficult to predict. The Company s actual results, levels of activity, performance or achievements could differ materially and adversely from results expressed in or implied by this Presentation, including, amongst others: whether the Company can successfully penetrate new markets and the degree to which the Company gains traction in these new markets; the sustainability of recent growth rates; the anticipation of the growth of certain market segments; the positioning of the Company s products in those segments; the competitive environment; general market conditions and potential impacts on reported results of foreign currency fluctuations relative to the U.S. dollar. The Company is not responsible for any forward-looking statements and projections made by third parties included in this Presentation.
3 Agenda Results Highlights Business Overview Financial Highlights Outlook and Strategy for 2017 Q&A Page 3
4 2016 Results Highlights Record net sales of US$2.8 billion +17.3% Constant Currency Growth +20.4% Constant Currency Growth +22.8% Constant Currency Growth +20.5% Constant Currency Growth Page 4 Constant currency net sales growth of US$420.4 million, partly offset by negative currency translation impact of US$42.4 million. Excluding $275.8 million of Tumi sales, constant currency sales growth was 6.0%. Indicates % of net sales Gross margin up 150bp from 2015 to 54.1%, largely due to the inclusion of Tumi, which had 64.7% gross margin. Excluding Tumi, gross margin improved from prior year by 40bp from 52.6% to 53.0%. Adjusted EBITDA margin improved by 80bp from 2015, largely due to the inclusion of Tumi, which had Adjusted EBITDA margin of 23.3%. Excluding Tumi, Adjusted EBITDA margin increased by 10bp from 16.5% in 2015 to 16.6% in (1) FX gain/(loss) represents the realized and unrealized net loss on the balance sheet translation of amounts not denominated in local currencies Adjusted Net Income is up US$41.0 million due mainly to higher Adjusted EBITDA and lower effective tax rate, partly offset by tax-effected interest expense of US$22.7 million associated with the Tumi acquisition.

5 Strong Continuous Sales Growth 5-Year CAGR of 12.4% Since IPO in 2011 * Constant currency sales growth that was reported for each year, calculated by applying the average exchange rate of the previous year to current year local currency results. Page 5
6 2016 Business Overview Sustained investment in brands Strong constant currency growth of 42.4% (11.8% excluding Tumi) in total direct-to-consumer channel net sales with retail up 42.2% (10.8% excluding Tumi) and direct-to-consumer e- commerce up 43.4% (17.2% excluding Tumi). Total e-commerce net sales (direct-toconsumer e-commerce and wholesale to e-retailers) constituted 9.5% (9.6% excluding Tumi) of total net sales, up 100bp from 8.5% in Page advertising and promotion spend of US$143.8 million (5.1% of sales) is 8.9%, or US$11.7 million, higher than 2015 spend of US$132.1 million (5.4% of sales). Multi-channel strategy Strong growth in all regions The Group generated operating cash flow of US$260.8 million in 2016 compared to US$259.0 million recorded in the previous year, despite the US$34.2 million increase in cash interest payments and the US$37.3 million increase in acquisitionrelated costs. Multicategory strategy Strong constant currency net sales growth in all regions: Asia: +9.9% (+4.0% excluding Tumi) North America: +26.8% (+3.9% excluding Tumi) Europe: +16.1% (+10.3% excluding Tumi) Latin America: +17.4% Multi-brand strategy Strong results underscore the resilience of our multi-brand, multicategory and multi-channel strategy Constant currency net sales growth bolstered by diversified brand portfolio: Samsonite: +5.9% American Tourister: -1.0% Speck: +15.1% Gregory: +22.7% Lipault: % Strong constant currency net sales growth across all product categories: Travel: +11.4% (+4.5% excluding Tumi) Business: +38.2% (+3.8% excluding Tumi) Casual: +16.4% (+6.1% excluding Tumi) Accessories: +47.3% (+26.4% excluding Tumi)
 North America: +3.9% (1) Europe: +10.3% (1) Latin America: +17.4% (1) Incremental net sales of US$274.5 (1) million from the acquisition of Tumi.")
7 Strong net sales growth partly offset by currency translation pressure US$m Net Sales Bridge to 2016 Organic net sales growth of US$145.9 million (1), or 6.0% (1), coming from: +6.0% +11.3% -1.8% Asia: +4.0% (1) North America: +3.9% (1) Europe: +10.3% (1) Latin America: +17.4% (1) Incremental net sales of US$274.5 (1) million from the acquisition of Tumi. * Currency translation had an adverse impact of US$42.4 million on reported net sales from the strengthening US Dollar during the year, particularly against the RMB (-US$14.7 million), GBP (-US$9.6 million), MXN (-US$7.0 million), INR (-US$6.3 million) and KRW (-US$4.1 million) (1) Stated on a constant currency basis. Page 7 * Constant currency impact of Tumi sales from August through December of 2016.
8 Adjusted Net Income Bridge (1) +15.7% +US$7 million for 5 months Page 8 (1) Main items typically adjusted out of net income when calculating Adjusted Net Income are amortization, acquisition costs, JV put option expense and the estimated tax impact on these items. In 2016, the income tax benefit of US$56.8 million related to the liquidation of the pension plan and US$5.8 million ticking fees were also adjusted out.


9 2016 Results Highlights Excluding Tumi Results +6.0% Constant Currency Growth +6.5% Constant Currency Growth -3.8% Constant Currency Growth +6.8% Constant Currency Growth Page 9 Constant currency net sales growth of US$145.9 million, partly offset by negative currency translation impact of US$43.7 million. Indicates % of net sales Gross margin increased 40bp due mainly to a higher proportion of sales from directto-consumer channels and higher gross margins at Speck, partly offset by the negative impact of currency on US Dollar denominated product purchases. Advertising as a percentage of net sales is 50bp lower than prior year as Europe returned to traditional levels of advertising spending and Asia eased spending to help offset the impact of lower retail sales comps on profitability. Adjusted EBITDA margin improved by 10bp from 2015 to 2016 mainly driven by higher gross margins and reduced advertising spend as a percentage of net sales, partly offset by higher selling expenses as a percentage of net sales.


10 Strong increase in sales growth and Adjusted EBITDA margin from 1 st half to 2 nd half, excluding Tumi Constant currency net sales growth increased from 4.1% in the 1 st half of 2016 to 7.8% in the 2 nd half of 2016 due mainly to improved retail sales comps (-0.5% in 1 st half of 2016 compared to +5.1% in 2 nd half of 2016) and strong Speck sales growth in the 2 nd half. Year-over-year constant currency sales growth by region is as follows: Y-O-Y sales Growth 1H H 2016 Asia 3.7% 4.2% North America 0.5% 7.3% Europe 8.6% 11.8% Latin America 13.6% 21.6% Indicates % of net sales Page 10
11 2016 Results Highlights Tumi August through December Net sales growth of US$24.4 million, or 9.7%, is partly due to the impact of consolidating Tumi Japan. Excluding the impact of Tumi Japan, sales growth of 5.8% was driven mainly by 6.9% same store comps and the addition of 23 net new company owned stores since July 2015, partly offset by decreased wholesale sales in North America and Europe. Gross margin increased by 200bp due mainly to less promotional activity in retail stores and Tumi.com during 2016 as well as the impact of consolidating Tumi Japan. Advertising spend was significantly increased soon after the completion of the acquisition in order to accelerate brand awareness and drive future sales growth. Adjusted EBITDA margin decreased by 340bp from 2015 to 2016 mainly driven by higher advertising spend as a percentage of net sales, partly offset by higher gross margin and initial cost savings from synergies. Excluding the additional advertising spend, Adjusted EBITDA margin would have been 26.9%, which is 20bp higher than prior year. Page 11 Indicates % of net sales Note: Comparative figures for Tumi s five month period ended December 31, 2015 are based on Tumi s internal management reporting because Tumi did not otherwise publish financial statements for such five month period.
12 Tumi Acquisition Integration Update Integration going largely as planned. Management structure is in place: Rob Cooper is General Manager of North America business; Asia and Europe integrating with regional teams. SAP conversion on track for May will allow completion of other cost synergies. Accelerated advertising vs. original plan by US$10m in 2016 to drive sales growth. Buy back of Tumi s distributors progressing ahead of plan: South Korea completed, effective January 1, Sourcing initiatives going well: Additional gross margin improvements anticipated in 2017 and beyond; Timing of certain sourcing cost synergies intentionally delayed to be careful not to disrupt the business. Estimated synergy savings to date of US$3.7 million, or approximately US$9 million of annualized savings, mainly through reduced headcount, public company and freight expenses. Expect full year run-rate cost synergy savings in line with our original estimates by end of 2018, largely from reduced headcount, sourcing, public company and freight expenses. Page 12
13 Tumi Net Sales and EBITDA by Region Tumi (US$M) Change Change % Net Sales Asia $ 58.8 $ 47.3 $ % North America $ $ $ % Europe $ 30.5 $ 29.4 $ % Corp. & Licensing $ 1.0 $ 0.8 $ % Total $ $ $ % +2.9% growth in Asia, excluding impact of consolidating Japan. Adjusted EBITDA Asia $ 22.2 $ 21.9 $ % North America $ 37.3 $ 41.2 $ (3.9) -9.5% Europe $ 4.8 $ 4.5 $ % Corp. & Licensing $ (0.0) $ (0.6) $ % Total $ 64.3 $ 67.1 $ (2.8) -4.1% Adjusted EBITDA % Asia 37.8% 46.3% -850bp North America 20.1% 23.7% -360bp Europe 15.8% 15.5% 30bp Corp. & Licensing 0.0% -0.2% 20bp Total 23.3% 26.7% -340bp Note: Comparative figures for Tumi s five month period ended December 31, 2015 are based on Tumi s internal management reporting because Tumi did not otherwise publish financial statements for such five month period. Increased advertising by approximately US$10 million in North America. Excluding this increased advertising spend, EBITDA increased by US$6.1 million, or 14.8%, from the same period in Asia s EBITDA margin is lower due to higher sales and higher operating expenses from the consolidation of Japan in Excluding the increased advertising, North America s EBITDA margin would be 25.5%, which is 180bp higher than 2015 due to improved gross margin as a result of less promotional activity and initial cost savings from synergies. Total EBITDA margin would be 26.9%, excluding the additional advertising spend, which is 20bp higher than prior year. Page 13

14 Asia Strong net sales and profit growth aided by addition of Tumi and supported by moderate growth in the organic business. Page % Constant Currency Growth Sales growth of approximately US$22 million, or 4.0% on a constant currency basis. Excluding Tumi Indicates % of net sales Adjusted EBITDA up approximately US$5 million. As a percentage of sales, Adjusted EBITDA in line with prior year. Strong full year constant currency net sales growth of 9.9% (1), including Tumi sales of US$58.8 million. Excluding Tumi, sales growth of 4.0% (1), driven by: Strong net sales growth of 6.8% (1) in direct-to-consumer channels with: Retail store net sales growth of 1.4% (1) coming from 26 net new company operated stores added in 2016, and the full year impact of 39 net new stores added during This was partly offset by a 4.8% (1) decrease in same store comps due largely to adverse retail conditions in Hong Kong, (including Macau) and South Korea including the impact of lower Chinese tourist arrivals. Excluding these challenged markets, same store sales were up 1.8% (1) ; Direct-to-consumer e-commerce net sales growth of 24.4% (1) was driven by China with growth of 31.1% (1) and all other markets up 22.3% (1). Net sales growth of 3.4% (1) in wholesale channels including 18.5% (1) growth in net sales to e-retailers; Samsonite net sales growth of 7.1% (1), with Samsonite Red up 12.4 % (1) as the sub-brand expanded into new key markets within the region and all other Samsonite brands up 6.2% (1) ; American Tourister net sales de-growth of 7.3% (1) mainly due to decrease in the TV home shopping channel in China and South Korea; Kamiliant, our recently launched value-conscious entry level brand, contributed US$21.9 million of net sales in 2016 compared to just US$2.8 million in 2015; Strong growth in Lipault as the brand continued to expand throughout the region up from US$2.7 million of net sales in 2015 to US$10.4 million in Travel category net sales increased by 2.3% (1), while business category was up 12.3% (1), casual category was up 7.0% (1) and the accessories category was up 17.6% (1). Adjusted EBITDA margin of 22.2% is up 100bp from prior year mainly due to impact of Tumi. Excluding Tumi, Adjusted EBITDA is consistent with prior year at 21.2%. (1) Stated on a constant currency basis
15 North America Tumi driving significant increase in sales and profitability, while organic business achieved solid growth with positive retail trend in the 2 nd half of the year. Page % Constant Currency Growth Sales growth of approximately US$30 million, or 3.9% on a constant currency basis. Excluding Tumi Indicates % of net sales Adjusted EBITDA up approximately US$8 million. As a percentage of sales, Adjusted EBITDA up 40bp to 15.7% in Net sales increased by 26.8% (1) including Tumi sales of US$185.4 million. Excluding Tumi sales, growth was 3.9% (1), driven by: Net sales growth in the wholesale channel was 3.6% including 19.7% (1) increase in net sales to e-retailers; Direct-to-consumer channel net sales were up 5.4% year-over-year (1) as: The retail channel was up 6.1% (1), with a 0.8% (1) increase in same store sales comps plus 5 net new stores 2016 and the full year impact of 16 net new stores in Comp sales rebounded strongly in the second half of the year from a 4.4% decrease in the first half to 5.2% increase in the second half; Direct-to-consumer e-commerce net sales increased by 2.8% (1). With the exception of Hartmann, all brands showed positive sales growth with Samsonite +1.8% (1), American Tourister +3.1% (1), Speck +14.9% (1) driven by new device launches in the 2 nd half, Gregory +11.6% (1), High Sierra +1.6% (1), Hartmann -2.1% (1). As a result of bringing distribution of Lipault in-house in January 2016, the brand generated US$3.5 million of net sales in Travel and Accessories category sales were up 3.5% (1) and 34.4% (1), respectively, while Business and Casual category sales were down 19.3% (1) and 1.7% (1), respectively. Strong growth in Accessories category sales was driven by Speck smartphone protective cases and the decrease in Business category sales is due mainly to lower sales of Speck laptop and tablet protective cases. Adjusted EBITDA as a percentage of net sales is up 120bp from prior year mainly driven by the partial year inclusion of Tumi. Excluding Tumi, Adjusted EBITDA margin increased by 40bp driven by gross margin improvement of 160bp, partially offset by higher advertising as a percentage of net sales. (1) Stated on a constant currency basis
16 Europe Strong net sales growth of 16.1% (1) largely due to excellent performance in the organic business and bolstered by the addition of Tumi. Page % Constant Currency Growth Sales growth of approximately US$40 million, or 10.3% on a constant currency basis. Excluding Tumi Indicates % of net sales Adjusted EBITDA up approximately US$13 million. As a percentage of sales, Adjusted EBITDA up 100bp to 18.0% in Constant currency net sales growth of 16.1%, including US$30.5 million Tumi sales. Excluding Tumi, sales growth was 10.3% on a constant currency basis led by UK (+21.3% (1) ), Germany (+15.7% (1) ), Italy (+11.3% (1) ) and Russia (+23.2% (1) ). This was driven by: Strong growth of 16.0% (1) in direct-to-consumer channels with: Retail up 14.6% (1), driven by +7.6% (1) same store comps, 6 net new company operated stores opened in 2016 and the full year impact of 79 net new stores opened during 2015, including 21 net new Rolling Luggage stores and 30 net new Chic Accent stores; Direct-to-consumer e-commerce net sales increased by 31.3% (1). Wholesale net sales growth of 7.6% (1). Samsonite net sales up 7.8% (1) and American Tourister net sales increased 21.9% (1). American Tourister comprised 13.1% of the net sales in the European region excluding Tumi during 2016 compared to 11.7% during 2015 as the Group continued its focus on increasing the presence of this brand in Europe; Lipault net sales grew 27.0% (1), Gregory up by 31.4% (1), Hartmann sales more than doubled to US$3.3 million. High Sierra net sales decreased by 37.5% (1) reflecting a strategic decision to focus on other casual brands in the European region; Net sales for the Travel category increased by 7.2% (1) ; Business and Casual category net sales increased by 17.6% (1) and 37.2% (1), respectively due to successful new product introductions and the Accessories category net sales increased by 24.0% (1) mainly due to increased sales through the Chic Accent retail chain that was acquired in Adjusted EBITDA margin increased by 90bp. Excluding Tumi, Adjusted EBITDA margin increased 100bp as lower advertising and operating expenses as a percentage of sales more than offset the 70bp decrease in gross margin that was mostly attributable to FX impact on product purchases. (1) Stated on a constant currency basis
17 Latin America Investment in retail expansion, team and infrastructure to position the region for future growth Page % Constant Currency Growth Excluding Tumi Indicates % of net sales Tumi sales made to distributors in the Latin America region totalling approximately US$1.6 million were processed and recorded in the North America region. Net sales increased 17.4% (1) on strong growth in Mexico (+30.9% (1)(2) ), Chile (+6.8% (1) ), and Brazil (25.5% (1) ). The majority of regional net sales growth came from direct-to-consumer channel, which was up 37.8% (1). This came from same store comp growth of 9.4% (1) as well as 37 net new company owned stores opened during 2016 and the full year impact of 28 net new stores opened during Wholesale channel net sales grew 7.6% (1) driven mainly by Mexico. Samsonite net sales increased 18.9% (1), with strong growth in every major market in the region. American Tourister sales in the region almost doubled in constant currency (+98.5% (1) ) with Mexico being the main country in the region that is currently distributing this brand. Strong net sales growth in the Xtrem (+9.4% (1) ), Secret (+17.1% (1) ) and Saxoline (+5.5% (1) ) brands that are mostly distributed in Chile. Strong net sales growth across all categories with Travel and Business up 22.6% (1) and 25.7% (1) respectively, and Casual and Accessories growth of 9.5% (1) and 6.9% (1), respectively. Adjusted EBITDA as a percentage of net sales was down 310bp mainly driven by: 400bp increase in operating expenses (excluding advertising, depreciation and amortization) associated with investing in retail expansion, regional and country-level teams and infrastructure to position the region for strong growth in the coming years; 60bp increase in advertising as a percentage of net sales to drive market share and brand awareness; Partially offset by 160bp improvement in gross margin largely due to retail growth and price increases. (1) Stated on a constant currency basis (2) Mexico, excluding export sales
18 Constant currency Net Sales growth in most key markets (1) (2) Page 18 (1) Hong Kong includes Macau and wholesale sales to Asia s Tumi distributors. (2) UK includes Ireland.

19 Continued brand penetration drove constant currency Net Sales growth in most emerging markets with combined constant currency growth of 15.1% (1) Page 19 (1) Mexico, excluding export sales
, with: Strong retail net sales growth of 10.8% (1) driven by same store comps of 2.")
20 Direct-to-consumer channel sales accelerated with the acquisition of Tumi * * + = * Tumi and Combined Group are based on Pro-forma full year net sales for Tumi. Direct-to-consumer Wholesale Excluding Tumi, direct-to-consumer net sales growth was 11.8% (1), with: Strong retail net sales growth of 10.8% (1) driven by same store comps of 2.5% (1) and the addition of 74 net new stores in 2016 and the full year impact of 162 net new stores added in Strong direct-to-consumer e-commerce net sales growth of 17.2% (1). Excluding Tumi, total e-commerce net sales increased by 19.7% (1) and made up 9.6% of total net sales in 2016, up from 8.5% of total net sales in % (1) growth in net sales to e-retailers, included within the wholesale channel. 17.2% (1) growth in direct-to-consumer e-commerce net sales, included within the direct-to-consumer channel. Page 20 (1) Stated on a constant currency basis.
21 Diversified brand portfolio generated continued sales growth Constant Currency Growth Net Sales growth by brand 5.9% -1.0% NA 15.1% -2.9% 22.7% 102.9% 21.4% 706.2% 1.8% (1) Stated on a constant currency basis. (2) Figures for Tumi s seven month period ended July 31, 2016 are based on Tumi s internal management reporting because Tumi did not otherwise publish financial statements for such seven month period. Page 21 Strong growth in Samsonite with net sales up 5.9% on a constant currency basis: Asia +7.1% (1), North America +1.8% (1), Europe +7.8% (1), and Latin America +18.9% (1). American Tourister net sales down 1.0% on a constant currency basis due to challenged markets of South Korea and China where the brand has a strong presence: Asia -7.3% (1), North America +3.1% (1) ; Continued focus on further globalizing the brand resulted in strong growth in Europe +21.9% (1) and Latin America +98.5% (1). Tumi contributed US$275.8 million of net sales since August 1, Pro-forma full year net sales were approximately US$592 million (2). Strong Speck sales growth of 15.1% is largely due to successful new product launches related to certain new electronic device introductions and product placement in new key mobile carrier accounts. High Sierra net sales are up 1.6% (1) in North America, but down in all other regions as Asia and Europe are more focused on driving Gregory as the casual brand in those regions and Latin America is more focused on leveraging Xtrem as its primary casual brand. Strong sales growth for Gregory in all regions where it is distributed, with Asia +29.4% (1), North America +11.6% (1) and Europe +31.4% (1). Lipault net sales more than doubled as it continues to gain traction in markets outside of Europe, with Asia up 294.1% (1) to US$10.4 million and North America up to US$3.5 million from nothing in 2015, while Europe still showed strong growth of 27.0% (1), Hartmann net sales were up in Asia and Europe by US$3.3 million and US$1.7 million, respectively. Since its introduction in 2015, Kamiliant grew from US$2.8 million to US$21.9 million in 2016, taking market share from entry-level brands in Asia.

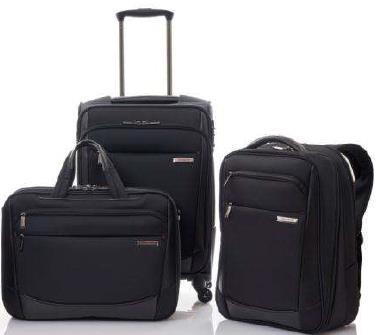


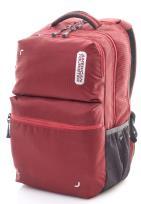
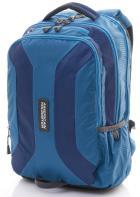
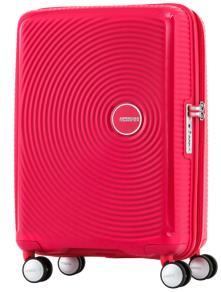
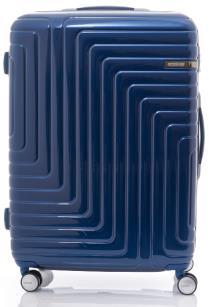
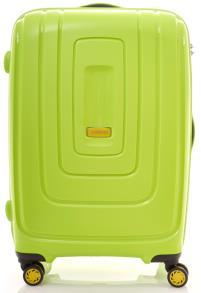

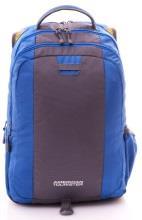
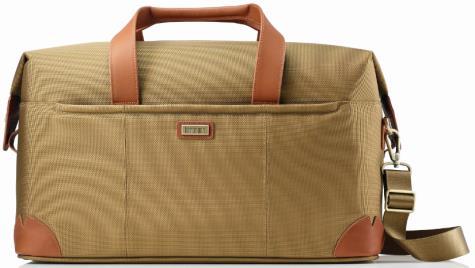
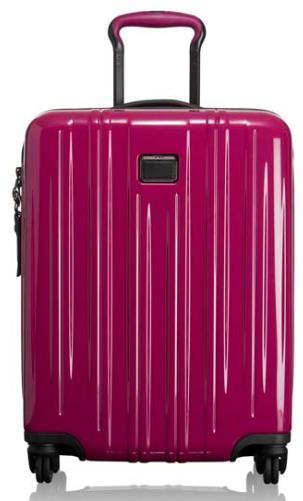
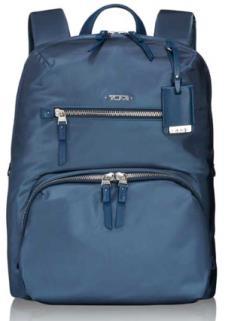
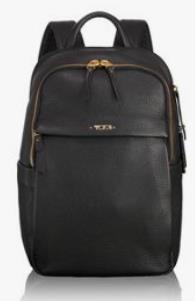
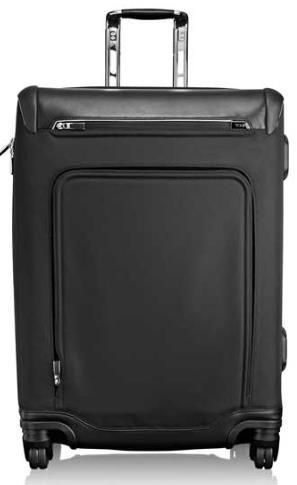
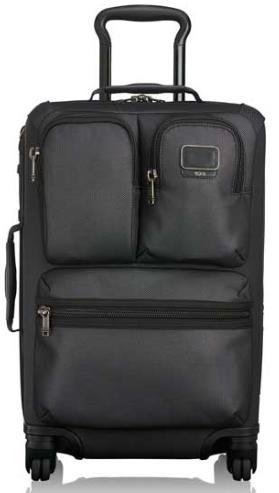
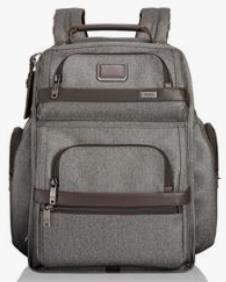
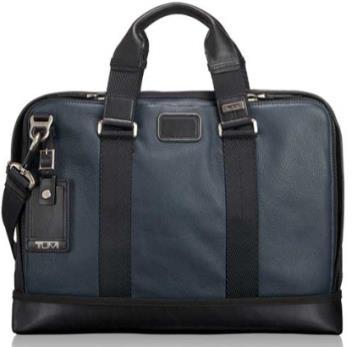
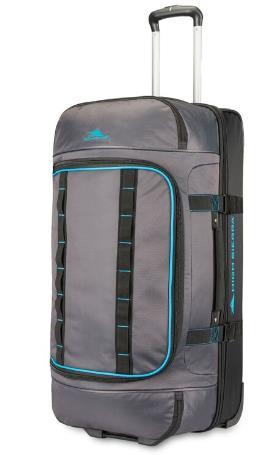
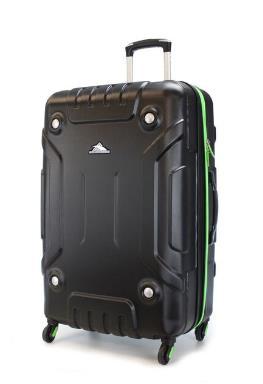
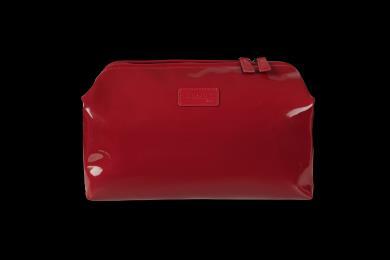
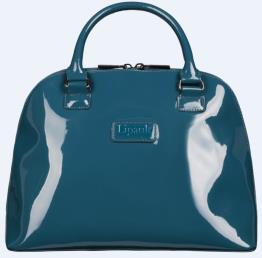
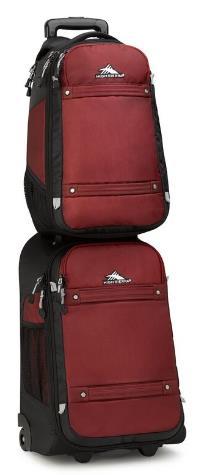
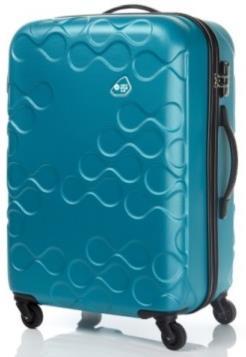
22 Key Product Assortment North America Europe Asia North America Asia Europe Latin America Page 22


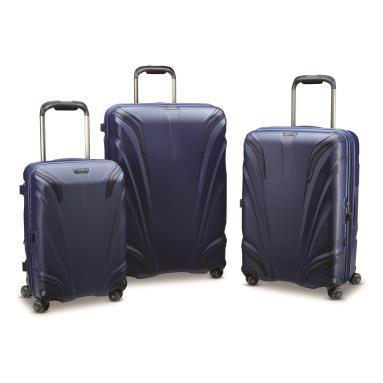
23 Page 23 Key Product Assortment

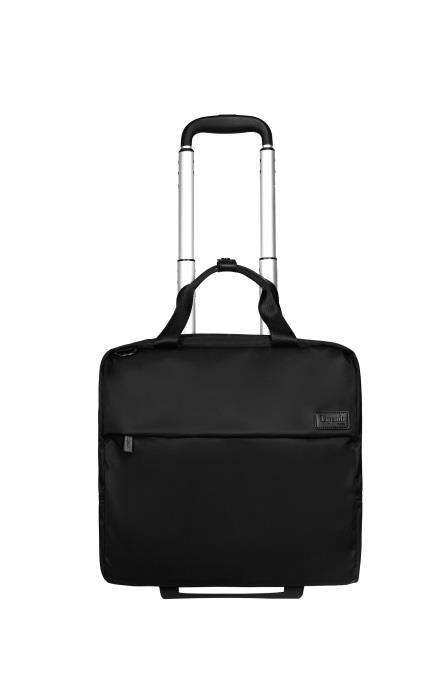

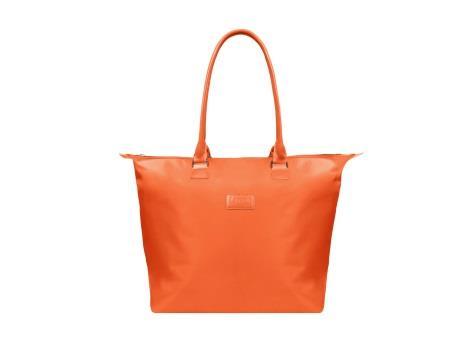


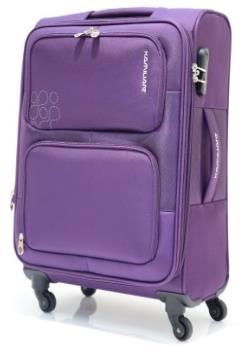

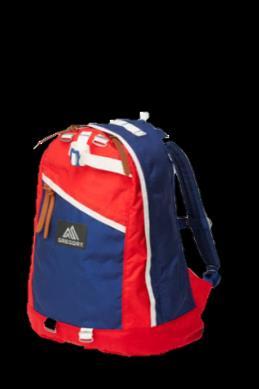

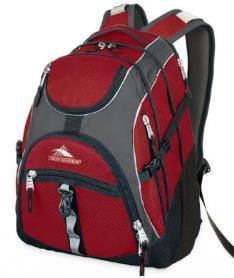

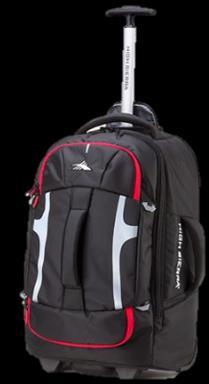

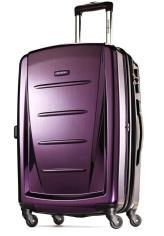
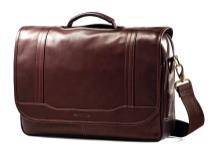
24 Page 24 Key Product Assortment
25 All key categories contributed to net sales growth Page 25 Net Sales growth by product category Non-Travel categories constituted US$992.7 million of net sales in 2016, representing 35.3% of total net sales compared to US$771.6 million, or 31.7% of net sales in Const. Curr. Growth 11.4% 38.2% 16.4% 47.3% -7.5% Const. Curr. Growth excl. Tumi 4.5% 3.8% 6.1% 26.4% -9.6% Travel remained our largest product category and traditional strength with all regions contributing to its organic growth of 4.5% (1). Non-travel net sales increased from 31.7% (1) of total net sales in 2015 to 35.3% (1) of total net sales in Excluding the impact of Tumi, non-travel sales in 2016 represents 32.7% (1) of total net sales, with: Net sales in the Business category increased by 3.8% (1), largely due strong growth in Asia +12.3% (1), Europe +17.6% (1) and Latin America +25.7% (1), while North America was down 19.3% (1) due to lower sales of Speck protective laptop and tablet cases. Casual category net sales increased by 6.1% (1) driven largely by sales growth of Gregory in Asia, North America and Europe and Samsonite Red in Asia; Growth of 26.4% (1) in the Accessories category was mainly attributable to sales of Speck phone cases in North America, as well as the full year impact of Chic Accent s handbag business in Europe. De-growth in the Other category was driven largely by the transition of 3 rd party product sales to Samsonite-owned brand sales in Rolling Luggage and Chic Accent retail stores. (1) Stated on a constant currency basis

26 8.9% increase in global advertising spend to drive continued sales growth Indicates % of net sales Total advertising spend increased by 8.9%, focused mainly on boosting consumer awareness of Tumi and other newer brands within the regions and non-travel categories within the Samsonite brand. Advertising spend in Asia is lower than prior year to partially offset the impact of lower retail comps on profitability. Increased advertising in North America is largely driven by high advertising spend on Tumi. Excluding Tumi, North America advertising spend was 4.8% of sales. Europe advertising as a percentage of net sales was down 100bp from prior year as high advertising investment in the American Tourister brand over the past couple of years returned to a more normalized level. Latin America advertising as a percentage of net sales was up 60bp from prior year to drive further brand awareness in markets where we are expanding our retail presence. Page 26


27 Targeted Brand Advertising American Tourister - Scandinavia American Tourister - Mexico Samsonite (Business) - Austria Samsonite - Singapore Page 27 Lipault France American Tourister United States Samsonite United States
28 Financial Highlights Page 28 Net sales increased to a record level of US$2,810.5 million, with sales growth of 6.0% (1) in the organic business and an additional US$275.8 million of net sales from Tumi. Adjusted Net Income increased by 18.9% to US$257.9 million, despite a year-on-year increase in interest expense of US$40.5 million. Operating cash flow of US$260.8 million in 2016 was up US$1.7 million compared to US$259.0 million recorded in the previous year, despite the US$34.2 million increase in cash interest payments and the US$37.3 million increase in acquisition-related costs. Net debt position of US$1,571.2 million as of December 31, 2016, with US$368.5 million of cash and cash equivalents and US$1,939.7 million of debt (excluding deferred financing costs of US$64.3 million), which was utilized to finance the Tumi acquisition. US$13.6 million was outstanding on the revolving credit facility, leaving US$486.4 million available to be borrowed. The Company was in compliance with all debt covenants as of December 31, 2016 Pro forma total net leverage ratio (3) of 2.84:1.00 against a requirement of not greater than 4.75:1.00. On February 2, 2017, the Company s senior term loan debt was re-priced, expected to result in a reduction in cash interest payments in the first full year of approximately US$16 million. Interest rate on the Term Loan A and revolving facility reduced from LIBOR % per annum to LIBOR+ 2.00% per annum. Interest rate on Term Loan B reduced from LIBOR %, with a LIBOR floor of 0.75%, to LIBOR %, with 0.0% LIBOR floor. Net working capital efficiency of 12.6% as of December 31, 2016 continued to run favorable to target level of 14%, even with Tumi included. Capital expenditures of US$69.6 million in 2016 was largely focused on the Group s continuing strategy to pursue targeted retail expansion and store modifications and lead the industry in new product innovations. In conjunction with the liquidation of the Group s principal defined benefit pension plan in the U.S., the Group recognized an income tax benefit of US$56.8 million for derecognizing the deferred tax liability and a settlement gain of US$6.0 million. Excluding the tax benefits realized from the liquidation of the pension plan, reduction in the Luxembourg tax rate and tax deductions on Tumi acquisition costs, the effective tax rate was 27.8% in 2016, compared to 25.4% in The reported effective tax rate reflected a benefit of 0.8% due to these items. On March 15, 2017, the Company s Board of Directors recommended that a cash distribution of US$97.0 million, or approximately US$ per share, be paid in July 2017, up 4.3% from the US$93.0 million distribution paid in July (1) Stated on a constant currency basis. (2) Net working capital efficiency is adjusted for pro forma full year sales of Tumi. (3) Per the terms of the debt agreement, net leverage ratio is calculated as (total loans and borrowings total unrestricted cash)/ltm Adj. EBITDA. LTM Adj. EBITDA is calculated on a pro-forma basis to include the trailing twelve months of Tumi s results and pro-forma run-rate cost synergies expected at August 1, 2018.
29 High Level Bridge of Underlying Growth in Profit Attributable to Equity Holders Underlying growth and net income Specific to 2016 Net impact of Tumi for 5 months (1) Page 29 (1) Ticking fees represent the interest expense associated with the Term Loan B facility incurred prior to the closing of the Tumi acquisition.
30 Effective tax rate was mainly impacted by pension liquidation and Tumi acquisition 2015 Effective Tax Rate 25.4% Change in organic profit mix 0.1% Change in reserves, non-deductibles and tax credits 1.6% Change in tax incentives 0.3% 2016 Effective Tax Rate - Samsonite Organic 27.4% Impact of Tumi profit mix 0.4% 2016 Effective Tax Rate - Combined Group 27.8% Impact of Tumi acquisition costs -4.5% Impact of Luxembourg rate change on existing deferred tax liabilities -3.3% Deferred tax impact of pension plan liquidation -20.8% 2016 Effective Tax Rate -0.8% Tumi had a beneficial impact on the 2016 effective tax rate due to tax deductions on Tumi acquisition costs. Luxembourg tax rate reduction had a large beneficial impact on the 2016 effective tax rate as it is applied not only to current year profit before tax, but also deferred tax liabilities. Going forward, the normalized effective tax rate is expected to be in the range of 27% - 30%. Page 30
31 Leveraged Balance Sheet to Finance Tumi Acquisition US$m December 31, December 31, Cash and cash equivalents % Trade and other receivables, net % Inventories, net % Other current assets % Non-current assets 1, , , % Total Assets 2, , , % Current liabilities (excluding debt) % Non-current liabilities (excluding debt) % Total borrowings , , % Total equity 1, , % Total Liabilities and Equity 2, , , % Total Net Cash (Debt) (1) (1,571.2) (1,687.9) % (1) Total Net Cash (Debt) excludes deferred financing costs, which are included in total borrowings. (2) The sum of the line items in the table may not equal the total due to rounding. $ C hg D ec-16 vs. D ec-15 % C hg D ec-16 vs. D ec-15 (3) Per the terms of the debt agreement, net leverage ratio is calculated as (total loans and borrowings total unrestricted cash)/ltm Adj. EBITDA. LTM Adj. EBITDA is calculated on a pro-forma basis to include the trailing twelve months of Tumi s results and pro-forma run-rate cost synergies expected at August 1, Cash and cash equivalents increased by US$187.7 million to US$368.5 million at December 31, Cash flows from operations were US$260.8 million and acquired Tumi s cash position of US$145.5 million at closing, partly offset by outflows for capital expenditures of US$69.6 million and cash distribution to shareholders of US$93.0 million. Pro-forma total net leverage ratio (3) of 2.84:1.00 and US$486.4 million of revolver availability. Continued strong working capital efficiency of 12.6% as of December 31, Page 31
32 Efficiently Managing Working Capital US$m December 31, December 31, (1) Working Capital Items Inventories $ $ $ % Trade and Other Receivables $ $ $ % Trade Payables $ $ $ % Net Working Capital $ $ $ % % of Net Sales 11.8% 12.6% Turnover Days Inventory Days Trade and Other Receivables Days Trade Payables Days Net Working Capital Days $ Chg Dec-16 vs. Dec-15 % Chg Dec-16 vs. Dec-15 (1) 2016 net working capital as a percentage of net sales and turnover days are adjusted for pro forma full year net sales and cost of sales of Tumi. Inventory turnover days calculated as ending inventory balance divided by cost of sales for the period and multiplied by the number of days in the period Trade and other receivables turnover days calculated as ending trade and other receivables balance divided by net sales for the period and multiplied by the number of days in the period Trade payables turnover days calculated as ending trade payables balance divided by cost of sales for the period and multiplied by the number of days in the period Net working capital efficiency (% of net sales) is calculated as net working capital divided by annualized net sales Working capital continued to be managed efficiently at 12.6% of net sales at December 31, 2016, favorable to targeted 14% level. Excluding Tumi, working capital efficiency at December 2016 was 11.9%. Inventory turnover of 109 days as of December 31, 2016 reflects slower inventory turns in the Tumi business. Excluding Tumi, inventory turnover as of December 31, 2016 was 102 days, representing an improvement of eight days from prior year. Trade and other receivables turnover of 42 days as of December 31, 2016 reflects faster receivables in the Tumi business due to a higher proportion of sales through direct-to-consumer channels. Excluding Tumi, trade and other receivables turnover of 47 days is four days higher than prior year due mainly to a Speck duty refund receivable recorded at the end of Trade payables turnover of 100 days as of December 31, 2016 reflected shorter vendor payment terms in the Tumi business. Excluding Tumi, trade payables turnover was consistent with December 31, 2015 at 109 days. Page 32
33 Capital Expenditures Capital Expenditure by project type US$m Retail Product Development / R&D/ Supply Information Services and Facilities Other Total Capital Expenditures $68.5 $69.6 Page 33 The sum of the line items in the table may not equal the total due to rounding retail capex consisted of new stores and remodels in Asia of US$12.0 million, North America of US$8.1 million, Europe of US$8.6 million and Latin America of US$5.4 million. Capex on Product Development / R&D / Supply includes US$7.6 million on extension of our manufacturing facility in Hungary and US$2.6 million on product tooling and molds in Europe. US$5.5 million was spent on tooling and equipment for Speck in North America. In Asia US$4.6 million was spent towards a project to rebuild our warehouse and service-after-sales facility in China, that was started in 2015 and will complete in Information Services and Facilities includes US$1.7 million for hardware upgrades and ERP system enhancements capex includes US$7.9 million for five months of Tumi. Annual Tumi capex has historically run between US$30-45 million per year.
34 Outlook and Strategy for 2017 Increase in disposable incomes and living standards in developing countries, growing popularity of outdoor and adventure sports and growth of the tourism industry are all expected to drive growth of the global luggage market at a CAGR of 6.1% through 2021 (1). Continue to develop the Company into a well-diversified multi-brand, multi-category and multi-channel luggage, bag and accessories business. Leverage the Company's regional management structure, sourcing and distribution expertise and marketing engine to extend the strong Tumi brand into new markets and penetrate deeper into existing channels. Tactfully deploy multiple brands to operate at wider price points and broader consumer demographics in each category. Increase the proportion of sales from the Group's direct-to-consumer channel by growing direct-toconsumer e-commerce sales and through targeted expansion of its bricks-and-mortar retail presence. Continue to invest in the Group's core brands with sustained R&D spending to produce lighter and stronger new materials as well as exciting and innovative new products. Intend to increase our investment in marketing in 2017 to support the global expansion of Tumi and to continue to drive visibility for Samsonite, American Tourister and our other brands. Execute on market opportunities for recently acquired brands to further diversify the Group's product offering into non-travel. (1) Source: Global Luggage Market , Technavio, 2016 Page 34
2017 Interim Results
 2017 Interim Results Disclosure Statement Page 2 This presentation and the accompanying slides (the Presentation ) which have been prepared by Samsonite International S.A. ( Samsonite or the Company )
Disclosure Statement. Page 2
 Disclosure Statement This presentation and the accompanying slides (the Presentation ) which have been prepared by Samsonite International S.A. ( Samsonite or the Company ) do not constitute any offer
Disclosure Statement. Page 2
 Disclosure Statement Page 2 This presentation and the accompanying slides (the Presentation ) which have been prepared by Samsonite International S.A. ( Samsonite or the Company ) do not constitute any
Disclosure Statement. Page 2
 Disclosure Statement Page 2 This presentation and the accompanying slides (the Presentation ) which have been prepared by Samsonite International S.A. ( Samsonite or the Company ) do not constitute any
Disclosure Statement. Page 2
 Disclosure Statement Page 2 This presentation and the accompanying slides (the Presentation ) which have been prepared by Samsonite International S.A. ( Samsonite or the Company ) do not constitute any
2017 Third Quarter Results
 Samsonite International S.A. HKEX Stock Code: 1910 2017 Third Quarter Results November 13, 2017 Disclosure Statement Page 2 This presentation and the accompanying slides (the Presentation ) which have
Disclosure Statement. Page 2
 Disclosure Statement Page 2 This presentation and the accompanying slides (the Presentation ) which have been prepared by Samsonite International S.A. ( Samsonite or the Company ) do not constitute any
2018 First Quarter Results May 14, Samsonite International S.A. Stock Code 1910
 2018 First Quarter Results May 14, 2018 Samsonite International S.A. Stock Code 1910 Disclosure Statement Page 2 This presentation and the accompanying slides (the Presentation ) which have been prepared
SAMSONITE INTERNATIONAL S.A.
 Hong Kong Exchanges and Clearing Limited and The Stock Exchange of Hong Kong Limited take no responsibility for the contents of this announcement, make no representation as to its accuracy or completeness
Samsonite International S.A.
 Samsonite International S.A. 13 15 avenue de la Liberté, L-1931 Luxembourg R.C.S. Luxembourg: B 159.469 (Incorporated under the laws of Luxembourg with limited liability) Consolidated financial statements
Samsonite International S.A. Publishes 2017 Third Quarter Report
 Samsonite International S.A. Publishes 2017 Third Quarter Report Double-digit Constant Currency Net Sales Growth Reported Across All Regions for the Three Months Ended September 30, 2017 HONG KONG, November
(Incorporated in Luxembourg with limited liability) (Stock code: 1910)
 (Stock code: 1910)") (Incorporated in Luxembourg with limited liability) (Stock code: 1910) Samsonite International S.A. Announces 2014 Final Results Double-digit Revenue and EBITDA Growth for the Fifth Consecutive Year Net
(Incorporated in Luxembourg with limited liability) (Stock code: 1910) Samsonite International S.A. Announces 2014 Final Results Double-digit Revenue and EBITDA Growth for the Fifth Consecutive Year Net
Samsonite International S.A. Announces 2018 Annual Results Net Sales Hits New Record of US$3.8 Billion
 Samsonite International S.A. Announces 2018 Annual Results Net Sales Hits New Record of US$3.8 Billion HONG KONG, March 13, 2019 Samsonite International S.A. ( Samsonite or the Company, together with its
Samsonite International S.A Avenue de la Liberte, L-1931, Luxembourg RCS Luxembourg: B (Incorporated under the laws of Luxembourg with
 Samsonite International S.A. 13 15 Avenue de la Liberte, L-1931, Luxembourg RCS Luxembourg: B159469 (Incorporated under the laws of Luxembourg with limited liability) Consolidated financial statements
Samsonite International S.A. Announces 2013 Final Results Net sales top a record US$2 billion for the first time
 (Incorporated in Luxembourg with limited liability) (Stock code: 1910) Samsonite International S.A. Announces 2013 Final Results Net sales top a record US$2 billion for the first time Highlights Samsonite
Samsonite International S.A. Announces 2013 Interim Results
 Samsonite International S.A. Announces 2013 Interim Results Highlights Samsonite s net sales for the six months ended June 30, 2013 increased by 16.5% 1 to another record US$983.6 million with growth across
Interim Results. For the six months ended June 30, 2011
 Interim Results For the six months ended June 30, 2011 Agenda Business and Financial Highlights Business Overview Financial Overview Concluding Remarks 2 Business Highlights in 1H 2011 Significant sales
Samsonite International S.A Interim Report. * For identification purposes only
 Samsonite International S.A. 2013 Interim Report * For identification purposes only Stock Code 1910 Contents 02 Corporate Information 03 Corporate Profile and Strategy 04 Financial Highlights 06 Chairman
SAMSONITE INTERNATIONAL S.A.
 Hong Kong Exchanges and Clearing Limited and The Stock Exchange of Hong Kong Limited take no responsibility for the contents of this announcement, make no representation as to its accuracy or completeness
SAMSONITE INTERNATIONAL S.A.
 Hong Kong Exchanges and Clearing Limited and The Stock Exchange of Hong Kong Limited take no responsibility for the contents of this announcement, make no representation as to its accuracy or completeness
SAMSONITE INTERNATIONAL S.A.
 Hong Kong Exchanges and Clearing Limited and The Stock Exchange of Hong Kong Limited take no responsibility for the contents of this announcement, make no representation as to its accuracy or completeness
SAMSONITE INTERNATIONAL S.A.
 Hong Kong Exchanges and Clearing Limited and The Stock Exchange of Hong Kong Limited take no responsibility for the contents of this announcement, make no representation as to its accuracy or completeness
SAMSONITE INTERNATIONAL S.A.
 Hong Kong Exchanges and Clearing Limited and The Stock Exchange of Hong Kong Limited take no responsibility for the contents of this announcement, make no representation as to its accuracy or completeness
Investor Presentation. May 2015
 Investor Presentation May 2015 AGENDA 1 - Our markets, a significant opportunity 2 Cnova is built on two strong companies: Cdiscount and Cnova Brasil 3 - The development of marketplaces: a key element
CONTINUING CONNECTED TRANSACTIONS IN RELATION TO THE TAINWALA LEAVE AND LICENSE AGREEMENT
 Hong Kong Exchanges and Clearing Limited and The Stock Exchange of Hong Kong Limited take no responsibility for the contents of this announcement, make no representation as to its accuracy or completeness
CONTINUING CONNECTED TRANSACTIONS IN RELATION TO THE SAMSONITE CHINA FRAMEWORK AGREEMENT
 Hong Kong Exchanges and Clearing Limited and The Stock Exchange of Hong Kong Limited take no responsibility for the contents of this announcement, make no representation as to its accuracy or completeness
(Stock code: 1910) Operating profit increased by US$16.2 million, or 11.9%, year-on-year to US$152.3 million.
 Operating profit increased by US$16.2 million, or 11.9%, year-on-year to US$152.3 million.") Hong Kong Exchanges and Clearing Limited and The Stock Exchange of Hong Kong Limited take no responsibility for the contents of this announcement, make no representation as to its accuracy or completeness
Hong Kong Exchanges and Clearing Limited and The Stock Exchange of Hong Kong Limited take no responsibility for the contents of this announcement, make no representation as to its accuracy or completeness
COACH, INC. REPORTS FISCAL 2016 FIRST QUARTER RESULTS
 COACH, INC. REPORTS FISCAL 2016 FIRST QUARTER RESULTS First Quarter Net Sales Increased 3% Over Prior Year In Constant Currency; Down 1% On A Reported Basis First Quarter Non-GAAP Earnings Per Share was
FINAL RESULTS ANNOUNCEMENT FOR THE YEAR ENDED 31 MARCH 2010 FINANCIAL HIGHLIGHTS. Own stores number reached 764, increased by 11.
 Hong Kong Exchanges and Clearing Limited and The Stock Exchange of Hong Kong Limited take no responsibility for the contents of this announcement, make no representation as to its accuracy or completeness
1H 2018 Results Update Analyst Presentation
 1H 2018 Results Update Analyst Presentation July 31, 2018-6.00 PM CET Disclaimer This presentation contains forward-looking statements regarding future events and results of the Company that are based
ZEBRA TECHNOLOGIES FIRST QUARTER 2016 RESULTS May 10, 2016
 ZEBRA TECHNOLOGIES FIRST QUARTER 2016 RESULTS May 10, 2016 Anders Gustafsson Chief Executive Officer Mike Smiley Chief Financial Officer 2 Safe Harbor Statement Statements made in this presentation which
Samsonite International S.A. (Société Anonyme)
") Samsonite International S.A. (Société Anonyme) Annual accounts As at December 31, 2015 (with the report of the Réviseur d'entreprises Agréé thereon) Address of the registered office: 13 15, Avenue de la
Samsonite International S.A. (Société Anonyme) Annual accounts As at December 31, 2015 (with the report of the Réviseur d'entreprises Agréé thereon) Address of the registered office: 13 15, Avenue de la
ZEBRA TECHNOLOGIES SECOND-QUARTER 2016 RESULTS. August 9, 2016
 ZEBRA TECHNOLOGIES SECOND-QUARTER 2016 RESULTS August 9, 2016 Anders Gustafsson Chief Executive Officer Mike Smiley Chief Financial Officer 2 Safe Harbor Statement Statements made in this presentation
Final Results Announcement for the Year Ended December 31, 2011
 Hong Kong Exchanges and Clearing Limited and The Stock Exchange of Hong Kong Limited take no responsibility for the contents of this announcement, make no representation as to its accuracy or completeness
For the six months ended 30 September Change (million ) Net sales % Gross profit %
 Net sales % Gross profit %") Highlights For the six months ended 30 September 2016 2017 Change (million ) Net sales 551.7 548.2-0.6% Gross profit 453.4 453.9 +0.1% Gross profit margin 82.2% 82.8% +0.6 pp Operating profit 19.4 13.8-28.9%
Highlights For the six months ended 30 September 2016 2017 Change (million ) Net sales 551.7 548.2-0.6% Gross profit 453.4 453.9 +0.1% Gross profit margin 82.2% 82.8% +0.6 pp Operating profit 19.4 13.8-28.9%
ANNUAL RESULTS ANNOUNCEMENT FOR THE YEAR ENDED 31 MARCH 2012
 Hong Kong Exchanges and Clearing Limited and The Stock Exchange of Hong Kong Limited take no responsibility for the contents of this announcement, make no representation as to its accuracy or completeness
L OCCITANE EN PROVENCE EN PROVENCE. Final results. for the year ended 31 March 2011
 Final results for the year ended 31 March 2011 Agenda Results Highlights Strategic Review and Future Prospects 2 1. Results Highlights (million ) Net sales Operating profit Net profit 900 800 +26.1%, +
SAMSONITE INTERNATIONAL S.A. 新秀麗國際有限公司
 Hong Kong Exchanges and Clearing Limited and The Stock Exchange of Hong Kong Limited take no responsibility for the contents of this announcement, make no representation as to its accuracy or completeness
Interim results. for the half-year ended 30 September 2010
 Interim results for the half-year ended 30 September 2010 Agenda Results Highlights Strategic Review and Future Prospects 2 1. Results Highlights (million ) Net sales Operating profit Net profit 1 400
HY 2018 Results. Record EBITDA & free cash flow generation. August 3, 2018
 HY 2018 Results Record EBITDA & free cash flow generation August 3, 2018 Legal Disclaimer Information in this presentation may involve guidance, expectations, beliefs, plans, intentions or strategies regarding
HUGO BOSS confirms full-year sales and earnings forecast substantial progress made in implementing strategic realignment
 Quarterly Statement for Q2 2017 Metzingen, August 2, 2017 HUGO BOSS confirms full-year sales and earnings forecast substantial progress made in implementing strategic realignment Currency-adjusted sales
Quarterly Statement for Q Metzingen, November 2, HUGO BOSS increases pace of growth in own retail
 Quarterly Statement for Q3 2017 Metzingen, November 2, 2017 HUGO BOSS increases pace of growth in own retail Currency-adjusted sales up 3% in the third quarter Retail comp store sales up 5% EBITDA before
1H FY19 RESULTS PRESENTATION 25 February 2019
 RELIANCE WORLDWIDE CORPORATION LIMITED ACN 610855877 1H FY19 RESULTS PRESENTATION 25 February 2019 INVESTOR PRESENTATION 1H FY19 RESULTS PAGE 0 Important Notice This presentation contains general information
INTERIM RESULTS PRESENTATION Strong start to the year, with a strong order book for the second half of September 2017
 INTERIM RESULTS PRESENTATION Strong start to the year, with a strong order book for the second half of 2017 11 September 2017 AGENDA Introduction and highlights John Hornby Financial review David Main
Investor Meeting Presentation
 Investor Meeting Presentation November 2014 Investor Meeting Presentation HUGO BOSS November 2014 2 / 54 Agenda Update on Key Strategic Initiatives Nine Months Results 2014 Outlook Investor Meeting Presentation
Full Year 2018 Results. 27 February 2019
 Full Year 2018 Results 27 February 2019 1. Key Highlights and Financial Summary Strong financial performance across all segments and progress made on all aspects of the strategic framework Financial Highlights
July 26, 2017 LafargeHolcim Ltd 2015
 Second Quarter 2017 Results Beat Hess, Chairman and Interim CEO Roland Köhler, Interim COO and Regional Head of Europe, Australia/NZ & Trading Ron Wirahadiraksa, CFO July 26, 2017 LafargeHolcim Ltd 2015
Investor Meeting Presentation
 September 2015 HUGO BOSS September 2015 2 Agenda Financial Review First Half Year 2015 Strategic Outlook 2015 and beyond Financial Outlook 2015 HUGO BOSS September 2015 3 Agenda Financial Review First
Q Trading Update. May 4, 2016
 Q1 2016 Trading Update May 4, 2016 Forward looking statements This Presentation may include forward-looking statements. Forward-looking statements are statements regarding or based upon our management
B. Riley Investor Conference. May 23, 2018
 B. Riley Investor Conference May 23, 2018 About This Presentation Safe Harbor Statement This presentation includes forward-looking statements (statements which are not historical facts) within the meaning
Roadshow Scandinavia // equinet
 Roadshow Scandinavia // equinet HUGO BOSS Company Handout August 12-14, 2014 Dennis Weber, Head of Investor Relations Roadshow Scandinavia // equinet HUGO BOSS August 12-14, 2014 2 / 52 Agenda Half Year
EAST BALT BAKERIES July 2017 ACQUISITION
 EAST BALT BAKERIES July 2017 ACQUISITION E AST BA LT AT A G L A N C E Leading foodservice-focused company that supplies baked goods to Quick Service Restaurants ( QSR ) across the world Operates 21 bakeries
MONCLER S.P.A.: THE BOARD OF DIRECTORS APPROVES THE HALF-YEAR FINANCIAL REPORT AS OF 30 JUNE
 _ MONCLER S.P.A.: THE BOARD OF DIRECTORS APPROVES THE HALF-YEAR FINANCIAL REPORT AS OF 30 JUNE 2018 1 STRONG DOUBLE-DIGIT REVENUE GROWTH CONTINUED (+27% AT CONST. EXCH. RATES) WITH THE STRENGTHENING OF
IGG Inc. March Annual Results
 IGG Inc. March 2017 Annual Results Disclaimer This presentation and the accompanying slides (the Presentation ) which have been prepared by IGG INC (the Group ) do not constitute any offer or invitation
BAML Conference - Miami
 BAML Conference - Miami Francois Luscan, President & CEO Xavier Leclerc de Hauteclocque, CFO December 3, 2013 Forward Looking Statement This presentation may include forward-looking statements. Forward-looking
SAMSONITE TO ACQUIRE TUMI FOR US$26.75 PER SHARE TO CREATE A LEADING GLOBAL TRAVEL LIFESTYLE COMPANY
 (Incorporated in Luxembourg with limited liability) (Stock code: 1910) SAMSONITE TO ACQUIRE TUMI FOR US$26.75 PER SHARE TO CREATE A LEADING GLOBAL TRAVEL LIFESTYLE COMPANY Iconic Business and Travel Brand
AEGIS GROUP PLC 2008 ANNUAL RESULTS. 19 March 2009
 AEGIS GROUP PLC 2008 ANNUAL RESULTS 19 March 2009 AGENDA OVERVIEW OF RESULTS John Napier FINANCIAL REVIEW Alicja Lesniak OUTLOOK John Napier Q&A Aegis Group plc Page 2 OVERVIEW OF RESULTS John Napier,
Half Year Results Presentation. For the six months ended 30 June 2016
 Half Year Results Presentation For the six months ended 30 June 2016 Disclaimer By attending the meeting where this presentation is made, or by reading this document, you agree to be bound by the limitations
Electrocomponents plc ANNOUNCEMENT OF INTERIM RESULTS
 Electrocomponents plc ANNOUNCEMENT OF INTERIM RESULTS HALF YEAR ENDED 30 SEPTEMBER 2010 12 NOVEMBER 2010 DELIVERING FOR OUR CUSTOMERS Agenda Overview and current trading Ian Mason Financial performance
Press release 8 March RESULTS
 2011 RESULTS Slight growth in sales, supported by emerging markets Current Operating Income of 2.2bn Net income, Group share, down 14%, impacted by significant one off elements Net debt reduced by more
Assurant and The Warranty Group: Creating a Leading Global Lifestyle Provider
 Assurant and The Warranty Group: Creating a Leading Global Lifestyle Provider 1 Safe Harbor Statement Some of the statements included in this presentation, particularly those with respect to the proposed
INTERIM RESULTS PRESENTATION. August 2017, Hong Kong
 2017 INTERIM RESULTS PRESENTATION August 2017, Hong Kong Disclaimer THIS DOCUMENT DOES NOT CONSTITUTE AN OFFER OR INVITATION TO PURCHASE OR SUBSCRIBE FOR ANY SECURITIES AND NO PART OF IT SHALL FORM THE
FY 2017 Results Update Analyst Presentation
 FY 2017 Results Update Analyst Presentation March 8, 2018-6.00 PM CET Disclaimer This presentation contains forward-looking statements regarding future events and results of the Company that are based
Roadshow Zurich // MainFirst. HUGO BOSS Company Handout August 6, Roadshow Zurich // MainFirst HUGO BOSS August 7, / 52
 Roadshow Zurich // MainFirst HUGO BOSS Company Handout August 6, 2014 Roadshow Zurich // MainFirst HUGO BOSS August 7, 2014 2 / 52 Agenda Half Year Results 2014 Update on Key Strategic Initiatives Outlook
Financial Information
 Financial Information H1 revenues reached 12.8bn up 9.8%, flat org. in Q2 Adj. EBITA reached 1.6bn, up 6.4%, Adj. EBITA margin flat excl. Invensys in a challenging environment 2015 targets: Around flat
INTERIM MANAGEMENT STATEMENT QUARTER ENDED 31 MARCH 2012
 INTERIM MANAGEMENT STATEMENT QUARTER ENDED 31 MARCH 2012 12 April 2012 Financial summary Growth in net fees for the quarter ended 31 March 2012 (Q3) (versus the same period last year) Actual Growth LFL*
Roadshow London // Deutsche Bank
 Roadshow London // Deutsche Bank HUGO BOSS Company Handout August 6, 2014 Mark Langer (CFO) & Dennis Weber (Head of Investor Relations) Roadshow London // Deutsche Bank HUGO BOSS August 6, 2014 2 / 52
1H 2018 results. Milan, July 23, 2018
 Milan, July 23, 2018 FORWARD-LOOKING STATEMENT Certain statements in this investor presentation may constitute forward-looking statements as defined in the Private Securities Litigation Reform Act of 1995.
Interim results FOR THE six months ENDED 30 September 2011
 Interim results FOR THE six months ENDED 30 September 2011 1 2 1 FINANCIAL REVIEW Creative culture AND innovation SUSTAINING COMPETITIVE ADVANTAGE QUESTIONS 3 First half achievements RECORD FIRST HALF
Third Quarter 2017 Results Jan Jenisch, CEO Ron Wirahadiraksa, CFO. October 27, 2017 LafargeHolcim Ltd 2015
 Third Quarter 2017 Results Jan Jenisch, CEO Ron Wirahadiraksa, CFO October 27, 2017 LafargeHolcim Ltd 2015 01 Initial views Q3 2017 and Outlook Jan Jenisch, Chief Executive Officer 2017 LafargeHolcim 2
PTC PREPARED REMARKS FOURTH QUARTER AND FULL YEAR FISCAL 2017 OCTOBER 25, 2017
 PTC PREPARED REMARKS FOURTH QUARTER AND FULL YEAR FISCAL 2017 OCTOBER 25, 2017 Please refer to the Important Disclosures section of these prepared remarks for important information about our operating
For the year ended 31 March Change. Net sales 1, , % Net sales growth at constant FX rates +4.6%
 Highlights For the year ended 31 March 2017 2018 Change (million ) Net sales 1,323.2 1,319.4-0.3% Net sales growth at constant FX rates +4.6% Gross profit margin 83.3% 83.3% - Operating profit margin 12.7%
Q Results. Lars Brorsen (CEO) Christoph Hobo (CFO) November 22, 2018
 Christoph Hobo (CFO) November 22, 2018") Q3 2018 Results Lars Brorsen (CEO) Christoph Hobo (CFO) November 22, 2018 Agenda 1. Highlights Q3 2018 2. Market outlook 3. Detailed results review 4. Company outlook 5. Q&A Appendix 1 Business summary
Q3 2018 Results Lars Brorsen (CEO) Christoph Hobo (CFO) November 22, 2018 Agenda 1. Highlights Q3 2018 2. Market outlook 3. Detailed results review 4. Company outlook 5. Q&A Appendix 1 Business summary
Q2 & H1 FINANCIAL RESULTS. July
 Q2 & H FINANCIAL RESULTS July 29 205 Forward Looking Statements This Presentation may include forward-looking statements. Forward-looking statements are statements regarding or based upon our management
Axalta Coating Systems Ltd.
 Q1 2015 Conference Call May 6, 2015 Notice Regarding Forward Looking Statements, Non-GAAP Financial Measures and Defined Terms Forward-Looking Statements This presentation and the oral remarks made in
KION Q3 UPDATE CALL Gordon Riske, CEO Thomas Toepfer, CFO Wiesbaden, 14 November 2013
 KION Q3 UPDATE CALL 2013 Gordon Riske, CEO Thomas Toepfer, CFO Wiesbaden, 14 November 2013 AGENDA 1 Highlights 2013 Gordon Riske 2 Financial Update Thomas Toepfer 3 Outlook Gordon Riske 14 November 2013
INTERIM MANAGEMENT STATEMENT QUARTER ENDED 31 MARCH April 2013
 - INTERIM MANAGEMENT STATEMENT QUARTER ENDED 31 MARCH 2013 11 April 2013 Financial summary Growth in net fees for the quarter ended 31 March 2013 (Q3 FY13) (versus the same period last year) Growth Actual
FY 2014 Results Presentation March 5, 2015
 FY 2014 Results Presentation March 5, 2015 FY 2014 key facts Sales: Euro 824.2 million +9.3% (+10.1% constant FX) Directly Operated Stores Same Store Sales: +7.9% (vs -3.0% in FY 13) EBITDA: Euro 42.6
Q Results. Strong start in May 3, 2016
 Q1 2016 Results Strong start in 2016 May 3, 2016 Legal Disclaimer Information in this presentation may involve guidance, expectations, beliefs, plans, intentions or strategies regarding the future. These
Press Release HUGO BOSS First Half Year Results HUGO BOSS accelerates growth in second quarter of 2015
 Press Release HUGO BOSS First Half Year Results HUGO BOSS accelerates growth in second quarter of Sales rise by 16% in reporting currency and 7% currency-adjusted 6% increase in retail comp store sales
Roadshow Frankfurt // Kepler Cheuvreux
 Roadshow Frankfurt // Kepler Cheuvreux HUGO BOSS Company Handout August 5, 2014 Mark Langer (CFO) & Dennis Weber (Head of Investor Relations) Roadshow Frankfurt // Kepler Cheuvreux HUGO BOSS August 5,
McCormick & Company, Inc. 4th Quarter 2018 Financial Results and 2019 Outlook
 McCormick & Company, Inc. 4th Quarter 2018 Financial Results and 2019 Outlook January 24 th 2019 The following slides accompany a January 24 th 2019, earnings release conference call. This information
ROADSHOW Hong Kong // Credit Suisse
 ROADSHOW Hong Kong // Credit Suisse HUGO BOSS Company Handout Hong Kong, July 3, 2015 HUGO BOSS July 3, 2015 2 Agenda Financial Review First Quarter 2015 Strategic Outlook 2015 and beyond Financial Outlook
Investor Presentation. Domino s Pizza
 Investor Presentation Domino s Pizza July 2005 Forward-Looking Statements This presentation and our accompanying comments may contain forward-looking statements. These statements relate to future events
TELECONFERENCE PRESENTATION Q2 2012
 TELECONFERENCE PRESENTATION Q2 2012 7 August 2012 1 AGENDA AGENDA Important events in Q2 2012 Financial highlights Q&A 2 DISCLAIMER Certain statements in this presentation constitute forward-looking statements.
TELECONFERENCE Q FINANCIAL RESULTS
 TELECONFERENCE Q3 2013 FINANCIAL RESULTS 10:00 CET, 12 November 2013 1 AUGUST 2013 INVESTOR PRESENTATION AGENDA AGENDA Business highlights: Key developments in Q3 2013 Market development and sales-out
Picture area. HSBC Commercial Banking. Citibank Investor Presentation. Alan Keir Group Managing Director and Global Head, Commercial Banking
 Picture area HSBC Commercial Banking Citibank Investor Presentation Alan Keir Group Managing Director and Global Head, Commercial Banking March 2012 Forward-looking statements This presentation and subsequent
AXA. Henri de Castries. Chairman & CEO. London - October 2, Sanford C. Bernstein Strategic Decisions Conference
 AXA Henri de Castries Chairman & CEO London - October 2, 2013 Sanford C. Bernstein Strategic Decisions Conference Cautionary note concerning forward-looking statements Certain statements contained herein
Quarterly Statement for Q Metzingen, May 3, HUGO BOSS starts the year with higher sales and earnings
 Quarterly Statement for 2017 Metzingen, May 3, 2017 HUGO BOSS starts the year with higher sales and earnings Currency-adjusted sales growth of 1% in the first quarter Positive development in Europe and
TELECONFERENCE Q FINANCIAL RESULTS
 TELECONFERENCE FINANCIAL RESULTS 10:00 CET, 13 May 2014 1 AGENDA AGENDA Business highlights: Key developments in Market development and sales-out Performance of newly launched products Guidance 2014 Financial
Fourth Quarter 2015 Earnings Call
 Fourth Quarter 2015 Earnings Call February 25, 2016 Rob Wagman President & Chief Executive Officer Nick Zarcone Executive Vice President & Chief Financial Officer Joe Boutross Director, Investor Relations
Presentation 22 August 2018
 Presentation 22 August 2018 Exceeded 3YP targets in 2017, but 2018 is challenging due to continued destocking, store closures and bankruptcies Profit attributable to shareholders (like-for-like) down 19%
Elis 2017 annual results MARCH 7, 2018
 Elis 2017 annual results MARCH 7, 2018 Forward looking statements This document may contain information related to the Group s outlook. Such outlook is based on data, assumptions and estimates that the
H1 16 interim results. 22 September 2015
 H1 16 interim results 22 September 2015 Important notice 2 This presentation may include certain forward-looking statements, beliefs or opinions, including statements with respect to the Company s business,
Agenda. 1. Highlights FY 2012 Results. 2. Operational Performance Priorities for Financials. 5. Conclusion
 1MARCH 2013 Legal Disclaimer Information in this presentation may involve guidance, expectations, beliefs, plans, intentions or strategies regarding the future. These forward-looking statements involve
Ontex H1 2017: Very Strong Broad-Based Revenue Growth
 Ontex H1 2017: Very Strong Broad-Based Revenue Growth Reported revenue up 22%: LFL revenue growth in all 5 Divisions and 3 categories Including Ontex Brazil, Q2 revenue confirmed annualized run-rate of
Interim Results. IGG Inc August 2017
 Interim Results IGG Inc August 2017 Disclaimer This presentation and the accompanying slides (the Presentation ) do not constitute any offer or invitation to purchase or subscribe for any securities, and
HUGO BOSS First Nine Months Results 2011
 HUGO BOSS First Nine Months Results 2011 Mark Langer (CFO) November 2, 2011 Conference Call, First Nine Months Results 2011 HUGO BOSS November 2, 2011 2 / 30 AGENDA OPERATIONAL HIGHLIGHTS FIRST NINE MONTHS
ANSELL LIMITED Half Year Results to December Magnus Nicolin Chief Executive Officer Neil Salmon Chief Financial Officer
 ANSELL LIMITED Half Year Results to December 2014 Magnus Nicolin Chief Executive Officer Neil Salmon Chief Financial Officer Disclaimer The following presentation has been prepared by Ansell Limited for
Investor Presentation Q Results. 21 May 2015
 Investor Presentation 2015 Results 21 May 2015 1 Forward-looking statements This presentation contains forward-looking statements, including, but not limited to, the statements and expectations contained