Disclosure Statement. Page 2
|
|
|
- Hollie Mason
- 5 years ago
- Views:
Transcription
1
2 Disclosure Statement Page 2 This presentation and the accompanying slides (the Presentation ) which have been prepared by Samsonite International S.A. ( Samsonite or the Company ) do not constitute any offer or invitation to purchase or subscribe for any securities, and shall not form the basis for or be relied on in connection with any contract or binding commitment whatsoever. This Presentation has been prepared by the Company based on information and data which the Company considers reliable, but the Company makes no representation or warranty, express or implied, whatsoever, on the truth, accuracy, completeness, fairness and reasonableness of the contents of this Presentation. This Presentation may not be all-inclusive and may not contain all of the information that you may consider material. Any liability in respect of the contents of or any omission from this Presentation is expressly excluded. Certain matters discussed in this presentation may contain statements regarding the Company s market opportunity and business prospects that are individually and collectively forward-looking statements. Such forward-looking statements are not guarantees of future performance and are subject to known and unknown risks, uncertainties and assumptions that are difficult to predict. The Company s actual results, levels of activity, performance or achievements could differ materially and adversely from results expressed in or implied by this Presentation, including, amongst others: whether the Company can successfully penetrate new markets and the degree to which the Company gains traction in these new markets; the sustainability of recent growth rates; the anticipation of the growth of certain market segments; the positioning of the Company s products in those segments; the competitive environment; general market conditions and potential impacts on reported results of foreign currency fluctuations relative to the US Dollar. The Company is not responsible for any forward-looking statements and projections made by third parties included in this Presentation. Certain numbers in this Presentation have been rounded up or down. There may therefore be discrepancies between the actual totals of the individual amounts in the tables and the totals shown, between the numbers in the tables and the numbers given in the corresponding analyses in the text of this Presentation and between numbers in this Presentation and other publicly available documents. All percentages and key figures were calculated using the underlying data in whole US Dollars.
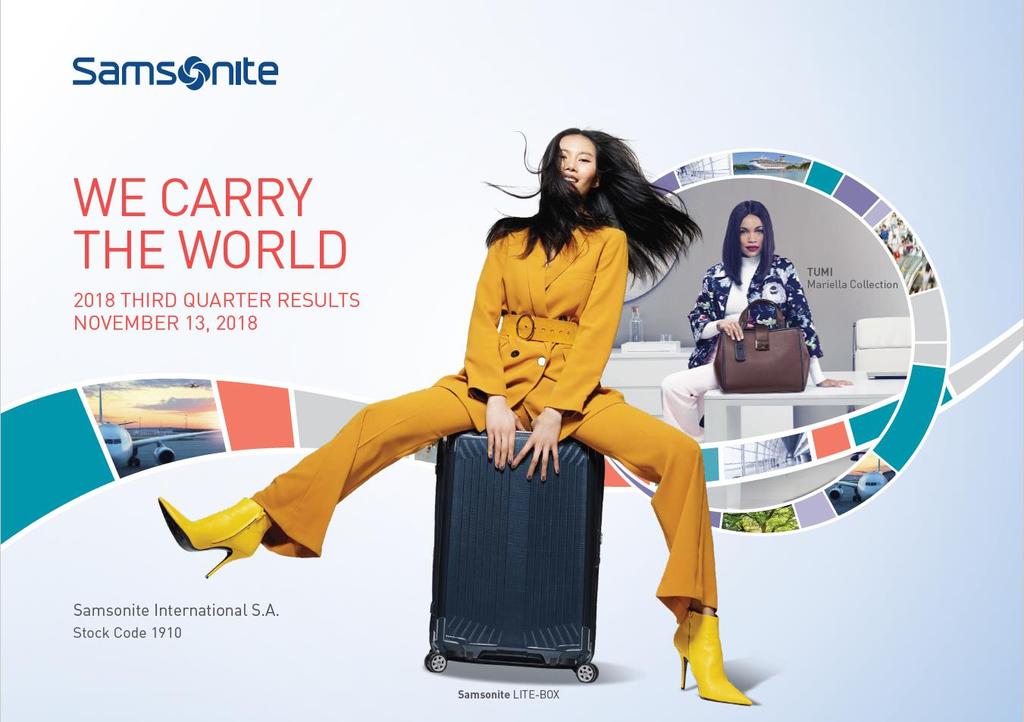
3 Page 3 3 rd Quarter 2018 Results
4 3 rd Quarter 2018 Results Highlights Page 4 Net sales growth of 5.2% (1) with net sales growth in Tumi brand of 10.3% (1) and net sales growth excluding Tumi brand of 4.0% (1). Net sales growth in the third quarter was tempered by slower growth in the US and challenging market conditions in China and South Korea. (1) Stated on a constant currency basis. Gross margin was up 30bp from 3Q 2017 largely due to a higher proportion of net sales coming from direct-to-consumer channels, particularly for the Tumi brand in Asia and Europe (Worldwide Tumi gross margin increased by over 400bp), partially offset by brand mix due to high net sales growth of American Tourister. Indicates % of net sales Adjusted EBITDA margin decreased by 110bp due largely to increased distribution expenses as a percentage of net sales related to targeted retail expansion and 10bp increase in advertising as a percentage of sales, partially offset by higher gross margin. Adjusted Net Income increased by US$15.7 million, or 23.9%, due mainly to lower stock compensation expense, interest expense and reduced effective tax rate.

5 3 rd Quarter Net Sales by Region Constant Currency Growth 7.2% 0.4% 10.0% 13.4% Page 5
6 3 rd Quarter Net Sales by Key Market (3) US$m $400 $349.0 $348.6 $ $300 $250 $200 $ % on a constant currency basis $100 $50 $78.7 $75.0 $57.8 $56.3 $48.4 $54.0 $41.4 $33.6 $37.7 $31.8 $30.8 $34.6 $30.2 $30.2 $23.8 $21.7 $23.3 $21.2 $19.6 $19.8 $13.5 $12.0 $0 (1) (2) (2) (2) (2) US China South Korea Japan Hong Kong India Belgium Germany UK Italy France Chile (2) USD Growth -0.1% -4.8% -2.7% 11.7% 23.2% 18.3% 12.2% 0.1% 12.2% 7.1% 0.8% -10.7% Constant Currency Growth -0.1% -3.2% -4.1% 12.5% 23.5% 28.6% 13.3% 1.3% 12.6% 8.2% 1.7% -9.0% Page 6 (1) Hong Kong includes net sales made in Macau and net sales to Tumi distributors in certain other Asian markets. (2) In integrating the Tumi business into the pre-existing European business, there have been changes made to the legal entity in which sales are being recorded, which has caused country growth rates to not be comparable, most notably in Germany and Belgium. From January 2017 through April 2017, net sales in Germany included all wholesale and e-commerce net sales of the Tumi brand for the European region. From May 2017 through December 2017, Tumi brand net sales through the wholesale channel in Europe were no longer accounted for in Germany but in Belgium. Beginning in January 2018 these sales were accounted for in the respective country of the customer. Unrelated to the Tumi integration, during 2018 non-tumi European e-commerce sales are being transitioned to be recorded in Belgium on a country by country basis. (3) The geographic location of the Group s net sales generally reflects the country/territory from which its products were sold and does not necessarily indicate the country/territory in which its end consumers were actually located.
7 Net sales growth of 5.2% (1) in Q despite a few challenged markets 3Q 2018 vs. 1H 2018 Net Sales Growth Rates (1) Total Asia: 1H +14.4%, 3Q +7.2% Excluding China and South Korea: 1H +19.8%, 3Q +15.7% (2) Excluding these three markets, net sales growth was 12.2% (1) for 3Q US excluding ebags: This is partly due to a decrease in Tumi brand wholesale sales reflecting our decision to discontinue sales to customers identified as trans-shippers. In addition, brick-and-mortar retail sales for both the Tumi and Samsonite brands have been affected by lower tourist arrivals causing reduced spending in certain US gateway markets. China: The slowdown in 3Q relates to weak consumer sentiment amid concerns about trade relations and a decrease in business-to-business orders. Excluding business-to-business orders for both periods, net sales in China increased by 4.1% (1) during the 3Q 2018 compared to the same period in the previous year. South Korea: The retail environment continues to be challenged due to lower Chinese tourism and weak consumer sentiment. Page 7 (1) Stated on a constant currency basis. (2) 1H 2017 US excluding ebags adjusted to exclude wholesale sales to ebags prior to the acquisition.
 in the 1 st half of 2018 due largely to the slowdown in China, South Korea and the US. Tumi net sales growth of 10.3% (1) with strong growth in Asia +27.7% (1) and Europe +14.")
8 3 rd Quarter Net Sales by Brand Constant Currency Growth Net Sales Growth by Brand 1.8% 10.3% 13.2% 1.3% (1) Stated on a constant currency basis. Samsonite net sales up 1.8% (1), which is down from 5.0% (1) in the 1 st half of 2018 due largely to the slowdown in China, South Korea and the US. Tumi net sales growth of 10.3% (1) with strong growth in Asia +27.7% (1) and Europe +14.2% (1), while the brand s growth in North America of 0.5% (1) reflects successful efforts to identify and discontinue sales to customers identified as trans-shippers. Excluding sales to transshippers, Tumi brand net sales in North America increased by 3.7% (1). American Tourister net sales up 13.2% (1) driven by all regions, with especially strong growth in Europe +42.3% (1). Other brand net sales increased by 1.3% (1) comprised of: Speck +10.3% (1) ; Kamiliant +32.4% (1) ; High Sierra +5.3% (1) ; Lipault +4.7% (1) ; Gregory -1.7% (1) ; Saxoline (Chile-only brand) -16.2% (1). Page 8
9 Page 9 YTD September 2018 Results


10 YTD September 2018 Results Highlights Constant currency net sales growth of 10.1% was driven partly by four additional months of ebags net sales of US$46.8 million (acquired in May 2017). Excluding the contribution from ebags, constant currency net sales growth was 8.5%. Gross margin was up 80bp from prior year reflecting an increase in Tumi brand gross margin of over 500bp and a higher proportion of net sales coming from the direct-to-consumer channel, partially offset by a shift in brand mix due to strong growth of American Tourister. Adjusted EBITDA increased by US$29.5 million. Adjusted EBITDA margin decreased by 70bp due partly to dilutive impact of ebags as well as higher distribution expenses as a percentage of net sales associated with targeted retail expansion, partly offset by higher gross margins. Adjusted Net Income increased by US$35.3 million due to higher Adjusted EBITDA as well as lower stock compensation expense, lower interest expense (excluding US$53.3 million writeoff of remaining deferred financing costs on the original senior credit facilities) and lower taxes. Page 10 Indicates % of net sales
11 YTD September Net Sales by Region Constant Currency Growth 7.9% 11.8% 10.8% 15.8% 3.6% excluding contribution from ebags Page 11
12 YTD September Net Sales by Key Market (3) 3.2% (4) excluding ebags (1) (2) (2) (2) (2) (2) Page 12 (1) Hong Kong includes net sales made in Macau and net sales to Tumi distributors in certain other Asian markets. (2) In integrating the Tumi business into the pre-existing European business, there have been changes made to the legal entity in which sales are being recorded, which has caused country growth rates to not be comparable, most notably in Germany and Belgium. From January 2017 through April 2017, net sales in Germany included all wholesale and e-commerce net sales of the Tumi brand for the European region. From May 2017 through December 2017, Tumi brand net sales through the wholesale channel in Europe were no longer accounted for in Germany but in Belgium. Beginning in January 2018 these sales were accounted for in the respective country of the customer. Unrelated to the Tumi integration, during 2018 non-tumi European e-commerce sales are being transitioned to be recorded in Belgium on a country by country basis. (3) The geographic location of the Group s net sales generally reflects the country/territory from which its products were sold and does not necessarily indicate the country/territory in which its end consumers were actually located. (4) YTD Sep 2017 adjusted to exclude wholesale sales to ebags prior to the acquisition.
 was driven by expansion in Asia +35.1% (1) and Europe +11.2% (1) as well as 5.5% (1) growth in North America. American Tourister net sales up 20.1% (1) with strong growth in Europe +46.")
13 YTD September Net Sales by Brand Net Sales Growth by Brand Samsonite net sales growth of 3.8% (1) with Europe +4.8% (1), Asia +3.1% (1), North America +2.3% (1) and Latin America +16.1% (1). Tumi net sales growth of 14.3% (1) was driven by expansion in Asia +35.1% (1) and Europe +11.2% (1) as well as 5.5% (1) growth in North America. American Tourister net sales up 20.1% (1) with strong growth in Europe +46.8% (1), Asia +12.6% (1), North America +12.6% (1) and Latin America +68.8% (1). Other brand net sales increased by 13.4% (1) mainly comprised of: Speck +6.7% (1) ; Gregory +3.7% (1) ; High Sierra +2.7% (1) ; Kamiliant +48.6% (1). Constant Currency Growth 3.8% 14.3% 20.1% 13.4% (1) Stated on a constant currency basis. Page 13

14 Continued progress in driving direct-toconsumer ( DTC ) sales growth DTC Net Sales Strong DTC net sales growth of 19.3% (1) (14.9% (1) excluding ebags). 34.7% of total Company net sales came from DTC channels in YTD September 2018 compared to 32.1% in YTD September Retail net sales growth of 12.8% (1) drove retail s proportion of total Company net sales from 25.1% in YTD September 2017 to 25.7% in YTD September DTC e-commerce, with net sales growth of 42.6% (1) (26.7% (1) excluding ebags), represented 9.0% of total Company net sales in YTD September 2018, up 200bp from 7.0% in YTD September Total e-commerce (2) net sales represented 14.5% of total Company net sales for the YTD September 2018 period, compared to 12.1% for the same period in (1) Stated on a constant currency basis. (2) Total e-commerce consists of DTC e-commerce, which is included in the DTC channel, and e-retailers, which is included in the wholesale channel. Page 14

15 Continued progress in driving sales growth in non-travel categories Net Sales by Category Non-travel category net sales growth of 13.2% (1) outpaced travel category net sales growth of 8.1% (1). Non-travel net sales represented 39.9% of total YTD September 2018 net sales, up 110bp from 38.8% of total YTD September 2017 net sales. Constant Currency Growth 8.1% 13.2% Page 15 (1) Stated on a constant currency basis.

16 YTD September Advertising by Region In addition to the regional advertising expenses, Corporate also had advertising expense of US$4.1 million related to the global American Tourister advertising campaign. Page 16 Indicates % of net sales
17 Balance Sheet US$m September 30, December 31, September 30, Cash and cash equivalents % Trade and other receivables, net % Inventories, net % Other current assets % Non-current assets 3, , ,561.6 (2.2) -0.1% Total Assets 4, , , % Current liabilities (excluding debt) (47.1) -5.3% Non-current liabilities (excluding debt) (128.2) -23.1% Total borrowings 1, , , % Total equity 1, , , % Total Liabilities and Equity 4, , , % Total Net Cash (Debt) (1) (1,682.7) (1,609.1) (1,629.0) % (1) Total Net Cash (Debt) excludes deferred financing costs, which are included in total borrowings. (2) The sum of the line items in the table may not equal the total due to rounding. $ C hg Sep-18 vs. Sep-17 % C hg Sep-18 vs. Sep-17 (3) Per the terms of the debt agreement, net leverage ratio is calculated as (total loans and borrowings total unrestricted cash)/ltm Adj. EBITDA. Cash flows from operations for the first nine months of 2018 were US$147.0 million, largely offset by outflows for capital expenditures of US$64.5 million and a US$110.0 million distribution to shareholders. Operating cash flow for the three months ended September 30, 2018 of US$90.9 million was up 22.4% compared to US$74.2 million for the three months ended September 30, Working capital as of September 30, 2018 was 14.7% of net sales, which is slightly above target of 14%, mainly due to lower payable days and slightly higher inventory days when compared to September 30, Proforma total net leverage ratio (1) of 2.67:1.00 at September 30, 2018 is down from 2.94:1.00 at September 30, 2017, with US$603.8 million of revolver availability at September 30, Page 17
18 Working Capital US$m September 30, September 30, Working Capital Items Inventories $ (1) $ $ % Trade and Other Receivables $ $ $ % Trade Payables $ $ $ (20.7) -3.9% Net Working Capital $ $ $ % % of Net Sales 12.5% 14.7% Turnover Days Inventory Days Trade and Other Receivables Days Trade Payables Days Net Working Capital Days $ Chg Sep-18 vs. Sep-17 % Chg Sep-18 vs. Sep-17 Net working capital as of September 30, 2018 was 14.7% of net sales, which was slightly above targeted 14% level. Inventory turnover of 148 days was up 8 days from September 30, This reflects an improvement from the half year where inventory days were 16 days higher than the prior year. Trade and other receivables turnover of 39 days was 3 days lower than prior year due to a higher proportion of sales through direct-toconsumer channels. Trade payables turnover of 115 days as of September 30, 2018 was 16 days lower than prior year due to reduction in inventory purchases as the business continues to manage down its stock levels. Inventory turnover days calculated as ending inventory balance divided by cost of sales for the period and multiplied by the number of days in the period. Trade and other receivables turnover days calculated as ending trade and other receivables balance divided by net sales for the period and multiplied by the number of days in the period. Trade payables turnover days calculated as ending trade payables balance divided by cost of sales for the period and multiplied by the number of days in the period. Net working capital efficiency (% of net sales) is calculated as net working capital divided by annualized net sales. Page 18
2017 Third Quarter Results
 Samsonite International S.A. HKEX Stock Code: 1910 2017 Third Quarter Results November 13, 2017 Disclosure Statement Page 2 This presentation and the accompanying slides (the Presentation ) which have
Disclosure Statement. Page 2
 Disclosure Statement This presentation and the accompanying slides (the Presentation ) which have been prepared by Samsonite International S.A. ( Samsonite or the Company ) do not constitute any offer
2018 First Quarter Results May 14, Samsonite International S.A. Stock Code 1910
 2018 First Quarter Results May 14, 2018 Samsonite International S.A. Stock Code 1910 Disclosure Statement Page 2 This presentation and the accompanying slides (the Presentation ) which have been prepared
Disclosure Statement. Page 2
 Disclosure Statement Page 2 This presentation and the accompanying slides (the Presentation ) which have been prepared by Samsonite International S.A. ( Samsonite or the Company ) do not constitute any
2017 Interim Results
 2017 Interim Results Disclosure Statement Page 2 This presentation and the accompanying slides (the Presentation ) which have been prepared by Samsonite International S.A. ( Samsonite or the Company )
Disclosure Statement. Page 2
 Disclosure Statement Page 2 This presentation and the accompanying slides (the Presentation ) which have been prepared by Samsonite International S.A. ( Samsonite or the Company ) do not constitute any
Disclosure Statement. Page 2
 Disclosure Statement Page 2 This presentation and the accompanying slides (the Presentation ) which have been prepared by Samsonite International S.A. ( Samsonite or the Company ) do not constitute any
Samsonite International S.A.
 Samsonite International S.A. 13 15 avenue de la Liberté, L-1931 Luxembourg R.C.S. Luxembourg: B 159.469 (Incorporated under the laws of Luxembourg with limited liability) Consolidated financial statements
Samsonite International S.A. Announces 2018 Annual Results Net Sales Hits New Record of US$3.8 Billion
 Samsonite International S.A. Announces 2018 Annual Results Net Sales Hits New Record of US$3.8 Billion HONG KONG, March 13, 2019 Samsonite International S.A. ( Samsonite or the Company, together with its
Disclosure Statement. Page 2
 Disclosure Statement Page 2 This presentation and the accompanying slides (the Presentation ) which have been prepared by Samsonite International S.A. ( Samsonite or the Company ) do not constitute any
SAMSONITE INTERNATIONAL S.A.
 Hong Kong Exchanges and Clearing Limited and The Stock Exchange of Hong Kong Limited take no responsibility for the contents of this announcement, make no representation as to its accuracy or completeness
Samsonite International S.A. Publishes 2017 Third Quarter Report
 Samsonite International S.A. Publishes 2017 Third Quarter Report Double-digit Constant Currency Net Sales Growth Reported Across All Regions for the Three Months Ended September 30, 2017 HONG KONG, November
Samsonite International S.A Avenue de la Liberte, L-1931, Luxembourg RCS Luxembourg: B (Incorporated under the laws of Luxembourg with
 Samsonite International S.A. 13 15 Avenue de la Liberte, L-1931, Luxembourg RCS Luxembourg: B159469 (Incorporated under the laws of Luxembourg with limited liability) Consolidated financial statements
(Incorporated in Luxembourg with limited liability) (Stock code: 1910)
 (Stock code: 1910)") (Incorporated in Luxembourg with limited liability) (Stock code: 1910) Samsonite International S.A. Announces 2014 Final Results Double-digit Revenue and EBITDA Growth for the Fifth Consecutive Year Net
(Incorporated in Luxembourg with limited liability) (Stock code: 1910) Samsonite International S.A. Announces 2014 Final Results Double-digit Revenue and EBITDA Growth for the Fifth Consecutive Year Net
SAMSONITE INTERNATIONAL S.A.
 Hong Kong Exchanges and Clearing Limited and The Stock Exchange of Hong Kong Limited take no responsibility for the contents of this announcement, make no representation as to its accuracy or completeness
Samsonite International S.A. Announces 2013 Interim Results
 Samsonite International S.A. Announces 2013 Interim Results Highlights Samsonite s net sales for the six months ended June 30, 2013 increased by 16.5% 1 to another record US$983.6 million with growth across
Interim Results. For the six months ended June 30, 2011
 Interim Results For the six months ended June 30, 2011 Agenda Business and Financial Highlights Business Overview Financial Overview Concluding Remarks 2 Business Highlights in 1H 2011 Significant sales
SAMSONITE INTERNATIONAL S.A.
 Hong Kong Exchanges and Clearing Limited and The Stock Exchange of Hong Kong Limited take no responsibility for the contents of this announcement, make no representation as to its accuracy or completeness
Samsonite International S.A Interim Report. * For identification purposes only
 Samsonite International S.A. 2013 Interim Report * For identification purposes only Stock Code 1910 Contents 02 Corporate Information 03 Corporate Profile and Strategy 04 Financial Highlights 06 Chairman
SAMSONITE INTERNATIONAL S.A.
 Hong Kong Exchanges and Clearing Limited and The Stock Exchange of Hong Kong Limited take no responsibility for the contents of this announcement, make no representation as to its accuracy or completeness
Samsonite International S.A. Announces 2013 Final Results Net sales top a record US$2 billion for the first time
 (Incorporated in Luxembourg with limited liability) (Stock code: 1910) Samsonite International S.A. Announces 2013 Final Results Net sales top a record US$2 billion for the first time Highlights Samsonite
FINAL RESULTS ANNOUNCEMENT FOR THE YEAR ENDED 31 MARCH 2010 FINANCIAL HIGHLIGHTS. Own stores number reached 764, increased by 11.
 Hong Kong Exchanges and Clearing Limited and The Stock Exchange of Hong Kong Limited take no responsibility for the contents of this announcement, make no representation as to its accuracy or completeness
SAMSONITE INTERNATIONAL S.A.
 Hong Kong Exchanges and Clearing Limited and The Stock Exchange of Hong Kong Limited take no responsibility for the contents of this announcement, make no representation as to its accuracy or completeness
1H 2018 Results Update Analyst Presentation
 1H 2018 Results Update Analyst Presentation July 31, 2018-6.00 PM CET Disclaimer This presentation contains forward-looking statements regarding future events and results of the Company that are based
CONTINUING CONNECTED TRANSACTIONS IN RELATION TO THE TAINWALA LEAVE AND LICENSE AGREEMENT
 Hong Kong Exchanges and Clearing Limited and The Stock Exchange of Hong Kong Limited take no responsibility for the contents of this announcement, make no representation as to its accuracy or completeness
Agenda. Company Overview Annual Financial Results. Business Review and Prospects
 Disclaimer This presentation and the accompanying slides (the Presentation ) which have been prepared by IGG INC (the Company ) do not constitute any offer or invitation to purchase or subscribe for any
CONTINUING CONNECTED TRANSACTIONS IN RELATION TO THE SAMSONITE CHINA FRAMEWORK AGREEMENT
 Hong Kong Exchanges and Clearing Limited and The Stock Exchange of Hong Kong Limited take no responsibility for the contents of this announcement, make no representation as to its accuracy or completeness
Quarterly Statement for Q Metzingen, November 2, HUGO BOSS increases pace of growth in own retail
 Quarterly Statement for Q3 2017 Metzingen, November 2, 2017 HUGO BOSS increases pace of growth in own retail Currency-adjusted sales up 3% in the third quarter Retail comp store sales up 5% EBITDA before
SAMSONITE INTERNATIONAL S.A.
 Hong Kong Exchanges and Clearing Limited and The Stock Exchange of Hong Kong Limited take no responsibility for the contents of this announcement, make no representation as to its accuracy or completeness
COACH, INC. REPORTS FISCAL 2016 FIRST QUARTER RESULTS
 COACH, INC. REPORTS FISCAL 2016 FIRST QUARTER RESULTS First Quarter Net Sales Increased 3% Over Prior Year In Constant Currency; Down 1% On A Reported Basis First Quarter Non-GAAP Earnings Per Share was
ANNUAL RESULTS ANNOUNCEMENT FOR THE YEAR ENDED 31 MARCH 2012
 Hong Kong Exchanges and Clearing Limited and The Stock Exchange of Hong Kong Limited take no responsibility for the contents of this announcement, make no representation as to its accuracy or completeness
Hudson Global Q Earnings Call
 Hudson Global Q3 2017 Earnings Call November 2, 2017 Page 1 Forward-Looking Statements Please be advised that except for historical information, the comments made during this presentation and in these
Quarterly Statement for Q Metzingen, November 6, 2018
 Quarterly Statement for Q3 2018 Metzingen, November 6, 2018 HUGO BOSS records solid sales growth in the third quarter Full-year sales and earnings guidance confirmed Currency-adjusted sales up 1% in the
IGG Inc. March Annual Results
 IGG Inc. March 2017 Annual Results Disclaimer This presentation and the accompanying slides (the Presentation ) which have been prepared by IGG INC (the Group ) do not constitute any offer or invitation
Accelerating Performance IN THE HUMAN AGE
 Accelerating Performance IN THE HUMAN AGE Second Quarter Results July 20, 2018 FORWARD-LOOKING STATEMENT This presentation contains statements, including financial projections, that are forward-looking
Q EARNINGS CALL FEBRUARY 20, 2018
 Q4 2017 EARNINGS CALL FEBRUARY 20, 2018 1 IMPORTANT INFORMATION Forward Looking Statements These slides contain (and the accompanying oral discussion will contain) forward looking statements. All statements
HUGO BOSS First Nine Months Results 2011
 HUGO BOSS First Nine Months Results 2011 Mark Langer (CFO) November 2, 2011 Conference Call, First Nine Months Results 2011 HUGO BOSS November 2, 2011 2 / 30 AGENDA OPERATIONAL HIGHLIGHTS FIRST NINE MONTHS
Q3 and 9M 2018 Trading Update
 Q3 and 9M 2018 Trading Update DISCLAIMER This presentation may contain forward looking statements based on current expectations and projects of the Group in relation to future events. Due to their specific
Interim results. for the half-year ended 30 September 2010
 Interim results for the half-year ended 30 September 2010 Agenda Results Highlights Strategic Review and Future Prospects 2 1. Results Highlights (million ) Net sales Operating profit Net profit 1 400
L OCCITANE EN PROVENCE EN PROVENCE. Final results. for the year ended 31 March 2011
 Final results for the year ended 31 March 2011 Agenda Results Highlights Strategic Review and Future Prospects 2 1. Results Highlights (million ) Net sales Operating profit Net profit 900 800 +26.1%, +
Results of first nine months of 2012 are approved: Ebitda 12.4%; Ebit 10.3%. Sales down slightly (3.6%).
.") PRESS RELEASE Results of first nine months of 2012 are approved: Ebitda 12.4%; Ebit 10.3%. Sales down slightly (3.6%). Net sales: 162.5 million ( 168.6 million for first nine months of 2011, -3.6%). At
PRESS RELEASE Results of first nine months of 2012 are approved: Ebitda 12.4%; Ebit 10.3%. Sales down slightly (3.6%). Net sales: 162.5 million ( 168.6 million for first nine months of 2011, -3.6%). At
RECORD RESULTS FOR 2004 REFLECT STRONG ORGANIC GROWTH SOLID GROWTH ANTICIPATED IN 2005
 RECORD RESULTS FOR 2004 REFLECT STRONG ORGANIC GROWTH SOLID GROWTH ANTICIPATED IN 2005 Revenues up 5.7% to 1,631.4 million, organic revenues up 6.2% EBITDA rises 11.6% to 465.2 million Operating income
Eng US. 14 July 2017
 Eng US 14 July 2017 Presentation 2017 Eng US Disclaimer This presentation has been prepared by Duni AB (the Company ) solely for use at this investor presentation and is furnished to you solely for your
Presentation 22 August 2018
 Presentation 22 August 2018 Exceeded 3YP targets in 2017, but 2018 is challenging due to continued destocking, store closures and bankruptcies Profit attributable to shareholders (like-for-like) down 19%
COACH, INC. REPORTS FISCAL 2017 SECOND QUARTER RESULTS; DRIVES DOUBLE-DIGIT EARNINGS GROWTH
 COACH, INC. REPORTS FISCAL 2017 SECOND QUARTER RESULTS; DRIVES DOUBLE-DIGIT EARNINGS GROWTH Second Quarter Net Sales Increased 4% Over Prior Year Despite North America Wholesale Strategic Repositioning
FY 2017 Results Update Analyst Presentation
 FY 2017 Results Update Analyst Presentation March 8, 2018-6.00 PM CET Disclaimer This presentation contains forward-looking statements regarding future events and results of the Company that are based
TIFFANY & CO. NEWS RELEASE
 TIFFANY & CO. NEWS RELEASE Fifth Avenue & 57 th Street New York, N.Y. 10022 Contact: Mark L. Aaron 212-230-5301 mark.aaron@tiffany.com TIFFANY REPORTS THIRD QUARTER RESULTS; MANAGEMENT REVISES EARNINGS
Full Year 2018 Results. 27 February 2019
 Full Year 2018 Results 27 February 2019 1. Key Highlights and Financial Summary Strong financial performance across all segments and progress made on all aspects of the strategic framework Financial Highlights
PRESS RELEASE AXA CONSOLIDATED REVENUES UP 5.3% ON A COMPARABLE BASIS TO EURO 56.9 BILLION FOR THE FIRST NINE-MONTHS OF 2002
 PRESS RELEASE November 12, 2002 AXA CONSOLIDATED REVENUES UP 5.3% ON A COMPARABLE BASIS TO EURO 56.9 BILLION FOR THE FIRST NINE-MONTHS OF 2002 Life & Savings revenues, which represent 64% of total revenues,
Q EARNINGS CALL
 Tom Goeke Chief Executive Officer Q2 2017 EARNINGS CALL JULY 27, 2017 IMPORTANT INFORMATION Forward Looking Statements These slides contain (and the accompanying oral discussion will contain) forward looking
Financial Information
 Accelerating & profit in H1: Revenue up +4% reported, Adj. EBITA +8%, Net Income +18%, FCF +15% H1 revenue of 12.2bn, +2.7% organic, +4.1% outside Infrastructure H1 adj. EBITA margin up 60bps 1 org., to
Annual Results. IGG Inc March 2018
 Annual Results IGG Inc March 2018 Disclaimer This presentation and the accompanying slides (the Presentation ) do not constitute any offer or invitation to purchase or subscribe for any securities, and
Quarterly Statement for Q Metzingen, May 3, HUGO BOSS starts the year with higher sales and earnings
 Quarterly Statement for 2017 Metzingen, May 3, 2017 HUGO BOSS starts the year with higher sales and earnings Currency-adjusted sales growth of 1% in the first quarter Positive development in Europe and
9M 2017 Results Update Analyst Presentation
 9M 2017 Results Update Analyst Presentation November 14, 2017-6.00 PM CET Disclaimer This presentation contains forward-looking statements regarding future events and results of the Company that are based
TELECONFERENCE FY 2014 FINANCIAL RESULTS
 TELECONFERENCE FY 2014 FINANCIAL RESULTS 10:00 CET, 17 February 2015 1 DISCLAIMER Certain statements in this presentation constitute forward-looking statements. Forward-looking statements are statements
1H 2018 results. Milan, July 23, 2018
 Milan, July 23, 2018 FORWARD-LOOKING STATEMENT Certain statements in this investor presentation may constitute forward-looking statements as defined in the Private Securities Litigation Reform Act of 1995.
Quarterly Statement for Q Metzingen, May 2, gets off to a successful start for HUGO BOSS
 Quarterly Statement for 2018 Metzingen, May 2, 2018 2018 gets off to a successful start for HUGO BOSS Currency-adjusted Group sales up 5% in the first quarter Retail comp store sales up 7% Online business
Market Bulletin. China: Still sneezing hard. January 20, 2016 MARKET INSIGHTS. In brief
 MARKET INSIGHTS Market Bulletin January 20, 2016 China: Still sneezing hard In brief Slower 4Q15 GDP growth and soft December data add to concerns about China s economic health. On a more encouraging note,
Results Presentation November 2015
 Results Presentation November 2015 Safe Harbor This presentation and the accompanying slides (the Presentation ), which have been prepared by Balkrishna Industries Limited (the Company ), have been prepared
Folli Follie Group Financial Results 9M November 27, 2008
 Folli Follie Group Financial Results 9M 2008 November 27, 2008 FF Group 9M Financials Amounts in million Total Sales 678,4 % of sales EBITDA 151,3 22,3% EBIT 136,8 20,2% EBT 107,6 15,9% EAT after min.
Third Quarter 2017 Results Jan Jenisch, CEO Ron Wirahadiraksa, CFO. October 27, 2017 LafargeHolcim Ltd 2015
 Third Quarter 2017 Results Jan Jenisch, CEO Ron Wirahadiraksa, CFO October 27, 2017 LafargeHolcim Ltd 2015 01 Initial views Q3 2017 and Outlook Jan Jenisch, Chief Executive Officer 2017 LafargeHolcim 2
Gerresheimer Capital Markets Day: Update on financial performance. October 23+24, Hans-Jürgen Wiecha, CFO
 Gerresheimer Capital Markets Day: Update on financial performance October 23+24, 2008 Hans-Jürgen Wiecha, CFO 0 Disclaimer This presentation may contain certain forward-looking statements, including assumptions,
Mattel, Inc. Earnings Conference Call Fourth Quarter 2017 (Unaudited Results)
") Mattel, Inc. Earnings Conference Call Fourth Quarter 2017 (Unaudited Results) FEBRUARY 1, 2018 MARGARET GEORGIADIS CHIEF EXECUTIVE OFFICER JOE EUTENEUER CHIEF FINANCIAL OFFICER FORWARD-LOOKING STATEMENTS:
Mattel, Inc. Earnings Conference Call Fourth Quarter 2017 (Unaudited Results) FEBRUARY 1, 2018 MARGARET GEORGIADIS CHIEF EXECUTIVE OFFICER JOE EUTENEUER CHIEF FINANCIAL OFFICER FORWARD-LOOKING STATEMENTS:
Interim results FOR THE six months ENDED 30 September 2011
 Interim results FOR THE six months ENDED 30 September 2011 1 2 1 FINANCIAL REVIEW Creative culture AND innovation SUSTAINING COMPETITIVE ADVANTAGE QUESTIONS 3 First half achievements RECORD FIRST HALF
Interim Results. IGG Inc August 2017
 Interim Results IGG Inc August 2017 Disclaimer This presentation and the accompanying slides (the Presentation ) do not constitute any offer or invitation to purchase or subscribe for any securities, and
(Stock code: 1910) Operating profit increased by US$16.2 million, or 11.9%, year-on-year to US$152.3 million.
 Operating profit increased by US$16.2 million, or 11.9%, year-on-year to US$152.3 million.") Hong Kong Exchanges and Clearing Limited and The Stock Exchange of Hong Kong Limited take no responsibility for the contents of this announcement, make no representation as to its accuracy or completeness
Hong Kong Exchanges and Clearing Limited and The Stock Exchange of Hong Kong Limited take no responsibility for the contents of this announcement, make no representation as to its accuracy or completeness
TELECONFERENCE PRESENTATION Q1 2012
 TELECONFERENCE PRESENTATION Q1 2012 8 May 2012 1 AGENDA AGENDA Important events in Q1 2012 Stock balancing campaign Realigned price architecture and product range Financial highlights Q&A 2 DISCLAIMER
2018 Half Year Results
 A GLOBAL LEADER IN METAL FLOW ENGINEERING 2018 Half Year Results 26 July 2018 Patrick André Chief Executive 1 Disclaimer This presentation, which has been prepared by Vesuvius plc (the Company ), includes
Agenda. Company Overview Interim Financial Results. Business Review and Prospects
 Disclaimer This presentation and the accompanying slides (the Presentation ) which have been prepared by IGG INC (the Company ) do not constitute any offer or invitation to purchase or subscribe for any
Roadshow Zurich // MainFirst. HUGO BOSS Company Handout August 6, Roadshow Zurich // MainFirst HUGO BOSS August 7, / 52
 Roadshow Zurich // MainFirst HUGO BOSS Company Handout August 6, 2014 Roadshow Zurich // MainFirst HUGO BOSS August 7, 2014 2 / 52 Agenda Half Year Results 2014 Update on Key Strategic Initiatives Outlook
Roadshow Scandinavia // equinet
 Roadshow Scandinavia // equinet HUGO BOSS Company Handout August 12-14, 2014 Dennis Weber, Head of Investor Relations Roadshow Scandinavia // equinet HUGO BOSS August 12-14, 2014 2 / 52 Agenda Half Year
Roadshow London // Deutsche Bank
 Roadshow London // Deutsche Bank HUGO BOSS Company Handout August 6, 2014 Mark Langer (CFO) & Dennis Weber (Head of Investor Relations) Roadshow London // Deutsche Bank HUGO BOSS August 6, 2014 2 / 52
Presentation of 9M 2015 Results Massimo Zanetti Beverage Group. Villorba, 13 rd of November, 2015
 Presentation of 9M 2015 Results Massimo Zanetti Beverage Group Villorba, 13 rd of November, 2015 2015 Highlights and Strategic Drivers IPO 1 st trading day: 3 rd of June, 2015 Intesa Sanpaolo Loan repayment
TELECONFERENCE Q2 2018
 TELECONFERENCE Q2 2018 Copenhagen, 9 August 2018 1 Disclaimer Certain statements in this presentation constitute forwardlooking statements. Forward-looking statements are statements (other than statements
Herbalife Ltd. Announces Third-Quarter Net Sales of $529.5 Million and Record Net Income of $48.3 Million
 Herbalife Ltd. Announces Third-Quarter Net Sales of $529.5 Million and Record Net Income of $48.3 Million LOS ANGELES, Nov 06, 2007 (BUSINESS WIRE) -- Herbalife Ltd. (NYSE:HLF) today reported third quarter
JOHNSON ELECTRIC HOLDINGS LIMITED FY2011/12 Interim Results
 JOHNSON ELECTRIC HOLDINGS LIMITED FY2011/12 Interim Results Jan 2012 Page 1 Group Overview Key Financial Highlights Operational Results Outlook Appendix Page 2 JOHNSON ELECTRIC GROUP OVERVIEW Johnson Electric
Roadshow Frankfurt // Kepler Cheuvreux
 Roadshow Frankfurt // Kepler Cheuvreux HUGO BOSS Company Handout August 5, 2014 Mark Langer (CFO) & Dennis Weber (Head of Investor Relations) Roadshow Frankfurt // Kepler Cheuvreux HUGO BOSS August 5,
Strategic Divestment of Product Verticals. December 14, 2017
 Strategic Divestment of Product Verticals December 14, 2017 Disclaimer Important notice The information contained in this presentation is intended solely for your information. Such information is subject
ECONOMIC PROSPECTS FOR HONG KONG IN Win Lin Chou, ACE Centre for Business and Economic Research, Hong Kong
 ECONOMIC PROSPECTS FOR HONG KONG IN 2016-17 Win Lin Chou, ACE Centre for Business and Economic Research, Hong Kong I. The Current Trends Real gross domestic product (GDP) in Hong Kong increased 1.7 percent
Quarterly Meeting # 2/2015
 Quarterly Meeting # 2/2015 1Q15 Performance & Outlook 18 May 2015 The views expressed here contain some information derived from publicly available sources that have not been independently verified. No
Final Results Announcement for the Year Ended December 31, 2011
 Hong Kong Exchanges and Clearing Limited and The Stock Exchange of Hong Kong Limited take no responsibility for the contents of this announcement, make no representation as to its accuracy or completeness
FY 2012 Results. March 12 th, 2013
 FY 2012 Results March 12 th, 2013 Fiscal Year 2012 Results Highlights FY 2012 results showing top line growth and profitability increase*, in line with company expectations Net Revenues up 15.1% to 279.3mln
HUGO BOSS confirms full-year sales and earnings forecast substantial progress made in implementing strategic realignment
 Quarterly Statement for Q2 2017 Metzingen, August 2, 2017 HUGO BOSS confirms full-year sales and earnings forecast substantial progress made in implementing strategic realignment Currency-adjusted sales
Financial Information
 Financial Information H1 revenues reached 12.8bn up 9.8%, flat org. in Q2 Adj. EBITA reached 1.6bn, up 6.4%, Adj. EBITA margin flat excl. Invensys in a challenging environment 2015 targets: Around flat
POSITIVE START TO THE YEAR AND STRONG BEYOND AIR REVENUE GROWTH
 Travelport Worldwide Limited Reports First Quarter 2016 Results POSITIVE START TO THE YEAR AND STRONG BEYOND AIR REVENUE GROWTH LANGLEY, U.K., May 5, 2016 Travelport Worldwide Limited (NYSE: TVPT) announces
EAST BALT BAKERIES July 2017 ACQUISITION
 EAST BALT BAKERIES July 2017 ACQUISITION E AST BA LT AT A G L A N C E Leading foodservice-focused company that supplies baked goods to Quick Service Restaurants ( QSR ) across the world Operates 21 bakeries
Amadeus Jan - Sep 2014 Results
 Amadeus Jan - Sep 2014 Results November 6, 2014 Disclaimer This presentation may contain certain statements which are not purely historical facts, including statements about anticipated or expected future
CONTENTS. Corporate Information 2. Financial Highlights 4. Chairman s Statement 6. Independent Review Report 30. Consolidated Balance Sheets 33
 CONTENTS Corporate Information 2 Financial Highlights 4 Chairman s Statement 6 Management Discussion and Analysis 8 Independent Review Report 30 Interim Consolidated Statements of Income 31 Interim Consolidated
Q1 Presentation April, 2011
 Q1 Presentation 2011 28 April, 2011 Disclaimer This presentation has been prepared by Duni AB (the Company ) solely for use at this investor presentation and is furnished to you solely for your information
Eng US. Q1 Presentation April, 2015
 Eng US Presentation 2015 24 April, 2015 Eng US Disclaimer This presentation has been prepared by Duni AB (the Company ) solely for use at this investor presentation and is furnished to you solely for your
SAMSONITE INTERNATIONAL S.A. 新秀麗國際有限公司
 Hong Kong Exchanges and Clearing Limited and The Stock Exchange of Hong Kong Limited take no responsibility for the contents of this announcement, make no representation as to its accuracy or completeness
Fourth Quarter 2018 Performance and Business Update. February 6, 2019
 Fourth Quarter 2018 Performance and Business Update February 6, 2019 1 Important Notice Please read this management presentation together with the Company s press release issued earlier today announcing
TELECONFERENCE PRESENTATION Q2 2012
 TELECONFERENCE PRESENTATION Q2 2012 7 August 2012 1 AGENDA AGENDA Important events in Q2 2012 Financial highlights Q&A 2 DISCLAIMER Certain statements in this presentation constitute forward-looking statements.
Third Quarter Results 2018
 Third Quarter Results 2018 Metzingen November 6, 2018 Christian Stöhr, Head of Investor Relations Third Quarter Results 2018 Metzingen November 6, 2018 Yves Müller, Chief Financial Officer 1 I OPERATIONAL
Investment Theme 3Q18. Ageing Population. Source: AFP Photo
 Investment Theme 3Q18 Ageing Population Source: AFP Photo 91 Investment Theme III: Ageing Population Jason Low, CFA Strategist The global population is growing older and people are living longer. Demographics
Corporat Q1FY18 e Presen R ta esul ti t on Presentation May August
 August May 2017 Corporate Q1FY18 Presentation Result Presentation Safe Harbor 2 This presentation and the accompanying slides (the Presentation ), which has been prepared by Shankara Building Products
901 S. Central Expressway, Richardson, TX 75080
 901 S. Central Expressway, Richardson, TX 75080 FOSSIL GROUP REPORTS THIRD QUARTER RESULTS Net Sales Increase 18% to $810 Million Diluted EPS Increases 25% to $1.58 Maintains Full Year EPS Guidance and
TELECONFERENCE Q FINANCIAL RESULTS
 TELECONFERENCE FINANCIAL RESULTS 10:00 CET, 11 November 2014 1 12 AUGUST 2014 AGENDA AGENDA Business highlights: Key developments in Market development and sales-out Performance of newly launched products
HUGO BOSS First Half Year Results 2014
 HUGO BOSS First Half Year Results 2014 Claus-Dietrich Lahrs (CEO), Mark Langer (CFO) Metzingen, July 31, 2014 Conference Call, First Half Year Results 2014 HUGO BOSS July 31, 2014 2 / 42 Agenda Half Year
1Q 14 Results. May 12 th, 2014
 Results May 12 th, 2014 First Quarter 2014 - Highlights Results in line with the Group s sustainable approach, gracious growth and healthy profitability, thus laying the foundations for long-term development