SABMiller plc. Full year results Twelve months ended 31 March Jamie Wilson, Chief Financial Officer Gary Leibowitz, SVP, Investor Relations
|
|
|
- Lindsey Tyler
- 5 years ago
- Views:
Transcription
1 SABMiller plc Full year results Twelve months ended 31 March 2012 Jamie Wilson, Chief Financial Officer Gary Leibowitz, SVP, Investor Relations 24 May 2012
2 Forward looking statements This presentation includes forward-looking statements with respect to certain of SABMiller plc s plans, current goals and expectations relating to its future financial condition, performance and results. These statements contain the words anticipate, believe, intend, estimate, expect and words of similar meaning. All statements other than statements of historical facts included in this presentation, including, without limitation, those regarding the Company s financial position, business strategy, plans and objectives of management for future operations (including development plans and objectives relating to the Company s products and services) are forward-looking statements. Such forward-looking statements involve known and unknown risks, uncertainties and other important factors that could cause the actual results, performance or achievements of the Company to be materially different from future results, performance or achievements expressed or implied by such forward-looking statements. Such forward-looking statements are based on numerous assumptions regarding the Company s present and future business strategies and the environment in which the Company will operate in the future. These forward-looking statements speak only as at the date of this document. The Company expressly disclaims any obligation or undertaking to disseminate any updates or revisions to any forward-looking statements contained herein to reflect any change in the Company s expectations with regard thereto or any change in events, conditions or circumstances on which any such statement is based. The past business and financial performance of SABMiller plc is not to be relied on as an indication of its future performance. All references to EBITA in this presentation refer to earnings before interest, tax, amortisation of intangible assets (excluding software) and exceptional items. EBITA also includes the group s share of associates and joint ventures EBITA on the same basis. All references to organic mean as adjusted to exclude the impact of acquisitions and disposals, while all references to constant currency mean as adjusted to exclude the impact of movements in foreign currency exchange rates in the translation of our results. References to underlying mean in organic, constant currency.

3 Overview Strong operating results and robust 12% adjusted eps growth (US$) Revenue growth focus, while delivering cost and production efficiencies Developing market consumption healthy, muted economic recovery in developed markets 1 On an organic, constant currency basis 3


4 Overview EFES Recent transactions further enhance our global footprint Foster s: application of proven turnaround skills Efes: strengthened position in Russia, access to wider regional growth Castel: strengthened strategic alliance Business Capability Programme benefits ahead of expectations 4


5 Divisional highlights: Latin America Robust volume growth across the region Double digit growth in premium and upper mainstream Successful brand extensions Broader package range, affordability emphasis Roll out of new malt brands: Maltizz and ActiMalta Improving direct sales penetration and service Ongoing cost control Improved manufacturing usages & efficiencies Continued distribution productivity Fixed cost productivity driving brand investment Double digit EBITA growth and ongoing margin expansion Lager volumes* +8% Group revenue* +10% EBITA* +14% EBITA margin%* +70 bps * Organic volume, and organic, constant currency growth, respectively for financial metrics, vs. prior year 5


6 Divisional highlights: North America Revenue management offsetting continued softness among key beer drinkers SKU management to enhance system profitability Premium lights still under pressure and their recovery key to beer category growth Capability investments increasing category captainships From 24% to 35% ** of key account volumes Tenth & Blake outpacing growth in crafts and imports The largest craft supplier in the USA. Blue Moon and Leinenkugel s growing double digits with new seasonals Peroni Nastro Azzurro accelerating Strong innovation pipeline Lager volumes* -2% Group revenue* flat EBITA* +2% EBITA margin%* +20 bps * Organic volume, and organic, constant currency growth, respectively for financial metrics, vs. prior year **growth in last 3 years 6


7 Divisional highlights: North America Revenue management offsetting continued softness among key beer drinkers SKU management to enhance system profitability Premium lights still under pressure and their recovery key to beer category growth Capability investments increasing category captainships From 24% to 35% ** of key account volumes Tenth & Blake outpacing growth in crafts and imports The largest craft supplier in the USA. Blue Moon and Leinenkugel s growing double digits with new seasonals Peroni Nastro Azzurro accelerating Strong innovation pipeline Lager volumes* -2% Group revenue* flat EBITA* +2% EBITA margin%* +20 bps * Organic volume, and organic, constant currency growth, respectively for financial metrics, vs. prior year **growth n last 3 years 7

8 Divisional highlights: Europe Slow economic improvement, spending still soft Reduction in regional profit pool Orientation towards economy segment Continued shift to modern trade at lower margins Maintaining leading brand equities, with price adjustments where appropriate Upgrading the category by driving differentiation through innovation Significant profit growth in smaller markets Designing for scale benefits and cost advantage Regional manufacturing Productivity gains Lager volumes* -1% Group revenue* flat EBITA* -9% EBITA margin%* -160 bps * Organic volume, and organic, constant currency growth, respectively for financial metrics, vs. prior year 8

9 Divisional highlights: South Africa Leading beer category back to growth Brand marketing and sales execution delivering Premium segment share gains driven by Castle Lite, Castle Milk Stout, at rising relative prices Overall share gain to close to 90% Revenue management and cost control Productivity gains enable marketplace investment and margin growth Supply chain efficiency mitigating rising input costs in competitive soft drinks market Lager volumes* +2% Group revenue* +9% EBITA* +14% EBITA margin%* +100 bps * Organic volume, and organic, constant currency growth, respectively for financial metrics, vs. prior year 9


10 Divisional highlights: Africa Continued strong growth Led by Tanzania, Uganda, Zambia Share gains in competitive markets Capacity constraints experienced in Q4 Full portfolios and commercial investments reaching more consumers Castle portfolio +27% leading regional premium growth Mainstream core brand renovations bringing new news Impala lager in Mozambique using local cassava Investing for future growth Additional capacity in Nigeria, Tanzania, Uganda and Zambia Castel lager growth of +11% Lager volumes* +13% Group revenue* +17% EBITA* +16% EBITA margin%* flat * Organic volume, and organic, constant currency growth, respectively for financial metrics, vs. prior year 10

11 Divisional highlights: Asia Pacific Consolidation in China by CR Snow continues Snow +40 bps to 19% share CR Snow market share of 22% Firm price increases in China driving unit revenue +13% offsetting cost increases India: regional focus delivering profit growth Australia: first 100 days managing CUB Continued subdued consumer sentiment Pro forma lager volumes 4% below prior year Increase in revenue per hl Lager volumes* +4% Group revenue* +18% EBITA* +30% EBITA margin%* +50 bps * Organic volume, and organic, constant currency growth, respectively for financial metrics, vs. prior year 11


12 Strong growth in EPS and dividends Adjusted EPS Annual Dividend 91 US cents per share Up 12% 12


13 Underlying revenue growth driven by volumes, pricing and mix Group Revenue (including associates and joint ventures) components of performance, US$m * Adjusted for disposals 13
14 Organic, constant currency group revenue per hl performance Year ended 31 March 2012 Group revenue per hl growth Figures include our share of associates and joint ventures 14


15 Strong full year underlying EBITA growth EBITA (including associates and joint ventures) components of performance, US$m * Adjusted for disposals 15
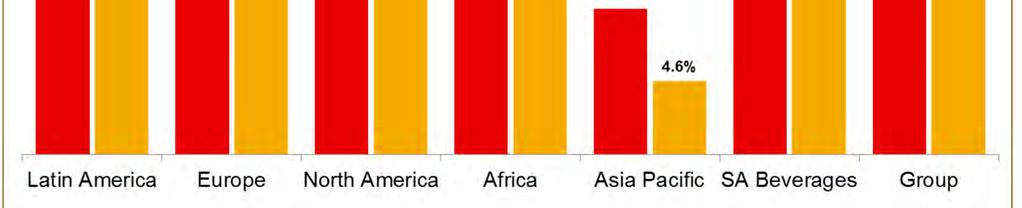
16 Margin improvements in most regions Year ended 31 March 2012 EBITA margin change Organic, constant currency basis Figures include our share of associates and joint ventures 16


17 Input cost rises Full year constant currency increase per hl Total raw materials Total COGS Up low single digits Barley and malt prices continue to rise Higher fuel prices drive up distribution costs Global procurement programme benefits ahead of plan, mitigating cost increases 17
18 Procurement Consolidating existing scope & moving into adjacent categories in raw materials & packaging: Leveraging expertise and sharing best practice Strategic approach Developing sustainability c.60% of subsidiary raw material and packaging procurement now managed by Trinity Coverage of materials increases further this year Expanding into non production spend, including: Services Freight Marketing Capital items 18
19 Business capability programme progress ERP implementations End to end global solution implemented in Ecuador during year Global Template enhanced for further deployments Rollout of aligned regional systems in Latin America continued Shared Services Achieved good progress in centralising our treasury centres Financial shared services scope increasing European regional manufacturing organisation is fully operational and continues to add significant benefits 19
20 Business capability programme: Financial headlines Exceptional charge of US$235m Reduction of exceptional charge to c.us$140m in year to March 2013 and further reduction in following year Improved net operating benefits forecast, driven by procurement Incremental net operating benefits Cumulative net operating benefits Year to 31/3/12 US$92m US$159m Year to 31/3/13 c.us$90m US$250m Year to 31/3/14 c.us$150m US$400m Exit with cumulative annualised rate of US$450m achieved by March
21 Cash flow, finance costs and taxation US$m March 12 March 11 Adjusted EBITDA* 6,183 5,617 Working Capital (incl provisions) Capex** 1,639 1,315 Free Cash Flow*** 3,048 2,488 Adjusted net finance costs Adjusted EBITDA* margin 23.0% 22.9% Effective tax rate 27.5% 28.2% * EBITDA before cash flows from exceptional items of US$308 million plus dividends received from MillerCoors of US$896 million (2010: US$293 million and US$822 million respectively) The revenue included in the calculation of the adjusted EBITDA margin is the revenue of our subsidiaries, plus our share of MillerCoors revenue. ** Includes purchases of property, plant and equipment, and intangible assets. *** Net cash generated from operating activities, less cash paid for the purchase of property, plant and equipment, and intangible assets, net investments in existing associates and joint ventures (in both cases only where there is no change in the group s effective ownership percentage) and dividends paid to non-controlling interests, plus cash received from the sale of property plant and equipment and intangible assets and dividends received. 21
22 Net debt US$m March 12 March 11 Non-current borrowings (18,164) (7,115) Current borrowings (1,063) (1,345) Cash and cash equivalents 745 1,071 Borrowings-related derivative financial instruments Net debt (17,862) (7,091) Gearing (%) Net debt/adjusted EBITDA* Weighted average interest rate for gross debt portfolio (%) * This is the ratio of net debt at Mar 12 to adjusted EBITDA (EBITDA before cash flows from exceptional items plus dividends received from MillerCoors) for the 12 months to Mar 12 22
23 Financial outlook current financial year Continued economic growth across most developing markets Slow improvement in some more mature economies Opportunities for selective pricing and mix improvement in most regions Raw material input costs expected to rise Total raw materials per hl* Mid single digits Total COGS per hl* Full year capex will approximate US$1,600m Tax rate between 27% and 29% *Stated in constant currency 23

24 Conclusion Emerging market consumption continues to be buoyant Signs of muted recovery in USA, but volatility continues in Europe SABMiller operating results are strong and resilient in this context Our organic growth strategies remain consistent Our medium term outlook for growth in volume, revenue and profitability remains strong 24

25 SABMiller F12 results Q & A 25
26 Supplementary information


27 Reported EBITA contribution EBITA contribution* March 2012 March 2011 * Before corporate costs
28 Financial results US$m March 12 March 11 Change % Reported Group revenue 31,388 28, EBITA 5,634 5, EBITA margin (%) bps Sales volumes (hl 000) Total 285, ,099 6 Lager 229, ,659 5 Soft drinks 49,475 45,875 8 Other alcoholic beverages 6,938 6,565 6
29 Group Revenue by division Group Revenue US$m March 12 March 11* Change % Organic, constant currency Latin America 6,994 6,335 10% Europe 5,164 5,162 0% North America 5,248 5,223 0% Africa 3,657 3,138 17% Asia Pacific 2,378 2,013 18% South Africa Beverages 6,083 5,598 9% * Adjusted for disposals
30 EBITA by division EBITA US$m March 12 March 11* Change % Organic, constant currency Latin America 1,841 1,620 14% Europe (9%) North America % Africa % Asia Pacific % South Africa Beverages 1,220 1,067 14% * Adjusted for disposals

31 EBITA margin performance Organic, constant currency basis * Adjusted for disposals

32 Reported EBITA margin performance
33 Reported volumes* Reported Domestic Lager volumes by country hl 000 March 12 Change % South Africa 26,856 2 Colombia 19,319 7 Poland 13,480 (4) Peru 12,272 9 Czech 6,928 - Russia (11 months only) 5,093 (9) Ecuador 5,571 7 Romania 4,499 (8) India 4,607 3 Italy 3,312 (2) Tanzania 3, China ** 50,525 9 * excluding intra-group volumes ** equity accounted share of volumes
34 Exchange rates Closing rates currency vs US$ 31 Mar Sep Mar 11 Australia China Colombia 1,792 1,915 1,879 Czech Republic Euro India Mozambique Peru Poland Romania South Africa Tanzania 1,585 1,660 1,501
35 Balance sheet US$m March 12 March 11* Goodwill and Intangible assets 30,029 16,318 Property, plant and equipment 9,299 9,331 Investment in joint ventures and associates 10,466 8,532 Other non-current assets 1, Current assets excluding cash 3,918 3,111 Cash and cash equivalents 745 1,067 Net assets of disposal groups held for sale Borrowings (19,226) (8,460) Other current and non-current liabilities (10,405) (7,895) Net Assets 26,013 22,759 * As restated
SABMiller plc. Full year results Twelve months ended 31 March Graham Mackay, Chief Executive Jamie Wilson, Chief Financial Officer.
 SABMiller plc Full year results Twelve months ended 31 March 2012 Graham Mackay, Chief Executive Jamie Wilson, Chief Financial Officer 24 May 2012 Forward looking statements This presentation includes
SABMiller plc. F 12 first half results US call Six months ended September 30, November 17, 2011
 SABMiller plc F 12 first half results US call Six months ended September 30, 2011 November 17, 2011 Jamie Wilson, Chief Financial Officer Gary Leibowitz, Senior Vice President, IR Forward looking statements
SABMiller plc US annual results presentation Year ended March 31, 2014
 SABMiller plc US annual results presentation Year ended March 31, 2014 Presented by Jamie Wilson, Chief Financial Officer Gary Leibowitz, SVP Internal & Investor Engagement Forward looking statements This
SABMiller plc Preliminary results Year ended 31 March Presented by Gary Leibowitz, SVP Internal and Investor Engagement
 SABMiller plc Preliminary results Year ended 31 March 2016 Presented by Gary Leibowitz, SVP Internal and Investor Engagement Forward looking statements This presentation includes forward-looking statements
Presented by Alan Clark, Chief Executive Domenic De Lorenzo, Chief Financial Officer
 Presented by Alan Clark, Chief Executive Domenic De Lorenzo, Chief Financial Officer This presentation includes forward-looking statements with respect to certain of SABMiller plc s plans, current goals
SABMiller plc. Interim results Half year ended 30 September November 2005 also available on website
 SABMiller plc Interim results Half year ended 30 September 2005 10 November 2005 also available on website www.sabmiller.com Forward-looking statements This presentation includes forward-looking statements.
SABMiller plc Preliminary results Year ended 31 March 2015
 SABMiller plc Preliminary results Year ended 31 March 2015 Presented by Alan Clark, Chief Executive Domenic De Lorenzo, Acting Chief Financial Officer Forward looking statements This presentation includes
SABMiller plc. First half results. 19 November Graham Mackay, Chief Executive Malcolm Wyman, CFO. Six months ended 30 September 2009
 SABMiller plc First half results Six months ended 30 September 2009 19 November 2009 Graham Mackay, Chief Executive Malcolm Wyman, CFO Forward looking statements This presentation includes forward-looking
SABMiller plc today issues its trading update for the 12 months ended 31 March 2016.
 SABMiller plc today issues its trading update for the 12 months ended 31 March 2016. Alan Clark, Chief Executive of SABMiller, said: We have had a strong year and increased momentum in the second half
SABMiller plc. Consumer analyst group of Europe - CAGE. London 29 March 2011
 SABMiller plc Consumer analyst group of Europe - CAGE London 29 March 2011 Forward looking statements This presentation includes forward-looking statements with respect to certain of SABMiller plc s plans,
SABMiller plc Trading update
 SABMiller plc JSEALPHA CODE: SAB ISSUER CODE: SOSAB ISIN CODE: GB0004835483 SABMiller plc Trading update 21 January 2016 SABMiller plc today issues its trading update for the group s third quarter ended
SABMiller plc. F09 annual results. 14 May Graham Mackay, Chief Executive Malcolm Wyman, CFO. Year ended 31 March 2009
 SABMiller plc F09 annual results Year ended 31 March 2009 14 May 2009 Graham Mackay, Chief Executive Malcolm Wyman, CFO Forward looking statements This presentation includes forward-looking statements
SABMiller plc Interim Report Building locally, winning globally, delighting consumers
 SABMiller plc Interim Report Building locally, winning globally, delighting consumers SABMiller plc Interim Report Introduction SABMiller plc, one of the world s leading brewers with operations and distribution
CONTINUING TO DRIVE REVENUE AND EARNINGS GROWTH
 Interim Announcement Release date: 21 November CONTINUING TO DRIVE REVENUE AND EARNINGS GROWTH SABMiller plc, one of the world s leading brewers with operations and distribution agreements across six continents,
SABMiller delivers top-line and earnings growth
 Interim Announcement Release date: 13 November SABMiller delivers top-line and earnings SABMiller plc, the world s second largest brewing company and one of the largest bottlers of Coca-Cola drinks, reports
GROWTH IN. Pricing, Brand. percent to. sequential. management. were key to. demand. o Underlying net. million.
 MILLERCOORS REPORTS SOLID GROWTH IN UNDERLYING NET INCOME FOR SECOND QUARTER Pricing, Brand Mix and Cost Controls Drive Positive Results August 7, (London and Denver) SABMiller plc (SAB.L) and Molson Coors
MILLERCOORS POSTS STRONG PROFIT GROWTH IN
 MILLERCOORS POSTS STRONG PROFIT GROWTH IN 2010 Despite Soft Volumes, Fourth Quarter Premium Light Sales Trends Improved Brewer Surpasses $500 Million in Annualized Synergy Savings Six Months Ahead of Schedule
Building locally, winning globally
 SABMiller plc Interim Report Building locally, winning globally SABMiller plc Interim Report Introduction SABMiller plc, one of the world s leading brewers with operations and distribution agreements across
Interim Report SABMiller plc Interim Report 2010
 Interim Report SABMiller plc Interim Report 2010 Introduction SABMillerplc,oneoftheworld sleadingbrewerswithoperationsanddistributionagreementsacross six continents,reportsitsinterim(unaudited)resultsforthesixmonthsto30september2010.
Carlsberg A/S. H interim results
 Carlsberg A/S H1 2016 interim results Agenda H1 highlights Financial results Region performance Appendix Good H1 performance +140bp Organic GPaL margin improvement -1% +8% Organic decline in pro rata volumes
Interim Results Presentation. Six months ended 30 June 2017
 Interim Results Presentation Six months ended 30 June 2017 Highlights Results for six months ended 30 June 2017 2 Solid first half positions Group well for second half > Solid underlying trading performance
SABMiller plc. Consumer Analyst Group of New York conference. Boca Raton, Florida February 18 th, 2010
 SABMiller plc Consumer Analyst Group of New York conference Boca Raton, Florida February 18 th, 2010 Global review Graham Mackay CEO 2 Forward looking statements This presentation includes forward-looking
Income taxes (excluding non-trading items) (89.2) (89.5)
 (89.2) (89.5)") FINANCIAL REVIEW Delivering another year of solid performance + Group Key Performance Indicators pages 30-31 Financial Statements pages 138-202 The Group delivered another year of solid performance against
FINANCIAL REVIEW Delivering another year of solid performance + Group Key Performance Indicators pages 30-31 Financial Statements pages 138-202 The Group delivered another year of solid performance against
BUILDING A BOLD AND SUSTAINABLE FUTURE
 BUILDING A BOLD AND SUSTAINABLE FUTURE 2018 HALF YEAR RESULTS 7 AUGUST 2018 PRESENTED BY: CHAIRMAN MARTIN LAMB CHIEF EXECUTIVE KEVIN HOSTETLER FINANCE DIRECTOR JONATHAN DAVIS Keeping the World Flowing
COORS LIGHT AND MILLER LITE COMBINE TO DELIVER FLAT SALES TO RETAIL VOLUME FOR THE SECOND CONSECUTIVE QUARTER
 COORS LIGHT AND MILLER LITE COMBINE TO DELIVER FLAT SALES TO RETAIL VOLUME FOR THE SECOND CONSECUTIVE QUARTER MillerCoors Reports Lower Second Quarter Underlying Net Income but Higher Net Revenue Per Barrel
Preliminary Announcement
 Preliminary Announcement 14 May RESILIENT PERFORMANCE REFLECTS OPERATING STRENGTHS SABMiller plc, one of the world s leading brewers with operations and distribution agreements across six continents, reports
6 MARCH 2017 FULL YEAR RESULTS
 6 MARCH 2017 FULL YEAR RESULTS FOR THE YEAR ENDED 31 DECEMBER 2016 01 THE COLLAGEN CASING COMPANY Global Leader One of the world s leading providers of collagen casings for the processed meats sector Provides
SABMiller plc Annual Report Building locally, winning globally, delighting consumers
 SABMiller plc Annual Report Building locally, winning globally, delighting consumers SABMiller plc Annual Report Contents What s inside Overview Financial and operational highlights of the year, an overview
Shaping our future. René Hooft Graafland. Member of the Executive Board/ CFO
 New York 6 March 2012 Disclaimer This presentation contains forward-looking statements with regard to the financial position and results of HEINEKEN s activities. These forward-looking statements are subject
H1 16 interim results. 22 September 2015
 H1 16 interim results 22 September 2015 Important notice 2 This presentation may include certain forward-looking statements, beliefs or opinions, including statements with respect to the Company s business,
SIG plc 2015 Full Year results. 9 March 2016
 SIG plc 2015 Full Year results 9 March 2016 2015 summary Group sales up 3.7% in constant currency Performance affected by weak H2 trading conditions and FX Strategic Initiatives ahead of schedule; 12.6m
Brambles reports results for the half-year ended 31 December 2017
 Brambles Limited ABN 89 118 896 021 Level 10, 123 Pitt Street Sydney NSW 2000 Australia GPO Box 4173 Sydney NSW 2001 Tel +61 2 9256 5222 Fax +61 2 9256 5299 www.brambles.com 19 February 2018 The Manager
DS Smith Plc. Full Year Results 2010/11 23 June 2011
 DS Smith Plc Full Year Results 2010/11 23 June 2011 Introduction Miles Roberts Group Chief Executive 2 Strong performance, more to go for Packaging volume up 8% EBITA up 39% to 136.1m, 20% excluding Otor
AEGIS GROUP PLC 2008 ANNUAL RESULTS. 19 March 2009
 AEGIS GROUP PLC 2008 ANNUAL RESULTS 19 March 2009 AGENDA OVERVIEW OF RESULTS John Napier FINANCIAL REVIEW Alicja Lesniak OUTLOOK John Napier Q&A Aegis Group plc Page 2 OVERVIEW OF RESULTS John Napier,
Sanford C. Bernstein. Strategic Decisions Conference, London, 19 September 2012 Carlos Brito, CEO Anheuser-Busch InBev
 Sanford C. Bernstein Strategic Decisions Conference, 2012 London, 19 September 2012 Carlos Brito, CEO Anheuser-Busch InBev Forward Looking Statements There are statements in this document, such as statements
2007 Interim Results 1 August 2007
 2 2007 Interim Results 1 August 2007 This material may be deemed to include forward-looking statements within the meaning of Section 27A of the US Securities Act of 1933 and Section 21E of the US Securities
Strengthening the economic model
 Strengthening the economic model Cécile CABANIS Executive Vice President, Chief Financial Officer Strategy and Information Systems DISCLAIMER This document is presented by Danone. It contains certain forward-looking
Investor Relations April/May Fyffes plc
 Investor Relations April/May 2016 Fyffes plc Fyffes overview Operates in the international fresh produce sector - Portfolio products bananas, pineapples, melons, mushrooms - Areas of activity Europe, US,
Third Quarter 2017 Results Jan Jenisch, CEO Ron Wirahadiraksa, CFO. October 27, 2017 LafargeHolcim Ltd 2015
 Third Quarter 2017 Results Jan Jenisch, CEO Ron Wirahadiraksa, CFO October 27, 2017 LafargeHolcim Ltd 2015 01 Initial views Q3 2017 and Outlook Jan Jenisch, Chief Executive Officer 2017 LafargeHolcim 2
2013 Interim Results. 14 August 2013
 2013 Interim Results 14 August 2013 1 This presentation contains statements that are, or may be, forward-looking regarding the group's financial position and results, business strategy, plans and objectives.
Tanzania Breweries Limited Press Announcement
 Tanzania Breweries Limited Press Announcement Headline Results Tanzania Breweries Limited today announces its results for the six month period ended 30 th September 2013. Highlights are as follows: 2013
Datatec Group Audited results for the year ended 29 February 2008
 Datatec Group Audited results for the year ended 29 February 2008 1 Datatec Group Highlights Revenue up 27% (12.2% organic) to over $4.0 billion Improved geographic spread of business helps to mitigate
IFRS Results for the three months ended 2 April Results Presentation 29 April 2010
 IFRS Results for the three months ended 2 April 2010 Results Presentation 29 April 2010 1 Disclaimer The information contained herein includes forward-looking statements which are based on current expectations
July 26, 2017 LafargeHolcim Ltd 2015
 Second Quarter 2017 Results Beat Hess, Chairman and Interim CEO Roland Köhler, Interim COO and Regional Head of Europe, Australia/NZ & Trading Ron Wirahadiraksa, CFO July 26, 2017 LafargeHolcim Ltd 2015
2012 half year results
 2012 half year results 29 th August 2012 Leading global nutritional solutions and cheese group Cautionary statement This presentation contains forward-looking statements. These statements have been made
Interim Results. Six months ended 31 December 2012
 Interim Results Six months ended 31 December 2012 Paul Walsh CEO A strong business, getting stronger Reiterating our medium term guidance Increased presence in the faster growing markets, pricing globally,
Segmental operating profit 227.7m Down 17% 1. Reported earnings per share 59.8p Down 4%
 Highlights Revenue 1,649m Down 5% 1 Segmental operating profit 227.7m Down 17% 1 Segmental operating margins 13.8% Down 160bps Operating cash flow 2 246m Up 6% Reported earnings per share 59.8p Down 4%
2017 Preliminary Results. 1 March 2018
 1 March 2018 Forward-Looking Statement Any forward-looking statements made in this presentation have been made in good faith based on the information available as of the date of this presentation and are
IFRS Results for the year ended 31 December Results Presentation 9 February 2011
 IFRS Results for the year ended 31 December 2010 Results Presentation 9 February 2011 1 Disclaimer The information contained herein includes forward-looking statements which are based on current expectations
Full Year Results 2014
 Legal disclaimer Information in this presentation may involve guidance, expectations, beliefs, plans, intentions or strategies regarding the future. These forward-looking statements involve risks and uncertainties.
SIG plc 2015 Half Year results. 11 August 2015
 SIG plc 2015 Half Year results 11 August 2015 Highlights Group sales +3.1% in constant currency; +0.6% on LFL basis Improving trend in Mainland Europe; LFLs turned positive Q2 2015 UK & Ireland LFL sales
ZEBRA TECHNOLOGIES FIRST QUARTER 2016 RESULTS May 10, 2016
 ZEBRA TECHNOLOGIES FIRST QUARTER 2016 RESULTS May 10, 2016 Anders Gustafsson Chief Executive Officer Mike Smiley Chief Financial Officer 2 Safe Harbor Statement Statements made in this presentation which
H RESULTS 27 JULY 2017
 H1 2017 RESULTS 27 JULY 2017 STEFAN BOMHARD GROUP CHIEF EXECUTIVE H1 2017 HIGHLIGHTS Broad-based earnings growth Strong EM performance & return to profit growth in Asia Strong free cash flow generation
The Food Travel Experts.
 The Food Travel Experts www.foodtravelexperts.com Presentation structure 1. Group highlights Kate Swann 2. Financial review Jonathan Davies 3. Business review Kate Swann 4. Q&A All 2 Group highlights Good
Electrocomponents 2017 half-year financial results. 18 November 2016
 Electrocomponents 2017 half-year financial results 18 November 2016 Agenda Overview of results Lindsley Ruth Financial results and performance update David Egan Performance Improvement Plan Lindsley Ruth
Electrocomponents plc ANNOUNCEMENT OF INTERIM RESULTS
 Electrocomponents plc ANNOUNCEMENT OF INTERIM RESULTS HALF YEAR ENDED 30 SEPTEMBER 2010 12 NOVEMBER 2010 DELIVERING FOR OUR CUSTOMERS Agenda Overview and current trading Ian Mason Financial performance
Aegis Group plc Half Year Results. 27 August 2010
 Aegis Group plc 2010 Half Year Results 27 August 2010 Agenda Introduction John Napier, Chairman Aegis Group overview Jerry Buhlmann, CEO Divisional review Aegis Media - Jerry Buhlmann, CEO Synovate Robert
Interim results presentation. 26 August 2010
 Interim results presentation 26 August 2010 Martin Lamb Agenda Results Overview Martin Lamb Financial Review Douglas Hurt Business Review - Severe Service Ian Whiting - Fluid Power Roy Twite - Indoor Climate
Investor Presentation Q Results. 21 May 2015
 Investor Presentation 2015 Results 21 May 2015 1 Forward-looking statements This presentation contains forward-looking statements, including, but not limited to, the statements and expectations contained
HIGHLIGHTS FINANCIAL REVIEW BUSINESS REVIEW HIGHLIGHTS OUTLOOK Q&A APPENDIX
 DISCLAIMER Certain matters discussed in this presentation may constitute forward-looking statements that are neither historical facts nor guarantees of future performance. Because these statements involve
Outstanding Volume and Earnings Growth
 PRELIMINARY ANNOUNCEMENT Ref: 11/2005 Outstanding Volume and Earnings Growth London and Johannesburg, 19 May 2005. SABMiller plc today announces its preliminary (unaudited) results for the year to 31 March
HeidelbergCement Half Year Results 28 July 2015 Dr. Bernd Scheifele, CEO and Dr. Lorenz Näger, CFO
 HeidelbergCement 2015 Half Year Results 28 July 2015 Dr. Bernd Scheifele, CEO and Dr. Lorenz Näger, CFO Slide 1-2015 Half Year Results - 28 July 2015 Disclaimer Unless otherwise indicated, the financial
Third Quarter 2018 Results 25 October AB InBev 2018 All rights reserved
 Third Quarter 2018 Results 25 October 2018 Legal Disclaimers Certain statements contained in this report that are not statements of historical fact constitute forward-looking statements, notwithstanding
KAP INDUSTRIAL HOLDINGS LIMITED UNAUDITED RESULTS FOR THE SIX MONTHS ENDED 31 DECEMBER 2018
 KAP INDUSTRIAL HOLDINGS LIMITED INTEGRATED INTO EVERY DAY INTRODUCTION JAAP DU TOIT CHAIRMAN AGENDA INTRODUCTION JAAP DU TOIT UNAUDITED INTERIM RESULTS FOR THE SIX STRATEGY MONTHS IMPLEMENTATION ENDED
STRONG UNDERLYING OPERATIONAL PERFORMANCE
 Interim Announcement 19 November 2009 STRONG UNDERLYING OPERATIONAL PERFORMANCE SABMiller plc, one of the world s leading brewers with operations and distribution agreements across six continents, today
Molson Coors Brewing Company Annual New York Analyst/Investor Meeting June 12, 2013
 Molson Coors Brewing Company Annual New York Analyst/Investor Meeting June 12, 2013 Peter Swinburn Chief Executive Officer Molson Coors Brewing Company 2 Forward-Looking Statement Forward-Looking Statements:
RPC GROUP PLC 2017 / 18 RESULTS
 RPC THE ESSENTIAL INGREDIENT RPC GROUP PLC 2017 / 18 RESULTS Supplemental Information 1 2018 RPC Group Plc. All Rights Reserved. Key figures Sales ( m) +36% Adjusted Operating Profit ( m) +38% Adjusted
2015 Preliminary Results. 9 March 2016
 2015 Preliminary Results 9 March 2016 Ashley Almanza Group CEO Legal Disclaimer Certain statements in this document are forward-looking statements. These forward-looking statements speak only as at the
Tables reconciling these measures to the UK GAAP measures included in our Financial Statements are shown hereafter.
 RECONCILIATION TO GAAP MEASURES THIRD QUARTER AND NINE MONTHS FINANCIAL RESULTS Unilever s discussion and analysis of performance is based on constant of exchange. This removes the distorting impact of
2016 ANNUAL RESULTS FEBRUARY 2017
 2016 ANNUAL RESULTS INTRODUCTION: FRANK VAN ZANTEN CHIEF EXECUTIVE HIGHLIGHTS CONSISTENT AND PROVEN STRATEGY GOOD SET OF RESULTS 184m COMMITTED ACQUISITION SPEND ON 14 ACQUISITIONS ADJUSTED EARNINGS PER
Molson Coors Reports Higher Worldwide Volume and Gross Margins But Lower Third Quarter Underlying After-Tax Income
 NEWS RELEASE CONTACTS: News Media Colin Wheeler (303) 927-2443 Investor Relations Dave Dunnewald (303) 927-2334 Molson Coors Reports Higher Worldwide Volume and Gross Margins But Lower Third Quarter Underlying
ANNOUNCEMENT OF PRELIMINARY RESULTS
 The leading high service distributor to engineers worldwide ANNOUNCEMENT OF PRELIMINARY RESULTS YEAR ENDED 31 MARCH 2009 29 May 2009 Agenda Overview and current trading Ian Mason Financial performance
EABL F12 Full Year Results Investor Briefing
 EABL F12 Full Year Results Investor Briefing Charles Muchene, Group Chairman Devlin Hainsworth, Group Managing Director Tracey Barnes, Group Finance Director 24 th August 2012 Outline of the Full Year
2012 Results and Strategy Review
 Results and Strategy Review Results - Review Ken Hanna Chairman 3 Results - Review Angus Cockburn Chief Financial Officer 4 Results Pre-Exceptional Movement As reported Underlying Revenue 1,583 1,396 13
ARYZTA AG. FY 2016 Results. 26 September 2016
 ARYZTA AG FY 2016 Results 26 September 2016 Forward Looking Statement This document contains forward looking statements which reflect management s current views and estimates. The forward looking statements
2008 Full year results
 4 March 2009 Slide 1 Good results in increasingly challenging market Like-for-like revenue up 8.9% Operating margin pre exceptional up 80 basis points Profit before tax pre exceptional up 20.8% Adjusted
2010 Annual Results. February 10, 2011
 2010 Annual Results February 10, 2011 Disclaimer This presentation contains forward-looking statements. The use of the words "aim(s)," "expect(s)," "feel(s)," "will," "may," "believe(s)," "anticipate(s)"
Annual Report. SABMiller plc Annual Report 2010
 Annual Report SABMiller plc Annual Report 2010 About SABMiller plc Overview 1 Our performance 2 The group at a glance Business review 6 Chairman s statement 9 Global beer market trends 10 Chief Executive
Amcor Half Year Results
 Amcor Half Year Results Investor Presentation Ron Delia Managing Director & CEO Michael Casamento CFO Disclaimer Forward looking statements This presentation contains forwardlooking statements that involve
First Quarter 2018 Results 9 May AB InBev 2018 All rights reserved
 First Quarter 2018 Results 9 May 2018 Legal Disclaimers Certain statements contained in this report that are not statements of historical fact constitute forward-looking statements, notwithstanding that
Company Overview 2008
 Company Overview 2008 Safe Harbor Statement During this presentation management may discuss certain forwardlooking statements concerning FEMSA s future performance that should be considered as good faith
McBride plc Interim Results Presentation: 22 February 2018
 Success in securing significant business wins validates our strategic direction Agenda 1. Headlines 2. Commercial update 3. Financial results 4. Strategy actions 5. Outlook 1 Headlines Revenues 2.2% higher
CONTENTS. Overview. Governance. Operating and financial review. Our 2007 financial statements. Shareholder information
 Annual Report 2007 CONTENTS 1 Overview 34 Governance 4 Our performance 1 Global footprint 2 Operating and financial review Chairman s statement 4 The global beer market 6 Chief Executive s review 7 58
MILLERCOORS REPORTS THIRD QUARTER UNDERLYING NET INCOME GROWTH OF
 MILLERCOORS REPORTS THIRD QUARTER UNDERLYING NET INCOME GROWTH OF 9.6% Domestic Net Revenue Per Hectoliter Grew 1.6 Percent in the Quarter; STR Volume Down 4.0% November 1, (Chicago) Molson Coors Brewing
Aegis Group plc. 17 March 2011
 Aegis Group plc 2010 Full Year Results 2010 Full Year Results 17 March 2011 Agenda Introduction John Napier, Chairman Aegis Group overview Jerry Buhlmann, CEO Divisional review Aegis Media - Jerry Buhlmann,
Full-year ended 31 December 2013
 Full-year ended 31 December 2013 1 2013 Headlines Market share growth across all three regions Solid earnings growth Price/mix improvement due to stronger commercial execution Efficiency improvements across
Half-year 2012 Results. August 1, 2012
 Half-year 2012 Results August 1, 2012 Disclaimer All forward-looking statements are Schneider Electric management s present expectations of future events and are subject to a number of factors and uncertainties
Agenda. 1. Highlights FY 2012 Results. 2. Operational Performance Priorities for Financials. 5. Conclusion
 1MARCH 2013 Legal Disclaimer Information in this presentation may involve guidance, expectations, beliefs, plans, intentions or strategies regarding the future. These forward-looking statements involve
EABL F14 Full Year Results Media Briefing. 7 th August 2014
 EABL F14 Full Year Results Media Briefing 7 th August 2014 Outline of the Full Year Results Briefing F14 Full Year Review Charles Ireland Financial Performance Tracey Barnes Summary and Outlook Charles
Availability, Reliability, Ease. 11 September 2018
 Availability, Reliability, Ease 11 September 2018 LEGAL NOTICE This presentation has been prepared to inform investors and prospective investors in the secondary markets about the Group and does not constitute
RESULTS FOR THE YEAR ENDED 31 MARCH Copyright Tate & Lyle PLC 2017
 RESULTS FOR THE YEAR ENDED 31 MARCH 2017 Copyright Tate & Lyle PLC 2017 Cautionary Statement This presentation for the Full Year Results for the year ended 31 March 2017 contains certain forward-looking
2008 Half Year Results. 30 July 2008
 1 2008 Half Year Results 30 July 2008 2 This material may be deemed to include forward-looking statements within the meaning of Section 27A of the US Securities Act of 1933 and Section 21E of the US Securities
SABMILLER PLC SUCCESSFULLY PLACES 293,896,315 ORDINARY SHARES OF TSOGO SUN HOLDINGS LIMITED
 JSEALPHA CODE: SAB ISIN CODE: SOSAB ISIN CODE: GB0004835483 (the Company ) SABMILLER PLC SUCCESSFULLY PLACES 293,896,315 ORDINARY SHARES OF TSOGO SUN HOLDINGS LIMITED ( SABMiller ) announces that it has
2nd quarter 2017 results
 2nd quarter 2017 results Europe gaining further momentum Jacques van den Broek, CEO Robert Jan van de Kraats, CFO Randstad Holding nv disclaimer & definitions Certain statements in this document concern
2017 Interim Results
 2017 Interim Results Disclosure Statement Page 2 This presentation and the accompanying slides (the Presentation ) which have been prepared by Samsonite International S.A. ( Samsonite or the Company )
I N V E S TO R P R E S E N TAT I O N. A U G U S T, elementcorp.com
 I N V E S TO R P R E S E N TAT I O N A U G U S T, 2 0 1 4 Certain information in this presentation is forward-looking and related to anticipated financial performance, events and strategies. When used
ECOLAB THIRD QUARTER 2018
 3Q 2018 Overview Sales: ECOLAB THIRD QUARTER 2018 Reported sales +5%; fixed currency sales were +6%, with acquisition adjusted fixed currency sales +7%. New business growth, share gains, pricing and new
Unilever H Results
 Unilever H1 2011 Results Paul Polman CEO Jean-Marc Huët CFO James Allison Head of IR and M&A August 4 th 2011 Safe Harbour Statement This announcement may contain forward-looking statements, including
1st quarter 2017 results
 1st quarter 2017 results Sound organic growth continues Jacques van den Broek, CEO Robert Jan van de Kraats, CFO Randstad Holding nv disclaimer & definitions Certain statements in this document concern
Investor Presentation Q3 Results. 12 November 2014
 Investor Presentation Q3 Results 12 November 2014 1 Forward-looking statements This presentation contains forward-looking statements, including, but not limited to, the statements and expectations contained