Mr. Vikas Oberoi honoured as best successor Second Generation at Hindustan Times Real Estate Awards
|
|
|
- Peregrine Stewart
- 5 years ago
- Views:
Transcription
1
2 Key Developments Achieved highest ever top line in any financial year Commenced bookings for the fifth tower at Sky City, Borivali Crossed 1,000 units of bookings in Sky City Awards Mr. Vikas Oberoi honoured as best successor Second Generation at Hindustan Times Real Estate Awards Esquire by Oberoi Realty recognised as Most Desirable Residences Mumbai at Hindustan Times Real Estate Awards Oberoi Mall recognised for Most number of Events by The Activation Venues Forum (TAVF), initiated by Umbrella Aegis Note: Please refer to Annexure and Disclaimer at the end of the presentation 1
3 Financial Update Investment Properties Development Properties 2
4 Amount in Rs Lakh Particulars 9MFY19 9MFY18 FY18 Non-current assets 4,10,850 3,66,111 3,79,158 Current assets 6,94,804 6,25,617 6,43,315 Total 11,05,654 9,91,728 10,22,473 Equity 7,85,992 5,96,283 6,09,237 Non-current liabilities 82,092 79,235 83,096 Current liabilities 2,37,570 3,16,210 3,30,140 Total 11,05,654 9,91,728 10,22,473 As a result of adoption of IND AS 115 wef April 1, 2018, revenue of Rs. 49,324 lakhs has been credited to opening reserves and cost of Rs. 49,324 lakhs has been debited to opening reserves, thereby resulting in net Nil impact on opening reserves on April 1,
5 Amount in Rs Lakh Particulars Q3FY19 Q2FY19 Q3FY18 9MFY19 9MFY18 Opening Cash and Cash Equivalents 1,28,886 1,38,804 11,184 13,251 49,417 Operating Cash Flows (2,058) 4,517 (36,690) 25,759 (40,381) Investing Cash Flows (66,614) (83,304) (26,134) (83,155) (73,967) Financing Cash Flows (15,484) (6,298) 58,534 88,875 71,825 Closing Cash and Bank Balance * 44,730 53,719 6,894 44,730 6,894 Add: Short-term Liquid Investments 52,649 75,167 4,070 52,649 4,070 Closing Cash and Bank Balance (incl. Short-term Liquid Investments) 97,379 1,28,886 10,964 97,379 10,964 * Includes Rs. 2,132 lakhs for Q3FY19/9MFY19, Rs 2,273 lakhs for Q2FY19, Rs. 151 lakhs for Q3FY18/9MFY18 shown under other financial assets Note: Previous period figures for Q3FY18 and 9MFY18 have been re-grouped / re-classified wherever necessary to conform to current period s classification. 4
6 Amount in Rs Lakh Particulars 9MFY19 9MFY18 FY18 Non-current assets Fixed assets (including CWIP) 1,12,997 1,07,930 1,08,898 Financial assets 2,65,308 2,31,462 2,41,066 Deferred tax assets (net) 13,827 12,221 14,579 Other non-current assets 18,718 14,498 14,615 Total non-current assets 4,10,850 3,66,111 3,79,158 Current assets Inventories 3,96,426 4,05,825 4,24,673 Financial assets i) Investments a) Investments in mutual fund 52,649 4,070 1,170 b) Investments - Others ii) Cash and Bank balances 42,601 6,744 11,672 iii Trade receivables 11,195 20,432 18,132 iv) Others 19,185 15,861 15,967 Other current assets 1,72,547 1,72,530 1,71,522 Total current assets 6,94,804 6,25,617 6,43,315 Note: Previous period figures for 9MFY18 have been re-grouped / re-classified wherever necessary to conform to current period s classification. 5
7 Amount in Rs Lakh Particulars 9MFY19 9MFY18 FY18 Non-current liabilities Financial liabilities i) Borrowings 61,871 67,830 67,864 ii) Trade Payables 2,202 1,356 1,464 iii) Others 10,224 6,436 8,451 Provisions Deferred tax liabilities (Net) 4,237 2,374 3,705 Other non-current liabilities 3,361 1,088 1,446 Total Non-current liabilities 82,092 79,235 83,096 Current liabilities Financial liabilities i) Borrowings 23,058 30,481 26,586 ii) Trade Payables 3,351 4,467 13,080 iii) Others 98,789 90,538 96,556 Other current liabilities i) Advance from customers 3,112 3,501 3,690 ii) Others 1,09,195 1,87,186 1,90,185 Provisions Total current liabilities 2,37,570 3,16,210 3,30,140 Note: Previous period figures for 9MFY18 have been re-grouped / re-classified wherever necessary to conform to current period s classification. 6
8 Amount in Rs. Lakh (Except EPS) Particulars Q3FY19 Q2FY19 Q3FY18 9MFY19 9MFY18 Revenue from Projects 39,386 46,977 24,926 1,63,253 61,600 Revenue from Hospitality 3,612 3,167 3,515 9,817 9,400 Revenue from Rent 8,485 7,797 5,927 23,540 17,221 Property Management Revenues 1,148 1,109 1,108 3,476 3,229 Other Operating Revenues Revenue from Operations 52,862 59,211 35,620 2,00,899 92,046 Non Operating Income 2,017 2, ,496 1,871 Total Income 54,879 61,978 36,036 2,06,395 93,917 Total Expenses 35,679 31,308 17,758 1,11,195 47,085 Profit before share of profit / (loss) of joint ventures and exceptional items 19,200 30,670 18,278 95,200 46,832 Share of Profit / (loss) of associates Profit Before Tax 19,524 30,787 18,373 95,750 47,087 Profit After Tax 13,793 21,383 12,019 66,117 31,588 Other comprehensive income, net of tax (4) Total Comprehensive Income for the period 13,789 21,405 12,096 66,158 31,688 Diluted EPS (Rs.) (not annualised)
9 Particulars 9MFY19 9MFY18 Adjusted EBITDA * Margin (Including Non Operating Income) Adjusted EBITDA * Margin (Excluding Non Operating Income) 53.60% 54.37% 52.33% 53.44% PAT Margin 32.03% 33.63% RONW # 12.74% 7.26% ROCE # 10.55% 6.05% Gross Debt/Equity *Adjusted EBITDA = EBITDA + Interest included in Operating costs #Calculated on Average Networth and Average Capital Employed 8
10 Particulars Total Residential * Rental Hospitality Amount in Rs Lakh Property Management Services Q3FY % 33.59% 95.12% 37.74% -8.77% Total Revenues 54,879 41,247 8,683 3,729 1,220 Adjusted EBITDA ** 23,414 13,855 8,259 1,407 (107) 9MFY % 50.25% 94.68% 35.76% % Total Revenues 2,06,395 1,68,657 23,967 10,097 3,674 Adjusted EBITDA ** 1,10,620 84,742 22,692 3,611 (425) Q3FY % 51.53% 91.68% 36.63% % Total Revenues 36,037 25,381 5,947 3,566 1,143 Adjusted EBITDA ** 19,680 13,079 5,453 1,306 (157) 9MFY % 50.10% 92.83% 35.01% % Total Revenues 93,916 63,471 17,526 9,572 3,347 Adjusted EBITDA ** 51,062 31,797 16,268 3,351 (355) * Q3FY18 and 9MFY18 figures are based on the erstwhile revenue recognition methods used prior to the adoption of IND AS 115 and accordingly are not comparable to the figures of Q3FY19 and 9MFY19 ** Adjusted EBITDA = EBITDA + Interest included in Operating costs 9
11 20-Oct Nov Jan Feb-11 2-Apr May Jun-11 3-Aug Sep Oct-11 4-Dec Jan Feb-12 5-Apr May Jun-12 6-Aug Sep Oct-12 7-Dec Jan Feb-13 9-Apr May Jun Aug Sep Oct Dec Jan-14 3-Mar Apr May-14 4-Jul Aug Sep-14 4-Nov Dec Jan-15 7-Mar Apr May-15 8-Jul Aug Sep-15 8-Nov Dec Jan Mar Apr May Jul Aug-16 1-Oct Nov Dec-16 1-Feb Mar Apr-17 4-Jun Jul Aug-17 5-Oct Nov Dec-17 5-Feb Mar Apr-18 8-Jun Jul Aug-18 9-Oct Nov Dec-18 Index Financial Update Investment Properties Development Properties Sensex BSE Realty Index Oberoi Realty Note: Closing levels of Sensex and Realty Index as on Oct 20, 2010 was 19, and 3, respectively, the same has been indexed to 100 For Oberoi Realty the issue price of Rs. 260/- is indexed to
12 Category 31-Dec Sep Jun Mar Dec-17 Promoter and Promoter Group 67.70% 67.70% 67.70% 72.49% 72.49% Foreign Institutional Investors (FIIs) 25.40% 25.54% 26.44% 21.98% 22.58% Domestic Institutional Investors (Institutional investors other than FIIs) 4.48% 4.00% 3.41% 3.06% 2.93% Other public shareholders 2.41% 2.76% 2.45% 2.47% 2.01% 11


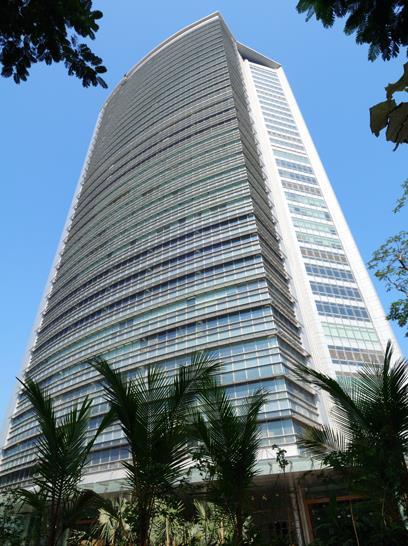

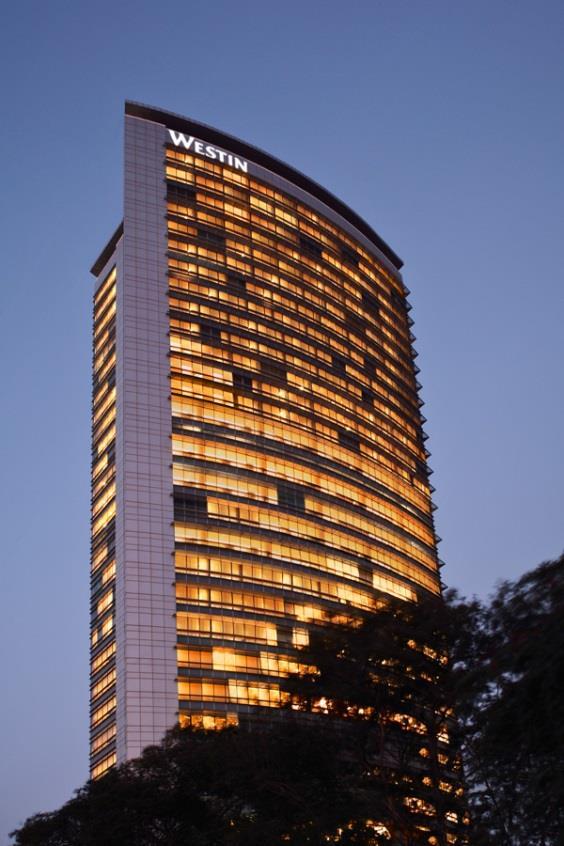
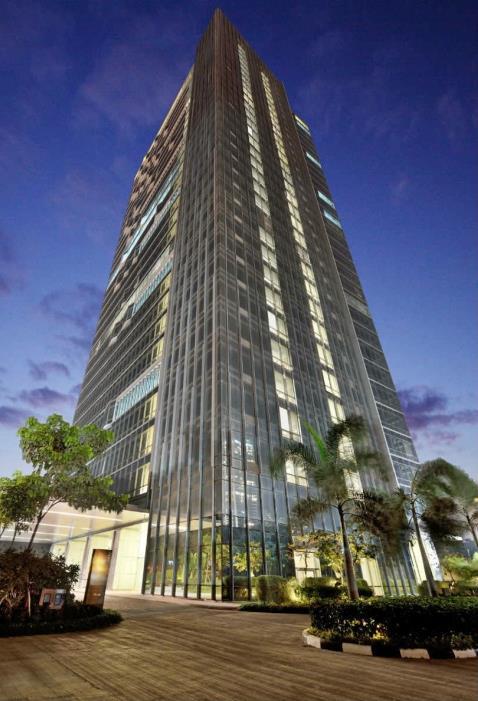
13 The Westin Mumbai Garden City GLA: 318,118sqft. GLA: 552,893 sqft. GLA: 725,769 sqft. 269 rooms 12
14 Particulars Q3FY19 Q2FY19 Q3FY18 9MFY19 9MFY18 Operating Revenue (Rs. Lakh) 3,890 3,750 2,796 11,184 8,142 EBITDA (Rs. Lakh) 3,714 3,567 2,657 10,613 7,631 EBITDA Margin (%) 95.48% 95.13% 95.00% 94.89% 93.72% Occupancy (%) 96.85% 96.85% 99.39% 97.00% 99.05% Area Leased (Sqft.) 5,35,486 5,35,486 5,49,543 5,36,322 5,47,637 Revenue psf/month on area leased (Rs.)
15 Particulars Q3FY19 Q2FY19 Q3FY18 9MFY19 9MFY18 Operating Revenue (Rs. Lakh) 1,040 1,012 1,108 3,123 3,420 EBITDA (Rs. Lakh) ,097 3,029 3,393 EBITDA Margin (%) 94.81% 97.81% 98.98% 96.97% 99.20% Occupancy (%)* 77.74% 77.74% 82.13% 77.99% 84.24% Area Leased (Sqft.)* 2,47,299 2,47,299 2,61,274 2,48,109 2,67,992 Revenue psf/month on area leased (Rs.)* * 46,770 square feet additional area to be occupied by ORL for its own use and occupancy calculated accordingly 14
16 Particulars Q3FY19 Q2FY19 Q3FY18 9MFY19 9MFY18 Operating Revenue (Rs. Lakh) 2,260 1,854 1,136 5,776 3,369 EBITDA (Rs. Lakh) 2,053 1, ,156 2,759 EBITDA Margin (%) 90.81% 88.99% 81.53% 89.26% 81.90% Occupancy (%) 63.66% 63.44% 44.66% 63.52% 44.66% Area Leased (Sqft.) 4,62,057 4,60,412 3,24,094 4,60,976 3,24,094 Revenue psf/month on area leased (Rs.)* * Calculated after excluding the area under rent free fit out period 15
17 Particulars Q3FY19 Q2FY19 Q3FY18 9MFY19 9MFY18 Operating Revenue (Rs. Lakh) 3,691 3,208 3,537 9,987 9,464 EBITDA (Rs. Lakh) 1,369 1,065 1,278 3,501 3,243 EBITDA Margin (%) 37.08% 33.22% 36.12% 35.05% 34.27% Number of Rooms Average Room Rate (Rs.) 9,712 8,715 9,401 8,931 8,547 Occupancy (%) 80.17% 81.05% 79.97% 81.83% 79.85% RevPAR (Rs.) 7,775 7,055 7,582 7,294 6,848 16
")

18 Mixed Use Developments Sky City, Borivali (Mall/Hotel) Total GLA : ~1.73 msf Worli (Mall/Office/Hotel) Total GLA : ~1.70 msf 17


19 18
20 Residential Projects Est. Area Area Booked Till Date Inventory as on Date Booking Value till Date Revenue Recognised till Date Project Completion (sqft.) (sqft.) (sqft.) (Rs. Lakh) (Rs. Lakh) (%) Seven 39,550 33,900 5,650 5,000 5, % Exquisite 15,47,610 14,25,965 1,21,645 2,35,103 2,35, % Esquire 21,22,031 15,45,946 5,76,085 2,45,636 2,45, % Prisma 2,68,750 2,31,996 36,754 40,771 40, % Eternia 21,48,000 5,86,010 * 4,34,690 85,697 ** 29,200 34% Enigma 19,89,000 3,96,588 * 6,62,419 58,434 10,497 ** < 25% Sky City 45,93,000 15,47,883 * 9,54,134 2,47,650 ** 98,883 *** 40% Total 1,27,07,941 57,68,288 27,91,377 9,18,290 6,65,089 Three Sixty West 22,82,346 5,27,124 17,55,222 2,13,562 * Basis area opened for booking ** While recognising revenue, the cost of land has been allocated in proportion to the construction cost incurred as compared to the accounting treatment hitherto of recognising revenue in proportion to the actual cost incurred (including land cost) *** Pertains to Sky City Tower A-D, excludes Tower E which is <25% 19
21 Projects Area Booked in Q3FY19 Units Booked in Q3FY19 Sales Value for Q3FY19 Amount Collected in Q3FY19 Revenue Recognised in Q3FY19 (sqft.) (nos.) (Rs. Lakh) (Rs. Lakh) (Rs. Lakh) Exquisite 1, Esquire 29, ,670 8,929 6,670 Prisma Eternia 21, ,230 2,988 5,768 Enigma 20, ,228 1,768 1,886 Sky City 75, ,972 14,795 24,620 Total 1,49, ,541 29,639 39,386 Three Sixty West (2,052) - (1,379) 5,233-20
22 Particulars Q3FY19 Q2FY19 Q3FY18 9MFY19 9MFY18 Project Till Date Estimated Total Area (sqft.) 15,47,610 15,47,610 15,47,610 15,47,610 15,47,610 15,47,610 Estimated Total Units (nos.) Area Booked (sqft) 1,690 17,030 17,550 23,790 36,790 14,25,965 Units Booked (nos.) Area in Inventory (sqft.) 1,21,645 1,23,335 1,49,075 1,21,645 1,49,075 1,21,645 Units in Inventory (nos.) Booking Value (Rs. Lakh) 442 3,996 4,124 5,638 8,713 2,35,103 Amount Collected (Rs. Lakh) 816 3,642 4,084 5,792 8,873 2,34,226 Revenue Recognised (Rs. Lakh) 442 3,996 4,124 5,638 8,713 2,35,103 Average Rate per sqft (Rs.) 26,133 23,463 23,497 23,699 23,682 16,487 21
23 Particulars Q3FY19 Q2FY19 Q3FY18 9MFY19 9MFY18 Project Till Date Estimated Total Area (sqft.) 21,22,031 21,22,031 21,22,031 21,22,031 21,22,031 21,22,031 Estimated Total Units (nos.) Area Booked (sqft) 29,865 52,322 24,432 2,11,820 86,746 15,45,946 Units Booked (nos.) Area in Inventory (sqft.) 5,76,085 6,05,950 8,30,153 5,76,085 8,30,153 5,76,085 Units in Inventory (nos.) Booking Value (Rs. Lakh) 6,670 11,046 4,806 44,454 17,759 2,45,636 Amount Collected (Rs. Lakh) 8,929 19,419 20,825 56,237 26,432 2,41,858 Revenue Recognised (Rs. Lakh) 6,670 11,046 15,660 57,716 43,973 2,45,636 Average Rate per sqft (Rs.) 22,334 21,112 19,670 20,987 20,473 15,889 22
24 Particulars Q3FY19 Q2FY19 Q3FY18 9MFY19 9MFY18 Project Till Date Estimated Total Area (sqft.) 2,68,750 2,68,750 2,68,750 2,68,750 2,68,750 2,68,750 Estimated Total Units (nos.) Area Booked (sqft) - 8,397 8,595 22,985 20,731 2,31,996 Units Booked (nos.) Area in Inventory (sqft.) 36,754 36,754 68,517 36,754 68,517 36,754 Units in Inventory (nos.) Booking Value (Rs. Lakh) - 1,726 1,522 4,360 3,683 40,771 Amount Collected (Rs. Lakh) 343 6,194 1,600 12,562 2,259 40,023 Revenue Recognised (Rs. Lakh) - 1,726 5,140 10,644 7,387 40,771 Average Rate per sqft (Rs.) - 20,560 17,711 18,968 17,767 17,574 23

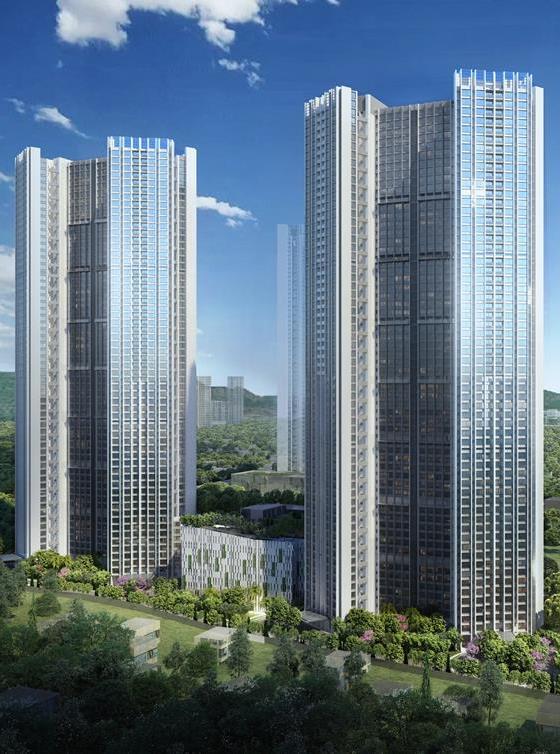
25 Artist Impression 24


26 Project status as on Dec 31, 2018 Project status as on Sep 30,
27 Particulars Q3FY19 Q2FY19 Q3FY18 9MFY19 9MFY18 Project Till Date Estimated Area of Project (sqft.) 21,48,000 21,48,000 16,96,820 21,48,000 16,96,820 21,48,000 Estimated Total Units (nos.) 1,277 1,277 1,057 1,277 1,057 1,277 Area opened for booking (sqft.) 10,20,700 8,92,250 7,83,720 10,20,700 7,83,720 10,20,700 Units opened for booking (nos.) Area Booked (sqft) 21,840 24,170 6,680 76,200 31,070 5,86,010 Units Booked (nos.) Area in Inventory (sqft.) 4,34,690 3,28,080 2,80,810 4,34,690 2,80,810 4,34,690 Units in Inventory (nos.) Booking Value (Rs. Lakh) 3,230 3,464 1,026 10,924 4,689 85,697 Amount Collected (Rs. Lakh) 2,988 4,829 3,839 10,997 5,755 46,391 Revenue Recognised (Rs. Lakh) 5,768 12,066-20,229-29,200 * Average Rate per sqft (Rs.) 14,788 14,334 15,353 14,336 15,092 14,624 * In view of adoption of IND AS 115, revenue of Rs. 8,971 lakhs has been credited to opening reserves as on April 1,

28 27


29 Project status as on Dec 31, 2018 Project status as on Sep 30,
30 Particulars Q3FY19 Q2FY19 Q3FY18 9MFY19 9MFY18 Project Till Date Estimated Area of Project (sqft.) 19,89,000 19,89,000 16,12,045 19,89,000 16,12,045 19,89,000 Estimated Total Units (nos.) Area opened for booking (sqft.) 10,59,007 8,73,356 7,85,334 10,59,007 7,85,334 10,59,007 Units opened for booking (nos.) Area Booked (sqft) 20,738 7,650-42,393 18,935 3,96,588 Units Booked (nos.) Area in Inventory (sqft.) 6,62,419 4,97,506 4,36,499 6,62,419 4,36,499 6,62,419 Units in Inventory (nos.) Booking Value (Rs. Lakh) 3,228 1,090-6,313 2,835 58,434 Amount Collected (Rs. Lakh) 1,768 2,979 2,844 6,373 4,503 31,839 * Revenue Recognised (Rs. Lakh) 1,886 1,891-5,266-10,497 Average Rate per sqft (Rs.) 15,566 14,246-14,892 14,972 14,734 * In view of adoption of IND AS 115, revenue of Rs. 5,231 lakhs has been credited to opening reserves as on April 1,

31 Artist Impression 30


32 Project status as on Dec 31, 2018 Project status as on Sep 30, 2018 Artist Impression 31
33 Particulars Q3FY19 Q2FY19 Q3FY18 9MFY19 9MFY18 Project Till Date Estimated Area of Project (sqft.) 45,93,000 45,93,000 39,92,754 45,93,000 39,92,754 45,93,000 Estimated Total Units (nos.) 2,966 2,966 2,357 2,966 2,357 2,966 Area opened for booking (sqft.) 25,02,017 20,32,850 20,27,946 25,02,017 20,27,946 25,02,017 Units opened for booking (nos.) 1,606 1,336 1,322 1,606 1,322 1,606 Area Booked (sqft) 75,195 77,482 47,027 2,10,557 1,34,838 15,47,883 Units Booked (nos.) ,047 Area in Inventory (sqft.) 9,54,134 5,60,162 7,45,183 9,54,134 7,45,183 9,54,134 Units in Inventory (nos.) Booking Value (Rs. Lakh) 11,972 13,040 7,685 33,919 21,709 2,47,650 Amount Collected (Rs. Lakh) 14,795 11,330 8,844 34,963 16,862 1,31,821 * Revenue Recognised (Rs. Lakh) 24,620 16,252-63,760-98,883 Average Rate per sqft (Rs.) 15,921 16,829 16,341 16,109 16,100 15,999 * In view of adoption of IND AS 115, revenue of Rs. 35,123 lakhs has been credited to opening reserves as on April 1,

34 Project Status as on Dec 31, 2018 Amount spent in Q3FY19 : Rs crore 33
35 Particulars Q3FY19 Q2FY19 Q3FY18 9MFY19 9MFY18 Project Till Date Estimated Area of Project (sqft.) 22,82,346 22,82,346 23,71,278 22,82,346 23,71,278 22,82,346 Area Booked (sqft) (2,052) 51,583 47,479 84,855 91,556 * 5,27,124 Units Booked (nos.) * 56 Area in Inventory (sqft.) 17,55,222 17,53,170 19,38,571 17,55,222 19,38,571 17,55,222 Booking Value (Rs. Lakh) (1,379) 22,388 21,471 37,652 43,842 2,13,562 Amount Collected (Rs. Lakh) 5,233 7, ,982 2,501 1,05,728 Average Rate (other than transfers) per sqft (Rs) ** - 43,402 45,222 44,372 47,886 44,417 * The area booked includes transfers from other joint venture project at the same rate at which they were originally sold in ** Average rate of sales (including transfers) is Rs. 40,515 per sq. ft. The Company s share in the net revenue ranges from 25 40% for the residential component 34

36 Investor Relation efforts are coordinated by: Saumil Daru Director - Finance saumil.daru@oberoirealty.com Mayank Kapoor EA to MD and Investor Relations mayank.kapoor@oberoirealty.com For any further information please write to ir@oberoirealty.com or contact on (+91 22)
37 Notes 1. Considering the nature of the business carried on by the Company whereby revenues do not necessarily accrue evenly over the projects period, the revenues of the quarter and/or the year may not be strictly comparable with the results of the corresponding quarter and/or the year. 2. Total areas of the projects are calculated based on the carpet areas calculated as per the law prevailing prior to the introduction of RERA. The Company has given the areas to make them comparable with other projects of other developers across the country, and these areas do not represent the basis of the transaction entered into with the customers. 3. Previous period figures have been re-grouped, re-arranged and re-classified wherever necessary to conform to current period s classification. The classification in this presentation may vary from classifications under Schedule III to the Companies Act or under Accounting Standards or the financial statements published in the Annual Report. 4. All areas / configurations of projects are based on present estimates and are subject to change based on regulatory requirements and / or design / construction exigencies and / or management decisions. Abbreviations Crore = 10 Million nos. = Numbers EPS = Earnings Per Share PAT = Profit After Tax EBITDA = Earnings before Interest, Tax, Depreciation and Amortisation PBT = Profit Before Tax GLA = Gross Leasable Area RERA = Real Estate (Regulation and Development) Act 2016 IGAAP = Indian Generally Accepted Accounting Principles (Till March 31, 2016) ROCE = Return on Capital Employed IND AS = Indian Accounting Standards (From April 01, 2016) RONW = Return on Networth Lakh = Hundred Thousand Rs. = Indian Rupees MahaRERA Rules = Maharashtra Real Estate (Regulation and Development) (Registration of real estate projects, Registration of real estate agents, rates of interest and disclosures on website) Rules, 2017 sqft. = Square Feet 36
38 This presentation has been prepared by Oberoi Realty Limited (ORL) and does not constitute a prospectus or placement memorandum or an offer to acquire any securities of ORL. This presentation or any other documentation or information (or any part thereof) delivered or supplied should not be deemed to constitute an offer to subscribe for ORL securities or the total areas mentioned herein should not be deemed to be the basis for transactions with customers. No representation or warranty, express or implied is made as to, and no reliance should be placed on, the fairness, accuracy, completeness or correctness of such information or opinions contained herein. The information contained in this presentation is only current as of its date. Certain statements made in this presentation may not be based on historical information or facts and may be forward looking statements, including those relating to general business statements, plans and strategy of ORL, its future financial condition and growth prospects, future developments in its industry and its competitive and regulatory environment, and statements which contain words or phrases such as will, expected to, horizons of growth, strong growth prospects, etc., or similar expressions or variations of such expressions. These forward-looking statements are based on expectations and projections, and may involve a number of risks, uncertainties and other factors that could cause actual results, opportunities and growth potential to differ materially from those suggested by such statements. These risks and uncertainties include, but are not limited to risks with respect to its real estate business, economic environment in India and overseas, changes in development regulations, changes in tax laws, changes in other applicable laws, litigation and labour relations. ORL will not be in any way responsible for any action taken based on such statements and undertakes no obligation to publicly update these forward-looking statements to reflect subsequent events or circumstances. ORL may alter, modify or otherwise change in any manner the content of this presentation, without obligation to notify any person of such revision or changes. This presentation cannot be copied and disseminated in any manner. No person is authorized to give any information or to make any representation not contained in and not consistent with this presentation and, if given or made, such information or representation must not be relied upon as having been authorized by or on behalf of ORL. The MahaRERA Rules have been notified on 20 th April All our under construction projects in which sales have commenced have been registered under RERA. The information given in this presentation in the form of pictures, artistic renders, areas, consideration, project details etc does not purport or tantamount to any disclosure under the MahaRERA Rules and should not be construed to be or constitute advertisements, solicitations, marketing, offer for sale, invitation to offer, invitation to acquire including within the purview of RERA. 37
Received approval for additional residential area of ~5.30 lakh sq.ft. in Three Sixty West (Oasis Realty)
") Key Developments Received approval for additional residential area of ~5.30 lakh sq.ft. in Three Sixty West (Oasis Realty) Commerz II 4 additional floors leased (~ 1 lakh sq.ft. GLA) Achieved annual gross
Key Developments Received approval for additional residential area of ~5.30 lakh sq.ft. in Three Sixty West (Oasis Realty) Commerz II 4 additional floors leased (~ 1 lakh sq.ft. GLA) Achieved annual gross
Oberoi Realty (OBEREA) 398
 398") Result Update Rating matrix Rating : Hold Target : 385 Target Period : 12 months Potential Upside : -3% What s Changed? Target Changed from 333 to 385 EPS FY18E Changed from 26.3 to 25.9 EPS FY18E Introduced
Result Update Rating matrix Rating : Hold Target : 385 Target Period : 12 months Potential Upside : -3% What s Changed? Target Changed from 333 to 385 EPS FY18E Changed from 26.3 to 25.9 EPS FY18E Introduced
Oberoi Realty (OBEREA) 343
 343") Result Update Rating matrix Rating : Hold Target : 375 Target Period : 12 months Potential Upside : 9% What s Changed? Target Changed from 340 to 375 EPS FY17E Changed from 12.1 to 12.0 EPS FY18E Changed
Result Update Rating matrix Rating : Hold Target : 375 Target Period : 12 months Potential Upside : 9% What s Changed? Target Changed from 340 to 375 EPS FY17E Changed from 12.1 to 12.0 EPS FY18E Changed
Nirlon Ltd BSE Scrip Code:
 Nirlon Ltd BSE Scrip Code: 500307 Misc. Commercial Services September 14, 2012 Equity Statistics Current Market Price Rs. 44.5 52 Week High / Low Rs. 61.75/30.50 Market Capitalisation Rs. crores 319.7
PBT Crosses Milestone of Rs. 2 Billion
 BUSINESS UPDATE PBT Crosses Milestone of Rs. 2 Billion Op. EBITDA margin at 23.1%, Adj. Op. EBITDA Margin at 24.7% Net Debt / Op. EBITDA at 1.75x Christy sales growth at 35% YoY Mumbai, Jan 31, 2017: Welspun
S R K Industries Ltd. BSE Scrip Code:
 S R K Industries Ltd. BSE Scrip Code: 531307 Textiles March 15, 2013 Equity Statistics Current Market Price Rs. 28.4 52 Week High/Low Rs. 32.65/2.90 Market Capitalisation Rs. Crores 10.71 Free Float Rs.
Company Overview. Financial Performance
 Dec-14 Jan-15 Feb-15 Mar-15 Apr-15 May-15 Jun-15 Jul-15 Aug-15 Sep-15 Oct-15 Nov-15 Nimbus Projects Limited CMP: 34. December 4, 15 Stock Details BSE code 511714 BSE ID NIMBSPROJ Face value ( ) 1 No of
Indiabulls Real Estate Limited (CIN : L45101DL2006PLC148314)
") Indiabulls Real Estate Limited (CIN : L45101DL2006PLC148314) Earnings Update Unaudited Financial Results Q1 FY 2016-17 10 th August, 2016 Safe Harbour Statement This document contains certain forward looking
Indiabulls Real Estate Limited (CIN : L45101DL2006PLC148314) Earnings Update Unaudited Financial Results Q1 FY 2016-17 10 th August, 2016 Safe Harbour Statement This document contains certain forward looking
Launch momentum picks up
 INDUSTRY REAL ESTATE CMP (as on 9 Jan 2015) Rs 269 Target Price Rs 328 Nifty 8,285 Sensex 27,458 KEY STOCK DATA Bloomberg/Reuters OBER IN/OEBO.BO No. of Shares (mn) 328 MCap (Rs bn) / ($ mn) 88 / 1,416
Financial Data Report ROGERS AND COMPANY LIMITED (THE GROUP) for the period ending 31.Dec.2017
 for the period ending 31.Dec.2017") Financial Data Report ROGERS AND COMPANY LIMITED (THE GROUP) for the period ending 31.Dec.2017 Equity Statistics Particulars Units 29-Dec-17 Current Market Price MUR 31.30 52 week H/L* MUR 33.00 / 27.00
Financial Data Report ROGERS AND COMPANY LIMITED (THE GROUP) for the period ending 31.Dec.2017 Equity Statistics Particulars Units 29-Dec-17 Current Market Price MUR 31.30 52 week H/L* MUR 33.00 / 27.00
Financial Data Report CIEL LTD (THE GROUP) for the period ending 31.Dec.2017
 for the period ending 31.Dec.2017") Financial Data Report CIEL LTD (THE GROUP) for the period ending 31.Dec.2017 Equity Statistics Particulars Units 29-Dec-17 Current Market Price MUR 7.14 52 week H/L* MUR 7.94 / 6.26 Market Capitalisation
Financial Data Report CIEL LTD (THE GROUP) for the period ending 31.Dec.2017 Equity Statistics Particulars Units 29-Dec-17 Current Market Price MUR 7.14 52 week H/L* MUR 7.94 / 6.26 Market Capitalisation
Financial Data Report LOTTOTECH LIMITED. for the period ending 30.Jun.2017
 Financial Data Report LOTTOTECH LIMITED for the period ending 30.Jun.2017 Equity Statistics Particulars Units 31-Jul-17 Current Market Price MUR 5.90 52 week H/L* MUR 6.50 / 4.02 Market Capitalisation
Financial Data Report LOTTOTECH LIMITED. for the period ending 30.Jun.2018
 Financial Data Report LOTTOTECH LIMITED for the period ending 30.Jun.2018 Equity Statistics Particulars Units 29-Jun-18 Current Market Price MUR 9.72 52 week H/L* MUR 9.88 / 5.66 Market Capitalisation
Financial Data Report LOTTOTECH LIMITED. for the period ending 31.Dec.2017
 Financial Data Report LOTTOTECH LIMITED for the period ending 31.Dec.2017 Equity Statistics Particulars Units 29-Dec-17 Current Market Price MUR 7.30 52 week H/L* MUR 9.12 / 5.28 Market Capitalisation
NOW ON APP Research at your finger tips
 NOW ON APP Research at your finger tips 15 FEB 2018 Quarterly Update BUY Target Price: Rs 470 ODC project takes breather; to rebound in Q4 Q3 pre-sales declined QoQ to Rs 1 bn (Rs 1.7 bn in Q2) on lower
Financial Data Report SUN LIMITED (THE GROUP) for the period ending 31.Mar.2017
 for the period ending 31.Mar.2017") Financial Data Report SUN LIMITED (THE GROUP) for the period ending 31.Mar.2017 Equity Statistics Particulars Units 31-Mar-17 Current Market Price MUR 40.00 52 week H/L* MUR 40.00 / 32.80 Market Capitalisation
Financial Data Report SUN LIMITED (THE GROUP) for the period ending 31.Mar.2017 Equity Statistics Particulars Units 31-Mar-17 Current Market Price MUR 40.00 52 week H/L* MUR 40.00 / 32.80 Market Capitalisation
Financial Data Report ROGERS AND COMPANY LIMITED (THE GROUP) for the period ending 31.Dec.2015
 for the period ending 31.Dec.2015") Financial Data Report (THE GROUP) for the period ending 31.Dec.2015 INVESTMENT Equity Statistics Particulars Units 31-Mar-16 Current Market Price MUR 27.75 52 week H/L* MUR 32.50 / 26.90 Market Capitalisation
Financial Data Report (THE GROUP) for the period ending 31.Dec.2015 INVESTMENT Equity Statistics Particulars Units 31-Mar-16 Current Market Price MUR 27.75 52 week H/L* MUR 32.50 / 26.90 Market Capitalisation
Cummins India Ltd Bloomberg Code: KKC IN
 Company Update Margins Under Pressure; Domestic Recovery Underway Half-yearly revenue was flat; margins were under pressure: Cummins India revenue, EBITDA and PAT for H1FY17 reached to Rs.24,784mn, Rs.4,649mn
RESULTS PRESENTATION Q3FY11
 RESULTS PRESENTATION Q3FY11 CONTENTS 1. HIGHLIGHTS 2.BUSINESS WISE PERFORMANCE 3.WAY FORWARD 4.FINANCIAL RESULTS 2 DISCLAIMER 1. Statements in this Presentation describing the Company s objectives, projections,
Financial Data Report CIEL LTD (THE GROUP) for the period ending 31.Dec.2016
 for the period ending 31.Dec.2016") Financial Data Report CIEL LTD (THE GROUP) for the period ending 31.Dec.2016 Equity Statistics Particulars Units 30-Dec-16 Current Market Price MUR 6.30 52 week H/L* MUR 6.60 / 5.86 Market Capitalisation
Financial Data Report CIEL LTD (THE GROUP) for the period ending 31.Dec.2016 Equity Statistics Particulars Units 30-Dec-16 Current Market Price MUR 6.30 52 week H/L* MUR 6.60 / 5.86 Market Capitalisation
Financial & Business Highlights For the Year Ended June 30, 2017
 Financial & Business Highlights For the Year Ended June, 17 17 16 15 14 13 12 Profit and Loss Account Operating Revenue 858 590 648 415 172 174 Investment gains net 5 162 909 825 322 516 Other 262 146
Financial Data Report Cim Financial Services Limited (THE GROUP) for the period ending 31.Dec.2017
 for the period ending 31.Dec.2017") Financial Data Report Cim Financial Services Limited (THE GROUP) for the period ending 31.Dec.2017 Equity Statistics Particulars Units 29-Dec-17 Current Market Price MUR 10.05 52 week H/L* MUR 10.50 /
Financial Data Report Cim Financial Services Limited (THE GROUP) for the period ending 31.Dec.2017 Equity Statistics Particulars Units 29-Dec-17 Current Market Price MUR 10.05 52 week H/L* MUR 10.50 /
Fineotex Chemical Ltd
 Company Update Decent Performance under Macroeconomic Pressure; Business Traction to Continue: Fineotex Chemical recorded decent set of result as consolidated sales grew by 1.1% YoY (largely in line) to
Company Overview. Industry Overview. Financial Performance
 Feb/15 Mar/15 Apr/15 May/15 Jun/15 Jul/15 Aug/15 Sep/15 Oct/15 Nov/15 Dec/15 Jan/16 Trade Wings Limited CMP: 105.00 January 29, 2016 Stock Details BSE code 509953 BSE ID TRADWIN Face value ( ) 10 No of
Financial Data Report IBL Limited (THE GROUP) for the period ending 31.Mar.2017
 for the period ending 31.Mar.2017") Financial Data Report IBL Limited (THE GROUP) for the period ending 31.Mar.2017 Equity Statistics Particulars Units 31-Mar-17 Current Market Price MUR 39.65 52 week H/L* MUR 125.00 / 27.20 Market Capitalisation
Financial Data Report IBL Limited (THE GROUP) for the period ending 31.Mar.2017 Equity Statistics Particulars Units 31-Mar-17 Current Market Price MUR 39.65 52 week H/L* MUR 125.00 / 27.20 Market Capitalisation
Amber Enterprises India Ltd
 3QFY2019 Result Update Consumer Durable February 16, 2019 Amber Enterprises India Ltd Performance Update (` cr) 3QFY19 3QFY18 % yoy 2QFY19 % qoq Revenue 388.8 338.4 14.9 226.3 71.8 EBITDA 22.1 24.1 (8.2)
Visaka Industries Ltd
 Company Update Superior Product Mix & New Age Markets to Aid Growth New investments to aid growth: Visaka continues to give a good set of numbers. YoY EPS grew at 142% aided by a revenue growth of 1.5%
Financial Data Report CAUDAN DEVELOPMENT LIMITED (THE GROUP) for the period ending 31.Mar.2016
 for the period ending 31.Mar.2016") Financial Data Report (THE GROUP) for the period ending 31.Mar.2016 INVESTMENTS Equity Statistics Particulars Units 31-Mar-16 Current Market Price MUR 1.22 52 week H/L* MUR 1.40 / 1.17 Market Capitalisation
Financial Data Report (THE GROUP) for the period ending 31.Mar.2016 INVESTMENTS Equity Statistics Particulars Units 31-Mar-16 Current Market Price MUR 1.22 52 week H/L* MUR 1.40 / 1.17 Market Capitalisation
Financial Data Report LUX ISLAND RESORTS LIMITED (THE GROUP) for the period ending 30.Jun.2015
 for the period ending 30.Jun.2015") Financial Data Report LUX ISLAND RESORTS LIMITED (THE GROUP) for the period ending 30.Jun.2015 Equity Statistics Particulars Units 15-Sep-15 Current Market Price MUR 62.50 52 week H/L* MUR 63.50 / 51.00
Financial Data Report LUX ISLAND RESORTS LIMITED (THE GROUP) for the period ending 30.Jun.2015 Equity Statistics Particulars Units 15-Sep-15 Current Market Price MUR 62.50 52 week H/L* MUR 63.50 / 51.00
BDH Industries Limited BSE Scrip Code:
 BDH Industries Limited BSE Scrip Code: 524828 Pharmaceuticals October 23, 2012 Equity Statistics Current Market Price Rs. 16.95 52 Week High/Low Rs. 21.00/13.15 Market Capitalisation Rs. Crores 9.76 Free
Company Overview. Financial Performance
 Feb/15 Mar/15 Apr/15 May/15 Jun/15 Jul/15 Aug/15 Sep/15 Oct/15 Nov/15 Dec/15 Jan/16 CMP: 32.30 February 11, 2016 Stock Details BSE code 526558 BSE ID JAMEHOT Face value ( ) 10 No of shares (m) 8.0 52 week
Building Pride. Building Joy. RESULT PRESENTATION Q2 FY17 26 th October,
 Building Pride. Building Joy. RESULT PRESENTATION Q2 FY17 26 th October, 2016 1 Key Developments Operations New Sales MIS Sales for Q2 FY17 is Rs. 1194 lacs across projects Project Completion Till date
Ansal Properties & Infrastructure Ltd. Investors Update Q2 FY 14 November 14 th, 2013
 Ansal Properties & Infrastructure Ltd. Investors Update Q2 FY 14 November 14 th, 2013 Synopsis Operational Metrics 4.56 Particulars UOM H1FY14 H1FY13 FY13 Area Sold mn.sq.ft. 8.05 8.66 20.37 Sale Value
XML Publisher Balance Sheet Vision Operations (USA) Feb-02
 Feb-02") Page:1 Apr-01 May-01 Jun-01 Jul-01 ASSETS Current Assets Cash and Short Term Investments 15,862,304 51,998,607 9,198,226 Accounts Receivable - Net of Allowance 2,560,786
Page:1 Apr-01 May-01 Jun-01 Jul-01 ASSETS Current Assets Cash and Short Term Investments 15,862,304 51,998,607 9,198,226 Accounts Receivable - Net of Allowance 2,560,786
Aditya Gears Ltd. BSE Scrip Code:
 Aditya Gears Ltd. BSE Scrip Code: 53677 Auto Parts & Equipment March 5, 23 Last Traded Price* Rs. 52 Week High/Low Rs. Market Capitalisation* Free Float Dividend Yield % One Year Regression Beta Equity
Exchange Board of lndin (L1stmg Obliga.tions und Disclosure Requirements) Regulations, 2015
 Regulations, 2015") NIRLON LIMITED 'Nes:ern Express H1ghwa)' Goregaon (E). Mumbai - 400 063 T, 91-22-4028 1919 / 2685 2256-59. F +91-22-4028 1940 www mrlonltd com, Email.info(a'.mrlonltd.com GIN L 17120 MH 1958PLC 011045
NIRLON LIMITED 'Nes:ern Express H1ghwa)' Goregaon (E). Mumbai - 400 063 T, 91-22-4028 1919 / 2685 2256-59. F +91-22-4028 1940 www mrlonltd com, Email.info(a'.mrlonltd.com GIN L 17120 MH 1958PLC 011045
RAJESH EXPORTS LIMITED GLOBAL PRESENCE IN GOLD AND GOLD PRODUCTS. Earnings Presentation - FY16
 RAJESH EXPORTS LIMITED GLOBAL PRESENCE IN GOLD AND GOLD PRODUCTS Earnings Presentation - FY16 HIGHLIGHT FOR THE QUARTER Posted record REVENUE, EBITDA and PAT for the year 2015-16. Consolidated position
Company Overview. Financial Performance
 Apr/15 May/15 Jun/15 Jul/15 Aug/15 Sep/15 Oct/15 Nov/15 Dec/15 Jan/16 Feb/16 Mar/16 Monarch Networth Capital Limited CMP: 26.00 March 23, 2016 Stock Details BSE code 511551 BSE ID MONARCH Face value (
Bharat Forge. Result Update. Q4FY13 Result Highlights. Valuation. No Respite in Sight May 29, Institutional Research 1
 [ Result Update Equity India Forging & Industrials Bharat Forge Ltd. No Respite in Sight May 29, 2013 CMP (`) Target (`) 241 238 Potential Upside Absolute Rating (1.24)% HOLD Market Info (as on May 28,
Shalimar Wires Industries Ltd. BSE Scrip Code:
 Shalimar Wires Industries Ltd. BSE Scrip Code: 532455 Paper Machine Clothing and EMD Wires October 15, 2012 Equity Statistics Current Market Price Rs. 7.61 52 Week High/Low Rs. 14.00/6.72 Market Capitalisation
Volant Textile Mills Ltd BSE Scrip Code:
 Volant Textile Mills Ltd BSE Scrip Code: 531865 Textiles October 09, 2012 Equity Statistics Current Market Price Rs. 3.11 52 Week High/Low Rs. 3.55/1.34 Market Capitalisation Rs. Crores 23.31 Free Float
Royal India Corporation Limited BSE Scrip Code:
 Royal India Corporation Limited BSE Scrip Code: 512047 Other Apparels & Accessories September 13, 2012 Equity Statistics Current Market Price Rs. 78.1 52 Week High / Low Rs. 97.9/58.5 Market Capitalisation
Financial Data Report VIVO ENERGY MAURITIUS LIMITED. for the period ending 30.Sep.2015
 Financial Data Report for the period ending 30.Sep.2015 INDUSTRY Equity Statistics Particulars Units 15-Sep-15 Current Market Price MUR 116.50 52 week H/L* MUR 140.00 / 116.50 Market Capitalisation MUR
Marico Kaya BUY RESULTS REVIEW 4QFY15 29 APR 2015
 RESULTS REVIEW 4QFY15 29 APR 2015 Marico Kaya INDUSTRY FMCG CMP (as on 28 Apr 2015) Rs 1,635 Target Price Rs 1,823 Nifty 8,240 Sensex 27,226 KEY STOCK DATA Bloomberg MAKA IN No. of Shares (mn) 13 MCap
Company Overview. Financial Performance
 Feb/15 Mar/15 Apr/15 May/15 Jun/15 Jul/15 Aug/15 Sep/15 Oct/15 Nov/15 Dec/15 Jan/16 Eastern Treads Ltd CMP: 91.20 February 11, 2016 Stock Details BSE code 531346 BSE ID EASTRED Face value ( ) 10 No of
Larsen & Toubro Ltd.
 Feb-17 Mar-17 Apr-17 May-17 Jun-17 Jul-17 Aug-17 Sep-17 Oct-17 Nov-17 Dec-17 Jan-18 Feb-18 Volume No.. III Issue No. 163. Larsen & Toubro Ltd. February 26, 2018 BSE Code: 500510 NSE Code: LT Reuters Code:
AVANTI FEEDS LIMITED-Schedule of Audio Conference Call for Investors on * * *
 1Avanti a 1 Feeds Limited Aiding Sustainability & Reliability to Aquaculture Ref: AFL/BSE & NSE/2018-19/ 16 1 h November, 2018 The Deputy General Manager BSE, Limited Corporate Relation Department 1st
Company Overview. Industry Overview. Financial Performance
 Jan/15 Feb/15 Mar/15 Apr/15 May/15 Jun/15 Jul/15 Aug/15 Sep/15 Oct/15 Nov/15 Dec/15 CMP: 27.80 January 20, 2016 Stock Details BSE code 534623 BSE ID JUPITERIN Face value ( ) 10 No of shares (m) 10 52 week
Ahluwalia Contracts (India)
") May-14 Jul-14 Aug-14 Sep-14 Oct-14 Dec-14 Jan-15 Feb-15 Apr-15 May-15 India Research Infrastructure May 22, 215 QUARTERLY REVIEW Bloomberg: AHLU IN Reuters: AHLU.BO BUY Better performance ahead ACIL posted
May-14 Jul-14 Aug-14 Sep-14 Oct-14 Dec-14 Jan-15 Feb-15 Apr-15 May-15 India Research Infrastructure May 22, 215 QUARTERLY REVIEW Bloomberg: AHLU IN Reuters: AHLU.BO BUY Better performance ahead ACIL posted
Financial Data Report CIEL LTD (THE GROUP) for the period ending 30.Jun.2015
 for the period ending 30.Jun.2015") Financial Data Report CIEL LTD (THE GROUP) for the period ending 30.Jun.2015 Equity Statistics Particulars Units 15-Sep-15 Current Market Price MUR 6.76 52 week H/L* MUR 7.80 / 6.70 Market Capitalisation
Financial Data Report CIEL LTD (THE GROUP) for the period ending 30.Jun.2015 Equity Statistics Particulars Units 15-Sep-15 Current Market Price MUR 6.76 52 week H/L* MUR 7.80 / 6.70 Market Capitalisation
Consolidated Sales (Cr) Growth EBITDA (Cr) Margin PAT Margin EPS (Rs) P/E RoE
 Growth EBITDA (Cr) Margin PAT Margin EPS (Rs) P/E RoE") Aug-17 Sep-17 Oct-17 Nov-17 Dec-17 Jan-18 Feb-18 Mar-18 Apr-18 May-18 Jun-18 Jul-18 Aug-18 2904 Recommendation CMP Target Price BUY Rs. 312 Rs. 443 Better times ahead! reported a good set of numbers in
Aug-17 Sep-17 Oct-17 Nov-17 Dec-17 Jan-18 Feb-18 Mar-18 Apr-18 May-18 Jun-18 Jul-18 Aug-18 2904 Recommendation CMP Target Price BUY Rs. 312 Rs. 443 Better times ahead! reported a good set of numbers in
Financial Data Report SBM HOLDINGS LIMITED (THE GROUP) for the period ending 31.Dec.2016
 for the period ending 31.Dec.2016") Financial Data Report SBM HOLDINGS LIMITED (THE GROUP) for the period ending 31.Dec.2016 Equity Statistics Particulars Units 30-Dec-16 Current Market Price MUR 6.64 52 week H/L* MUR 7.00 /.63 Market Capitalisation
Financial Data Report SBM HOLDINGS LIMITED (THE GROUP) for the period ending 31.Dec.2016 Equity Statistics Particulars Units 30-Dec-16 Current Market Price MUR 6.64 52 week H/L* MUR 7.00 /.63 Market Capitalisation
Indian Oil Corporation Ltd.
 Sep-16 Oct-16 Nov-16 Dec-16 Jan-17 Feb-17 Mar-17 Apr-17 May-17 Jun-17 Jul-17 Aug-17 Sep-17 s. Indian Oil Corporation Ltd.. October 25, 217 BSE Code: 53965 NSE Code: IOC Reuters Code: IOC.NS Bloomberg Code:
THE PHOENIX MILLS LIMITED. Quarterly Earnings Update, Q3-FY2012 January 23, 2012
 THE PHOENIX MILLS LIMITED Quarterly Earnings Update, Q3-FY2012 January 23, 2012 Table of contents Section Slide No. About The Phoenix Mills Limited 3 Group Highlights 4 Financial Update 5 Highlights during
How much will your current lifestyle cost at 60?
 (MODERATE PLAN) How much will your current lifestyle cost at 60? DATE OF ALLOTMENT November 01,2011 BENCHMARK CRISIL Hybrid 25+75 - Aggressive Index (WEF From 1st February 2018) FUND SIZE: Rs.733.18 (Rs.
Everest Kanto Cylinder Ltd.
 Industrial Goods CMP Rs. 82 August 16, 2011 BSE Code 532684 BSE ID EKC High/Low 1Y (Rs.) 133 / 68 Avg. vol (3m) 98,219 Market Cap (Rs Cr) 879 Net IB Debt (Rs Cr) 286 Enterprise value(rs Cr) 1,166 Shareholding
Equity Statistics Current Market Price Rs Week High/Low Rs /9.01 Market Capitalisation Rs. Crores Dividend Yield %
 MILTON PLASTICS LTD BSE Scrip Code: 526143 Containers & Packaging March 14, 2013 Equity Statistics Current Market Price Rs. 9.7 52 Week High/Low Rs. 15.81/9.01 Market Capitalisation Rs. Crores 12.13 Free
Q4 & FY18 Analyst Presentation. May 21, 2018
 Q4 & FY18 Analyst Presentation May 21, 2018 1 SAFE HARBOUR This presentation contains certain forward looking statements concerning DLF s future business prospects and business profitability, which are
JSW Energy Limited. Q2 FY 2016 Results Presentation October 28, 2015
 JSW Energy Limited Q2 FY 2016 Results Presentation October 28, 2015 Agenda Business Environment Operational and Financial Performance Status updates 2 Capacity profile and PLF s Sector-wise Installed Capacity
BHEL SELL RESULTS REVIEW 1QFY15 13 AUG CMP (as on 12 Aug 2014) Rs 224 Target Price Rs 188
 Rs 224 Target Price Rs 188") RESULTS REVIEW 1QFY15 13 AUG 2014 BHEL SELL INDUSTRY CAPITAL GOODS CMP (as on 12 Aug 2014) Rs 224 Target Price Rs 188 Nifty 7,727 Sensex 25,881 KEY STOCK DATA Bloomberg/Reuters BHEL IN/BHEL.BO No. of Shares
RESULTS REVIEW 1QFY15 13 AUG 2014 BHEL SELL INDUSTRY CAPITAL GOODS CMP (as on 12 Aug 2014) Rs 224 Target Price Rs 188 Nifty 7,727 Sensex 25,881 KEY STOCK DATA Bloomberg/Reuters BHEL IN/BHEL.BO No. of Shares
Participate in one of the key drivers of Growth & Development in India
 Participate in one of the key drivers of Growth & Development in India DATE OF ALLOTMENT December 28, 2015 BENCHMARK Nifty Financial Services TRI (WEF From 1st February 2018) FUND SIZE Rs.261.73 (Rs. in
Exide Industries BUY. Auto Components February 03, Volume Recovery & Cost Saving to Cushion Margins RESULT UPDATE
 Feb-14 Mar-14 Apr-14 Jun-14 Jul-14 Aug-14 Oct-14 Nov-14 Dec-14 Jan-15 Institutional Equities India Research Auto Components February 03, 2015 RESULT UPDATE Bloomberg: EXID IN Reuters: EXID.BO BUY Volume
Blue Star Ltd BUY. Performance Update. CMP Target Price `703 `867. 1QFY2019 Result Update Cons. Durable. 3-year price chart.
 Aug-15 Oct-15 Dec-15 Feb-16 Apr-16 Jun-16 Aug-16 Oct-16 Dec-16 Jan-17 Apr-17 May-17 Jul-17 Sep-17 Nov-17 Jan-18 Mar-18 May-18 Jul-18 1QFY2019 Result Update Cons. Durable August 10, 2018 Blue Star Ltd Performance
Investor Update. For the year and quarter ending 31 st March,
 Investor Update For the year and quarter ending 31 st March, 2015 BSE: 523716 NSE: ASHIANA Bloomberg: ASFI:IN Reuters: AHFN.NS www.ashianahousing.com 2014, Ashiana Housing Limited. All Rights Reserved.
Near-term pressure, but long-term outlook positive
 INDUSTRY IT CMP (as on 2 Nov 2015) Rs 1,812 Target Price Rs 2,050 Nifty 8,051 Sensex 26,559 KEY STOCK DATA Bloomberg ECLX IN No. of Shares (mn) 30 MCap (Rs bn) / ($ mn) 55/843 6m avg traded value (Rs mn)
SQS India BFSI Ltd HOLD. Impact of Macro Headwinds Still Hurting; Revenue from US May Pick up in FY18E
 Company Update Impact of Macro Headwinds Still Hurting; Revenue from US May Pick up in FY18E EBITDA Margins recovered by 618 bps QoQ: The company has witnessed many challenges over the year FY17 starting
How much will your current lifestyle cost at 60?
 (PROGRESSIVE PLAN) How much will your current lifestyle cost at 60? DATE OF ALLOTMENT November 01, 2011 BENCHMARK S&P BSE Sensex TRI (WEF From 1st February 2018) FUND SIZE Rs.547.64 (Rs. in Cr.) MONTHLY
Hathway Cable and Datacom Limited Investor Update Q2-FY18
 Hathway Cable and Datacom Limited Investor Update Q2-FY18 Safe Harbour The information contained in this presentation is only current as of its date. All actions and statements made herein or otherwise
HOLD. Deleveraging story playing out RAMCO CEMENTS. Target Price: Rs 503. Q4 performance
 RAMCO S HOLD Target Price: Rs 503 Deleveraging story playing out Ramco Cements total debt reduced by a massive Rs 5 bn to Rs 22 bn in FY16. The company generated total EBITDA of Rs 11.5 bn in FY16 and
Company Overview. Financial Performance
 Jan-15 Feb-15 Mar-15 Apr-15 May-15 Jun-15 Jul-15 Aug-15 Sep-15 Oct-15 Nov-15 Dec-15 Jan-16 Shri Jagdamba Polymers Ltd. CMP: 44.2 January 15, 216 Stock Details BSE code 512453 BSE ID SHRJAGP Face value
How much will your current lifestyle cost at 60?
 (MODERATE PLAN) How much will your current lifestyle cost at 60? DATE OF ALLOTMENT November 01,2011 BENCHMARK CRISIL Hybrid 25+75 - Aggressive Index (WEF From 1st February 2018) FUND SIZE: Rs.856.45 (Rs.
Narnolia Securities Ltd. ADITYA GUPTA 15-Feb-18
 Feb-17 Mar-17 Apr-17 May-17 Jun-17 Jul-17 Aug-17 Sep-17 Oct-17 Nov-17 Dec-17 Jan-18 Feb-18 15-Feb-18 INDUSTRY - Bloomberg Code: Gas Distribution MAHGL IN BSE Code - 539957 NSE Code - MGL NIFTY - 10500
BALKRISHNA INDUSTRIES LTD
 Jan-15 Feb-15 Mar-15 Apr-15 May-15 Jun-15 Jul-15 Aug-15 Sep-15 Oct-15 Nov-15 Dec-15 Jan-16 BALKRISHNA INDUSTRIES LTD 8888888888888888888888888888888888888888888888888888888888888888888s.. January19, 2016
APOLLO TYRES LTD. October 19 th, CMP (Rs.) 194. Key Developments
 194. Key Developments") Oct-14 Nov-14 Dec-14 Jan-15 Feb-15 Mar-15 Apr-15 May-15 Jun-15 Jul-15 Aug-15 Sep-15 Oct-15 s. APOLLO TYRES LTD.. October 19 th, 2015 BSE Code: 500877 NSE Code: APOLLOTYRE Reuters Code: APLO.NS Bloomberg
Oct-14 Nov-14 Dec-14 Jan-15 Feb-15 Mar-15 Apr-15 May-15 Jun-15 Jul-15 Aug-15 Sep-15 Oct-15 s. APOLLO TYRES LTD.. October 19 th, 2015 BSE Code: 500877 NSE Code: APOLLOTYRE Reuters Code: APLO.NS Bloomberg
Indiabulls Real Estate Limited
 Indiabulls Real Estate Limited Earnings Update Financial Results Q1 FY 2013-14 July 24, 2013 Safe Harbor Statement This document contains certain forward-looking statements based on current expectations
Religare Technologies Ltd BSE Scrip Code:
 Religare Technologies Ltd BSE Scrip Code: 533525 IT Consulting & Software October 15, 2012 Equity Statistics Current Market Price Rs. 17.05 52 Week High/Low Rs. 44.90/13.70 Market Capitalisation Rs. Crores
How much will your current lifestyle cost at 60?
 (PROGRESSIVE PLAN) How much will your current lifestyle cost at 60? DATE OF ALLOTMENT November 01, 2011 BENCHMARK S&P BSE Sensex TRI (WEF From 1st February 2018) FUND SIZE Rs.467.54 (Rs. in Cr.) MONTHLY
Kalpataru Power. Rating: Target price: EPS: Rating CMP. Target BUY. Rs Rs.256
 : price: EPS: How does our one year outlook change? We expect KPP s revenue (standalone) to grow by 21% y-o-y in FY17E backed by an order book of Rs. 91bn (1.7x FY17E book-to-bill). Both Transmission line
Glance Finance Ltd. Other Financial Services. . Company Overview. Company Fundamentals. Key Strengths. CMP Rs BSE Code BSE ID
 Other Financial Services Nov 15, 2012 CMP Rs. 19.55 BSE Code 531199 BSE ID GLANCE High/Low 1Y (Rs.) 35.15/ 16.55 Average Volume (3M) 279 Market Cap (Rs. Cr.) 6 Shareholding % Sep-12 Jun-12 Promoters 74.83
Hawkins Cookers Ltd BSE Scrip Code:
 Hawkins Cookers Ltd BSE Scrip Code: 508486 Houseware September 05, 2012 Equity Statistics Current Market Price Rs. 1,667.5 52 Week High / Low Rs. 1759.9/1215 Market Capitalisation Rs. crores 881.7 Free
Adani Ports & SEZ Rating: Target price: EPS:
 Adani Ports & SEZ : price: EPS: Volume traction continues in a seasonally good quarter; maintain Adani Ports & SEZ reported a good quarter with total operating revenues (standalone) of Rs. 8.02bn and PAT
How much will your current lifestyle cost at 60?
 (PROGRESSIVE PLAN) How much will your current lifestyle cost at 60? DATE OF ALLOTMENT November 01, 2011 BENCHMARK S&P BSE Sensex TRI (WEF From 1st February 2018) FUND SIZE Rs.474.87 (Rs. in Cr.) MONTHLY
BUY. Efforts on cost cutting paying off RAMCO CEMENTS. Target Price: Rs 435. Key highlights. Key drivers FY15 FY16E FY17E
 RAMCO S BUY Target Price: Rs 435 Efforts on cost cutting paying off Q2 EBITDA at Rs 2.8 bn (up 30% YoY) was ahead of our estimates due to lower-than-expected costs. Average costs (excluding freight) declined
Company Overview. Financial Performance
 Dec-14 Jan-15 Feb-15 Mar-15 Apr-15 May-15 Jun-15 Jul-15 Aug-15 Sep-15 Oct-15 Nov-15 CMP: 25.20 December 30, 2015 Stock Details BSE code 524440 BSE ID CAMEXLTD Face value ( ) 10 No of shares (m) 10.2 52
IST Ltd BSE Scrip Code:
 IST Ltd BSE Scrip Code: 508807 Other Apparels & Accessories September 13, 2012 Equity Statistics Current Market Price Rs. 170.3 52 Week High / Low Rs. 209/124 Market Capitalisation Rs. crores 98.7 Free
Reliance Industries. Timing is everything BUY COMPANY UPDATE 1 OCT 2014
 INDUSTRY OIL & GAS Timing is everything COMPANY UPDATE 1 OCT 2014 Reliance Industries BUY CMP (as on 30 Sep 2014) Rs 945 Target Price Rs 1,100 Nifty 7,965 Sensex 26,631 KEY STOCK DATA Bloomberg/Reuters
THE B E A CH TO WN S O F P ALM B EA CH
 THE B E A CH TO WN S O F P ALM B EA CH C OU N T Y F LO R I D A August www.luxuryhomemarketing.com PALM BEACH TOWNS SINGLE-FAMILY HOMES LUXURY INVENTORY VS. SALES JULY Sales Luxury Benchmark Price : 7,
Financial Data Report MCB GROUP LIMITED (THE GROUP) for the period ending 31.Dec.2015
 for the period ending 31.Dec.2015") Financial Data Report MCB GROUP LIMITED (THE GROUP) for the period ending 31.Dec.2015 Equity Statistics Particulars Units 31-Mar-16 Current Market Price MUR 205.75 52 week H/L* MUR 225.00 / 197.75 Market
Financial Data Report MCB GROUP LIMITED (THE GROUP) for the period ending 31.Dec.2015 Equity Statistics Particulars Units 31-Mar-16 Current Market Price MUR 205.75 52 week H/L* MUR 225.00 / 197.75 Market
Praj Industries (PRAIN)
") Result Update October 18, 211 Rating matrix Rating : Buy Target : 96 Target Period : 12-15 months Potential Upside : 25% WHAT S CHANGED Praj Industries (PRAIN) 77 Key Financials Crore FY1 FY11 FY12E FY13E
Result Update October 18, 211 Rating matrix Rating : Buy Target : 96 Target Period : 12-15 months Potential Upside : 25% WHAT S CHANGED Praj Industries (PRAIN) 77 Key Financials Crore FY1 FY11 FY12E FY13E
Ramco Cement. Rating: Target price: EPS: Rating CMP. Target BUY. Rs.415. Rs. 360
 : price: EPS: How does our one year outlook change? We maintain our positive stance on s (TRCL). The company is one of the largest cement producers in South and remains among the best plays on Southern
Indiabulls Real Estate Limited. Unaudited Financial Results Q3 FY th January, 2017
 Indiabulls Real Estate Limited Unaudited Financial Results Q3 FY 2016-17 25 th January, 2017 Safe Harbour Statement This document contains certain forward looking statements based on current expectations
Inox Wind BUY. Performance Highlights. CMP Target Price `242 `286. 4QFY2016 Result Update Capital Goods. 3 year price chart
 4QFY216 Result Update Capital Goods May 11, 216 Inox Wind Performance Highlights Quarterly Data (Consolidated) ( ` cr) 4QFY16 4QFY15 % chg (yoy) 3QFY16 % chg (qoq) Total Income 1,829 93 96.6 941 94.2 EBITDA
(Rs. in Lacs) Statement of Unaudited Standalone Financial Results for the Quarter Ended on June 30, 2017 Quarter Ended Sr.
 Statement of Unaudited Standalone Financial Results for the Quarter Ended on June 30, 2017 Quarter Ended Sr.") (Rs. in Lacs) Statement of Unaudited Standalone Financial Results for the on June 30, 2017 1 Income a. Revenue from operations 12,975 15,260 b. Other Income 1,265 535 Total Revenue 14,240 15,795 2 Expenses
(Rs. in Lacs) Statement of Unaudited Standalone Financial Results for the on June 30, 2017 1 Income a. Revenue from operations 12,975 15,260 b. Other Income 1,265 535 Total Revenue 14,240 15,795 2 Expenses
Company Overview. Financial Performance
 Jan/15 Feb/15 Mar/ Apr/15 May/ Jun/15 Jul/15 Aug/15 Sep/15 Oct/15 Nov/ Dec/15 Parnax Lab Limited CMP: 53.90 January 08, 2016 Stock Details BSE code 506128 BSE ID PARNAXLAB Face value ( ) 10 No of shares
Financial Data Report SBM HOLDINGS LIMITED (THE GROUP) for the period ending 30.Jun.2017
 for the period ending 30.Jun.2017") Financial Data Report SBM HOLDINGS LIMITED (THE GROUP) for the period ending 30.Jun.2017 Equity Statistics Particulars Units 31-Jul-17 Current Market Price MUR 7.66 52 week H/L* MUR 8.00 /.67 Market Capitalisation
Financial Data Report SBM HOLDINGS LIMITED (THE GROUP) for the period ending 30.Jun.2017 Equity Statistics Particulars Units 31-Jul-17 Current Market Price MUR 7.66 52 week H/L* MUR 8.00 /.67 Market Capitalisation
Financial Data Report MCB GROUP LIMITED (THE GROUP) for the period ending 31.Dec.2017
 for the period ending 31.Dec.2017") Financial Data Report MCB GROUP LIMITED (THE GROUP) for the period ending 31.Dec.2017 Equity Statistics Particulars Units 29-Dec-17 Current Market Price MUR 273.00 52 week H/L* MUR 289.00 / 213.25 Market
Financial Data Report MCB GROUP LIMITED (THE GROUP) for the period ending 31.Dec.2017 Equity Statistics Particulars Units 29-Dec-17 Current Market Price MUR 273.00 52 week H/L* MUR 289.00 / 213.25 Market
Signet Industries Ltd BSE Scrip Code:
 Signet Industries Ltd BSE Scrip Code: 512131 Comm. Trading & Distribution September 21, 2012 Equity Statistics Current Market Price Rs. 52 Week High / Low Rs. Market Capitalisation Rs. crores Free Float
Trident Ltd. Buy & Add on dips
 Trident Ltd. Buy & Add on dips 33,351.8 38,689.6 37,553.3 36,656.6 46,944.2 18-Apr-17 18-May-17 18-Jun-17 18-Jul-17 18-Aug-17 18-Sep-17 18-Oct-17 18-Nov-17 18-Dec-17 18-Jan-18 18-Feb-18 18-Mar-18 Trident
Oberoi Realty. CMP: INR264 TP: INR315 Buy
 BSE SENSEX S&P CNX 17,151 5,202 Bloomberg OBER IN Equity Shares (m) 328.2 52-Week Range (INR) 323/205 1,6,12 Rel. Perf. (%) 4/15/16 M.Cap. (INR b) 87.0 M.Cap. (USD b) 1.7 26 April 2012 4QFY12 Results Update
How much will your current lifestyle cost at 60?
 (MODERATE PLAN) How much will your current lifestyle cost at 60? DATE OF ALLOTMENT November 01,2011 BENCHMARK CRISIL Hybrid 25+75 - Aggressive Index (WEF From 1st February 2018) FUND SIZE: Rs.772.12 (Rs.