THANH CONG TEXTILE GARMENT INVESTMENT TRADING JOINT STOCK COMPANY AND ITS SUBSIDIARIES (Incorporated in the Socialist Republic of Vietnam)
|
|
|
- Aldous King
- 5 years ago
- Views:
Transcription
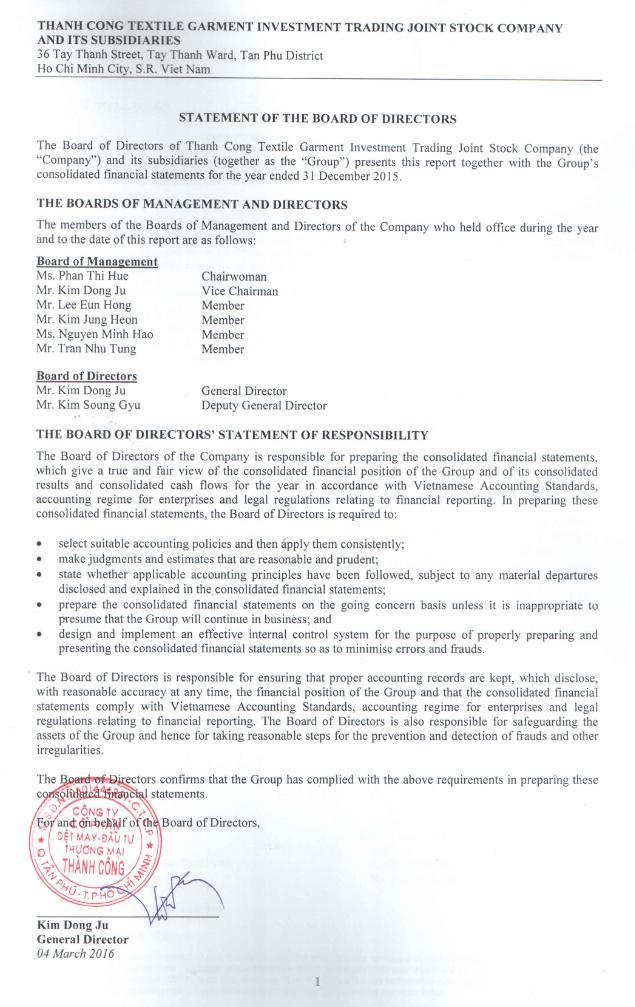
1 THANH CONG TEXTILE GARMENT INVESTMENT TRADING JOINT STOCK COMPANY (Incorporated in the Socialist Republic of Vietnam) AUDITED CONSOLIDATED FINANCIAL STATEMENTS For the year ended 31 December 2015 March 2016
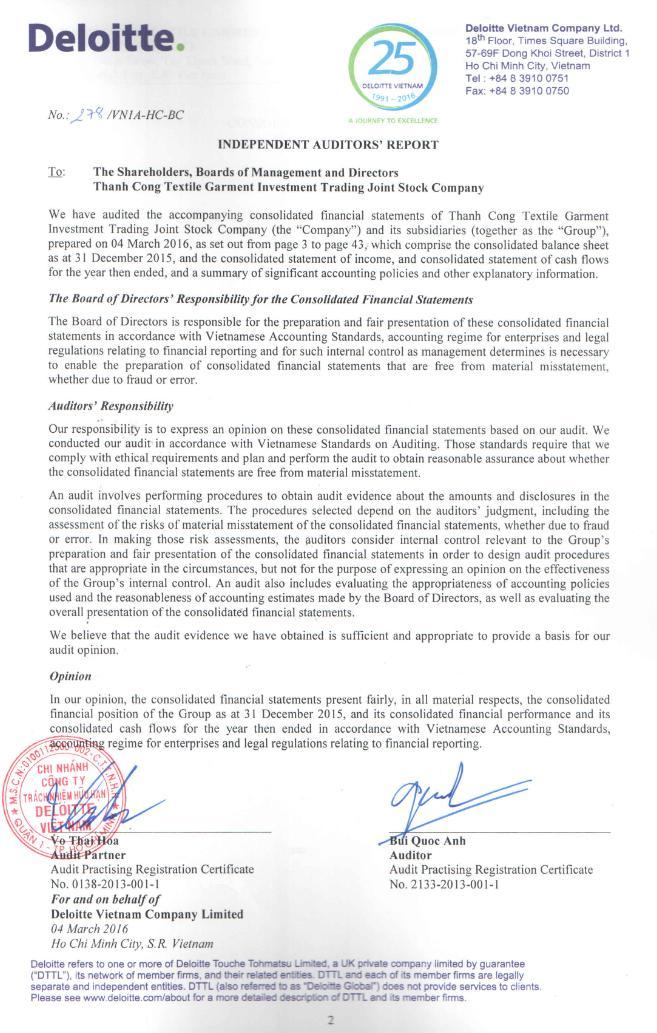
2 36 Tay Thanh Street, Tay Thanh Ward, Tan Phu District Ho Chi Minh City, S.R. Viet Nam TABLE OF CONTENTS CONTENTS PAGE(S) STATEMENT OF THE BOARD OF DIRECTORS 1 INDEPENDENT AUDITORS REPORT 2 CONSOLIDATED BALANCE SHEET 3-5 CONSOLIDATED INCOME STATEMENT 6 CONSOLIDATED CASH FLOW STATEMENT 7 NOTES TO THE CONSOLIDATED FINANCIAL STATEMENTS 8-43
3
4
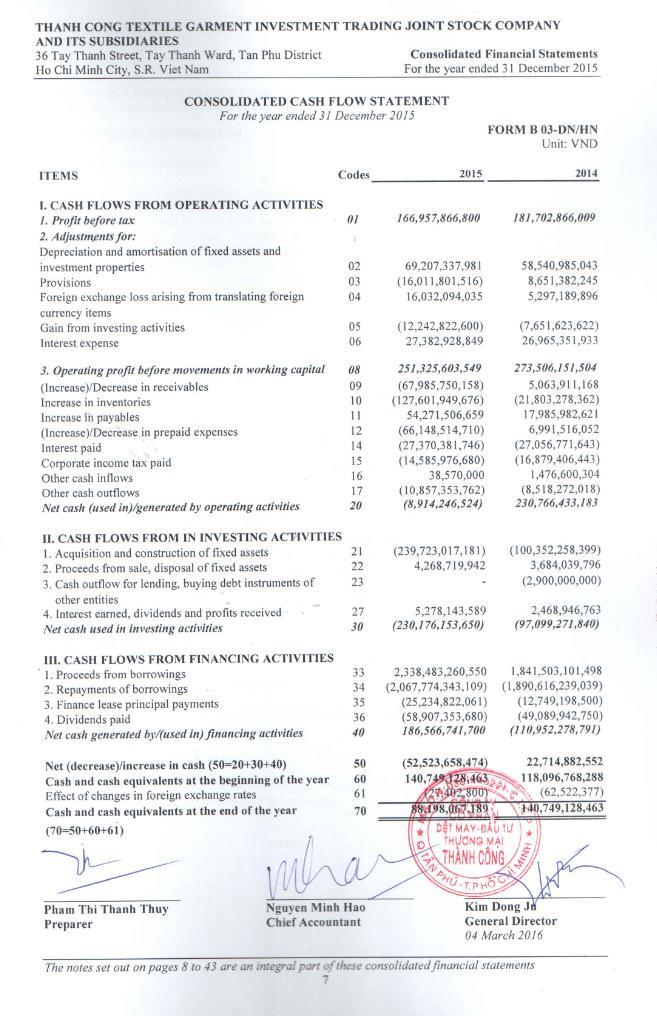
5 CONSOLIDATED BALANCE SHEET As at 31 December 2015 FORM B 01-DN/HN Unit: ASSETS Codes Notes 31/12/ /12/2014 A. CURRENT ASSETS 100 1,171,380,263, ,563,475,461 I. Cash and cash equivalents ,198,067, ,749,128, Cash ,498,067,189 94,049,128, Cash equivalents ,700,000,000 46,700,000,000 II. Short-term financial investments 120 4,500,000,000 4,500,000, Held-to-maturity investments 123 4,500,000,000 4,500,000,000 III. Short-term receivables ,230,642, ,871,299, Short-term trade receivables ,254,434, ,467,703, Short-term advances to suppliers ,716,032,088 40,189,207, Short-term loan receivables ,850,301,999 1,850,301, Other short-term receivables ,825,799,395 17,594,937, Provision for short-term doubtful debts 137 (4,415,925,534) (4,232,019,466) 6. Deficits in assets awaiting solution 139-1,168,478 IV. Inventories ,566,506, ,547,232, Inventories ,523,332, ,309,201, Provision for devaluation of inventories 149 (5,956,825,863) (21,761,969,447) V. Other short-term assets ,885,046,878 33,895,814, Short-term prepayments ,438,435,227 6,145,585, Value added tax deductibles ,446,611,651 27,748,380, Taxes and other receivables from the State Budget 153-1,848,565 The notes set out on pages 8 to 43 are an integral part of these consolidated financial statements 3
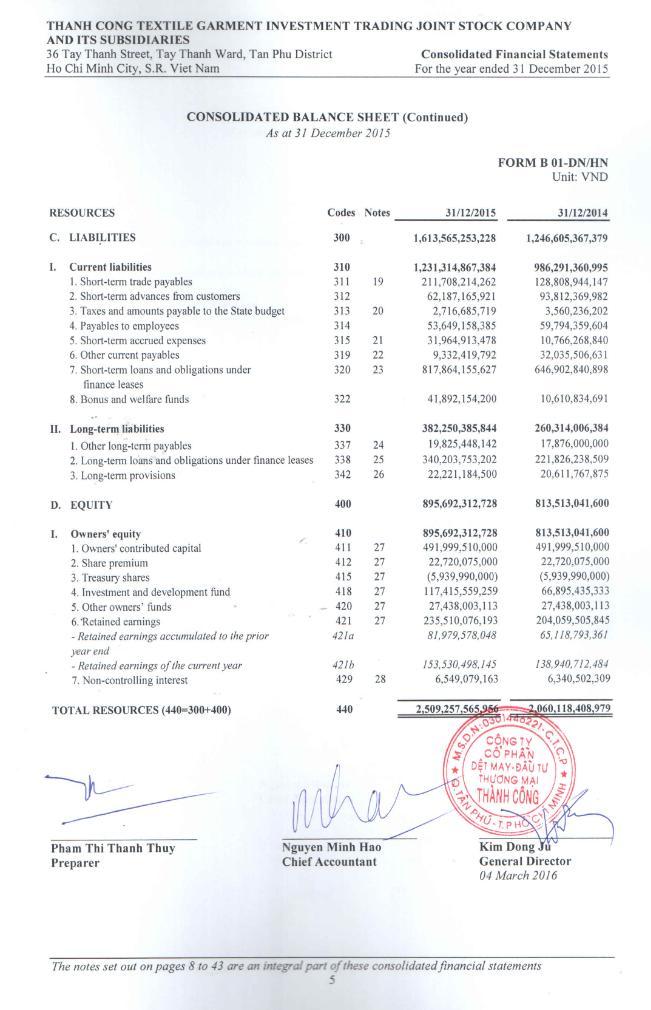
6 CONSOLIDATED BALANCE SHEET (Continued) As at 31 December 2015 FORM B 01-DN/HN Unit: ASSETS Codes Notes 31/12/ /12/2014 B. NON-CURRENT ASSETS 200 1,337,877,302,674 1,065,554,933,518 I. Long-term receivables ,000,000 35,000, Other long-term receivables ,000,000 35,000,000 II. Fixed assets ,879,438, ,871,207, Tangible fixed assets ,830,080, ,158,855,198 - Cost 222 1,421,251,210,674 1,275,903,829,147 - Accumulated depreciation 223 (742,421,130,281) (722,744,973,949) 2. Finance lease assets ,422,894,301 68,858,326,771 - Cost ,078,746,862 71,341,985,333 - Accumulated depreciation 226 (11,655,852,561) (2,483,658,562) 3. Intangible assets ,626,463,703 96,854,025,226 - Cost ,227,155, ,740,833,762 - Accumulated amortisation 229 (17,600,691,997) (14,886,808,536) III. Investment property ,309,421, ,479,226,677 - Cost ,556,801, ,280,625,580 - Accumulated depreciation 232 (1,247,380,235) (2,801,398,903) IV. Long-term assets in progress ,080,222,944 20,916,163, Construction in progress ,080,222,944 20,916,163,961 V. Long-term financial investments ,780,655, ,937,172, Investments in associates ,537,892, ,084,972, Equity investments in other entities ,352,050,000 5,352,050, Provision for impairment of long-term financial investments 254 (2,109,286,700) (2,499,850,700) VI. Other long-term assets ,792,564,244 72,316,163, Long-term prepayments ,707,706,815 70,275,464, Deferred tax assets ,084,857,429 2,040,698,587 TOTAL ASSETS (270= ) 270 2,509,257,565,956 2,060,118,408,979 The notes set out on pages 8 to 43 are an integral part of these consolidated financial statements 4
7
8
9
10 NOTES TO THE CONSOLIDATED FINANCIAL STATEMENTS FORM B 09-DN/HN 1. GENERAL INFORMATION Structure of ownership Thanh Cong Textile Garment Investment Trading Joint Stock Company (the Company ) was incorporated in Vietnam as a joint stock company under Business Registration Certificate No dated 23 June 2006 issued by the Department of Planning and Investment of Ho Chi Minh City, as amended. According to 15 th amended Business Registration Certificate No dated 17 November 2015 issued by the Department of Planning and Investment of Ho Chi Minh City, the owners contributed capital is 491,999,510,000. The Company s main shareholder is E-land Asia Holdings Pte Ltd, incorporated in Singapore. The number of the Company s employees as at 31 December 2015 was 4,921 (31 December 2014: 4,577). Principal activities The principal activities of the Company are manufacture and garment trading, details are as follows: Manufacture and trade cotton, fiber, garment products, footwear, machinery and equipment, spare parts, raw materials, chemicals (excluding strong toxic chemicals), dye, packing for garment and textile industry; Trade cold equipment, air-conditioners, radios and televisions, building materials, and transport vehicles; Provide services of installation and repairs for machinery and equipment; Trade road transport and merchandise transport; Trade real estates, commercial centres; Lease office buildings, factories, freight yard, machinery and equipment; Act as a commercial brokerage; Act as an agent for goods trading and goods consignment; Invest, build, trade, assemble, repair, prepare overall estimates for civil/industrial construction works, infrastructure of industrial parks and tourist area; Short-term accommodation services; Restaurant and foods services; Retails of beverage in the specialised shops; Retails of foods in the specialised shops; Trade of real estate, land use rights owned or leased; and Other retails. Normal production and business cycle The Company s normal production and business cycle is carried out for a time period of 12 months or less. The Company s structure Details of Thanh Cong Textile Garment Investment Trading Joint Stock Company's subsidiaries and associates as at 31 December 2015 are as follows: 8
11 Subsidiaries Name of subsidiaries Thanh Cong Medical Center Joint Stock Company ( Thanh Cong Medical Center ) Thanh Quang Corporation ( Thanh Quang ) Thanh Cong Vinh Long One Member Company Limited (Thanh Cong Vinh Long) (*) Place of incorporation (or registered place) and operation Tan Phu District, Ho Chi Minh City Tan Phu District, Ho Chi Minh City Hoa Phu Commune, Long Ho District, Vinh Long Province Proportion of ownership (%) Owners contributed capital as at 31/12/2015 () Principal activities ,700,000,000 Medical servicing and trading drugs and medical equipment ,000,000,000 Infrastructures, manufacturing and trading fabric ,293,406,255 Productions, business, exports, imports of cottons, fiber, threads, cloths, garments, footwear and machines, equipment, parts, auxiliary and raw materials, materials, chemicals (except poisonous chemicals), dye-stuffs, packing TC Tower Company Limited ( TC Tower ) (**) TC Eland One Member Limited Company ( TC Eland ) (***) Tan Phu District, Ho Chi Minh City District 1, Ho Chi Minh City Trading real estate 100 3,000,000,000 Trading garment and textile products (*) Thanh Cong Vinh Long One Member Company Limited ( Thanh Cong - Vinh Long ) was established in Vietnam under Business Registration Certificate No dated 06 May 2014 issued by the Department of Planning and Investment of Vinh Long Province. The subsidiary s registered capital is 129,000,000,000. As at the date of this report, Thanh Cong Textile Garment Investment Trading Joint Stock Company has contributed an assets, machinery and equipment to Thanh Cong Vinh Long with an amount of 37,293,406,255. (**) TC Tower Company Limited ( TC Tower ) was established in Vietnam under Investment Certificate No dated 31 October 2014 issued by People's Committee of Ho Chi Minh City. The subsidiary s registered capital is 159,150,000,000. As at the date of this report, Thanh Cong Textile Garment Investment Trading Joint Stock Company has not contributed capital to TC Tower yet. (***) TC Eland One Member Company Limited ( TC Eland ) was established in Vietnam under Enterprise Registration Certificate No dated 28 August 2015 issued by Development and Planning Investment Department of Ho Chi Minh City. The subsidiary s registered capital is 6,450,000,000. As at the date of this report, Thanh Cong Textile Garment Investment Trading Joint Stock Company has contributed to TC Eland with an amount of 3,000,000,000. 9
12 Associates Name of associates Thanh Chi Corporation ( Thanh Chi ) Thanh Cong Securities Joint Stock Company ( TCSC ) Thanh Phuc Investment Construction Corporation ( Thanh Phuc ) Vung Tau Golf Tourism Joint Stock Company ( Golf Vung Tau ) Place of incorporation (or registered place) and operation Proportion of ownership (%) Owners contributed capital as at 31/12/2015 () Principal activities Vung Tau City ,890,000,000 Trading and exploiting sand and stone District 3, Ho Chi Minh City Tan Phu District, Ho Chi Minh City Ba Ria, Vung Tau City ,000,000,000 Brokerage, self - trading securities, securities guaranty and securities investment consultancy ,000,000,000 Constructing and managing projects ,000,000,000 Providing tourism and entertainment services Disclosure of information comparability in the financial statements As stated in Note 3, since 01 January 2015, the Company has adopted Circular No. 200/2014/TT- BTC issued by the Ministry of Finance on 22 December 2014 ( Circular 200 ) guiding the accounting regime for enterprises and Circular No. 202/2014/TT-BTC issued by the Ministry of Finance on 22 December 2014 ( Circular 202 ) guiding the preparation and presentation of consolidated financial statements. Circular 200 supersedes the regulations for accounting regime promulgated under Decision No. 15/2006/QD-BTC dated 20 March 2006 issued by the Ministry of Finance and Circular No. 244/2009/TT-BTC dated 31 December 2009 issued by the Ministry of Finance. Circular 202 supersedes section XIII in Circular No. 161/2007/TT-BTC dated 31 December 2007 of the Ministry of Finance guiding the preparation and presentation of consolidated financial statements in accordance with Vietnamese Accounting Standard No. 25 Consolidated Financial Statements and Accounting for Investments in Subsidiaries. However, the adoption of such circulars does not have significant impact on the comparability of the figures in the Company s consolidated financial statements. 2. ACCOUNTING CONVENTION AND FINANCIAL YEAR Accounting convention The accompanying consolidated financial statements, expressed in Vietnam Dong ( ), are prepared under the historical cost convention and in accordance with Vietnamese Accounting Standards, accounting regime for enterprises and legal regulations relating to financial reporting. The accompanying consolidated financial statements are not intended to present the financial position, results of operations and cash flows in accordance with accounting principles and practices generally accepted in countries and jurisdictions other than Vietnam. Financial year The Group s financial year begins on 01 January and ends on 31 December. 10
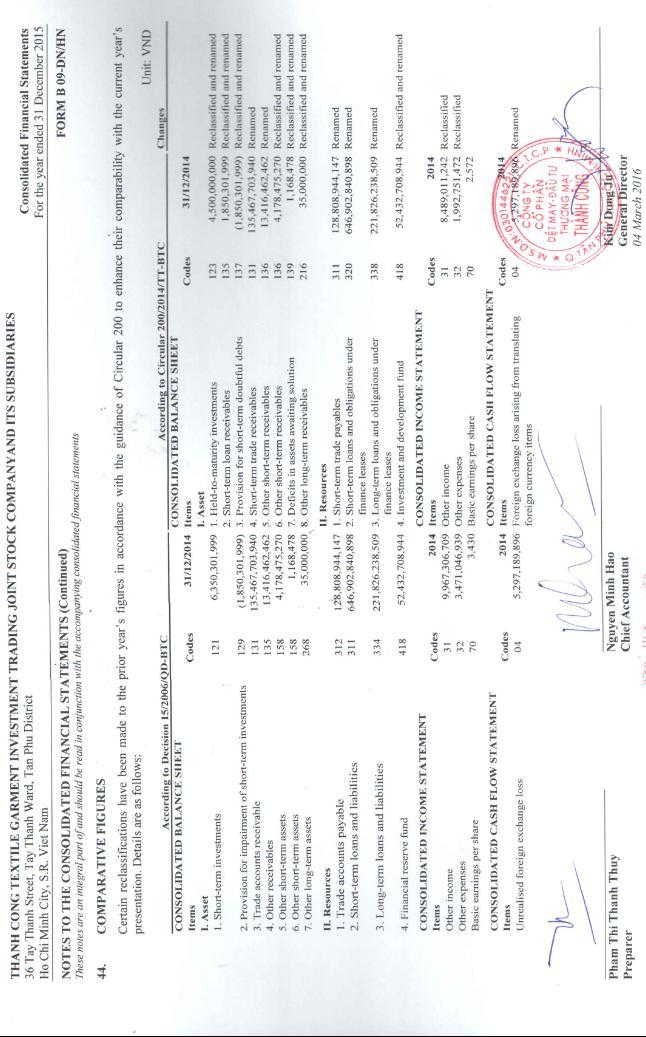
13 3. ADOPTION OF NEW ACCOUNTING GUIDANCE New guidance on accounting regime for enterprises On 22 December 2014, the Ministry of Finance issued Circular No. 200/2014/TT-BTC ( Circular 200 ) guiding the accounting regime for enterprises and Circular No. 202/2014/TT-BTC (Circular 202) guiding the preparation and presentation of consolidated financial statements. These circulars are effective for financial years beginning on or after 01 January Circular 200 supersedes the regulations for accounting regime promulgated under Decision No. 15/2006/QD-BTC dated 20 March 2006 issued by the Ministry of Finance and Circular No. 244/2009/TT-BTC dated 31 December 2009 issued by the Ministry of Finance. Circular 202 will supersede section XIII in Circular No. 161/2007/TT-BTC dated 31 December 2007 of the Ministry of Finance guiding the preparation and presentation of consolidated financial statements in accordance with Vietnamese Accounting Standard No. 25 Consolidated Financial Statements and Accounting for Investments in Subsidiaries. The Board of Directors has adopted Circular 200 in the preparation and presentation of the consolidated financial statements for the year ended 31 December Thereof, certain reclassifications have been made to the prior period s figures in accordance with the guidance of Circular 200 to enhance their comparability with the current period s presentation; details have been presented in Note 44 Comparative figures. 4. SUMMARY OF SIGNIFICANT ACCOUNTING POLICIES The significant accounting policies, which have been adopted by the Group in the preparation of these consolidated financial statements, are as follows: Estimates The preparation of consolidated financial statements in conformity with Vietnamese Accounting Standards, accounting regime for enterprises and legal regulations relating to financial reporting requires the Board of Directors to make estimates and assumptions that affect the reported amounts of assets, liabilities and disclosures of contingent assets and liabilities at the date of the consolidated financial statements and the reported amounts of revenues and expenses during the financial year. Although these accounting estimates are based on the Board of Directors best knowledge, actual results may differ from those estimates. Basis of consolidation The consolidated financial statements incorporate the financial statements of the Company and enterprises controlled by the Company (its subsidiaries) up to the end of each financial year. Control is achieved where the Company has the power to govern the financial and operating policies of an investee enterprises so as to obtain benefits from its activities. The results of subsidiaries acquired or disposed of during the year are included in the consolidated income statement from the effective date of acquisition or up to the effective date of disposal, as appropriate. Where necessary, adjustments are made to the financial statements of subsidiaries to bring the accounting policies used in line with those used by the Company. All inter-company transactions and balances between group s enterprises are eliminated on consolidation. Non-controlling interests in the net assets of consolidated subsidiaries are identified separately from the Company s equity therein. Non-controlling interests consist of the amount of those interests at the date of the original business combination (presented in Note 28) and the non-controlling s share of changes in equity since the date of the combination. Losses in subsidiaries are respectively attributed to the non-controlling interests even if this results in the non-controlling interests having a deficit balance. 11
14 Business combinations On acquisition, the assets and liabilities and contingent liabilities of a subsidiary are measured at their fair values at the date of acquisition. Any excess of the cost of acquisition over the fair values of the identifiable net assets acquired is recognised as goodwill. Any deficiency of the cost of acquisition below the fair values of the identifiable net assets acquired is credited to profit and loss in the period of acquisition. The non-controlling interests are initially measured at the non-controlling shareholders proportion of the net fair value of the assets, liabilities and contingent liabilities recognised. Investments in associates An associate is an entity over which the Company has significant influence and that is neither a subsidiary nor an interest in joint venture. Significant influence is the power to participate in the financial and operating policy decisions of the investee but not control or joint control over those policies. The results and assets and liabilities of associates are incorporated in these financial statements using the equity method of accounting. Interests in associates are carried in the balance sheet at cost as adjusted by post-acquisition changes in the Company s share of the net assets of the associate. Losses of an associate in excess of the Company's interest in that associate (which includes any long-term interests that, in substance, form part of the Company's net investment in the associate) are not recognised. Where a group entity transacts with an associate of the Group, unrealised profits and losses are eliminated to the extent of the Company s interest in the relevant associate. Goodwill Goodwill represents the excess of the cost of acquisition over the Company s interest in the net fair value of the identifiable assets, liabilities and contingent liabilities of an associate or jointly controlled entity at the date of acquisition. Goodwill arising on the acquisition of associates and jointly controlled entities is included in the carrying amount of the associates and jointly controlled entities. On disposal of an associate or jointly controlled entity, the attributable amount of unamortised goodwill is included in the determination of the profit or loss on disposal. Negative goodwill Negative goodwill represents the excess of the Company s interest in the net fair value of the identifiable assets, liabilities and contingent liabilities of a subsidiary, associate or jointly controlled entity at the date of acquisition over the cost of acquisition. Negative goodwill is immediately recognised in the consolidated income statement at the acquisition date. Financial instruments Initial recognition Financial assets: At the date of initial recognition, financial assets are recognised at cost plus transaction costs that are directly attributable to the acquisition of the financial assets. Financial assets of the Group comprise cash and cash equivalents, trade and other receivables, investments in stocks and deposits. 12
15 Financial liabilities: At the date of initial recognition financial liabilities are recognised at cost plus transaction costs that are directly attributable to the issue of the financial liabilities. Financial liabilities of the Group comprise obligations under finance leases, borrowings, trade and other payables and accrued expenses. Subsequent measurement after initial recognition Currently, there are no requirements for the subsequent measurement of the financial instruments after initial recognition. Cash and cash equivalents Cash and cash equivalents comprise cash on hand, demand deposits and short-term, highly liquid investments that are readily convertible to known amounts of cash and which are subject to an insignificant risk of changes in value. Financial investments Loan receivables Loan receivables are measured at cost less provision for doubtful debts. Provision for doubtful debts relating to loan receivables is made in accordance with prevailing accounting regulations. Equity investments in other entities Equity investments in other entities represent the Company s investments in ordinary shares of the entities over which the Company has no control, joint control, or significant influence. Equity investments in other entities are carried at cost less provision for impairment. Provision for impairment is made in accordance with the prevailing accounting regulations. Receivables Receivables represent the amounts recoverable from customers or other debtors and are stated at book value less provision for doubtful debts. Provision for doubtful debts is made for receivables that are overdue for six months or more, or when the debtor is in dissolution, in bankruptcy, or is experiencing similar difficulties and so may be unable to repay the debt. Inventories Inventories are stated at the lower of cost and net realisable value. Cost comprises direct materials and where applicable, direct labour costs and those overheads that have been incurred in bringing the inventories to their present location and condition. Cost is calculated using the weighted average method. Net realisable value represents the estimated selling price less all estimated costs to completion and costs to be incurred in marketing, selling and distribution. The evaluation of necessary provision for inventory obsolescence follows current prevailing accounting regulations which allow provisions to be made for obsolete, damaged, or sub-standard inventories and for those which have book value higher than net realisable value as at the balance sheet date. Tangible fixed assets and depreciation Tangible fixed assets are stated at cost less accumulated depreciation. The cost of purchased tangible fixed assets comprises its purchase price and any directly attributable costs of bringing the assets to its working condition and location for its intended use. The costs of self-constructed or manufactured assets are the actual construction or manufacturing cost plus installation and test running costs. 13
16 Tangible fixed assets are depreciated using the straight-line method over their estimated useful lives as follows: Years Buildings and structures Machinery and equipment 7-15 Motor vehicles 10 Office equipment 7-15 Others 7-22 Intangible assets and amortisation Intangible assets represent land use rights, patents and software. Intangible assets are stated at cost less accumulated amortisation and are amortised on the straight-line basis over their estimated useful lives. Definite land use rights are carried at cost and amortised on the straight-line basis over the duration of the right to use the land from years. Indefinite land use rights are carried at cost and not amortised. Patents and software are amortised on the straight-line basis over their estimate useful lives from 4-10 years. Leasing Leases are classified as finance leases whenever the terms of the lease transfer substantially all the risks and rewards of ownership to the lessee. All other leases are classified as operating leases. Assets held under finance leases are recognised as assets of the Group at their fair value at the inception of the lease or, if lower, at the present value of the minimum lease payments. The corresponding liability to the lessor is included in the balance sheet as a finance lease obligation. Lease payments are apportioned between finance charges and reduction of the lease obligation so as to achieve a constant rate of interest on the remaining balance of the liability. Finance charges are charged to consolidated profit or loss, unless they are directly attributable to qualifying assets, in which case they are capitalised in accordance with the Group s general policy on borrowing costs. Leases where substantially all the rewards and risks of ownership of assets remain with the leasing Group are accounted for as operating leases. Rentals payable under operating leases are charged to the consolidated income statement on a straight-line basis over the term of the relevant lease. Assets held by the Group under finance leases are machinery which depreciated over the period of years. Construction in progress Properties in the course of construction for production, rental or administrative purposes, or for other purposes, are carried at cost. Cost includes costs that are necessary to form the assets in accordance with the Group s accounting policy. Depreciation of these assets, on the same basis as other assets, commences when the assets are ready for their intended use. Investment properties Investment properties, which are composed of buildings and structures and land use rights held by the Group to earn rentals or for capital appreciation. Investment properties held to earn rentals are stated at cost less accumulated depreciation while investment properties held for capital appreciation are stated at cost less impairment loss. The cost of purchased investment properties comprises its purchase price and any directly attributable expenditures, such as professional fees for legal services, property transfer taxes and other related transaction costs. The costs of self-constructed investment properties are the finally accounted construction or directly attributable costs of the properties. No depreciation is recorded for investment properties held for capital appreciation. 14
17 Buildings and structures are depreciated using the straight-line method over their estimated useful lives of 50 years. Definite land use rights are amortised using the straight-line method over number of years in accordance with the terms indicated in each land use right certificate. Land use rights which are granted for an indefinite term are carried at cost and not amortised. Long-term prepayments Long-term prepayments comprise prepaid land rentals at Xuyen A Industrial Zone - Long An Province, Nhi Xuan Industrial Zone - Hoc Mon District, Ho Chi Minh City, Trang Bang Industrial Zone - Tay Ninh Province and Hoa Phu Industrial Zone - Vinh Long Province, and other prepayments (allocated within 3 years). Prepaid land rentals are charged to consolidated income statement using the straight-line method over the lease term from 45 to 58 years. Payable provisions Payable provisions are recognized when the Group has a present obligation as a result of a past event, and it is probable that the Group will be required to settle that obligation. Provisions are measured at the Board of Directors best estimate of the expenditure required to settle the obligation as at the balance sheet date. Revenue recognition Revenue from the sale of goods is recognised when all five (5) following conditions are satisfied: (a) the Group has transferred to the buyer the significant risks and rewards of ownership of the goods; (b) the Group retains neither continuing managerial involvement to the degree usually associated with ownership nor effective control over the goods sold; (c) the amount of revenue can be measured reliably; (d) it is probable that the economic benefits associated with the transaction will flow to the Group; and (e) the costs incurred or to be incurred in respect of the transaction can be measured reliably. Revenue of a transaction involving the rendering of services is recognised when the outcome of such transactions can be measured reliably. Where a transaction involving the rendering of services is attributable to several periods, revenue is recognised in each period by reference to the percentage of completion of the transaction at the balance sheet date of that period. The outcome of a transaction can be measured reliably when all four (4) following conditions are satisfied: (a) the amount of revenue can be measured reliably; (b) it is probable that the economic benefits associated with the transaction will flow to the Group; (c) the percentage of completion of the transaction at the balance sheet date can be measured reliably; and (d) the costs incurred for the transaction and the costs to complete the transaction can be measured reliably. Interest income is accrued on a time basis, by reference to the principal outstanding and at the applicable interest rate. Dividend income from investments is recognised when the Group s right to receive payment has been established. Foreign currencies The Group applies the method of recording foreign exchange differences in accordance with Vietnamese Accounting Standard No. 10 (VAS 10) Effects of changes in foreign exchange rates. Accordingly, transactions arising in foreign currencies are translated at exchange rates ruling at the transaction date. The balances of monetary items denominated in foreign currencies as at the balance sheet date are retranslated at the exchange rates on the same date. Exchange differences arising from the translation of these accounts are recognised in the consolidated income statement. Unrealised exchange gains as at the balance sheet date are not treated as part of distributable profit to shareholders. 15
18 Borrowing costs Borrowing costs are recognised in the income statement in the year when incurred unless they are capitalised in accordance with Vietnamese Accounting Standard No. 16 Borrowing costs. Accordingly, borrowing costs directly attributable to the acquisition, construction or production of qualifying assets, which are assets that necessarily take a substantial period of time to get ready for their intended use or sale, are added to the cost of those assets, until such time as the assets are substantially ready for their intended use or sale. Investment income earned on the temporary investment of specific borrowings pending their expenditure on qualifying assets is deducted from the cost of those assets. For specific borrowings for the purpose of construction of fixed assets and investment properties, borrowing costs are capitalised even when the construction period is under 12 months. Severance allowance payable The severance allowance for employees is accrued at the end of each reporting period for all employees having worked at the Group for full 12 months and above. Working time serving as the basis for calculating severance allowance shall be the total actual working time subtracting the time when the employees have made unemployment insurance contributions as prescribed by law, and the working time when severance allowance has been paid to the employees. The allowance made for each year of service equals to a half of an average monthly salary under the Vietnamese Labour Code, Social Insurance Code and relevant guiding documents. The average monthly salary used for calculation of severance allowance shall be adjusted to be the average of the 6 consecutive months nearest to the date of the financial statements at the end of each reporting period. The increase or decrease in the accrued amount shall be recorded in consolidated the income statement. Tax Income tax expense represents the sum of the tax currently payable and deferred tax. The tax currently payable is based on taxable profit for the year. Taxable profit differs from net profit as reported in the consolidated income statement because it excludes items of income or expense that are taxable or deductible in other years and it further excludes items that are never taxable or deductible. Deferred tax is recognised on significant differences between carrying amounts of assets and liabilities in the consolidated financial statements and the corresponding tax bases used in the computation of taxable profit and is accounted for using balance sheet liability method. Deferred tax liabilities are generally recognised for all temporary differences and deferred tax assets are recognized to the extent that it is probable that taxable profit will be available against which deductible temporary differences can be utilised. Deferred tax is calculated at the tax rates that are expected to apply in the year when the liability is settled or the asset realised. Deferred tax is charged or credited to profit or loss, except when it relates to items charged or credited directly to equity, in which case the deferred tax is also dealt with in equity. Deferred tax assets and liabilities are offset when there is a legally enforceable right to set off current tax assets against current tax liabilities and when they relate to income taxes levied by the same taxation authority and the Group intends to settle its current tax assets and liabilities on a net basis. The determination of the current tax payable and deferred tax is based on the current interpretation of tax regulations. However, these regulations are subject to periodic variation and their ultimate determination depends on the results of the tax authorities examinations. Other taxes are paid in accordance with the prevailing tax laws in Vietnam. 16
19 Appropriation of funds and dividend distribution Dividend distribution to the Company and its subsidiaries shareholders is recognized as a liability in the Company and its subsidiaries financial statements in the year in which the dividends are approved by the Company and its subsidiaries shareholders. Net profit after tax is available for appropriation to shareholders after approval by the shareholders at the Annual General Shareholders Meeting, and after making appropriation to funds in accordance with the Company and its subsidiaries Charter and Vietnamese regulatory requirements. Treasury shares Treasury shares are shares issued and bought-back by the Company, but they are not cancelled and shall be re-issued in the period which complies with law on securities. Treasury shares are hold by the Company will have no dividend, no right for election or join to share assets when the Company is dissolved. When distributing dividend for shares, treasury shares hold by the Company shall be considered as not yet sold. Value of treasury shares is reflected as prices actually bought-back including buying-back prices and expenses directly related to buying-back of shares, such as expenses of transaction, information. 5. CASH AND CASH EQUIVALENTS 31/12/ /12/2014 Cash on hand 919,707, ,814,575 Demand deposits 36,578,359,957 93,587,313,888 Cash equivalents 50,700,000,000 46,700,000,000 88,198,067, ,749,128,463 Cash equivalents represent short-term bank deposits with an original maturity of three months. These deposits earn average interest rate of 5,3% per annum (2014: 1% - 6% per annum). 6. SHORT-TERM TRADE RECEIVABLES 31/12/ /12/2014 a. Short-term trade receivables - Sanmar corporation 11,109,032,280 22,694,998,290 - Others 70,757,471,207 79,789,166,359 b. Receivables from related parties 75,387,930,887 32,983,539,291 (Note 42) 157,254,434, ,467,703, SHORT-TERM LOAN RECEIVABLES Short-term loan receivables represent a loan to third party in The investment has been fully provided provision as at 31 December 2015 in according to the Group s accounting policy. 17
20 8. OTHER SHORT-TERM RECEIVABLES 31/12/ /12/2014 Receivable from employees 4,596,847,944 3,778,463,748 Deposits and mortgages 333,650, ,180,000 Receivable for dividends 1,040,950,000 2,602,375,000 Other receivables 854,351,451 10,812,918,984 6,825,799,395 17,594,937, INVENTORIES 31/12/ /12/2014 Cost Provision Cost Provision Goods in transit 78,146,323,784-66,541,684,138 - Raw materials 220,513,131, ,233,929,068 - Tools and supplies 3,105,675,871-7,723,197 - Work in progress 188,247,179, ,716,300,483 - Finished goods 271,456,261,043 5,956,825, ,498,821,239 21,761,969,447 Merchandise 5,011,570,589-2,909,398,049 - Goods on consignment 20,043,190,387-4,401,345, ,523,332,756 5,956,825, ,309,201,913 21,761,969,447 Movement of provision for devaluation of inventories during the year as follow: As at 01 January 21,761,969,447 13,304,597,502 Provision for the year - 14,264,840,890 Reversal in the year (15,805,143,584) (5,807,468,945) As at 31 December 5,956,825,863 21,761,969,447 18
21 NOTES TO THE CONSOLIDATED FINANCIAL STATEMENTS (Continued) FORM B 09-DN/HN 10. INCREASES, DECREASES IN TANGIBLE FIXED ASSETS Buildings Machinery Motor Office and structures and equipment vehicles equipment Others Total COST As at 01/01/ ,494,293, ,923,401,703 17,750,168,126 13,911,652, ,824,313,870 1,275,903,829,147 - Additions 59,367,000 4,878,795,221 4,557,962,400 1,149,336,779 2,507,227,727 13,152,689,127 - Transfer from construction in 113,059,114,476 51,106,098,437 1,190,800, ,558,497 2,913,896, ,724,468,686 progress - Transferred from investment 3,723,823, ,723,823,929 property - Disposals - (30,561,311,241) (382,710,416) (3,759,348,792) (4,778,565,435) (39,481,935,884) - Other decreases - (771,664,331) (771,664,331) As at 31/12/ ,336,598, ,575,319,789 23,116,221,054 11,756,198, ,466,872,494 1,421,251,210,674 ACCUMULATED DEPRECIATION As at 01/01/ ,495,700, ,522,955,589 9,630,464,088 9,692,262,390 87,403,591, ,744,973,949 - Charge for the year 7,005,671,838 40,905,372,742 1,806,126, ,854,605 6,527,938,193 57,130,963,985 - Transferred from investment 1,744,315, ,744,315,204 property - Disposals - (30,339,350,570) (390,907,103) (3,759,348,792) (4,639,416,201) (39,129,022,666) - Other decreases - (70,100,191) (70,100,191) As at 31/12/ ,245,687, ,018,877,570 11,045,683,592 6,818,768,203 89,292,113, ,421,130,281 NET BOOK VALUE As at 31/12/ ,090,911, ,556,442,219 12,070,537,462 4,937,430,296 30,174,758, ,830,080,393 As at 31/12/ ,998,593, ,400,446,114 8,119,704,038 4,219,389,625 31,420,722, ,158,855,198 As noted further in Note 23 and 25, the Group has pledged its buildings and machinery, equipment, which has a carrying value of approximately billion as at 31 December 2015 (31 December 2014: billion), to secure banking facilities granted to the Group. The cost of the Group s tangible fixed assets includes 354 billion which have been fully depreciated but which are still in use (31 December 2014: 380 billion). 19
22 11. INCREASES, DECREASES IN FINANCE LEASE ASSETS Machinery, equipment COST As at 01/01/ ,341,985,333 Transfer from construction in progress 36,736,761,529 As at 31/12/ ,078,746,862 ACCUMULATED DEPRECIATION As at 01/01/2015 2,483,658,562 Charge for the year 9,172,193,999 As at 31/12/ ,655,852,561 NET BOOK VALUE As at 31/12/ ,422,894,301 As at 31/12/ ,858,326, INCREASES, DECREASES IN INTANGIBLE ASSETS Land use rights Patents Software Total COST As at 01/01/ ,334,416,604 3,942,895,847 11,463,521, ,740,833,762 Transferred from construction in progress - - 1,486,321,938 1,486,321,938 As at 31/12/ ,334,416,604 3,942,895,847 12,949,843, ,227,155,700 ACCUMULATED AMORTISATION As at 01/01/2015 9,334,369,070 2,558,012,227 2,994,427,239 14,886,808,536 Charge for the year 617,618, ,121,970 1,425,143,313 2,713,883,461 As at 31/12/2015 9,951,987,248 3,229,134,197 4,419,570,552 17,600,691,997 NET BOOK VALUE As at 31/12/ ,382,429, ,761,650 8,530,272,697 95,626,463,703 As at 31/12/ ,000,047,534 1,384,883,620 8,469,094,072 96,854,025,226 As noted further in Note 23 and 25, the Group has pledged land use rights with a carrying value of approximately 9.4 billion as at 31 December 2015 (31 December 2014: 9.7 billion) to secure banking facilities granted to the Group. 20
23 13. INVESTMENT PROPERTY Buildings for lease Land use rights Total COST As at 01/01/ ,620,896, ,659,728, ,280,625,580 Transfer to tangible fixed asset (3,723,823,929) - (3,723,823,929) As at 31/12/2015 7,897,072, ,659,728, ,556,801,651 ACCUMULATED DEPRECIATION As at 01/01/2015 2,801,398,903-2,801,398,903 Charge for the year 190,296, ,296,536 Transfer to tangible fixed asset (1,744,315,204) - (1,744,315,204) As at 31/12/2015 1,247,380,235-1,247,380,235 NET BOOK VALUE As at 31/12/2015 6,649,692, ,659,728, ,309,421,416 As at 31/12/2014 8,819,497, ,659,728, ,479,226,677 As noted further in Note 23 and 25, the Group has pledged investment property with a carrying value of approximately 6.6 billion as at 31 December 2015 (31 December 2014: 110 billion) to secure banking facilities granted to the Group. As at 31 December 2015, the Company s Board of Directors has not determined fair value of the investment property due to the intention of holding for a long-term and there is no basis for determination. 14. CONSTRUCTION IN PROGRESS As at 01 January 20,916,163,961 11,633,469,068 Additions 265,089,314,505 87,933,559,412 Transfer to tangible fixed assets (168,724,468,686) (6,213,902,270) Transfer to finance lease assets (36,736,761,529) (71,341,985,333) Transfer to intangible assets (1,486,321,938) - Other transfers (19,977,703,369) (1,094,976,916) As at 31 December 59,080,222,944 20,916,163,961 The total interest expense which had been capitalised into the cost of construction in progress during the year was 1,535,197,469 (2014: 1,285,030,254). As at the balance sheet date, construction in progress comprises the following major projects: 31/12/ /12/2014 Thanh Cong Tower 1 23,881,110,714 12,400,477,320 Purchase of machineries, equipment 34,721,203,139 6,858,859,091 Others 477,909,091 1,656,827,550 59,080,222,944 20,916,163,961 21
24 15. INVESTMENTS IN ASSOCIATES 31/12/ /12/2014 Cost of investment in associates 113,046,152, ,046,152,000 Share of post-acquisition profits, net of dividends received 23,491,740,373 19,038,820, ,537,892, ,084,972,844 Goodwill 6,384,523,879 6,384,523,879 Company s share of associates net assets 130,153,368, ,700,448,965 Total assets 559,974,752, ,236,356,363 Total liabilities 110,045,056,599 82,750,449,284 Net assets 449,929,695, ,485,907,079 Company s share of associates net assets 130,153,368, ,700,448, Net profit 18,260,840,761 10,690,654,731 Company s share of associates net profit 5,493,869,529 3,002,304, EQUITY INVESTMENTS IN OTHER ENTITIES 31/12/ /12/2014 Viet Thang Textile Joint Stock Company 125,000, ,000,000 Thang Loi Textile and Garment Company 1,576,000,000 1,576,000,000 Hue Garment and Textile Company 318,000, ,000,000 SY Vina Joint Stock Company 883,450, ,450,000 Bank for Foreign Trade of Vietnam Joint Stock Company 2,449,600,000 2,449,600,000 5,352,050,000 5,352,050,000 Provision for impairment of long-term financial investments (2,109,286,700) (2,499,850,700) Net equity investments in other entities 3,242,763,300 2,852,199, LONG-TERM PREPAYMENTS As at 01 January 70,275,464,954 77,604,523,018 Additions during the year 87,608,838, ,243,000 Allocated to expenses during the year (8,176,596,860) (7,447,301,064) As at 31 December 149,707,706,815 70,275,464,954 22
25 Details of long-term prepayments are as follows: 31/12/ /12/2014 Land rental expenses 135,266,756,512 68,548,112,642 Others 14,440,950,303 1,727,352, ,707,706,815 70,275,464, DEFERRED TAX ASSETS AND LIABILITIES Deferred tax assets 31/12/ /12/ Corporate income tax rates used for determination of value of deferred tax assets 7.5% 7.5% - Deferred tax assets related to provisions and accrued expenses 2,080,338,584 2,051,131,447 - Deferred tax assets related to foreign exchange difference 27,710, ,596 - Amount offset against deferred tax liabilities (23,191,788) (11,388,456) Deferred tax assets 2,084,857,429 2,040,698,587 Deferred tax liabilities 31/12/ /12/ Corporate income tax rates used for determination of value of deferred tax liabilities 7.5% 7.5% - Deferred tax liabilities arising from accrued interest income 23,191,788 11,388,456 - Amount offset against deferred tax assets (23,191,788) (11,388,456) Deferred tax liabilities SHORT-TERM TRADE PAYABLES 31/12/ /12/2014 Amount Amount able to be paid off Amount Amount able to be paid off a. Short-term trade payables - Eland International Fashion (Shanghai) Co., Ltd 31,397,592,759 31,397,592,759 8,139,709,455 8,139,709,455 - Eland World Limited 11,922,392,020 11,922,392,020 4,128,022,920 4,128,022,920 - Other suppliers 168,388,229, ,388,229, ,541,211, ,541,211, ,708,214, ,708,214, ,808,944, ,808,944,147 b. Trade payables to related parties (Note 42) 43,749,653,990 43,749,653,990 12,474,026,739 12,474,026,739 43,749,653,990 43,749,653,990 12,474,026,739 12,474,026,739 23
26 20. TAXES AND AMOUNTS PAYABLE TO THE STATE BUDGET 01/01/2015 Payable during the year Paid during the year 31/12/2015 Corporate income tax 2,777,360,029 13,262,950,643 (14,585,976,680) 1,454,333,992 Personal income tax 782,876,173 13,199,736,854 (12,723,856,494) 1,258,756,533 Value added tax - 34,422,631,686 (34,419,036,492) 3,595,194 Other taxes - 12,988,302,714 (12,988,302,714) - 3,560,236,202 73,873,621,897 (74,717,172,380) 2,716,685, SHORT-TERM ACCRUED EXPENSES 31/12/ /12/2014 Accrual for loan interest 6,793,211,074 5,245,466,502 Accrual for land rental (*) 20,576,577,272 - Others 4,595,125,132 5,520,802,338 31,964,913,478 10,766,268,840 (*) Accrual for land rental represents the unpaid amount relating to land rental in Hoa Phu Industrial Park - Vinh Long Province. 22. OTHER CURRENT PAYABLES 31/12/ /12/2014 Union fee 1,607,458,475 1,074,125,964 Dividends payable 118,884,570 29,566,537,650 Others 7,606,076,747 1,394,843,017 9,332,419,792 32,035,506,631 24
27 NOTES TO THE CONSOLIDATED FINANCIAL STATEMENTS (Continued) FORM B 09-DN/HN 23. SHORT-TERM LOANS AND OBLIGATIONS UNDER FINANCE LEASES 31/12/2015 In the year 31/12/2014 Amount able to be Amount able to be Amount paid off Increases Decreases Amount paid off Short-term borrowings 755,770,001, ,770,001,160 2,202,133,891,121 2,022,231,569, ,867,679, ,867,679,182 - Bank SinoPac Ho Chi Minh City Branch 63,355,713,726 63,355,713, ,801,579, ,562,041,507 19,116,176,001 19,116,176,001 - Vietcombank Ho Chi Minh City Branch 293,645,696, ,645,696, ,846,546, ,227,665, ,026,816, ,026,816,090 - Standard Charterd Bank ,130,703, ,393,771,699 26,263,067,743 26,263,067,743 - BIDV - Hoc Mon Branch 172,937,554, ,937,554, ,059,854, ,232,553,368 82,110,253,254 82,110,253,254 - HSBC Bank (Vietnam) Ltd 69,144,086,302 69,144,086, ,695,463, ,398,601,859 58,847,224,637 58,847,224,637 - Vietinbank - Ho Chi Minh City Branch 121,285,603, ,285,603, ,614,691, ,176,829, ,847,740, ,847,740,574 - Vietnam International Bank - FDI Branch 35,401,346,768 35,401,346,768 68,985,051,666 48,240,105,781 14,656,400,883 14,656,400,883 Current portion 62,094,154,467 62,094,154,467 84,058,590,103 92,999,597,352 71,035,161,716 71,035,161,716 - Current portion of long-term loans 32,198,576,119 32,198,576,119 47,353,122,838 67,438,098,719 52,283,552,000 52,283,552,000 - Current portion of long-term obligations under finance 29,895,578,348 29,895,578,348 36,705,467,265 25,561,498,633 18,751,609,716 18,751,609, ,864,155, ,864,155,627 2,286,192,481,224 2,115,231,166, ,902,840, ,902,840,898 25
28 AND ITS SUBSIDIARIES The Group has short-term credit facilities from local banks to finance its working capital requirements, details are as follow: Lenders Credit limit Credit term Secured by Bank SinoPac - Ho Chi Minh City USD 3,000,000 1 year Inventories Branch Vietcombank- 450,000,000,000 1 years Fixed assets Ho Chi Minh City Branch Standard Chartered Bank USD 10,000,000 5 years Letter of Credit from E- land World Ltd BIDV - Hoc Mon Branch 280,000,000,000 1 year Inventories HSBC Bank (Vietnam) Ltd USD 5,000,000 1 year Inventories Vietinbank - Ho Chi Minh City 200,000,000,000 1 year Inventories Branch Vietnam International Bank - FDI Branch 50,000,000,000 1 year Inventories 24. OTHER LONG-TERM PAYABLES Other long-term payables represent the amount payable to State Treasury for the increase in value of a number of land lots which were granted to the Company or leased when it was equitized in In accordance with the asset revaluation report dated 28 September 2005, among other land lots, there were 5 land lots with the total areas of 36,716 sqm were revalued. The amount will be paid once the Company completes the transfer of title of the land use rights to the Company s name. 26
29 NOTES TO THE CONSOLIDATED FINANCIAL STATEMENTS (Continued) FORM B 09-DN/HN 25. LONG-TERM LOANS AND OBLIGATIONS UNDER FINANCE LEASES 31/12/2015 In the year 31/12/2014 Amount able to be Amount able to be Amount paid off Increases Decreases Amount paid off Long-term loans 315,580,188, ,580,188, ,147,554,902 46,190,308, ,622,942, ,622,942,843 - Vietcombank - Ho Chi Minh City Branch 142,694,136, ,694,136, ,661,232,000 6,015,216,000 15,048,120,000 15,048,120,000 - E-Land Asia Holdings Pte Ltd 157,640,000, ,640,000,000 8,120,000, ,520,000, ,520,000,000 - Bank for Investment and Development of 10,153,649,592 10,153,649,592 18,526,188,408 8,372,538, Vietnam - Hoc Mon Branch - Vietnam Development Bank - Ho Chi Minh City Branch ,342, ,342, ,342,843 - Shinhan Bank Vietnam Limited ,640,000 27,847,120,000 27,382,480,000 27,382,480,000 - ANZ Bank (Vietnam) Limited - Ho Chi Minh City Branch 5,092,403,236 5,092,403,236 8,375,494,494 3,283,091, Long-term obligations under finance leases 24,623,564,374 24,623,564,374 31,132,462,826 35,712,194,118 29,203,295,666 29,203,295,666 - Vietcombank Leasing Co., Ltd. 24,623,564,374 24,623,564,374 31,132,462,826 35,712,194,118 29,203,295,666 29,203,295, ,203,753, ,203,753, ,280,017,728 81,902,503, ,826,238, ,826,238,509 27
30 The long-term loans are from local banks and shareholders obtained by the Group, details are as follows: Lenders Contract No. Credit limits Credit term E-land Asia Holdings Pte Ltd 04/2010 USD 1,000,000 3 years E-land Asia Holdings Pte Ltd 01/2011 USD 6,000,000 3 years Vietcombank - Ho Chi Minh City Branch Vietcombank - Ho Chi Minh City Branch Vietcombank - Ho Chi Minh City Branch Vietnam Development Bank - Ho Chi Minh City Branch 0016/DTDA/13CD 23,830,000,000 5 years 0026/DTDA/13CD USD 927,359 5 years 0008/DTDA/15CD 140,202,000,000 6 years 46/HĐTD TW 22,000,000, years Shinhan Bank Vietnam Limited ,200,000,000 3 years Bank for Investment and Development of Vietnam - Hoc Mon Branch 02/2015/93435/HDTD JPY 104,500,000 3 years 30/2014/93435/HDTD 15,976,000,000 3 years ANZ Bank (Vietnam) Limited - Ho Chi Minh City Branch Vietcombank Leasing Co., Ltd USD 115,948 3 years USD 82,600 3 years USD 65,100 3 years USD 108,500 3 years /CTTC USD 615,200 3 years /CTTC USD 324,960 3 years /CTTC USD 386,400 3 years /CTTC USD 555,555 3 years /CTTC USD 535,200 3 years /CTTC USD 216, years /CTTC USD 232,800 3 years /CTTC USD 394,400 3 years /CTTC USD 81,600 3 years /CTTC USD 213, years /CTTC USD 525,000 3 years These loans are secured by fixed assets financed by the loans. Long-term loans are repayable as follows: 31/12/ /12/2014 On demand or within one year 32,198,576,119 52,283,552,000 In the second year 33,944,460,778 33,847,654,843 In the third to fifth year inclusive 265,018,700, ,775,288,000 After five years 16,617,027, ,778,764, ,906,494,843 Less: Amount due for settlement within 12 months (shown under current liabilities) 32,198,576,119 52,283,552,000 Amount due for settlement after 12 months 315,580,188, ,622,942,843 28
31 Long-term obligations under finance leases represent machinery finance leases from Vietcombank Leasing Co., Ltd. Details of obligations under finance lease are as follows: Present value of minimum lease Minimum lease payments payments 31/12/ /12/ /12/ /12/2014 Amounts payable under finance leases: 56,733,241,527 51,767,456,611 54,519,142,722 47,954,905,382 Within one year 30,457,407,872 21,080,595,994 29,895,578,348 21,012,358,580 In the second to fifth year inclusive 26,275,833,655 30,686,860,617 24,623,564,374 26,942,546,802 Less: Future finance charges 2,214,098,805 3,812,551, Present value of lease obligations 54,519,142,722 47,954,905,382 54,519,142,722 47,954,905,382 Less: Amount due for settlement within 12 months (shown under current liabilities) 29,895,578,348 18,751,609,716 Amount due for settlement after 12 months 24,623,564,374 29,203,295, LONG-TERM PROVISIONS Long-term provisions represent for the severance allowance accrued in accordance with the Group s policies. 27. OWNERS EQUITY The list of main shareholders of the Company who are holding 5% of number of share or more and other shareholders have been fixed as at 19 February 2016 and 22 December 2014 by Ho Chi Minh Stock Exchange ( HOSE ) as follows: As at 19/2/2016 As at 22/12/2014 Shares % Shares % E-Land Asia Holdings Pte Ltd 21,270, ,707,990,000 21,270, ,707,990,000 Vinatex (*) 9-90, ,000 Others 27,828, ,286,930,000 27,828, ,286,930,000 Treasury shares 100, ,004,500, , ,004,500,000 49,199, ,999,510,000 49,199, ,999,510,000 (*) Vinatex is the State shareholder Shares 31/12/ /12/2014 Number of shares issued to public 49,199,951 49,199,951 Number of treasury shares 100, ,450 Number of outstanding shares in circulation 49,099,501 49,099,501 The Company has one class of ordinary share which carry no right to receive any fixed dividend with the par value of 10,000/share. The shareholders of ordinary shares are entitles to receive dividends as declared from time to time and are entitled to have one vote per share at the Company s shareholders meetings. 29
32 NOTES TO THE CONSOLIDATED FINANCIAL STATEMENTS (Continued) FORM B 09-DN/HN Movement in owners equity: Owners' contributed Investment and Financial capital Share premium Treasury shares development fund reserve fund Other funds Retained earnings Total Balance as at 01/01/ ,999,510,000 22,720,075,000 (5,939,990,000) 2,110,908,440 40,080,890,995 15,086,185, ,801,475, ,859,054,730 Profit for the year ,400,413, ,400,413,084 Funds appropriation ,351,817,949 12,351,817,949 12,351,817,949 (55,583,180,770) (18,527,726,923) Dividends declared (78,559,201,600) (78,559,201,600) Balance as at 31/12/ ,999,510,000 22,720,075,000 (5,939,990,000) 14,462,726,389 52,432,708,944 27,438,003, ,059,505, ,172,539,291 Apply new accounting policy ,432,708,944 (52,432,708,944) Balance as at 01/01/ ,999,510,000 22,720,075,000 (5,939,990,000) 66,895,435,333-27,438,003, ,059,505, ,172,539,291 Profit for the year ,530,498, ,530,498,145 Funds appropriation ,520,123, (92,620,227,197) (42,100,103,271) Dividends for year 2014 declared (29,459,700,600) (29,459,700,600) Balance as at 31/12/ ,999,510,000 22,720,075,000 (5,939,990,000) 117,415,559,259-27,438,003, ,510,076, ,143,233,565 According to Circular No. 200/2014/TT-BTC issued by the Ministry of Finance on 22 December 2014, the Company has transferred balance as at 31 December 2014 of Financial reserve fund to Investment and Development fund. According to the 2015 Annual General Shareholders Meeting minute No. 01/2015/BB-DHCD dated on 04 April 2015, the Company s shareholders approved the plan of appropriation for the Investment and Development fund and Bonus and Welfare funds at the ratio of 30% and 25% of consolidated profit after tax of the year 2014, respectively. According to General Shareholders Resolution No. 01/2015/NQ-DHCD dated 04 April 2015, the Company s shareholders approved to pay dividend of the year 2014 at the ratio of 12% of share s par value. 30
33 28. NON-CONTROLLING INTERESTS Non-controlling interest rate is calculated as follows: Thanh Cong Thanh Cong - Medical Center Thanh Quang Vinh Long TC Eland Charter capital of subsidiaries 21,700,000,000 22,000,000,000 37,293,406,255 3,000,000,000 In which: Contributed capital from the Company 15,395,000,000 21,450,000,000 37,293,406,255 3,000,000,000 Contributed capital from minority interests 6,305,000, ,000, Non-controlling interests rate 29.06% 2.50% - - Non-controlling interests base on net assets as at 31 December 2015: Thanh Cong Thanh Cong - Medical Center Thanh Quang Vinh Long TC Eland Total Total assets 22,333,905,140 22,000,000, ,727,230,870 3,455,888, ,517,024,189 Total liabilities 1,686,626, ,679,006,250 95,600, ,461,233,301 Total net assets 20,647,278,605 22,000,000,000 48,224,620 3,360,287,663 46,055,790,888 In which: Owners' contributed capital 21,700,000,000 22,000,000,000 37,293,406,255 3,000,000,000 83,993,406,255 Share premium (1,340,000,000) (1,340,000,000) Retained earning/(accumulated losses) 287,278,605 - (37,245,181,635) 360,287,663 (36,597,615,367) Non-controlling interests 5,999,079, ,000, ,549,079,163 In which: Owners' contributed capital 6,305,000, ,000, ,855,000,000 Share premium (389,404,000) (389,404,000) Retained earnings 83,483, ,483,163 Non-controlling interests based on business result for the year ended 31 December 2015: Thanh Cong Thanh Cong - Medical Center Thanh Quang Vinh Long TC Eland Total Profit/(loss) after tax of subsidiaries 717,745,543 - (37,245,181,635) 360,287,663 (36,167,148,429) Profit after tax of 208,576, ,576,854 non-controlling interest Changes of non-controlling interests during the year as follows: Owner s contributed capital Share premium Accumulated losses Total Balance as at 01/01/2015 7,055,000,000 (389,404,000) (325,093,691) 6,340,502,309 Profit during the year ,576, ,576,854 Balance as at 31/12/2015 7,055,000,000 (389,404,000) (116,516,837) 6,549,079,163 31
34 29. OFF BALANCE SHEET ITEM Foreign currencies: 31/12/ /12/ United State Dollar (USD) 1,360,416 3,938,287 - Japanese Yen ("JPY") 99, ,791 - Euro ("EUR") BUSINESS AND GEOGRAPHICAL SEGMENTS Business segments The business segment report includes items directly attributable to a segment as well as for segments on reasonable basis. Unallocated items include financial income, financial expenses, selling expenses, general and administration expenses, profit from other activities, and corporate income tax. The income statement of business segment report during the year is as follows: Garment and textile Revenue 2,755,954,819,482 2,533,477,304,870 Cost of goods sold 2,343,359,998,545 2,172,087,419,203 Gross profit 412,594,820, ,389,885,667 Healthcare services Revenue 28,890,853,838 30,596,219,851 Cost of goods sold 21,905,601,829 22,961,780,609 Gross profit 6,985,252,009 7,634,439,242 Others Revenue 7,049,797,162 7,336,913,812 Cost of goods sold 206,748, ,065,062 Gross profit 6,843,048,445 7,232,848,750 Geographical segments Geographical segments report depends on geographic location of customers in Vietnam ( Domestic ) or in countries other than Vietnam ("Export"). The Group does not prepare the segment report for items on the balance sheet due to insufficient basis for separation Domestic Revenue 278,674,548, ,962,236,813 Cost of goods sold 253,014,955, ,224,115,762 Gross profit 25,659,592,631 41,738,121,051 Export Revenue 2,513,220,922,223 2,295,448,201,720 Cost of goods sold 2,112,457,393,463 1,960,929,149,112 Gross profit 400,763,528, ,519,052,608 The consolidated financial statements do not present segments asset due to such information does not available to the Board of Directors. 32
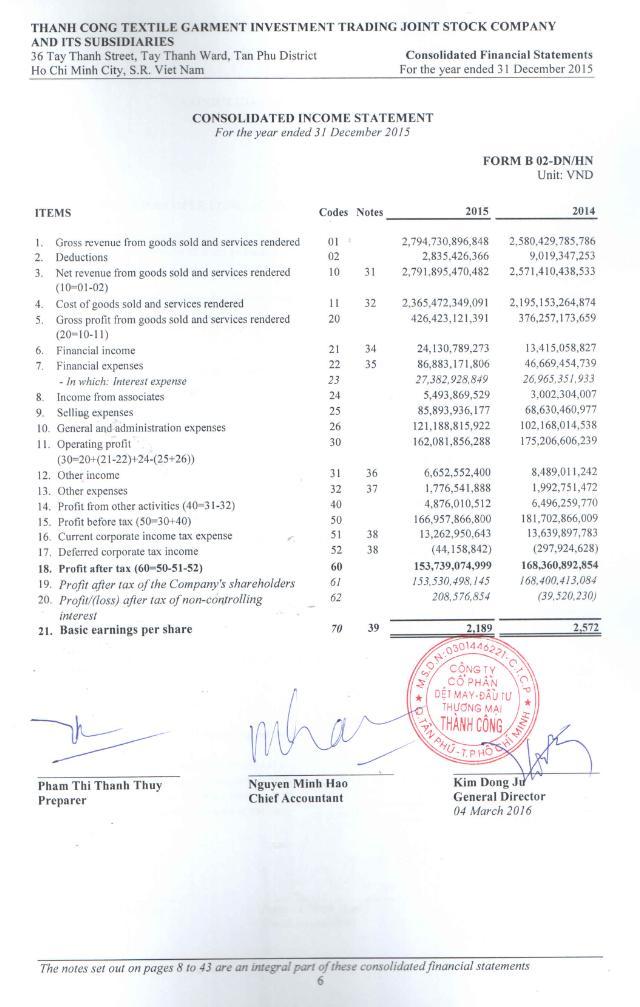
35 31. NET REVENUE FROM GOODS SOLD AND SERVICES RENDERED Sales of merchandise and services Garment and textile products 2,678,348,158,423 2,476,915,765,002 Processing fees 79,560,031,576 65,580,887,121 Others 36,822,706,849 37,933,133,663 2,794,730,896,848 2,580,429,785,786 In which: Revenue from related parties (Note 42) 949,586,523, ,341,128,107 Deductions Sales returns and discounts (2,835,426,366) (9,019,347,253) 2,791,895,470,482 2,571,410,438, COST OF GOODS SOLD AND SERVICES RENDERED Raw materials 1,445,023,026,180 1,460,932,890,078 Labour costs 462,098,414, ,754,427,141 Depreciation and amortisation 60,189,240,713 50,472,223,851 Overheads 391,171,426, ,570,897,790 Others 6,990,241,043 18,422,826,014 2,365,472,349,091 2,195,153,264, PRODUCTION COST BY NATURE Materials 1,348,850,566,683 1,419,456,854,231 Labor cost 516,950,709, ,247,141,750 Depreciation and amortisation 69,207,337,981 58,540,985,043 Out-sourced services 570,692,675, ,338,983,935 Others 121,921,028,316 95,150,622,639 2,627,622,317,428 2,408,734,587, FINANCIAL INCOME Bank and loan interest 2,656,896,347 2,267,325,286 Dividend income 176,250, ,250,000 Foreign exchange gain 21,297,642,926 10,971,483,541 24,130,789,273 13,415,058,827 33
36 35. FINANCIAL EXPENSES Interest expense 27,382,928,849 26,965,351,933 Reversal provision for financial investments (390,564,000) (165,989,700) Foreign exchange loss 59,890,806,957 19,863,652,506 Others - 6,440,000 86,883,171,806 46,669,454, OTHER INCOME Proceeds from disposals of fixed assets 3,915,806,724 2,205,744,329 Proceeds from sales of material, supplies 883,449,875 4,202,576 Others 1,853,295,801 6,279,064,337 6,652,552,400 8,489,011, OTHER EXPENSES Expense for sales of material, supplies 879,738, ,250 Others 896,803,201 1,992,245,222 1,776,541,888 1,992,751, CORPORATE INCOME TAX EXPENSES Current corporate income tax expenses - Corporate income tax based on taxable profit in the current year - Adjustments for corporate income tax expenses in previous years to the current year ,842,606,621 14,227,088, ,344,022 (587,191,060) Total current corporate income tax expenses 13,262,950,643 13,639,897,783 34
37 The corporate income tax expense based on taxable profit in the current year was computed as follows: Profit before tax 166,957,866, ,702,866,009 Adjust for 1,583,068,814 7,181,666,695 - Increase taxable income 9,858,885,347 11,912,613,481 - Decrease taxable income (8,275,816,533) (4,730,946,786) Assesable income 168,540,935, ,884,532,704 Of which: + Income from activities which entitled incentive tax rate 167,085,462, ,465,574,836 + Income from office rental service Income from TC Eland 450,359, Other income 1,005,113, ,957,868 Applicable tax rate + For income from activities which entitled incentive tax rate 15% 15% + For income from office rental service 20% 20% + For income from TC Eland 20% 0% + For other income 22% 22% Corporate income tax 25,374,016,288 28,362,006,956 Tax reduction (12,531,409,667) (14,134,918,113) Corporate income tax based on taxable profit 12,842,606,621 14,227,088,843 in the current year Deferred corporate income tax - Deductible temporary differences 44,158, ,924,628 Total deferred corporate income tax 44,158, ,924,628 The Company is obliged to pay corporate income tax ( CIT ) at the rate of 15% in 12 years from 2006 to 2017 for its principal activities manufactured in an industrial park. The Company is entitled CIT exemption for 3 years from the first profit making year and the 50% reduction for the following subsequent 7 years. This is under the Article 36, Decree No.187/2004/ND-CP dated 16 November 2004, Decree No.164/2003/ND-BTC dated 22 December 2003, Circular No.128/2003/TT-BTC dated 22 December 2003 and Circular No.88/2004/TT-BTC dated 01 September The year 2006 was the first year the Company had taxable profit. The year 2009 was the first year the Company entitled to the 50% CIT reduction. For the activity relating to office rental service in an industrial park, the Company is obliged to pay CIT at the rate of 20% in 10 years from 2006 to The Company is entitled CIT exemption for 2 years from the first profit making year and the 50% reduction for the following subsequent 6 years basing on the Circular No.88/2004/TT-BTC dated 01 September 2004 issued by Ministry of Finance to modify, supplement Circular No.128/2003/TT-BTC dated 22 December The year 2006 was the first year the Company had taxable profit. The year 2008 was the first year the Company entitled to the 50% CIT reduction. This year 2015, the Company applies the rate of 20% for the taxable income from this activity. For the other activities, the Company is obliged to pay CIT at the rate of 22%. TC Eland is obligated to pay corporate income tax at the rate of 20% and the Company's remaining subsidiaries are obliged to pay corporate income tax at the rate of 22%. 35
38 39. BASIC EARNINGS PER SHARE The calculation of the basic earnings per share attributable to the ordinary equity holders of the Company is based on the data as below and the certain reclassification has been made to the prior year s figures in accordance with the guidance of Circular 200 to enhance their comparability with the current year s presentation: Profit for the year attributable to equity holders 153,530,498, ,400,413,084 of the Company Less: appropriation of bonus and welfare fund 46,059,149,444 42,100,103,271 Earnings for the purposes of basic earnings 107,471,348, ,300,309,813 per share Weighted average number of ordinary shares for the 49,099,501 49,099,501 purposes of basic earnings per share Earnings per share 2,189 2, OPERATING LEASE COMMITMENTS Minimum lease payments under operating leases recognised in income statement for the year 9,192,192,144 5,990,350,376 At the balance sheet date, the Group had outstanding commitments under non-cancelable operating leases, which fall due as follows: 31/12/ /12/2014 Within one year 6,525,437,584 8,290,121,879 In the second to fifth years inclusive 25,258,950,336 30,586,787,517 After five years 25,099,717,815 66,209,576,760 56,884,105, ,086,486,156 Operating lease payments represent total rentals payable by the Group for land leases at Tan Phu District - Ho Chi Minh City and management fee at Tan Binh Industrial Zone Ho Chi Minh City and Trang Bang Industrial Zone Tay Ninh Province. The contract terms and rental charges are determined per each specific contract. 41. FINANCIAL INSTRUMENTS Capital risk management The Group manages its capital to ensure that the Group will be able to continue as a going concern while maximizing the return to shareholders through the optimization of the debt and equity balance. The capital structure of the Group consists of net debt (borrowings as disclosed in Note 23 and 25, offset by cash and cash equivalents), and equity attributable to shareholders (comprising owners contributed capital, share premium, treasury shares, funds and retained earnings). 36
39 Gearing ratio The gearing ratio of the Group as at the balance sheet date was as follows: 31/12/ /12/2014 Borrowings 1,158,067,908, ,729,079,407 Less: Cash and cash equivalents (88,198,067,189) (140,749,128,463) Net debt 1,069,869,841, ,979,950,944 Equity 895,692,312, ,513,041,600 Net debt to equity ratio Significant accounting policies Details of the significant accounting policies and methods adopted (including the criteria for recognition, the bases of measurement, and the bases for recognition of income and expenses) for each class of financial assets and financial liabilities are disclosed in Note 4. Categories of financial instruments Carrying amounts 31/12/ /12/2014 Financial assets Cash and cash equivalents 88,198,067, ,749,128,463 Trade and other receivables 156,584,112, ,502,448,935 Investments 2,767,600,000 2,767,600,000 Deposits 368,650, ,180, ,918,429, ,455,357,398 Financial liabilities Obligations under finance leases 54,519,142,722 47,954,905,382 Borrowings 1,103,548,766, ,774,174,025 Trade and other payables 221,040,634, ,844,450,778 Accrued expenses 31,964,913,478 10,766,268,840 1,411,073,456,361 1,040,339,799,025 The Group has not assessed fair value of its financial assets and liabilities as at the balance date since there are no comprehensive guidance under Circular 210/2009/TT-BTC issued by the Ministry of Finance on 06 November 2009 ( Circular 210 ) and other relevant prevailing regulations to determine fair value of these financial assets and liabilities. While Circular 210 refers to the application of International Financial Reporting Standards ( IFRS ) on presentation and disclosures of financial instruments, it did not adopt the equivalent guidance for the recognition and measurement of financial instruments, including application of fair value, in accordance with IFRS. Financial risk management objectives The Group has set up risk management system to identify and assess the risks exposed by the Group and designed control policies and procedures to manage those risks at an acceptable level. Risk management system is reviewed on a regular basis to reflect changes in market conditions and the Group s operations. Financial risks include market risk (including foreign currency risk, interest rate risk, share price risk and commodity price risk), credit risk and liquidity risk. 37
40 Market risk Foreign currency risk management The Group undertakes certain transactions denominated in foreign currencies; consequently, exposures to exchange rate fluctuations arise. The carrying amounts of the Group s foreign currency denominated monetary assets and monetary liabilities at the end of the year are as follows: Asset Liabilities 31/12/ /12/ /12/ /12/2014 United States Dollar (USD) 180,370,962, ,620,592,371 1,031,735,997, ,918,377,056 Euro (EUR) 5,400,842 6,006,132 3,492,919, ,861,065 Japanese Yen (JPY) 18,421,424 17,931,727 11,636,780,000 - South Korean Won (KRW) ,188, ,394,784, ,644,530,230 1,047,147,884, ,159,238,121 Foreign currency sensitivity analysis The Group is mainly exposed to United States Dollar, Euro and Japanese Yen. The following table details the Group's sensitivity to a 5% increase and decrease in Vietnam Dong against the relevant foreign currencies. 5% is the sensitivity rate used when reporting foreign currency risk internally to key management personnel and represents Board of Directors assessment of the reasonably possible change in foreign exchange rates. The sensitivity analysis includes only outstanding foreign currency denominated monetary items and adjusts their translation at the year end for a 5% change in foreign currency rates. For a 5% increase/decrease in the following foreign currencies against Vietnam Dong, the profit before tax for the year would decrease/increase by the same amount as follows: United States Dollar (USD) (42,568,251,730) (34,264,889,234) Euro (EUR) (174,375,914) (11,742,747) Japanese Yen (JPY) (580,917,929) 896,586 (43,323,545,573) (34,275,735,395) Applying the same analysis to South Korean Won, the increase/decrease in South Korean Won would not have material effect to the profit before tax of the Group during the year. Interest rate risk management The Group has significant interest rate risks arising from interest bearing loans which are arranged. The risk is managed by the Group by maintaining an appropriate level of borrowings and analyzing market competition to enjoy favorable interest rates from appropriate lenders. 38
41 Interest rate sensitivity The loan s sensitivity to interest rate changes which may arise at an appropriate level. Assuming all other variables were held constant, if interest rates applicable to floating interest bearing loans had been 200 basis points higher/lower, the Company s profit before tax for the year ended 31 December 2015 would have decreased/increased by 22,070,975,322 (2014: 16,415,483,481). Share price risk management Shares held by the Group are affected by market risks arising from the uncertainty about future prices of such shares. The Group manages this risk exposure by setting up investment limits. The Company s Board of Directors also assesses and approves decisions on share investments such as operating industry, investees, etc. The Group assesses the share price risk to be immaterial. The Group is also exposed to equity price risks arising from investments in subsidiaries and associates. The Company s Board of Directors assesses and approves decisions on investments in subsidiaries and associates such as operating industry, investees, etc. Investments in subsidiaries and associates are held for long-term strategic investments rather than trading purposes. The Group does not have intention to trade these investments in the foreseeable future. Commodity price risk management The Group purchases materials, commodities from local and foreign suppliers for business purpose. Therefore, the Group is exposed to the risk of changes in selling prices of materials, commodities. Credit risk Credit risk refers to the risk that counterparty will default on its contractual obligations resulting in financial loss to the Group. The Group has a credit policy in place and the exposure to credit risk is monitored on an ongoing basis. The Group does not have any significant credit risk exposure to any counterparty because receivables consist of a large number of customers, spread across diverse industries and geographical areas. Liquidity risk management The purpose of liquidity risk management is to ensure the availability of funds to meet present and future financial obligations. Liquidity is also managed by ensuring that the excess of maturing liabilities over maturing assets in any period is kept to manageable levels relative to the amount of funds that the Group believes can generate within that period. The Group policy is to regularly monitor current and expected liquidity requirements to ensure that the Group maintains sufficient reserves of cash, borrowings and adequate committed funding from its shareholders to meet its liquidity requirements in the short and longer term. The following table details the Group s remaining contractual maturity for its non-derivative financial assets and financial liabilities with agreed repayment periods. The tables have been drawn up based on the undiscounted cash flows of financial assets and undiscounted cash flows of financial liabilities based on the earliest date on which the Group can be required to pay. The inclusion of information on non-derivative financial assets is necessary in order to understand the Group s liquidity risk management as the liquidity is managed on a net asset and liability basis. 39
42 31/12/2015 Less than 1 year Over 1 year Total Cash and cash equivalents 88,198,067,189-88,198,067,189 Trade and other receivables 156,584,112, ,584,112,290 Investments - 2,767,600,000 2,767,600,000 Deposits 333,650,000 35,000, ,650, ,115,829,479 2,802,600, ,918,429,479 Obligations under finance leases 29,895,578,348 24,623,564,374 54,519,142,722 Borrowings 787,968,577, ,580,188,828 1,103,548,766,107 Trade and other payables 221,040,634, ,040,634,054 Accrued expense 31,964,913,478-31,964,913,478 1,070,869,703, ,203,753,202 1,411,073,456,361 Net liquidity gap (825,753,873,680) (337,401,153,202) (1,163,155,026,882) 31/12/2014 Less than 1 year Over 1 year Total Cash and cash equivalents 140,749,128, ,749,128,463 Trade and other receivables 146,502,448, ,502,448,935 Investments - 2,767,600,000 2,767,600,000 Deposits 401,180,000 35,000, ,180, ,652,757,398 2,802,600, ,455,357,398 Obligations under finance leases 18,751,609,716 29,203,295,666 47,954,905,382 Borrowings 628,151,231, ,622,942, ,774,174,025 Trade and other payables 160,844,450, ,844,450,778 Accrued expense 10,766,268,840-10,766,268, ,513,560, ,826,238,509 1,040,339,799,025 Net liquidity gap (530,860,803,118) (219,023,638,509) (749,884,441,627) Regardless of the existing net liquidity gap, the Board of Directors believes that the Group will be able to generate sufficient funds to meet its financial obligations as and when they fall due from internally generated cash flows and maintains the minimum credit lines available. Undrawn facilities are disclosed in Note 23 and RELATED PARTY TRANSACTIONS AND BALANCES List of related parties: Name Eland Asia Holdings Pte Ltd Thanh Chi Corporation Eland World Limited Eland International Fashion (Shanghai) Co., Ltd Eland Fashion (Shanghai) Co., Ltd Eland Fashion Hong Kong Limited - Taiwan Branch Eland Asia Holding Pte.Ltd - Hong Kong Brach Eland Fashion Hong Kong Limited Eland Retail Limited Eland Viet Nam Co., Ltd S.Y VINA Joint Stock Company Savimex Corporation Wish Trading (Shanghai) Co., Ltd Wish Fashion (Shanghai) Co., Ltd 40 Relationship Main shareholder Associate Company in Eland Group Company in Eland Group Company in Eland Group Company in Eland Group Company in Eland Group Company in Eland Group Company in Eland Group Company in Eland Group Company in Eland Group Company in Eland Group Company in Eland Group Company in Eland Group
43 During the year, the Group entered into the following significant transactions with its related parties: Sales Eland World Limited 547,723,166, ,734,670,923 Eland International Fashion (Shanghai) Co., Ltd 173,302,392,515 96,895,048,070 Eland Fashion (Shanghai) Co., Ltd 75,533,795,546 45,183,950,494 Eland Asia Holding Pte.Ltd - Hong Kong Branch 110,819,984,998 - Eland Fashion Hong Kong Ltd - Taiwan Branch 389,940,189 - Wish Fashion (Shanghai) Co., Ltd 19,806,415,435 17,439,652,676 S.Y VINA Joint Stock Company 10,031,040 11,744,727 Eland Fashion Hong Kong Limited 20,574,309,122 11,455,511,377 Eland Retail Limited 779,483,161 6,944,618,574 Eland Vietnam Co., Ltd. 647,005,234 1,675,931, ,586,523, ,341,128,107 Purchases Eland World Limited 45,539,875,591 37,634,227,008 Eland International Fashion (Shanghai) Co., Ltd 141,438,650,163 58,131,329,874 Eland Vietnam Co., Ltd. 2,327,152,594 72,391,200 S.Y VINA Joint Stock Company 114,111,270 - Savimex Corporation 3,357,174,624 1,960,211,261 Wish Trading (Shanghai) Co., Ltd 1,370,300, ,488,538 Loan interest E-land Asia Holdings Pte Ltd 1,535,197,469 1,285,030,254 Dividends declared to E-land Asia Holdings Pte Ltd 25,524,958,800 21,270,799,000 Remuneration paid to the Board of Directors during the year was as follows: Salaries and benefits in kind 9,369,335,041 10,138,038,249 Significant related party balances as at the balance sheet date were as follows: 31/12/ /12/2014 Short-term trade receivables Eland Fashion (Shanghai) Co., Ltd 1,543,419,990 3,165,231,813 Eland Fashion Hong Kong Ltd 1,130,604,900 2,385,261,588 Eland World Limited 47,517,326,523 22,961,175,289 Eland International Fashion (Shanghai) Co., Ltd 3,085,948,489 1,713,623,088 Eland Asia Holding Pte.Ltd - Hong Kong Branch 21,935,155,050 - Eland Fashion Hong Kong Ltd - Taiwan Branch 175,475,935 - Eland Retail Limited - 1,823,045,028 Eland Vietnam Co., Ltd ,936,635 Wish Fashion (Shanghai) Co., Ltd - 834,265,850 75,387,930,887 32,983,539,291 41
44 31/12/ /12/2014 Other receivables Thanh Chi Corporation 1,040,950,000 2,602,375,000 Short-term trade payables Eland International Fashion (Shanghai) Co., Ltd 31,397,592,759 8,139,709,455 Eland World Limited 11,922,392,020 4,128,022,920 Wish Trading (Shanghai) Co.Ltd 107,343,157 - S.Y VINA Joint Stock Company 24,015,646 - Savimex Corporation 298,310, ,294,364 43,749,653,990 12,474,026,739 Loan payable E-land Asia Holdings Pte Ltd 157,640,000, ,520,000,000 Loan interest payable E-land Asia Holdings Pte Ltd 6,212,814,898 4,677,617, SUPPLEMENTAL NON-CASH DISCLOSURES ARE STATED ON CONSOLIDATED CASH FLOW STATEMENT Dividends paid during the year excluded an amount of 118,884,570, representing dividends declared that have not yet been paid (2014: 29,566,537,650). Consequently, changes in accounts payable have been adjusted by the same amount. 42
45
THANH CONG TEXTILE GARMENT INVESTMENT TRADING JOINT STOCK COMPANY AND ITS SUBSIDIARIES (Incorporated in the Socialist Republic of Vietnam)
") THANH CONG TEXTILE GARMENT INVESTMENT TRADING JOINT STOCK COMPANY (Incorporated in the Socialist Republic of Vietnam) REVIEWED CONSOLIDATED FINANCIAL STATEMENTS For the period from 01 January 2015 to 30
THANH CONG TEXTILE GARMENT INVESTMENT TRADING JOINT STOCK COMPANY (Incorporated in the Socialist Republic of Vietnam) REVIEWED CONSOLIDATED FINANCIAL STATEMENTS For the period from 01 January 2015 to 30
THANH CONG TEXTILE GARMENT INVESTMENT TRADING JOINT STOCK COMPANY (Incorporated in the Socialist Republic of Vietnam)
") (Incorporated in the Socialist Republic of Vietnam) REVIEWED SEPARATE FINANCIAL STATEMENTS For the period from 01 January 2015 to 30 June 2015 August 2015 36 Tay Thanh Street, Tay Thanh Ward, Tan Phu District
(Incorporated in the Socialist Republic of Vietnam) REVIEWED SEPARATE FINANCIAL STATEMENTS For the period from 01 January 2015 to 30 June 2015 August 2015 36 Tay Thanh Street, Tay Thanh Ward, Tan Phu District
THANH CONG TEXTILE GARMENT INVESTMENT TRADING JOINT STOCK COMPANY AND ITS SUBSIDIARIES (Incorporated in the Socialist Republic of Vietnam)
") THANH CONG TEXTILE GARMENT INVESTMENT TRADING JOINT STOCK COMPANY AND ITS SUBSIDIARIES (Incorporated in the Socialist Republic of Vietnam) AUDITED CONSOLIDATED FINANCIAL STATEMENTS For the year ended 31
THANH CONG TEXTILE GARMENT INVESTMENT TRADING JOINT STOCK COMPANY AND ITS SUBSIDIARIES (Incorporated in the Socialist Republic of Vietnam) AUDITED CONSOLIDATED FINANCIAL STATEMENTS For the year ended 31
THANH CONG TEXTILE GARMENT INVESTMENT TRADING JOINT STOCK COMPANY AND ITS SUBSIDIARIES
 THANH CONG TEXTILE GARMENT INVESTMENT TRADING JOINT STOCK COMPANY AND ITS SUBSIDIARIES (Incorporated in the S.R of Vietnam) AUDITED CONSOLIDATED FINANCIAL STATEMENTS For the year ended 31 December 2012
THANH CONG TEXTILE GARMENT INVESTMENT TRADING JOINT STOCK COMPANY AND ITS SUBSIDIARIES (Incorporated in the Socialist Republic of Vietnam)
") THANH CONG TEXTILE GARMENT INVESTMENT TRADING JOINT STOCK COMPANY AND ITS SUBSIDIARIES (Incorporated in the Socialist Republic of Vietnam) REVIEWED CONSOLIDATED FINANCIAL STATEMENTS For the six-month period
THANH CONG TEXTILE GARMENT INVESTMENT TRADING JOINT STOCK COMPANY AND ITS SUBSIDIARIES (Incorporated in the Socialist Republic of Vietnam) REVIEWED CONSOLIDATED FINANCIAL STATEMENTS For the six-month period
THANH CONG TEXTILE GARMENT INVESTMENT TRADING JOINT STOCK COMPANY
 CONSOLIDATED INTERIM FINANCIAL STATEMENTS FOR THE SIX-MONTH PERIOD ENDED 30 JUNE 2011 CONSOLIDATED INTERIM FINANCIAL STATEMENTS FOR THE SIX-MONTH PERIOD ENDED 30 JUNE 2011 TABLE OF CONTENTS PAGE Corporate
Ma San Group Corporation (formerly known as Masan Shipping Corporation) and its subsidiaries
 and its subsidiaries") Ma San Group Corporation (formerly known as Masan Shipping Corporation) and its Consolidated Financial Statements for the year ended 31 December 2009 Ma San Group Corporation (formerly known as Masan Shipping
Ma San Group Corporation (formerly known as Masan Shipping Corporation) and its Consolidated Financial Statements for the year ended 31 December 2009 Ma San Group Corporation (formerly known as Masan Shipping
Ma San Group Corporation Corporate Information
 Ma San Corporation Corporate Information Business Registration Certificate No 0303576603 20 August 2014 The Company s Business Registration Certificate has been amended several times, the most recent of
CENTURY 21 JOINT STOCK COMPANY CENTURY 21 JOINT STOCK COMPANY CONSOLIDATED FINANCIAL STATEMENTS FOR THE PERIOD ENDED 30 SEPTEMBER 2015
 CENTURY 21 JOINT STOCK COMPANY CONSOLIDATED FINANCIAL STATEMENTS FOR THE PERIOD ENDED 30 SEPTEMBER 2015 This Financial Statements was translated from Vietnamese Official Financial Statements and internal
Thanh Thanh Cong Tay Ninh Joint Stock Company
 Interim consolidated financial statements 31 December 2016 CONTENTS Pages General information 1-2 Report of management 3 Report on review of interim consolidated financial statements 4-5 Interim consolidated
Ma San Group Corporation Corporate Information
 Ma San Group Corporation Corporate Information Business Registration Certificate No 0303576603 13 June 2013 The Company s Business Registration Certificate has been amended several times, the most recent
Deloitte AUDITED FINANCIAL STATEMENTS NATSTEEL VINA COMPANY LIMITED. (Incorporated in the Socialist Republic o f Vietnam)
") Deloitte NATSTEEL VINA COMPANY LIMITED (Incorporated in the Socialist Republic o f Vietnam) AUDITED FINANCIAL STATEMENTS TABLE OF CONTENTS CONTENTS PAGE(S) STATEMENT OF THE BOARD OF DIRECTORS 1-2 INDEPENDENT
Deloitte NATSTEEL VINA COMPANY LIMITED (Incorporated in the Socialist Republic o f Vietnam) AUDITED FINANCIAL STATEMENTS TABLE OF CONTENTS CONTENTS PAGE(S) STATEMENT OF THE BOARD OF DIRECTORS 1-2 INDEPENDENT
Hoa Phat Group Joint Stock Company. Separate Financial Statements for the year ended 31 December 2011
 Separate Financial Statements for the year ended 31 December 2011 Report of the Board of Directors The Board of Directors of ( the Company ) is pleased to present its report and the separate financial
Thanh Thanh Cong Tay Ninh Joint Stock Company
 Interim separate financial statements 31 December 2016 GENERAL INFORMATION CONTENTS Pages General information 1-2 Report of management 3 Report on review of interim separate financial information 4-5 Interim
Independence- Freedom- Happiness No. 89/2002/TT-BTC Hanoi, 9 October 2002 CIRCULAR
 MINISTRY OF FINANCE Socialist Republic of Vietnam Independence- Freedom- Happiness ------------------------- ----------------------------- No. 89/2002/TT-BTC Hanoi, 9 October 2002 CIRCULAR GUIDELINES ON
VNDIRECT Securities Joint Stock Company. Consolidated Interim Financial Statements for the six-month period ended 30 June 2017
 IRECT Securities Joint Stock Company Consolidated Interim Financial Statements for the six-month period ended 30 June 2017 IRECT Securities Joint Stock Company Corporate Information Securities Operating
Hoa Phat Group Joint Stock Company and its subsidiaries Report of the Board of Directors
 Report of the Board of Directors The Board of Directors of Hoa Phat Group Joint Stock Company ( the Company ) is pleased to present its report and the consolidated financial statements of the Company and
Notes to the Financial Statements For the year ended 31 December 2006
 1. GENERAL The Company is a public limited company incorporated in Hong Kong and its shares are listed on The Stock Exchange of Hong Kong Limited (the Stock Exchange ). Shougang Holding (Hong Kong) Limited
FINANCIAL REPORT Quarter
 CHEMICAL PHARMACEUTICAL JOINT-STOCK COMPANY FINANCIAL REPORT Quarter 4-2017 Headquarters: 297/5 Ly Thuong Kiet Street, Ward 15, District 11, Ho Chi Minh City Form B 01 - DN ASSETS Unit : VND Code Notes
Ho Chi Minh City Development Bank
 Report of the Board of Management and Audited consolidated financial statements Reference: 60752693/16527313 INDEPENDENT AUDITORS REPORT To: The Shareholders of Ho Chi Minh City Development Bank We have
TATA COFFEE VIETNAM COMPANY LIMITED (Incorporated in the Socialist Republic of Vietnam)
") (Incorporated in the Socialist Republic of Vietnam) AUDITED FINANCIAL STATEMENTS FOR THE PERIOD FROM 28 MARCH 2017 (DATE OF INCORPORATION) TO 31 MARCH 2018 No.12 VSIP II-A, Street No.32, Vietnam Singapore
(Incorporated in the Socialist Republic of Vietnam) AUDITED FINANCIAL STATEMENTS FOR THE PERIOD FROM 28 MARCH 2017 (DATE OF INCORPORATION) TO 31 MARCH 2018 No.12 VSIP II-A, Street No.32, Vietnam Singapore
Qatari German Company for Medical Devices Q.S.C.
 Qatari German Company for Medical Devices Q.S.C. FINANCIAL STATEMENTS 31 DECEMBER 2015 STATEMENT OF COMPREHENSIVE INCOME Notes (As restated) Revenues 3 16,412,886 15,826,056 Direct costs 4 ( 14,893,962)
ASIA AVIATION PUBLIC COMPANY LIMITED CONSOLIDATED AND COMPANY FINANCIAL STATEMENTS 31 DECEMBER 2015
 ASIA AVIATION PUBLIC COMPANY LIMITED CONSOLIDATED AND COMPANY FINANCIAL STATEMENTS 31 DECEMBER 2015 Asia Aviation Public Limited Statement of Financial Position As at 31 December 2015 Notes Assets Current
MODEL FINANCIAL STATEMENTS INTERNATIONAL GAAP HOLDINGS LIMITED
 MODEL FINANCIAL STATEMENTS INTERNATIONAL GAAP HOLDINGS LIMITED MODEL FINANCIAL STATEMENTS INTERNATIONAL GAAP HOLDINGS LIMITED Financial Statements for the year ended 31 December 2001 The model financial
Joint Stock Company INTERIM CONSOLIDATED FINANCIAL STATEMENTS QUARTER I 2016
 Vingroup Joint Stock Company INTERIM CONSOLIDATED FINANCIAL STATEMENTS QUARTER I 2016 CONTENTS Pages General information Report of management Interim consolidated balance sheet Interim consolidated income
VNDIRECT Securities Joint Stock Company. Financial Statements for the year ended 31 December 2016
 IRECT Securities Joint Stock Company Financial Statements for the year ended 31 December 2016 IRECT Securities Joint Stock Company Corporate Information Securities Operating Licence No. 101/UBCK-GP 31
RECRON (MALAYSIA) SDN. BHD. 1 RECORN (MALAYSIA) SDN. BHD.
 SDN. BHD. 1 RECORN (MALAYSIA) SDN. BHD.") RECRON (MALAYSIA) SDN. BHD. 1 RECORN (MALAYSIA) SDN. BHD. 2 RECRON (MALAYSIA) SDN. BHD. Independent Auditor s Report TO THE MEMBER OF RECRON (MALAYSIA) SDN. BHD. (Incorporated in Malaysia) (Company No.
RECRON (MALAYSIA) SDN. BHD. 1 RECORN (MALAYSIA) SDN. BHD. 2 RECRON (MALAYSIA) SDN. BHD. Independent Auditor s Report TO THE MEMBER OF RECRON (MALAYSIA) SDN. BHD. (Incorporated in Malaysia) (Company No.
NOTES TO THE FINANCIAL STATEMENTS
 5. SIGNIFICANT ACCOUNTING POLICIES (CONTINUED) Properties under for sale Properties under for sale are stated at the lower of cost and net realisable value. Net realisable value represents the estimated
Vitafoam Nigeria Plc. Unaudited Interim Consolidated and separate financial statements for the 3 months ended 31 December, 2016
 Unaudited Interim Consolidated and separate financial statements for the 3 months ended 31 December, 2016 Unaudited Interim Consolidated and separate financial statements for the 3 months ended 31 December,
FINANCIAL STATEMENTS
 FINANCIAL STATEMENTS 2 ab LIETUVOS PAŠTAS FINANCIAL STATEMENTS 2010 CONTENTS Contents 3 5 7 8 9 11 29 Independent auditors report to the shareholder of PUBLIC LIMITED company Lietuvos paštas BALANCE SHEET
Changes in ownership interests in subsidiary companies without change of control
 Annual Report 2014 SERSOL BERHAD 59 3. Significant Accounting Policies (cont d) (a) Basis of consolidation (cont d) (i) Subsidiary companies (cont d) Inter-company transactions, balances and unrealised
Principal Accounting Policies
 1. Basis of Preparation The accounts have been prepared in accordance with Hong Kong Financial Reporting Standards ( HKFRS ). The accounts have been prepared under the historical cost convention as modified
Interfood Shareholding Company and its subsidiary. Consolidated Interim Financial Statements for the six-month period ended 30 June 2015
 Interfood Shareholding Company and its subsidiary Consolidated Interim Financial Statements for the six-month period ended 30 June 2015 Interfood Shareholding Company Corporate information Investment Licence
FINANCIAL REPORT Quarter II
 CHEMICAL PHARMACEUTICAL JOINT-STOCK COMPANY FINANCIAL REPORT Quarter II - Headquarters: 297/5 Ly Thuong Kiet Street, Ward 15, District 11, Ho Chi Minh City MEKOPHAR CHEMICAL PHARMACEUTICAL JOINT-STOCK
NOTES TO THE FINANCIAL STATEMENTS For the year ended 31st December, 2013
 1. GENERAL Cosmos Machinery Enterprises Limited (the Company ) is a public limited company domiciled and incorporated in Hong Kong and its shares are listed on The Stock Exchange of Hong Kong Limited (the
IFRS-compliant accounting principles
 IFRS-compliant accounting principles Since 1 January 2005, Uponor Corporation has prepared its consolidated financial statements in compliance with the following accounting principles: Main functions Uponor
ANJUM TEXTILE MILLS (PVT.) LTD. BALANCE SHEET AS AT JUNE 30, 2012
 LTD. BALANCE SHEET AS AT JUNE 30, 2012") ANJUM TEXTILE MILLS (PVT.) LTD. BALANCE SHEET AS AT JUNE 30, 2012 2012 2011 2012 2011 NOTE RUPEES RUPEES NOTE RUPEES RUPEES EQUITY & LIABILITIES SHARE CAPITAL AND RESERVES ASSETS NON CURRENT ASSETS SHARE
ANJUM TEXTILE MILLS (PVT.) LTD. BALANCE SHEET AS AT JUNE 30, 2012 2012 2011 2012 2011 NOTE RUPEES RUPEES NOTE RUPEES RUPEES EQUITY & LIABILITIES SHARE CAPITAL AND RESERVES ASSETS NON CURRENT ASSETS SHARE
Steppe Cement's AIM nominated adviser is RFC Corporate Finance Ltd. Contact Stephen Allen on
 RNS Number:7376S Steppe Cement Limited 21 April 2008 Steppe Cement Limited Accounts for the year ended 31 December 2007 The accounts for Steppe Cement Limited ("Steppe" or the "Company") for the year ended
The notes on pages 7 to 59 are an integral part of these consolidated financial statements
 CONSOLIDATED BALANCE SHEET As at 31 December Restated Restated Notes 2013 $'000 $'000 $'000 ASSETS Non-current Assets Investment properties 6 68,000 68,000 - Property, plant and equipment 7 302,970 268,342
Chinatrust Commercial Bank, Ho Chi Minh City Branch. Financial statements for the year ended 31 December 2011
 Financial statements for the year ended 31 December 2011 Corporate Information Banking Licence No 04/NHNN-GP 6 February 2002 The banking licence was issued by the State Bank of Vietnam and is valid for
2.4 SUMMARY OF SIGNIFICANT ACCOUNTING POLICIES
 Franshion Properties (China) Limited Annual Report 2013 175 2.4 SUMMARY OF SIGNIFICANT ACCOUNTING POLICIES Subsidiaries A subsidiary is an entity (including a structured entity), directly or indirectly,
FInAnCIAl StAteMentS
 Financial STATEMENTS The University of Newcastle ABN 157 365 767 35 Contents 106 Income statement 107 Statement of comprehensive income 108 Statement of financial position 109 Statement of changes in equity
Consolidated Financial Statements Summary and Notes
 Consolidated Financial Statements Summary and Notes Contents Consolidated Financial Statements Summary Consolidated Statement of Total Comprehensive Income 57 Consolidated Statement of Financial Position
Fujairah Cement Industries P.J.S.C. Fujairah - United Arab Emirates
 Independent auditors' report and financial statements For the year ended December 31, 2014 Table of contents Pages General information 1 Independent auditors' report 2 & 3 Statement of financial position
Notes to the financial statements
 11 1. Accounting policies 1.1 Nature of business Super Group Limited (Registration number 1943/016107/06), the holding Company of the Group (the Company), is a Company listed on the Main Board of the JSE
Financial statements. The University of Newcastle newcastle.edu.au F1
 Financial statements The University of Newcastle newcastle.edu.au F1 Income statement For the year ended 31 December Consolidated Parent Revenue from continuing operations Australian Government financial
Independent Auditors Report - to the members 1. Balance Sheet 2. Income Statement 3. Statement of Changes in Equity 4. Statement of Cash Flows 5
 CONTENTS Page Independent Auditors Report - to the members 1 FINANCIAL STATEMENTS Balance Sheet 2 Income Statement 3 Statement of Changes in Equity 4 Statement of Cash Flows 5 Notes to the Financial Statements
A.G. Leventis (Nigeria) Plc
 Plc") CONTENTS COMPLIANCE CERTIFICATE 3 CONSOLIDATED STATEMENT OF COMPREHENSIVE INCOME 4 CONSOLIDATED STATEMENT OF FINANCIAL POSITION 5 STATEMENT OF CASHFLOWS 6 STATEMENT OF CHANGES IN EQUITY 7 NOTES TO THE
CONTENTS COMPLIANCE CERTIFICATE 3 CONSOLIDATED STATEMENT OF COMPREHENSIVE INCOME 4 CONSOLIDATED STATEMENT OF FINANCIAL POSITION 5 STATEMENT OF CASHFLOWS 6 STATEMENT OF CHANGES IN EQUITY 7 NOTES TO THE
NOTES TO THE FINANCIAL STATEMENTS
 NOTES TO THE FINANCIAL STATEMENTS 1. ACCOUNTING POLICIES 1.1 Nature of business Super Group Limited (Registration number 1943/016107/06), the holding Company (the Company) of the Group, is a Company listed
Update on guidance for enterprise accounting regime in Vietnam. 11 Febuary 2015
 Update on guidance for enterprise accounting regime 11 Febuary 2015 Grant Thornton Vietnam updates on Circular No. 200/2014/TT- BTC guidance for enterprise accounting regime: Circular No. 200/2014/TT-BTC
SUMMARY OF SIGNIFICANT ACCOUNTING POLICIES For the financial year ended 31 December 2013
 Unless otherwise stated, the following accounting policies have been applied consistently in dealing with items that are considered material in relation to the financial statements. These policies have
Group accounting policies
 81 Group accounting policies BASIS OF ACCOUNTING AND REPORTING The consolidated financial statements as set out on pages 92 to 151 have been prepared on the historical cost basis except for certain financial
NOTES TO THE FINANCIAL STATEMENTS for the financial year ended 31 December 2009
 32 KLW HOLDINGS LIMITED ANNUAL REPORT 2009 1 GENERAL INFORMATION The financial statements of the Group and of the Company were authorised for issue in accordance with a resolution of the directors on the
TECO IMAGE SYSTEMS CO., LTD. AND SUBSIDIARIES CONSOLIDATED FINANCIAL STATEMENTS AND REVIEW REPORT OF INDEPENDENT ACCOUNTANTS JUNE 30, 2016 AND 2015
 TECO IMAGE SYSTEMS CO., LTD. AND SUBSIDIARIES CONSOLIDATED FINANCIAL STATEMENTS AND REVIEW REPORT OF INDEPENDENT ACCOUNTANTS JUNE 30, 2016 AND 2015 -----------------------------------------------------------------------------------------------------------------------------
Group Income Statement
 MASSMART GROUP ANNUAL FINANCIAL STATEMENTS 2014 Group Income Statement December 2014 December 2013 Rm Notes 52 weeks 53 weeks Revenue 5 78,319.0 72,512.9 Sales 5 78,173.2 72,263.4 Cost of sales (63,610.8)
CONSOLIDATED INCOME STATEMENT Quarter IV/2011
 CONSOLIDATED INCOME STATEMENT Quarter IV/2011 Item Quarter IV Accumulated amount Current year Previous year Current year Previous year 1 Sales 664.125.062.838 671.185.380.822 2.374.962.709.626 2.148.850.890.455
OAO SIBUR Holding. International Financial Reporting Standards Consolidated Financial Statements and Independent Auditor s Report.
 OAO SIBUR Holding International Financial Reporting Standards Consolidated Financial Statements and Independent Auditor s Report 31 December 2013 IFRS CONSOLIDATED STATEMENT OF PROFIT OR LOSS (In millions
MANNAI CORPORATION Q.S.C AND SUBSIDIARY COMPANIES CONSOLIDATED FINANCIAL STATEMENTS AND INDEPENDENT AUDITOR S REPORT
 MANNAI CORPORATION Q.S.C AND SUBSIDIARY COMPANIES CONSOLIDATED FINANCIAL STATEMENTS AND INDEPENDENT AUDITOR S REPORT FOR THE YEAR ENDED DECEMBER 31, 2011 CONSOLIDATED FINANCIAL STATEMENTS AND INDEPENDENT
Balsan / Carpet tiles
 Balsan / Carpet tiles Financial report I. Definitions 47 II. Financial statements 48 III. Notes to the consolidated financial statements for the year ended 30 November 2005 54 IV. Statutory auditor s report
VITAFOAM NIGERIA PLC UNAUDITED INTERIM IFRS FINANCIAL STATEMENTS AS AT 30 JUNE 2016
 UNAUDITED INTERIM IFRS FINANCIAL STATEMENTS AS AT 30 JUNE 2016 1 UNAUDITED CONSOLIDATED AND SEPARATE INTERIM FINANCIAL STATEMENTS FOR 9 MONTHS ENDED 30 JUNE 2016 C O N T E N T S Page Statement of financial
JOINT STOCK COMPANY AIR ASTANA. Financial Statements For the year ended 31 December 2012
 JOINT STOCK COMPANY AIR ASTANA Financial Statements For the year ended 2012 JOINT STOCK COMPANY AIR ASTANA TABLE OF CONTENTS Page STATEMENT OF MANAGEMENT S RESPONSIBILITIES FOR THE PREPARATION AND APPROVAL
These notes form an integral part of and should be read in conjunction with the accompanying financial statements.
 for the financial year ended 31 December These notes form an integral part of and should be read in conjunction with the accompanying financial statements. 1. General 1 The Company is incorporated and
May & Baker Nig Plc RC. UNAUDITED CONSOLIDATED FINANCIAL STATEMENTS 31 MARCH 2017
 ` May & Baker Nig Plc RC. 558 UNAUDITED CONSOLIDATED FINANCIAL STATEMENTS 31 MARCH 2017 UNAUDITED CONSOLIDATED STATEMENT OF PROFIT OR LOSS AND OTHER COMPREHENSIVE INCOME Note Continuing operations Revenue
Qatar Navigation Q.P.S.C.
 CONSOLIDATED FINANCIAL STATEMENTS 31 DECEMBER 2016 CONSOLIDATED FINANCIAL STATEMENTS CONTENTS Page(s) Independent auditor s report 1-4 Consolidated financial statements: Consolidated income statement 5
ACERINOX, S.A. AND SUBSIDIARIES. 31 December 2015
 ACERINOX, S.A. AND SUBSIDIARIES Annual Accounts of the Consolidated Group 31 December 2015 (Free translation from the original in Spanish. In the event of discrepancy, the Spanishlanguage version prevails.)
NOTES TO THE GROUP ANNUAL FINANCIAL STATEMENTS FOR THE YEAR ENDED 30 SEPTEMBER 2014
 14 NOTES TO THE GROUP ANNUAL FINANCIAL STATEMENTS 1. ACCOUNTING POLICIES The financial statements are presented in South African Rand, unless otherwise stated, rounded to the nearest million, which is
BLUESCOPE STEEL LIMITED FINANCIAL REPORT 2011/2012
 BLUESCOPE STEEL LIMITED FINANCIAL REPORT / ABN 16 000 011 058 Annual Financial Report - Page Financial statements Statement of comprehensive income 2 Statement of financial position 3 Statement of changes
Somboon Advance Technology Public Company Limited and its Subsidiaries Notes to the financial statements
 Notes to the Note Contents 1 General information 2 Basis of preparation of the 3 Significant accounting policies 4 Related parties 5 Cash and cash equivalents 6 Current investments 7 Trade accounts receivable
Financial Statements. Annual Report 2010/11 Hemas Holdings PLC 57
 Financial Statements Annual Report 2010/11 Hemas Holdings PLC 57 Statement of Directors Responsibilities in respect of the Annual Report and the Financial S tatements The directors are responsible for
1. GENERAL INFORMATION OF THE COMPANY AND SUBSIDIARIES
 KCE ELECTRONICS PUBLIC COMPANY LIMITED AND ITS SUBSIDIARIES NOTES TO CONSOLIDATED FINANCIAL STATEMENTS FOR THE YEARS ENDED 31 DECEMBER 2007 AND 2006 1. GENERAL INFORMATION OF THE COMPANY AND SUBSIDIARIES
SENAO NETWORKS, INC. AND SUBSIDIARIES
 SENAO NETWORKS, INC. AND SUBSIDIARIES CONSOLIDATED FINANCIAL STATEMENTS AND REVIEW REPORT OF INDEPENDENT ACCOUNTANTS SEPTEMBER 30, 2015 AND 2014 ------------------------------------------------------------------------------------------------------------------------------------
(Continued) ~3~ March 31, 2017 December 31, 2016 March 31, 2016 Assets Notes AMOUNT % AMOUNT % AMOUNT % Current assets
 ~3~ March 31, 2017 December 31, 2016 March 31, 2016 Assets Notes AMOUNT % AMOUNT % AMOUNT % Current assets") Current assets DAVICOM SEMICONDUCTOR, INC. AND SUBSIDIARIES CONSOLIDATED BALANCE SHEETS (Expressed in thousands of New Taiwan dollars) (The consolidated balance sheets as of March 31,2017 and 2016 are
Current assets DAVICOM SEMICONDUCTOR, INC. AND SUBSIDIARIES CONSOLIDATED BALANCE SHEETS (Expressed in thousands of New Taiwan dollars) (The consolidated balance sheets as of March 31,2017 and 2016 are
 One group, one team Financial statements 2009 BE0429 977 343 VANDEMOORTELE NV 1 CONSOLIDATED INCOME STATEMENT For the year ended December 31 Thousand Euro Note 2009 2008 Revenue 1.102.568 987.446
Singapore Institute of Management and its Subsidiaries. Contents. Financial Report 2017
 Singapore of Management and its Subsidiaries Financial Report 2017 Contents 2 Governing Council s statement 3 Independent auditor s report 5 Statements of comprehensive income 6 Statements of financial
Notes. These financial statements were approved for issue by the board of directors on May 08, 2017.
 THE WELSPUN CORP STORY GOVERNANCE REPORTS FINANCIAL STATEMENTS annexed to and forming part of the standalone balance sheet as at and the standalone statement of profit and loss for the year ended Statement
NOTES TO FINANCIAL STATEMENTS
 NOTES TO FINANCIAL STATEMENTS 1. CORPORATE INFORMATION CNT Group Limited is a limited liability company incorporated in Bermuda. The principal place of business is located at 31st Floor and Units E & F
Group Income Statement For the year ended 31 March 2015
 Income Statement For the year ended 31 March Note Pre exceptionals Restated Exceptionals (note 11) Pre exceptionals Exceptionals (note 11) Continuing operations Revenue 5 10,606,080 10,606,080 11,044,763
9. Share-Based Payments Jointly Controlled Entities Other Operating Income Other Operating Expense 130
 92 Financial Report Detailed contents: Consolidated financial statements Consolidated Income Statement for the year ended 31 December Consolidated Statement of Comprehensive Income for the year ended 31
Vitafoam Nigeria Plc. Consolidated and Separate financial statements Year ended 30 September 2014
 . Year ended 30 September 2014 Table of Contents Statement of Directors Responsibilities... i Report of the independent auditors... 1 & Statement of Profit or Loss and other Comprehensive Income... 2 &
RELIANCE JIO INFOCOMM PTE. LTD. 1. Reliance Jio Infocomm PTE Limited
 RELIANCE JIO INFOCOMM PTE. LTD. 1 Reliance Jio Infocomm PTE Limited 2 RELIANCE JIO INFOCOMM PTE. LTD. Independent Auditors Report To the Member of RELIANCE JIO INFOCOMM PTE LTD Report on the Financial
3. NEW FINANCIAL REPORTING STANDARDS Page 13
 NOTES TO THE FINANCIAL STATEMENTS 1. GENERAL INFORMATION Chiangmai Frozen Foods Public Company Limited was listed on the Stock Exchange of Thailand in 1993. the Company are engaged in business of manufacturing
Consolidated Profit and Loss Account
 Consolidated Profit and Loss Account For the year ended 31st December 2008 US$ 000 Note 2008 2007 Revenue 5 6,545,140 5,651,030 Operating costs 6 (5,668,906) (4,645,842) Gross profit 876,234 1,005,188
Acerinox, S.A. and Subsidiaries
 Acerinox, S.A. and Subsidiaries Consolidated Annual Accounts 31 December 2016 Consolidated Directors' Report 2016 (With Auditors Report Thereon) (Free translation from the original in Spanish. In the event
PORTCOAST CONSULTANT CORPORATION. Audited financial statements for the year ended 31 December 2013
 Audited financial statements for the year ended 31 December 2013 CONTENTS Page(s) REPORT OF THE BOARD OF MANAGEMENT 1-3 INDEPENDENT AUDITORS REPORT 4-5 AUDITED FINANCIAL STATEMENTS Balance sheet 6-9 Income
Notes to the Financial Statements
 1. CORPORATE INFORMATION The Company was incorporated as an exempted company with limited liability in the Cayman Islands on 26 November 2003 under the Companies Law, Cap. 22 (Law 3 of 1961, as consolidated
Financial statements NEW ZEALAND POST LIMITED AND SUBSIDIARIES INCOME STATEMENTS FOR THE YEAR ENDED 30 JUNE 2009
 Financial statements NEW ZEALAND POST LIMITED AND SUBSIDIARIES INCOME STATEMENTS FOR THE YEAR ENDED 30 JUNE Note Group PARENT Revenue from operations 1 1,253,846 1,290,008 765,904 784,652 Expenditure 2
ANJUM TEXTILE MILLS (PVT) LTD. BALANCE SHEET AS AT JUNE 30, 2014
 LTD. BALANCE SHEET AS AT JUNE 30, 2014") ANJUM TEXTILE MILLS (PVT) LTD. BALANCE SHEET JUNE 30, 2014 2014 2013 2014 2013 NOTE RUPEES RUPEES NOTE RUPEES RUPEES EQUITY & LIABILITIES SHARE CAPITAL AND RESERVES ASSETS NON CURRENT ASSETS SHARE CAPITAL
ANJUM TEXTILE MILLS (PVT) LTD. BALANCE SHEET JUNE 30, 2014 2014 2013 2014 2013 NOTE RUPEES RUPEES NOTE RUPEES RUPEES EQUITY & LIABILITIES SHARE CAPITAL AND RESERVES ASSETS NON CURRENT ASSETS SHARE CAPITAL
Pruksa Real Estate Public Company Limited and its Subsidiaries. Annual financial statements and Audit report of Certified Public Accountant
 Pruksa Real Estate Public Company Limited and its Subsidiaries Annual and Audit report of Certified Public Accountant For the years ended 31 December 2010 and 2009 Audit report of Certified Public Accountant
STATEMENT OF FINANCIAL POSITION as at 31 March 2009
 STATEMENT OF FINANCIAL POSITION as at 31 March 2009 Restated Restated Restated Restated 31 March 31 March 1 April 31 March 31 March 1 April 2009 2008 2007 2009 2008 2007 Note R 000 R 000 R 000 R 000 R
Vietnam Dairy Products Joint Stock Company and its subsidiaries Corporate Information
 Corporate Information Business Registration 4103001932 20 November 2003 Certificate No. 0300588569 18 January 2017 The Company s business registration certificate has been amended several times, the most
Mannai Corporation Q.S.C. CONSOLIDATED FINANCIAL STATEMENTS
 CONSOLIDATED FINANCIAL STATEMENTS 31 DECEMBER 2012 CONSOLIDATED STATEMENT OF FINANCIAL POSITION Notes QR 000 QR 000 ASSETS Current assets Bank balances and cash 4 344,200 88,293 Accounts receivable
Financial statements. The University of Newcastle. newcastle.edu.au F1. 52 The University of Newcastle, Australia
 Financial statements The University of Newcastle 52 The University of Newcastle, Australia newcastle.edu.au F1 Contents Income statement................. 54 Statement of comprehensive income..... 55 Statement
KCE ELECTRONICS PUBLIC COMPANY LIMITED AND ITS SUBSIDIARIES NOTES TO FINANCIAL STATEMENTS FOR THE YEARS ENDED 31 DECEMBER 2006 AND 2005
 KCE ELECTRONICS PUBLIC COMPANY LIMITED AND ITS SUBSIDIARIES NOTES TO FINANCIAL STATEMENTS FOR THE YEARS ENDED 31 DECEMBER 2006 AND 2005 1. GENERAL INFORMATION OF THE COMPANY AND SUBSIDIARIES KCE Electronics
PAO SIBUR Holding. International Financial Reporting Standards Consolidated Financial Statements and Independent Auditor s Report.
 PAO SIBUR Holding International Financial Reporting Standards Consolidated Financial Statements and Independent Auditor s Report 31 December 2017 Table of Contents Independent Auditor s Report IFRS Consolidated
KELANI TYRES PLC FINANCIAL STATEMENTS 31 MARCH 2017
 KELANI TYRES PLC FINANCIAL STATEMENTS 31 MARCH 2017 KELANI TYRES PLC ANNUAL REPORT 2016/2017 i Independent Auditor s Report To the shareholders of Kelani Tyres PLC Report on the Financial Statements 1.
NOTES TO THE FINANCIAL STATEMENTS
 These notes form an integral part of the fi nancial statements. The fi nancial statements were authorised for issue by the directors on 28 February 2006. 1 Domicile and Activities City Developments Limited
Interfood Shareholding Company and its subsidiaries. Consolidated financial statements Quarter IV-2010
 0 Consolidated financial statements Quarter IV-2010 1 Consolidated financial statements Quarter IV-2010 Contents Page Report of the Board of Directors 1 Consolidated balance sheet 4 Consolidated statement
Continuing operations Revenue 3(a) 464, ,991. Revenue 464, ,991
 464, ,991. Revenue 464, ,991") STATEMENT OF PROFIT OR LOSS For the year ended 30 June 2017 Consolidated Consolidated Note Continuing operations Revenue 3(a) 464,411 323,991 Revenue 464,411 323,991 Other Income 3(b) 4,937 5,457 Share
STATEMENT OF PROFIT OR LOSS For the year ended 30 June 2017 Consolidated Consolidated Note Continuing operations Revenue 3(a) 464,411 323,991 Revenue 464,411 323,991 Other Income 3(b) 4,937 5,457 Share
JHL BIOTECH, INC. AND SUBSIDIARIES CONSOLIDATED FINANCIAL STATEMENTS AND REPORT OF INDEPENDENT ACCOUNTANTS DECEMBER 31, 2016 AND 2015
 JHL BIOTECH, INC. AND SUBSIDIARIES CONSOLIDATED FINANCIAL STATEMENTS AND REPORT OF INDEPENDENT ACCOUNTANTS DECEMBER 31, 2016 AND 2015 -----------------------------------------------------------------------------------------------------------------------------------------------------------------------
NASCON ALLIED INDUSTRIES PLC. Unaudited Financial Statements
 Unaudited Financial Statements Unaudited Financial Statements CONTENTS PAGE Statement of Profit or Loss and Other Comprehensive Income 2 Statement of Financial Position 3 Statement of Changes in Equity