Acerinox, S.A. and Subsidiaries
|
|
|
- Brittney Hill
- 5 years ago
- Views:
Transcription
1 Acerinox, S.A. and Subsidiaries Consolidated Annual Accounts 31 December 2016 Consolidated Directors' Report 2016 (With Auditors Report Thereon) (Free translation from the original in Spanish. In the event of discrepancy, the Spanish-language version prevails.)
2 KPMG Auditores, S.L. Paseo de la Castellana, 259 C Madrid Independent Auditor's Report on the Consolidated Annual Accounts (Translation from the original in Spanish. In the event of discrepancy, the Spanish-language version prevails.) To the Shareholders of Acerinox, S.A. Report on the consolidated annual accounts We have audited the accompanying consolidated annual accounts of Acerinox, S.A. (the "Company ) and its subsidiaries (the "Group ), which comprise the consolidated balance sheet at 31 December 2016 and the consolidated income statement, consolidated statement of comprehensive income, consolidated statement of changes in equity and consolidated statement of cash flows for the year then ended, and consolidated notes. Directors' responsibility for the consolidated annual accounts The Directors of the Company are responsible for the preparation of the accompanying consolidated annual accounts in such a way that they present fairly the consolidated equity, consolidated financial position and consolidated financial performance of Acerinox, S.A. and subsidiaries in accordance with International Financial Reporting Standards as adopted by the European Union (IFRS-EU) and other provisions in the financial reporting framework that are applicable to the Group in Spain, and for such internal control that they determine is necessary to enable the preparation of annual accounts that are free from material misstatement, whether due to fraud or error. Auditor's responsibility Our responsibility is to express an opinion on these consolidated annual accounts based on our audit. We conducted our audit in accordance with prevailing legislation regulating the audit of accounts in Spain. This legislation requires that we comply with ethical requirements and that we plan and conduct our audit to obtain reasonable assurance about whether the consolidated annual accounts are free from material misstatements. An audit involves performing procedures to obtain audit evidence about the amounts and disclosures in the consolidated annual accounts. The procedures selected depend on the auditor's judgement, including the assessment of the risks of material misstatement of the consolidated annual accounts, whether due to fraud or error. In making those risk assessments, the auditor considers internal control relevant to the Company's Directors' preparation of the consolidated annual accounts in order to design audit procedures that are appropriate in the circumstances, but not for the purpose of expressing an opinion on the effectiveness of the entity's internal control. An audit also includes evaluating the appropriateness of accounting policies used and reasonableness of accounting estimates made by management, as well as evaluating the overall presentation of the consolidated annual accounts taken as a whole. KPMG Auditores S.L., a limited liability Spanish company and a member firm of the KPMG network of independent member firms affiliated with KPMG International Cooperative ( KPMG International ), a Swiss entity. Reg. Mer Madrid, T , F. 90, Sec. 8, H. M , Inscrip. 9 N.I.F. B
3 2 We believe that the audit evidence we have obtained is sufficient and appropriate to provide a basis for our audit opinion. Opinion In our opinion, the accompanying consolidated annual accounts present fairly, in all material respects, the consolidated equity and consolidated financial position of Acerinox, S.A. and subsidiaries at 31 December 2016 and their financial performance and consolidated cash flows for the year then ended in accordance with International Financial Reporting Standards as adopted by the European Union and other applicable provisions of the financial reporting framework. Report on other legal and regulatory requirements The accompanying consolidated directors report for 2016 contains such explanations as the Directors of Acerinox, S.A. consider relevant to the situation of the Group, its business performance and other matters, and is not an integral part of the consolidated annual accounts. We have verified that the accounting information contained therein is consistent with that disclosed in the consolidated annual accounts for Our work as auditors is limited to the verification of the consolidated directors report within the scope described in this paragraph and does not include a review of information other than that obtained from the accounting records of Acerinox, S.A. and subsidiaries. KPMG Auditores, S.L. (Signed on the original in Spanish) Borja Guinea López 28 February 2017
4 ACERINOX, S.A. AND SUBSIDIARIES Annual Accounts of the Consolidated Group 31 December 2016 (Free translation from the original in Spanish. In the event of discrepancy, the Spanish-language version prevails.) Acerinox Group Page 1 of
5 CONSOLIDATED ANNUAL ACCOUNTS CONSOLIDATED FINANCIAL STATEMENTS 1. CONSOLIDATED BALANCE SHEETS (In thousands of Euros at 31 December 2016 and 2015) (Free translation from the original in Spanish. In the event of discrepancy, the Spanish-language version prevails.) Note ASSETS Non-current assets Goodwill 7 69,124 69,124 Other intangible assets 7 2,769 11,181 Property, plant and equipment 8 2,086,403 2,025,856 Available-for-sale financial assets 10 12,618 10,667 Deferred tax assets , ,891 Other non-current financial assets 10 7,846 11,811 TOTAL NON-CURRENT ASSETS 2,357,534 2,317,530 Current assets Inventories 9 887, ,929 Trade and other receivables , ,367 Other current financial assets 10 27,123 15,497 Current tax assets 17 12,254 17,394 Cash and cash equivalents , ,955 TOTAL CURRENT ASSETS 2,097,514 1,808,142 TOTAL ASSETS 4,455,048 4,125,672 Notes 1 to 20 form an integral part of the consolidated annual accounts. Acerinox Group Page 2 of
6 (In thousands of Euros at 31 December 2016 and 2015) (Free translation from the original in Spanish. In the event of discrepancy, the Spanish-language version prevails.) EQUITY AND LIABILITIES Note Equity Subscribed capital 12 69,017 66,677 Share premium 12 81,403 81,403 Reserves 12 1,546,215 1,525,178 Profit for the year 12 80,320 42,891 Translation differences , ,879 Parent shares EQUITY ATTRIBUTABLE TO SHAREHOLDERS OF THE PARENT 2,078,690 1,929,027 Non-controlling interests 12 89,989 94,277 TOTAL EQUITY 2,168,679 2,023,304 Non-current liabilities Deferred income 13 7,798 7,513 Issue of bonds and other marketable securities , ,931 Loans and borrowings , ,230 Non-current provisions 14 15,475 13,698 Deferred tax liabilities , ,167 Other non-current financial liabilities 10 2,820 6,054 TOTAL NON-CURRENT LIABILITIES 1,191, ,593 Current liabilities Issue of bonds and other marketable securities 10 1,653 1,653 Loans and borrowings , ,887 Trade and other payables , ,726 Current tax liabilities 17 3,418 1,092 Other current financial liabilities 10 6,211 14,417 TOTAL CURRENT LIABILITIES 1,095,196 1,106,775 TOTAL EQUITY AND LIABILITIES 4,455,048 4,125,672 Notes 1 to 20 form an integral part of the consolidated annual accounts. Acerinox Group Page 3 of
7 2. CONSOLIDATED INCOME STATEMENTS (Expressed in thousands of Euros) (Free translation from the original in Spanish. In the event of discrepancy, the Spanish-language version prevails.) Note Revenues 15 3,968,143 4,221,426 Other operating income 15 13,565 13,017 Self-constructed non-current assets 15 6,927 18,888 Changes in inventories of finished goods and work in progress -31,975-19,783 Supplies -2,673,574-3,000,348 Personnel expenses , ,176 Amortisation and depreciation 7&8-169, ,684 Other operating expenses , ,452 RESULTS FROM OPERATING ACTIVITIES 157, ,888 Finance income 16 6,252 4,292 Finance costs 16-43,383-51,175 Exchange gains/losses 16-22,424 62,400 Fair value measurement of financial instruments 16 29,988-59,509 PROFIT FROM ORDINARY ACTIVITIES 127,869 76,896 Income tax 17-57,025-45,589 Other taxes 17-3,541-4,989 PROFIT FOR THE PERIOD 67,303 26,318 Attributable to: NON-CONTROLLING INTERESTS -13,017-16,573 NET PROFIT ATTRIBUTABLE TO THE GROUP 80,320 42,891 Basic and diluted earnings per share (in Euros) Notes 1 to 20 form an integral part of the consolidated annual accounts. Acerinox Group Page 4 of
8 3. CONSOLIDATED STATEMENTS OF COMPREHENSIVE INCOME (Expressed in thousands of Euros) (Free translation from the original in Spanish. In the event of discrepancy, the Spanish-language version prevails.) Note 2,016 2,015 A) PROFIT FOR THE YEAR 67,303 26,318 INCOME AND EXPENSE RECOGNISED DIRECTLY IN EQUITY I. Measurement of financial instruments 1. Available-for-sale financial assets ,948 1, Other income/expense II. Cash flow hedges ,193 15,323 III. Translation differences , ,394 IV. Actuarial gains and losses and other adjustments V. Tax effect 1,299-4,426 B) TOTAL INCOME AND EXPENSE RECOGNISED DIRECTLY IN EQUITY 93, ,470 AMOUNTS TRANSFERRED TO THE INCOME STATEMENT I. Measurement of assets and liabilities 1. Measurement of financial instruments Other income/expense II. Cash flow hedges ,489-8,412 III. Translation differences IV. Actuarial gains and losses and other adjustments 124 V. Tax effect -3,098 2,161 C) TOTAL AMOUNTS TRANSFERRED TO THE INCOME STATEMENT 9,676-6,251 TOTAL COMPREHENSIVE INCOME 170, ,537 a) Attributable to the Parent 174, ,523 b) Attributable to non-controlling interests -4,284-17,986 Notes 1 to 20 form an integral part of the consolidated annual accounts. Acerinox Group Page 5 of
9 4. CONSOLIDATED STATEMENTS OF CHANGES IN EQUITY (Expressed in thousands of Euros) (Free translation from the original in Spanish. In the event of discrepancy, the Spanish-language version prevails.) Subscribed capital Share premium Retained earnings (including profit for the year) Equity attributable to shareholders of the Parent Property, plant and equipment revaluation reserves Cash flow hedge reserves Availablefor-sale asset fair value reserve Actuarial valuation reserves Translation differences Interim dividend TOTAL Noncontrolling interests Notes Equity at 31/12/ ,426 81,403 1,581,203 5,242-10,504-7, , ,733, ,552 1,845,693 Profit for ,891 42,891-16,573 26,318 Measurement of available-for-sale assets (net of tax) ,494 1,494 1,494 Cash flow hedges (net of tax) ,204 5, ,196 Actuarial valuation of employee benefit commitments Translation differences , ,831-1, ,394 Income and expense recognised in equity ,204 1, , ,632-1, ,219 Total comprehensive income , ,204 1, , ,523-17, ,537 Capital increase ,251-1, Distribution of dividends ,836-47,836-47,836 Transactions with shareholders 1, , , ,929 Acquisition of own shares -2 Disposal of own shares Acquisition of non-controlling shares from noncontrolling interests -1,241-1, ,530 Other movements Equity at 31/12/ ,677 81,403 1,574,207 5,242-5,300-5, , ,929,027 94,277 2,023,304 Profit for ,320 80,320-13,017 67,303 Measurement of available-for-sale assets (net of tax) ,460 1,460 1,460 Cash flow hedges (net of tax) ,995 3, ,985 Actuarial valuation of commitments Translation differences ,857 88,857 8,743 97,600 Income and expense recognised in equity ,995 1, ,857 94,436 8, ,169 Total comprehensive income , ,995 1, , ,756-4, ,472 Capital increase (scrip dividend) ,340-2, Distribution of dividends (scrip dividend) ,745-26,745-26,745 Transactions with shareholders 2, , , ,840 Acquisition of non-controlling shares from noncontrolling interests Other movements 1,745 1,745 1,745 Equity at 31/12/ ,017 81,403 1,627,094 5,242-1,305-4, , ,078,690 89,989 2,168,679 TOTAL EQUITY Notes 1 to 20 form an integral part of the consolidated annual accounts. Acerinox Group Page 6 of
10 5. CONSOLIDATED STATEMENTS OF CASH FLOWS (Expressed in thousands of Euros) (Free translation from the original in Spanish. In the event of discrepancy, the Spanish-language version prevails.) Notes CASH FLOWS FROM OPERATING ACTIVITIES Profit before tax 127,869 76,896 Adjustments for: Amortisation and depreciation 7 & 8 169, ,684 Impairment -13,459 3,705 Change in provisions 5,067-1,373 Grants recognised in the income statement 13-3,037-2,772 Gains/losses on disposal of fixed assets 8-2, Change in fair value of financial instruments -17,414 36,733 Finance income 16-6,249-4,292 Finance costs 16 42,136 51,175 Other income and expense 41,024-36,520 Changes in working capital: Increase/decrease in trade and other receivables -92, ,849 Increase/decrease in inventories -19,386 48,753 Increase/decrease in trade and other payables 128, ,126 Other cash flows from operating activities Interest paid -40,660-49,452 Interest received 6,017 3,869 Income tax paid -55,837-94,520 NET CASH FROM OPERATING ACTIVITIES 268,785 17,424 CASH FLOWS FROM INVESTING ACTIVITIES Acquisition of property, plant and equipment -162,084-68,863 Acquisition of intangible assets ,255 Acquisition of non-controlling interests ,022 Acquisition of other financial assets Proceeds from sale of property, plant and equipment 5,674 1,338 Proceeds from sale of intangible assets 0 2 Proceeds from sale of other financial assets 74 2,139 Dividends received Other amounts received/paid for investments NET CASH USED IN INVESTING ACTIVITIES -157,313-67,583 CASH FLOWS FROM FINANCING ACTIVITIES Issue of own equity instruments Acquisition of own shares External financing received 775, ,452 Repayment of interest-bearing liabilities -756, ,806 Dividends paid 12-26,745-47,836 Distribution of share premium Contribution from non-controlling shareholders NET CASH USED IN FINANCING ACTIVITIES -7, ,284 NET INCREASE/DECREASE IN CASH AND CASH EQUIVALENTS 103, ,443 Cash and cash equivalents at beginning of year , ,368 Effect of exchange rate fluctuations 14,614 17,030 CASH AND CASH EQUIVALENTS AT YEAR END 598, ,955 Notes 1 to 20 form an integral part of the consolidated annual accounts. Acerinox Group Page 7 of
11 (Free translation from the original in Spanish. In the event of discrepancy, the Spanish-language version prevails.) CONTENTS: NOTES TO THE CONSOLIDATED ANNUAL ACCOUNTS NOTE 1 GENERAL INFORMATION 9 NOTE 2 ACCOUNTING POLICIES 9 NOTE 3 ACCOUNTING ESTIMATES AND JUDGEMENTS 23 NOTE 4 FINANCIAL RISK MANAGEMENT 24 NOTE 5 SCOPE OF CONSOLIDATION 31 NOTE 6 SEGMENT REPORTING 36 NOTE 7 INTANGIBLE ASSETS 40 NOTE 8 PROPERTY, PLANT AND EQUIPMENT 43 NOTE 9 INVENTORIES 49 NOTE 10 FINANCIAL INSTRUMENTS 51 NOTE 11 CASH AND CASH EQUIVALENTS 61 NOTE 12 EQUITY 62 NOTE 13 DEFERRED INCOME 68 NOTE 14 PROVISIONS AND CONTINGENCIES 68 NOTE 15 INCOME AND EXPENSES 71 NOTE 16 NET FINANCE COST 73 NOTE 17 TAXATION 73 NOTE 18 RELATED PARTY BALANCES AND TRANSACTIONS 81 NOTE 19 AUDIT FEES 83 NOTE 20 EVENTS AFTER THE REPORTING PERIOD 83 Acerinox Group Page 8 of
12 (Free translation from the original in Spanish. In the event of discrepancy, the Spanish-language version prevails.) 6. NOTES TO THE CONSOLIDATED ANNUAL ACCOUNTS NOTE 1 GENERAL INFORMATION Parent: Acerinox, S.A. (hereinafter the Company). Incorporation: Acerinox, S.A. was incorporated with limited liability under Spanish law on 30 September Registered office: Calle Santiago de Compostela, 100, Madrid, Spain. Statutory and principal activity: The Group s statutory and principal activity, conducted through its subsidiaries, is the manufacture, transformation and marketing of stainless steel products. With a melt shop production capacity of 3.5 million tonnes, the Acerinox Group is one of the main steel manufacturers in the world. It has six stainless steel factories: two manufacturing flat products in Spain and South Africa; one producing flat and long steel in the United States; a further two making long steel products in Spain; and another in Malaysia that makes flat steel and currently has cold rolling production lines. The Group also has a network of sales subsidiaries in Spain and abroad that sell all its products as their main activity. Details of all the companies included in the Acerinox consolidated Group are provided in note 5, as well as the activities they carry out. The Parent's principal activity is that of a holding company, as parent of the Acerinox Group. The Company also renders legal, accounting and advisory services to all the Group companies and carries out financing activities within the Group. Financial year: the financial year of Acerinox, S.A. and all the Group companies is the 12-month period from 1 January to 31 December. Annual accounts: these consolidated annual accounts were authorised for issue by the board of directors of Acerinox, S.A. on 28 February NOTE 2 ACCOUNTING POLICIES 2.1 Statement of compliance The consolidated annual accounts of the Group have been prepared in accordance with International Financial Reporting Standards (IFRS) and interpretations (IFRIC) as adopted by the European Union (hereinafter IFRS-EU) and other applicable provisions in the financial reporting framework. The annual accounts for 2016 have been prepared using the same accounting principles (IFRS-EU) as for 2015, except for the change in policy adopted by the Group to classify emission allowances as inventories as opposed to intangible assets and for the standards and amendments adopted by the European Union mentioned below, which are obligatory as of 1 January 2016, and which have not had a significant impact on the Group. The most significant standards for the Group taking effect from 1 January 2016 are as follows: Annual improvements to IFRS, Cycle, which amend various standards, effective for annual periods beginning on or after 1 February These improvements have had no impact on the Group. Effective for annual periods beginning on or after 1 February Annual improvements to IFRS, Cycle, which amend various standards, effective for annual periods beginning on or after 1 January These improvements have had no impact on the Group. Amendments to IAS 1 (Disclosure Initiative), with an emphasis on materiality. Specific single disclosures that are not material do not have to be presented even if they are a minimum requirement of a standard. Effective for annual periods beginning on or after 1 January The Group has applied this amendment during the year. Acerinox Group Page 9 of
13 The following are standards or interpretations already adopted or pending adoption by the European Union that will be obligatory in the coming years and are expected to have a greater impact on the Group: Amendments to IAS 12 - Recognition of deferred tax assets for unrealised losses. This amendment clarifies that unrealised losses on debt instruments measured at fair value (available-for-sale financial instruments) but at cost for tax purposes can give rise to a deductible temporary difference regardless of whether the holder expects to recover the carrying amount by holding the debt instrument until maturity or by selling the debt instrument. Effective for annual periods beginning on or after 1 January No expected impact on the Group. Amendments to IAS 7: Disclosure Initiative. This amendment introduces requirements relating to the disclosure of financing activities in the statement of cash flows. Mandatory application foreseen for annual periods beginning on or after 1 January Annual Improvements to IFRS, Cycle, amendments to IFRS 1, IFRS 12 and IAS 28. No expected impact on the Group. IFRIC Interpretation 22 Foreign Currency Transactions and Advance Consideration. This interpretation clarifies the exchange rate to be used in receipt or payment of advance consideration in a foreign currency. Effective for annual periods beginning on or after 1 January No expected impact on the Group. IFRS 16 - Leases. This new standard on leases supersedes IAS 17. Effective for annual periods beginning on or after 1 January This standard requires that entities recognise lease assets and liabilities in the statement of financial position (except for short-term leases and leases of low-value assets). Acerinox, as lessor, has mostly arranged contracts to extend the rights to use certain assets to third parties. As a result, no significant impact is expected on the financial statements of Acerinox as a result of applying this standard. IFRS 9 - Financial Instruments. This standard is effective for periods beginning on or after 1 January Pending adoption by the European Union. This standard reduces the number of financial instrument categories to two: amortised cost and fair value. This standard also stipulates that debt instruments may only be classified as at amortised cost when they are payments of principal and interest, so all other debt should be recognised at fair value. The Group will need to adapt the classification of its financial instruments as a result. Changes in the value of available-for-sale financial assets are to be recognised as changes in equity, and not transferred to profit or loss, even if the assets are impaired. The standard also proposes significant changes in terms of aligning hedge accounting and risk management, defining a target-based approach and eliminating inconsistencies and shortfalls in the existing model. Some aspects of the measurement of equity instruments have also been modified. The Group is assessing the impact of this standard, although no significant effect on the Group's equity is expected. IFRS 15 - Revenue from Contracts with Customers. Effective for periods beginning on or after 1 January Pending adoption by the EU. The Group is assessing the impact of this standard, although little impact is expected on the recognition of the Group's revenues. No disclosures or accounting principles have been applied in advance. 2.2 Basis of presentation of the consolidated annual accounts The accompanying consolidated annual accounts have been prepared by the directors of the Parent to give a true and fair view of the Group s consolidated equity and consolidated financial position at 31 December 2016 and 2015, as well as the consolidated results of its operations and changes in consolidated equity and consolidated cash flows for the years then ended. The 2016 annual accounts include comparative figures for the prior year. The consolidated annual accounts are presented in Euros rounded off to the nearest thousand. They are prepared on a historical cost basis, except for derivative financial instruments and available-for-sale financial assets, which have been measured at fair value. Inventories have been measured at the lower of cost or net realisable value. The accompanying consolidated annual accounts have been prepared on the basis of the individual accounting records of the Company and the subsidiaries forming the Acerinox Group. The consolidated annual accounts include certain adjustments and reclassifications made to bring the accounting and presentation policies used by different Group companies into line with those of the Company. Acerinox Group Page 10 of
14 The preparation of the consolidated annual accounts under IFRS-EU requires the Parent s management to make judgements, estimates and assumptions that affect the application of accounting policies and, therefore, the amounts reported in the consolidated balance sheet and the consolidated income statement. These estimates are based on past experience and other factors considered appropriate. The Group may amend these estimates in light of subsequent events or changes in circumstances. The aspects that involve a greater degree of judgement in the application of IFRS-EU or for which the estimates made are significant for the preparation of the consolidated annual accounts are detailed in note 3. Qualitative and quantitative details of the risks assumed by the Group which could have an effect on future years are provided in note 4. The consolidated annual accounts for 2015 were approved by the shareholders at their annual general meeting held on 9 June The Group s consolidated annual accounts for 2016 are currently pending approval by the shareholders. The directors of the Company consider that these consolidated annual accounts will be approved with no changes by the shareholders at their annual general meeting. 2.3 Going concern assumption and accruals basis The consolidated annual accounts have been prepared on a going concern basis. Income and expenses are recognised on an accruals basis, irrespective of collections and payments. 2.4 Consolidation principles a) Subsidiaries Subsidiaries are entities over which the Company either directly or indirectly exercises control. The Company exercises control over a subsidiary when it is exposed, or has rights, to variable returns and has the ability to affect those returns through its power over the subsidiary. Furthermore, the Company is understood to have power over a subsidiary when it has existing substantive voting rights that give it the ability to direct the financial and operating activities and policies of the subsidiary. The financial statements of subsidiaries are included in the consolidated annual accounts from the date on which control commences to the date on which control ceases. The Group has considered potential voting rights in assessing its level of control over Group companies. The subsidiaries accounting policies have been adapted to Group accounting policies. The Acerinox Group s consolidated subsidiaries at 31 December 2016 and 2015 are listed in note 5. b) Non-controlling interests Non-controlling interests represent the portion of the Group's profit or loss and net assets attributable to noncontrolling interests. Non-controlling interests share in the Group's net assets and consolidated comprehensive income for the year are disclosed separately in consolidated equity and in the consolidated income statement and consolidated statement of comprehensive income. Non-controlling interests in the subsidiaries acquired are recognised at the acquisition date at the proportional part of the fair value of the identifiable net assets. Profit and loss and each component of other comprehensive income are allocated to equity attributable to shareholders of the Parent and to non-controlling interests in proportion to their investment, even if this results in the non-controlling interests having a deficit balance. c) Business combinations The Group applies the acquisition method for business combinations. Acerinox Group Page 11 of
15 No business combinations took place in 2016 or d) Associates Associates are entities over which the Group has significant influence in financial and operating decisions, but not control or joint control. The Group is generally understood to exercise significant control when it holds more than 20% of voting rights. The financial statements of associates are included in the consolidated annual accounts using the equity method. The Group s share of the profit or loss of an associate from the date of acquisition is recognised with a credit or debit to share in profit/loss for the year of equity-accounted investees in the consolidated income statement. Losses of an associate attributable to the Group are limited to the value of its net investment, as the Group has not acquired any legal or constructive obligations. The Group has no significant investments in associates. e) Balances and transactions eliminated on consolidation Balances and transactions between Group companies and the resulting unrealised gains or losses with third parties are eliminated on consolidation. 2.5 Translation differences a) Functional and presentation currency The annual accounts of each Group company are expressed in the currency of the underlying economic environment in which the entity operates (functional currency). The functional currency is the local currency for the majority of Group companies, with the exception of Bahru Stainless, NAS Canada and NAS Mexico, whose functional currency is the US Dollar. The figures disclosed in the consolidated annual accounts are expressed in thousands of Euros, the Parent s functional and presentation currency. b) Foreign currency transactions, balances and cash flows Transactions in foreign currencies are translated using the foreign exchange rate prevailing at the date of the transaction. Monetary assets and liabilities denominated in foreign currencies at the reporting date are translated at the closing exchange rate prevailing at that date. Any exchange differences that may arise from translation are recognised in profit or loss. Non-monetary assets and liabilities denominated in foreign currencies and recorded at historical cost are translated to the functional currency using the exchange rate prevailing at the date of the transaction. Non-monetary assets and liabilities denominated in foreign currencies that are measured at fair value are translated to the functional currency using the exchange rate prevailing at the date on which fair value was determined. Exchange gains and losses on non-monetary items measured at fair value are recorded as a part of the gain or loss on the fair value of the item. In the consolidated statement of cash flows, cash flows from foreign currency transactions have been translated into Euros at the exchange rates prevailing at the dates the cash flows occur. Exchange gains and losses arising on the settlement of foreign currency transactions and the translation into the functional currency of monetary assets and liabilities denominated in foreign currencies are recognised in profit or loss. Acerinox Group Page 12 of
16 c) Translation of foreign operations In preparing the Group's consolidated financial statements, the assets and liabilities of entities with a functional currency other than the Euro have been translated to Euros at the closing rate prevailing at the reporting date; income and expenses are translated at the average exchange rate for the period; and exchange differences are recognised separately in equity and in the statement of comprehensive income under translation differences. Translation differences are taken to profit and loss when the company that generates them ceases to form part of the Group. The Group has applied the exemption permitted by IFRS 1, First-time Adoption of International Financial Reporting Standards, relating to accumulated translation differences. Consequently, translation differences recognised in the consolidated annual accounts generated prior to 1 January 2004 are recognised in retained earnings. Furthermore, the Group did not apply IAS 21 The Effects of Changes in Foreign Exchange Rates retrospectively to goodwill arising in business combinations that occurred before the date of transition to IFRS. Consequently, goodwill is considered as an asset of the acquirer, not the acquiree, and is therefore not subject to variations due to exchange rate fluctuations affecting the acquiree. For presentation of the consolidated statement of cash flows, cash flows, including the comparative balances of foreign subsidiaries, are translated into Euros applying the same criteria as that used to translate the financial statements. No Group companies operate in hyperinflationary economies. 2.6 Intangible assets a) Goodwill Business combinations are accounted for by applying the acquisition method. Goodwill represents the positive difference between the cost of acquisition and the Group s share of the fair value of the acquiree's identifiable net assets (assets, liabilities and contingent liabilities) at the acquisition date. The goodwill recognised in the consolidated financial statements of the Acerinox Group mainly relates to the acquisition of a controlling interest in Columbus Stainless, Ltd. in After initial recognition, goodwill is measured at cost less any accumulated impairment losses. Goodwill is not amortised but is tested annually for impairment (or more frequently where there are indications of possible impairment) in accordance with IAS 36. To this end, goodwill is allocated to the cash-generating units (CGUs) of the company that is expected to benefit from the synergies of the business combination (see note 2.8). Impairment losses are recognised for a cash-generating unit when the recoverable amount of the unit is less than the carrying amount of goodwill. The recoverable amount of the cash-generating unit to which the Group's goodwill is allocated is determined based on its value in use (see note 2.8) Negative goodwill arising on an acquisition of a business combination is recognised directly in the consolidated income statement, after reassessing the measurement of the assets, liabilities and contingent liabilities of the acquiree, as established in the standard. Internally generated goodwill is not recognised as an asset. b) Internally generated intangible assets Expenditure on research activities undertaken with the prospect of gaining new scientific or technical knowledge is expensed in the consolidated income statement when incurred. When research findings are applied to produce new products or to substantially improve existing products and processes, the associated development costs are capitalised if the product or process is technically and commercially feasible, the Group has sufficient resources to complete development and sufficient future cash flows are expected to be generated to recover the costs, with a credit to self-constructed non-current assets in the consolidated income statement. The expenditure capitalised includes the cost of materials, direct labour and directly attributable overheads. Acerinox Group Page 13 of
17 Expenditure on activities for which costs attributable to the research phase are not clearly distinguishable from costs associated with the development stage of intangible assets are recognised in the consolidated income statement. Capitalised development costs are not amortised while the project is underway. Upon successful completion of the project, amortisation begins on a systematic basis over the estimated useful life. In the event of changes in the circumstances that led to the capitalisation of the project expenditure, the unamortised balance is expensed in the year the changes arise. c) Computer software Computer software licences are capitalised at the cost of acquiring the licence and preparing the specific program for use. Computer software maintenance or development costs are charged as expenses when incurred. Costs that are directly associated with the production of identifiable and unique computer software packages by the Group are recognised as intangible assets provided that they are likely to generate economic benefits that exceed the associated costs for more than one year. Capitalised expenses comprise direct labour costs and directly attributable overheads. d) Amortisation Intangible assets with finite useful lives are amortised by allocating the depreciable amount of an asset on a systematic basis over its useful life. Intangible assets are amortised from the date they become available for use. Estimated useful lives are as follows: - Industrial property: 5 years - Computer software: 2-5 years The Group does not have any intangible assets with indefinite useful lives. Residual values, amortisation methods and useful lives are reviewed, and adjusted if appropriate, at each reporting date. Changes to initially established criteria are accounted for as a change in accounting estimates. 2.7 Property, plant and equipment a) Owned assets Property, plant and equipment are recognised at cost or deemed cost, less accumulated depreciation and any accumulated impairment losses. Items of property, plant and equipment that require a period of time in order to be ready for use are classified as under construction. An asset is understood to be ready for use when it is in the location and condition necessary for it to be capable of operating in the manner intended by management, whereupon it is reclassified to the corresponding asset category, based on its nature. The cost of self-constructed assets is determined using the same principles as for an acquired asset, while also considering the criteria applicable to production costs of inventories. The production cost is capitalised by allocating the costs attributable to the asset to self-constructed non-current assets in the consolidated income statement. Borrowing costs directly linked to financing the construction of property, plant and equipment are capitalised as part of the cost until the asset enters service. The Group also capitalises certain borrowing costs incurred on loans that are not directly designated to finance the investments, applying a capitalisation rate to the amounts used to finance these assets. This capitalisation rate is calculated based on the weighted average of the borrowing costs incurred on loans received by the Company other than those specifically allocated to finance the assets. The amount of borrowing costs capitalised never exceeds the amount of borrowing costs incurred during the period. Acerinox Group Page 14 of
18 The cost of property, plant and equipment includes major repair costs, which are capitalised and depreciated over the estimated period remaining until the following major repair. Subsequent to initial recognition of the asset and once it is ready for use, only improvement costs incurred which will generate probable future profits and for which the amount may reliably be measured are capitalised. Costs of periodic servicing of property, plant and equipment are recognised in profit and loss as incurred. Spare parts are carried as inventory unless the Group expects to use them over more than one period, in which case they qualify as property, plant and equipment and are depreciated over their useful life. The carrying amount of a spare part is written off when it is used to replace a damaged part. Spare parts of property, plant and equipment are classified under technical installations and machinery in the breakdown provided in note 8. Gains or losses on the sale or disposal of an item of property, plant and equipment are recognised as operating income or expenses in the income statement. b) Investment property Investment property comprises Group-owned buildings held to earn rentals or for capital appreciation but not occupied by the Group. Investment property is initially recognised at cost, including transaction costs. Subsequently the Group applies the same criteria as for property, plant and equipment. As investment property represents only a minor proportion of the Group s assets, it is included within property, plant and equipment. Details are, however, provided in the notes. Lease income is recognised using the criteria described in note 2.17 b). c) Depreciation Property, plant and equipment are depreciated by allocating the depreciable amount of the asset on a straight-line basis over its useful life. The depreciable amount is the cost or deemed cost of an asset, less its residual value. Each part of an item of property, plant and equipment with a cost that is significant in relation to the total cost of the item is depreciated separately. Residual values, depreciation methods and useful lives are reviewed, and adjusted if appropriate, at each reporting date. Changes to initially established criteria are accounted for as a change in accounting estimates. Land is not depreciated, unless the Group has acquired the right to use the land and related property for a specific number of years, in which case it is depreciated over the period of the right of use. Property, plant and equipment are depreciated over the following estimated useful lives: - Buildings: Technical installations and machinery: Other property, plant and equipment: Impairment of non-financial assets The carrying amounts of the Group s non-financial assets, other than inventories and deferred tax assets, are reviewed at each reporting date to determine whether there are any indications of impairment. If any such indication exists, the Group estimates the recoverable amount of the asset. The recoverable amount of goodwill, which is not amortised, and of intangible assets not yet available for use is estimated at each reporting date, unless prior to this date there were indications of a possible loss in value, in which case these are tested for impairment. Acerinox Group Page 15 of
19 Impairment losses are recognised whenever the carrying amount of the asset, or its corresponding cash-generating unit, exceeds its recoverable amount. Impairment losses are expensed in the income statement. The recoverable amount of the assets is the higher of their fair value less costs to sell and their value in use. Value in use is the present value of estimated cash flows, applying a discount rate that reflects the current market valuation of the time value of money and the specific risks of the asset in question. For assets that do not generate cash inflows themselves, the recoverable amount is determined for the cash-generating unit to which the asset belongs, considered as the smallest identifiable group of assets that generates cash inflows that are largely independent of the cash inflows from other assets or groups of assets. Details of the variables and assumptions used by the Group to calculate value in use and identify cash-generating units are provided in notes 7.1 and 8.1. Except in the case of goodwill, impairment losses recognised in prior years are reversed through the income statement provided that there has been a change in the estimates used to determine the asset s recoverable amount since the last impairment loss was recognised. However, the new carrying amount cannot exceed the carrying amount (net of amortisation or depreciation) that the asset would have had if no impairment loss had been recorded. 2.9 Financial instruments Classification The Company classifies financial instruments into different categories based on the nature of the instruments and the Group s intentions on initial recognition Financial assets Acquisitions and disposals of investments are accounted for at the date on which the Group undertakes to purchase or sell the asset. Investments are derecognised when the contractual rights to the cash flows from the investment expire or have been transferred and the Group has transferred substantially all the risks and rewards of ownership. On derecognition of a financial asset, the difference between the carrying amount and the sum of the consideration received, net of transaction costs, is recognised in profit or loss. The measurement criteria applied to the financial assets held by the Group in 2016 and 2015 are detailed below. a) Financial assets at fair value through profit or loss Derivative financial instruments, except those that are designated as hedges and qualify for recognition as such, are included in this category. The derivative financial instruments included in this category are classified as current assets and measured at fair value. Transaction costs directly attributable to the acquisition are recognised as an expense. Changes in fair value are recorded under revaluation of financial instruments at fair value in the income statement. b) Loans and receivables Loans and receivables include non-derivative financial assets with fixed or determinable payments that are not quoted in an active market. They are only classified as non-current when they are not due to mature within 12 months of the reporting date. These investments are initially recognised at the fair value of the consideration given, including transaction costs directly attributable to the purchase, and subsequently measured at amortised cost using the effective interest method. Acerinox Group Page 16 of
20 The Group makes the necessary valuation adjustments where there is evidence that a receivable is impaired. The amount of the impairment loss is calculated as the difference between the carrying amount and the present value of the estimated future cash flows, discounted at the effective interest rate determined on initial recognition. These losses are recognised as an expense in the consolidated income statement and are reversed with the recognition of the income when their causes are eliminated. Trade receivables are included in this category, recognised at their nominal value, which is the same as their fair value, as generally they do not have a contractual rate of interest, are expected to be received in the short term and the effect of not discounting future receipts is not material. In cases where the Group considers that amounts will not be collected when due, the provision for bad debts reduces the balance of trade receivables. The Group analyses trade receivables on an individual basis although in general all balances past due by more than 180 days or when the debtor has been declared insolvent are considered as impaired. Discounted notes and factored trade receivables are recognised until maturity under both trade receivables and current loans and borrowings, unless the risks and rewards associated with these assets have been substantially transferred, in which case they are derecognised. c) Available-for-sale financial assets The Group's equity investments in other companies are included in this category. They are initially recognised at fair value plus transaction costs directly attributable to the purchase. After initial recognition financial assets classified in this category are measured at fair value provided this can be measured reliably, recognising the gain or loss in the consolidated statement of comprehensive income. The fair value of listed securities is determined by reference to the share price. The fair value of financial assets that are not quoted in official markets is calculated by reference to discounted future cash flows. Equity investments included in this category whose market value cannot be reliably defined are measured at acquisition cost, as permitted by IFRS-EU, less any impairment losses. When available-for-sale financial assets are sold, the cumulative gains or losses from changes in fair value recognised in the consolidated statement of comprehensive income are transferred to the consolidated income statement. When a decline in the fair value of an available-for-sale financial asset has been recognised in comprehensive income and there is objective evidence that the asset is impaired, the cumulative loss is reclassified from equity to the income statement. This amount is calculated as the difference between the acquisition cost and the current fair value, less any previously recognised impairment. Any impairment losses recognised in the income statement in relation to these assets are reversed against equity rather than through profit and loss. Any subsequent increase in fair value is recognised under valuation adjustments in the consolidated statement of comprehensive income. At the end of each reporting period the Group assesses whether there is objective evidence of impairment. Objective evidence of impairment exists when there is a significant or prolonged decline in the listed price of an investment below its cost. To determine whether this is the case, the Group examines the historical listed prices of its securities and how long they have been trading below cost Financial liabilities For measurement purposes, financial liabilities are classified into the following categories: a) Debts and payables Debts and payables include non-derivative financial liabilities with fixed or determinable payments. Debts and payables are initially recognised at cost, which is the same as their fair value, less any transaction costs incurred. These liabilities are subsequently measured at amortised cost using the effective interest method. Any difference between the amount received (net of transaction costs) and the amortised cost is recognised in profit or loss. However, trade payables falling due in less than one year that have no contractual interest rate and are expected to be settled in the short term are measured at their nominal amount. Acerinox Group Page 17 of
21 This category also includes the bonds issued by the Group. The Group has contracted reverse factoring facilities with various financial institutions to manage payments to suppliers. Trade payables settled under the management of financial institutions are recognised under trade and other payables until they are settled or repaid or have expired. When debt is refinanced, the Group assesses whether the changes made in the new agreement are sufficiently important to recognise the effects as if it were a cancellation and, simultaneously, a new loan. b) Financial liabilities at fair value through profit or loss This category includes the Group s derivative financial instruments, except for financial guarantee contracts or designated hedging instruments. These are recognised at fair value. Changes in fair value are recognised in profit or loss Hedge accounting Derivative financial instruments are initially recognised at cost of acquisition, which coincides with their fair value. They are subsequently recognised at fair value. Derivative financial instruments that do not meet hedge accounting requirements are classified and measured as financial assets and financial liabilities at fair value through profit or loss. Where derivatives qualify for recognition as cash flow hedges, they are treated as such and the recognition of any resultant unrealised gain or loss depends on the nature of the hedged item. The effective part of the realised gain or loss on the derivative financial instrument is initially recognised in the consolidated statement of comprehensive income and later transferred to the income statement in the year or years in which the hedged transaction affects profit or loss. The Group only undertakes cash flow hedges. At the inception of the hedge the Group formally designates and documents the hedging relationships and the objective and strategy for undertaking the hedges. Hedge accounting is only applicable when the hedge is expected to be highly effective at the inception of the hedge and until it expires. A hedge is considered as highly effective if it offsets the changes in cash flows attributable to the hedged risk throughout the period for which it was designated (prospective analysis) and the actual effectiveness, which can be reliably measured, is within a range of 80%-125% (retrospective analysis). The Group prospectively discontinues the accounting of fair value hedges when the hedging instrument expires, is sold or the hedge no longer meets the criteria for hedge accounting. In these cases, the cumulative gain or loss on the hedging instrument that has been recognised in equity is recorded in profit or loss Determination of fair value Financial instruments measured at fair value are classified based on valuation inputs into the following levels: LEVEL 1: includes financial instruments for which the fair value is determined by reference to quoted prices on active markets. LEVEL 2: includes financial instruments for which the fair value is determined based on observable market inputs, other than quoted prices. LEVEL 3: includes financial instruments for which the fair value is determined based on unobservable inputs. Acerinox Group Page 18 of
22 2.10 Inventories Inventories are initially measured at cost of acquisition or production. Valuation allowances are made and recognised as an expense in the income statement when the cost of acquisition or production of inventories exceeds the net realisable value. The Group uses the same cost model, namely the weighted average cost method, for all inventories of the same nature and with a similar use. Finished goods and work in progress are measured at the weighted average cost of raw and other materials consumed, incorporating applicable direct and indirect labour costs and general manufacturing costs based on the higher of normal operating capacity or actual production. Net realisable value is the expected selling price of these goods less costs to sell. In the case of work in progress the estimated costs of completion are also deducted from this price. Raw materials are not written down below cost if the finished goods in which they will be used are expected to be sold at or above cost of production. The cost of underutilisation of operating capacity is not included in the value of finished goods and work in progress. Any write-downs that reduce inventories to their net realisable value are reversed, up to the cost of the inventories, if the circumstances that gave rise to the write-downs cease to exist Emission allowances Pursuant to Royal Decree 602/2016 of 2 December 2016, on 1 January 2016 the Group recognised CO 2 emission allowances as inventories, rather than under intangible assets as had previously been the case. As International Financial Reporting Standards do not specify how to classify emission allowances, the Group has opted to harmonise the two policies by adopting similar classification criteria in both the individual and consolidated accounts. This movement has been recognised as a transfer in the intangible asset details provided in note 7. CO 2 emission allowances are measured at cost of acquisition. Allowances acquired free of charge under the National Allocation Plan pursuant to Law 1/2007 of 9 March 2007 are initially measured at market value at the date received. At the same time, a grant is recognised for the same amount under deferred income. Emission allowances remain classified as inventories until surrendered. At year end, the Group assesses whether the carrying amount of the allowances exceeds their market value in order to determine whether there are indications of impairment. If there are indications, the Group determines whether these allowances will be used in the production process or earmarked for sale, in which case the necessary impairment losses would be recognised. Provisions are released when the factors leading to the valuation adjustment have ceased to exist. A provision for liabilities and charges is recognised for expenses related to the emission of greenhouse gases. This provision is maintained until the company is required to settle the liability by surrendering the corresponding emission allowances. These expenses are accrued as greenhouse gases are emitted. When an expense is recognised for allowances acquired free of charge, the corresponding deferred income is taken to operating income. In the case of swaps of emission allowances, given that all of the Group's allowances were acquired free of charge, the accounting treatment applied by the Group is that of non-commercial swaps. The Group derecognises allowances surrendered at their carrying amount and recognises those received at their fair value when received. The difference between both values is recognised as deferred income. Detailed information on emission allowances received and consumed in 2016 and 2015 is included in note 9 Inventories. Acerinox Group Page 19 of
23 2.11 Cash and cash equivalents Cash and cash equivalents include cash balances, demand deposits with banks and other short-term, highly liquid investments that are readily convertible to cash and which are subject to an insignificant risk of changes in value. In the consolidated statement of cash flows, the Group classifies interest paid and received as cash flows from operating activities, while dividends received are considered cash flows from investing activities and dividends paid are classified as cash flows used in financing activities Grants Capital grants Capital grants are those received by the Group for the acquisition of property, plant and equipment and intangible assets or as consideration for emission allowances acquired free of charge. They are recognised as deferred income in the balance sheet. They are initially recognised at the original amount awarded when there is reasonable assurance that this will be received and that the Group will comply with the conditions attached. Subsequently, they are taken to the income statement on a straight-line basis over the useful lives of the assets for which the grants were received, except for those relating to CO2 emission allowances, which are taken to income in line with the recognition of the corresponding greenhouse gas emission expense Operating grants Operating grants are those received to finance specific expenses and are recognised as income as the expenses are incurred Employee benefits Certain Group companies have assumed the following long-term commitments with their employees: a) Defined contribution plans A defined contribution plan is a pension plan under which the Group pays fixed contributions into a separate entity, and will have no legal or constructive obligation to pay further contributions if the fund does not hold sufficient assets to pay all employee benefits relating to employee service in the current and prior periods. Certain Group companies pay contributions to pension and life insurance plans on a mandatory, contractual or voluntary basis. The Group has no further payment obligations once these contributions have been paid. The contributions are recognised as an employee benefit expense when they are accrued. Prepaid contributions are recognised as an asset to the extent that a cash refund or a reduction in future payments is available. Provisions are not made for defined contribution plans as they do not generate future obligations for the Group. b) Defined benefit plans A defined benefit plan is a commitment entered into by a company with its employees to remunerate services rendered. These benefits have been established based on local legislation in certain countries, contracts signed to that effect, or as included in collective bargaining agreements prevailing in certain Group companies. Accrued commitments are calculated as the present value of the accumulated benefits accrued by personnel until the reporting date, using actuarial assumptions. Calculations are made by independent experts. Group companies record the corresponding provisions to cover these commitments. Existing obligations may be classified as: Pension plans: certain Group companies have commitments with some employees reaching retirement age. Acerinox Group Page 20 of
24 Early retirement benefits: certain Group companies have undertaken to pay benefits to employees who opt to take early retirement. Supplements: these plans are obligations agreed with certain Group employees to supplement their remuneration on retirement. Other post-employment commitments: certain Group companies provide healthcare benefits to their retired employees. Entitlement to these benefits is usually conditional on the employee remaining in service up to retirement age and the completion of a minimum service period. The expected costs of these benefits are accrued over the period of employment. The Group complies with obligations regarding the externalisation of these commitments in countries where this is applicable. Defined benefit liabilities recognised in the consolidated balance sheet reflect the present value of defined benefit obligations at the reporting date, minus the fair value at that date of plan assets. The Group recognises changes in the actuarial value of obligations in other comprehensive income. An independent expert calculates the actuarial value of commitments using the Projected Unit Credit method, taking into account mortality tables and estimated future increases in medical costs. When plan assets include insurance policies that exactly match the amount and timing of some or all of the benefits payable under the plan, the fair value of the insurance policies is considered equal to the present value of the related obligations Provisions The Group recognises provisions when: (i) It has a present obligation (legal or constructive) as a result of past events; (ii) It is more likely than not that an outflow of resources will be required to settle the obligation; and (iii) A reliable estimate can be made of the amount of the obligation. The amount recognised as a provision is the best estimate of the expenditure required to settle the present obligation at the end of the reporting period, taking into account all risks and uncertainties surrounding the amount to be recognised as a provision and, where the time value of money is material, the financial effect of discounting provided that the expenditure to be made each period can be reliably estimated Classification of assets and liabilities as current and non-current The Group classifies assets and liabilities in the consolidated balance sheet as current and non-current. Assets and liabilities are considered current when the Group expects to realise or settle them within 12 months after the reporting date or they are cash or cash equivalents Income tax The income tax expense or tax income for the year comprises current tax and deferred tax. Current tax is the estimated tax payable on the consolidated taxable income or tax loss for the year using prevailing tax rates enacted at the reporting date and any adjustment to tax payable in respect of previous years. Deferred tax is calculated using the balance sheet method, based on temporary differences that arise between the tax base of assets and liabilities and their carrying amounts in the consolidated annual accounts. Deferred tax is measured using the tax rates (and laws) enacted or substantively enacted at the reporting date that are expected to apply to the period when the asset is realised or the liability settled. Acerinox Group Page 21 of
25 The effect on deferred tax assets and liabilities of a change in the tax rate is recognised in the income statement, except to the extent that it relates to items previously charged or credited to the consolidated statement of comprehensive income. Deferred tax liabilities are always recognised. Deferred tax assets in respect of temporary differences are recognised only to the extent that it is probable that future taxable income or deferred tax liabilities will be available against which the asset can be utilised. Deferred tax assets are reduced when it is no longer considered probable that sufficient future taxable income will be generated or there are no deferred tax liabilities against which the assets can be offset. Reductions are reversed if there is renewed expectation that sufficient taxable income will be available against which the derecognised balance can be utilised. The Group only offsets deferred tax assets and liabilities if it has a legally enforceable right to do so, the assets and liabilities correspond to the same taxation authority and it plans to realise current tax assets or settle current tax liabilities on a net basis. Deferred tax assets and liabilities are recognised in the consolidated balance sheet under non-current assets or liabilities, irrespective of the expected date of recovery or settlement. Certain companies in the consolidated Group have reserves that could be subject to taxation if they were distributed. The Group has not recognised any tax effect in this respect as these reserves are not expected to be distributed in the foreseeable future. The Parent has filed consolidated tax returns since As agreed by the shareholders at an annual general meeting held on 28 May 2003, Acerinox, S.A. and some of the Spanish-domiciled subsidiaries form part of a consolidated tax group on an indefinite basis, with the exception of Metalinox Bilbao, S.A.U. and Inoxidables de Euskadi, S.A.U., which file tax returns separately. At 31 December 2016 and 2015 the consolidated tax group comprises Acerinox, S.A., Acerinox Europa, S.A.U, Roldán, S.A., Inoxfil, S.A., Inoxcenter, S.L.U. and Inoxcenter Canarias, S.A.U Income a) Sales of goods and rendering of services Revenue from the sale of goods is recognised in the income statement when the risks and rewards of ownership have been transferred to the buyer. No revenue is recognised if there are significant uncertainties regarding the recovery of the consideration due, or the possible return of goods. Revenue is recognised net of taxes, returns and discounts that the Group considers probable at the date the revenue is recognised, and after the elimination of intra-group sales. b) Rental income Rental income from investment property is recognised in the income statement on a straight-line basis over the term of the lease. c) Income from dividends Dividend income is recognised when the Group s right to receive it is established Environmental issues The Group takes measures to prevent, reduce or repair the damage caused to the environment by its activities. Acerinox Group Page 22 of
26 Expenses derived from environmental activities are recognised as expenses in the period in which they are incurred. The Group has not recognised any environmental provisions. Property, plant and equipment acquired by the Group for long-term use to minimise the environmental impact of its activity and protect and improve the environment, including the reduction and elimination of pollution, are recognised as assets, applying the measurement, presentation and disclosure criteria described in note Changes in accounting estimates and policies, and correction of errors The Group applies IAS 8 to recognise changes in accounting estimates and accounting policies and to correct errors. The Group recognises changes in accounting estimates in the period in which they occur. Accounting errors are corrected in the year in which they occurred, restating the comparative information presented in the financial statements. Changes in accounting policies are applied retrospectively, adjusting the opening balances of the equity items affected as of the prior year for which figures are included. Given that the change in policy with respect to emission allowances is merely a change in classification, with no significant impact on the consolidated accounts, the Group has not restated the balances for the prior period, but rather has presented the movement as a transfer, as reflected in movements in intangible assets (see note 7). NOTE 3 ACCOUNTING ESTIMATES AND JUDGEMENTS Accounting estimates and judgements are assessed constantly and based on past experience and other factors, including expectations of future events that are considered reasonable. The Group makes estimates and judgements related to future events. The resulting accounting estimates could differ from actual results. In accordance with IAS 8 on Accounting Policies, Changes in Accounting Estimates and Errors, changes in accounting estimates are recognised prospectively in the Group s financial statements. The Group s main estimates are as follows: a) Impairment of goodwill and other non-financial assets The Group tests goodwill annually for impairment, in accordance with the accounting policy described in note 2.8. The Group reviews property, plant and equipment at each reporting date to ascertain whether there is any indication of impairment. If any such indication exists, the Group estimates the recoverable amount of the asset. The recoverable amount of a cash-generating unit is determined based on its value in use, except in the case of certain investment property, which has been appraised by an independent expert. These calculations are made using reasonable assumptions based on past returns and future production and market development expectations. Notes 7.1 and 8.1 include details of the analyses conducted by the Group in 2016 and b) Useful lives of plant and equipment Group management determines the estimated useful lives and corresponding depreciation charges for its plant and equipment based on expert valuations. These could alter significantly as a result of technical innovations, variations in plant activity levels, etc. Management regularly reviews the depreciation charge and adjusts it when estimated useful lives are different from those previously applied, fully depreciating or derecognising technically obsolete and non-strategic assets which have been abandoned or sold. Acerinox Group Page 23 of
27 Estimated useful lives remain unchanged in 2016 and c) Fair value of derivatives or other financial instruments The Group acquires derivative financial instruments to hedge against changes in exchange rates and interest rates. The fair value of financial instruments that are not traded in active markets is determined by using valuation techniques mainly based on market conditions existing at each reporting date, and provided that financial information is available to carry out this valuation. Note contains additional information on financial instruments measured in accordance with these assumptions. d) Provisions As mentioned in note 2.14, provisions recognised in the consolidated balance sheet reflect the best estimate at the reporting date of the amount expected to be required to settle a liability, provided that the materialisation of this outflow of resources is considered probable. Changes in foreseen circumstances could affect these estimates, which would be revised if necessary. e) Net realisable value As mentioned in note 2.10, the Group estimates the net realisable value of its inventories to recognise any impairment required. Expected selling prices of inventories less costs to sell are considered when calculating net realisable value. f) Recoverability of available tax loss carryforwards and deductions The Group regularly evaluates its available tax credits through projections of profit and loss approved by management, to conclude as to whether they will be recoverable in the future. The Group takes into account the limitations to offsetting tax bases as stipulated in certain legislation. Details of the basis on which the Group assesses the recoverability of capitalised tax credits are provided in note Significant restrictions to the deductibility of prior years' tax losses were introduced in Spain in 2016, thereby prolonging their recovery periods (see note 17.1). Based on the estimates made, the Group considers that the tax credits recognised are still recoverable within a reasonable time frame. NOTE 4 FINANCIAL RISK MANAGEMENT The Group s activities are exposed to various financial risks: market risk (currency risk, interest rate risk and price risk), credit risk and liquidity risk. The Group aims to minimise the potential adverse effect on its profits through the use of derivative financial instruments, where appropriate to the risks, and insurance. Note includes a detailed analysis of the Group s derivatives at year end. The Group does not acquire financial instruments for speculative purposes. 4.1 Market risk Market risk arises from variations in market prices due to exchange rate or interest rate fluctuations or changes in the price of raw and other materials, which can affect a company s results and equity as well as the values of its assets and liabilities. Acerinox Group Page 24 of
28 4.1.1 Currency risk The Group operates internationally and is therefore exposed to currency risk when operating with foreign currencies, especially with regard to the US Dollar. Currency risk arises from commercial transactions, financing and investment operations, and from translation of financial statements in functional currencies other than the Group s presentation currency (Euros). In order to control currency risk associated with commercial transactions, Group entities use forward currency sale or purchase contracts negotiated with the Group s Treasury Department in accordance with policies approved by management. The Group also uses derivatives such as cross-currency swaps to control currency risk in financing operations. The Group hedges most of its financial and commercial transactions in currencies other than the functional currency of each country. At the beginning of each month and subject to fortnightly review, each company considers its loans in non-local currency, trade receivables and supplier balances in foreign currency, the sales and purchases in foreign currency forecast for the period and exchange rate insurance coverage. The Group may take commercial and finance transactions as a whole into account when evaluating its total exposure for the purpose of hedging transactions in foreign currency. Not all of the exchange rate insurance contracts entered into by the Group qualify for cash flow hedge accounting as established in note Contracts that do not comply with these criteria have been accounted for as financial instruments at fair value through profit or loss. In general, financial instruments designated to hedge exposure to currency risk arising from commercial transactions are not recognised as hedging instruments. However, those designated as a hedge of foreign currency risk arising from financing operations arranged with credit institutions qualify for recognition as hedging instruments. The fair value of forward exchange contracts is their market price at the reporting date, which is the present value of the difference between the insured price and the forward price of each contract. Note includes details of the financial instruments arranged by the Group to hedge this type of risk at 31 December 2016 and As most commercial transactions in currencies other than the functional currency of the Company are hedged, any fluctuation in exchange rates that could affect assets or liabilities denominated in foreign currency would be offset by a change of the same amount in the derivative contracted. Lastly, the Group is exposed to currency risk as a result of the translation to Euros of the individual financial statements of companies whose functional currency differs from the Group s presentation currency, particularly the US Dollar and the South African Rand. The USD-Euro exchange rate at 2015 year was , while at 2016 year end it stood at The exchange rate of the South African Rand to the Euro at 2015 year end was , while at 2016 year end it was , reflecting appreciation of 14.72%. Based on the exchange rates of these currencies against the Euro at the end of 2016, sensitivity to changes in exchange rates, with other variables remaining constant, is as follows: (Expressed in thousands of Euros) 10% appreciation Profit and loss 10% depreciation 10% appreciation Equity 10% depreciation 31 December 2016 USD 3,761-3, , ,311 ZAR 2,143-1,753 25,882-21, December 2015 USD 4,076-3, , ,345 ZAR 1,537-1,257 19,385-15,860 Acerinox Group Page 25 of
29 4.1.2 Interest rate risk The Group s financing comes from various countries and in different currencies (mainly the Euro, the US Dollar and the South African Rand), with a range of maturity dates and mostly variable interest rates. The Group s financial liabilities and financial assets are exposed to fluctuations in interest rates. To manage this interest risk rate, curves are analysed regularly and on occasion derivatives may be used. These derivatives take the form of interest rate swaps and qualify for recognition as cash flow hedging instruments. The fair value of interest rate swaps is the estimated amount that the Group would receive or pay to terminate the swap at the reporting date, taking into account interest and exchange rates at that date and the credit risk associated with the swap counterparties. Risk premiums and credit spreads increased from 2009 until the end of 2013 as a result of the international financial crisis and money market turbulence. Since then, the Acerinox Group has witnessed a considerable improvement. The Group has taken advantage of the favourable market conditions to refinance the majority of its long-term debt in the first half of 2016, thereby extending the average life of its debt. During 2016 the Group has reduced the outstanding amount of its interest rate hedges, in part as a result of the refinancing operations carried out in the first half of the year, the majority of which were arranged at floating rates, and also due to the early repayment of the syndicated loan arranged in the United States in 2012, which has led to the cancellation of the associated cross-currency swap. Note includes details of the financial instruments arranged by the Group to hedge this type of risk at 31 December 2016 and Had interest rates on the outstanding debt at year end been 100 basis points higher, with all other variables remaining constant, the Group s consolidated profit after tax would have been Euros 6.07 million lower due to a higher finance cost on variable-rate debt (Euros 5.03 million lower in 2015). The effect on the Group s equity of higher interest rates across the entire curve would have been a net decrease of Euros 4.97 million (Euros 0.79 million decrease in 2015), as the higher borrowing costs would have been offset by increases in the values of its interest rate hedging derivatives held at the reporting date Price risk The Group is exposed to three types of price risk: 1. Risk due to changes in the listed price of securities held in listed companies The risk of price fluctuations in listed securities relates to the shares held by the Group in Nisshin Steel, which is traded on the Tokyo Stock Exchange. The Group has not hedged this risk with derivative financial instruments. Note provides details of the impact of the fluctuations in listed securities during the year. 2. Risk of changes in prices of raw materials Stainless steel is an iron alloy with a minimum chromium content of 10.5%, which also contains other metals such as nickel or molybdenum to give it specific properties. Given the variation in the price of the raw materials used in the production process, stainless steel prices can be highly volatile. The cost of raw materials, of which nickel accounts for approximately 40%, is approximately 70% of the total production cost. The price setting strategy is therefore one of the most critical functions and requires significant knowledge of the market. In Europe, South Africa and the United States, sale prices comprise a base price and a variable component known as the alloy surcharge. The alloy surcharge is calculated monthly by all producers on the basis of a formula that takes into account the variation in the price of certain raw materials (particularly nickel, chromium and molybdenum) and fluctuations in the EUR-USD exchange rate. The application of this alloy surcharge means that the change in nickel prices on the London Metal Exchange during production of the order, as well as fluctuations in the price of other raw materials and the EUR-USD exchange rate, can be passed on to customers. This natural hedge is applied to 90% of the Group's sales (Europe, America and South Africa). Acerinox Group Page 26 of
30 The stainless steel market is characterised by healthy demand, which has grown at an annual rate of approximately 6% for over 50 years. Exceptionally, the market shrank by 11.8% in because of the worldwide economic recession, but recovered with growth of 26.4% in The aforementioned annual growth rate is therefore expected to prevail in the medium term. Stainless steel is required for all industrial applications and used in all sectors, which guarantees that this growth will be sustained in the coming years. Although end consumption continues to grow steadily, the fact that this market is largely controlled by independent wholesalers leads to volatility in apparent consumption, reflecting their expectations regarding nickel price trends in the London Metal Exchange (LME) and their ensuing strategies to stockpile or realise inventories. Fluctuations in the price of nickel also affect consumer demand. Reductions in the price of nickel tend to go hand in hand with short-term drops in demand. Conversely, a rise in nickel prices tends to go hand in hand with higher demand. To counter the risk derived from the fact that independent wholesalers control the majority of the market, the Acerinox Group has developed a sales network that enables it to supply end customers on a continuous basis, by means of warehouses and service centres through which the Group s production is channelled. This policy has enabled the Group to achieve a significant market share among end customers and, therefore, stabilise sales and reduce this risk. Maintaining sufficient inventory levels in warehouses entails the risk that these inventories might be recognised above their market price. The Group alleviates this risk by maintaining strict control over inventory levels. The valuation of raw materials, work in progress and finished goods at average cost helps to reduce the volatility of costs and, consequently, to decrease the impact of nickel price fluctuations on margins. The Group s policy of taking firm orders naturally hedges the costs of raw materials, as all accepted orders have a known risk. The Group has also made considerable efforts to reduce its production cycle to two weeks. Keeping strict control over inventories and adapting production to market circumstances help to alleviate the risk of raw material price fluctuations. The aforementioned factors (an own sales network, controlled inventory levels, alloy surcharges, average cost valuations, shortening of the production cycle and a policy of acceptance of short-term orders) help to reduce exposure to the main risk, namely the cyclical nature of apparent consumption due to the volatility of raw materials. As this is a factor beyond the Group's control, effective risk management is not always sufficient to eliminate its impact. 4.2 Credit risk Credit risk is defined as the possible loss that could be incurred through failure of a customer or debtor to meet contractual obligations. The Group s exposure to credit risk is determined by the individual characteristics of each customer and, where applicable, by the risk corresponding to the country where the customer operates. Due to the diversity of its customers and the countries in which it operates, credit risk is not concentrated in any individual customer, sector or geographical region. The Group hedges its commercial and political risks either through credit insurance companies, or through letters of credit and bank guarantees extended by banks of recognised solvency located in countries with low financial risk. Credit insurance covers between 85% and 90% of declared commercial risks, depending on the country in which the customer is located and the insurance company, and 90% of political risks. The Group s main credit insurer has an A3 credit rating from Moody s and an A excellent rating from A.M. Best. In 2016 payouts of Euros 1,672 thousand have been collected under the credit insurance policy (Euros 1,674 thousand in 2015). A risk committee is responsible for monitoring the Group s credit risk policy. New customers are analysed with and assigned a risk cover by the insurance company, which enables the Group to offer its general payment terms to those that fulfil the necessary credit conditions. Where required, the risk committee also performs an individual analysis of customers creditworthiness, establishing credit limits and payment terms. Payment in cash is required from those that do not. Acerinox Group Page 27 of
31 The risk committee comprises representatives from the sales, financial and legal departments. The risks of the companies that make up the Acerinox Group are analysed and information is in turn received from the respective risk committees of Bahru Stainless, Columbus, North American Stainless or Grupinox (which represents the sales network in Spain). Among other duties, the risk committee reviews the status of past-due debts, monitors sales with excessive exposure, and approves internal loans or, depending on the amount, requests approval from the steering committee. The Group has long-standing commercial relationships with many of its customers. In the event of a late payment, the Group monitors future deliveries and payment terms closely, reviews credit limits and improves existing measures as appropriate. Where permitted under local legislation in the country in which the customer operates, retention of title clauses are used to secure recovery of goods in the event of default on payment. On occasion the Group also uses other financial instruments to reduce credit risk, such as factoring operations. The Group derecognises factored assets when the risks and rewards of these assets have been substantially transferred. The Group makes valuation adjustments to trade receivables where necessary to mitigate the risk of bad debts or provide for past-due balances, or when circumstances indicate that collection is doubtful. In general, the Group recognises impairment on receivables aged over 180 days or when the debtor has filed for insolvency. Details of movement in impairment of trade receivables are provided in note At 31 December 2016, consolidated trade receivables amount to Euros 527,787 thousand (Euros 439,537 thousand in 2015). Revenues for 2016 total Euros 3,968,143 thousand (Euros 4,221,426 thousand in 2015). Credit risk insurance has been contracted for 54% of consolidated net sales (55% in 2015). Cash conditions exist for 1% (2% in 2015). Confirmed letters of credit or guarantees are used to hedge credit risk in 2% of consolidated net sales (2% in 2015). Domestic sales by North American Stainless Inc., which entail a very low risk due to the collection period of under 30 days, account for 37% of consolidated net sales (37% in 2015). The ageing analysis of receivables is as follows: (Expressed in thousands of Euros) 2016 % of payables 2015 % of payables Outstanding 452,024 86% 366,051 83% Less than 30 days 58,832 11% 49,622 11% days 7,148 1% 8,950 2% days 1,505 0% 3,801 1% Over 90 days 8,278 2% 11,113 3% TOTAL 527, % 439, % The Group has made provisions for Euros 7,260 thousand (Euros 9,815 thousand in 2015). Provision was made for an amount of Euros 522 thousand during the year (Euros 648 thousand in 2015), accounting for 0.01% of sales in 2015 and Most of the Group s past-due receivables are insured and generally reflect customary delays in trading activity (78% of past-due receivables are aged less than 30 days). At 17 February, over 84% of the above past-due debt has been collected (73% in 2015). In view of the default rates in all sectors, we consider that the above figures are highly satisfactory and vindicate the Group s credit risk policy. Any advances to suppliers of property, plant and equipment or intangible assets are hedged through bank guarantees issued by the supplier and confirmed by banks of recognised solvency. Acerinox Group Page 28 of
32 4.3 Liquidity risk The Group is primarily financed through the cash flows generated in its operations, in addition to loans and financing facilities. Although access to liquidity has improved considerably over the last two years, the Group ensures its liquidity and flexibility through long-term loans and financing facilities for amounts exceeding the quantities required at any time. The Group s cash is centrally managed to optimise resources. The Group s net debt is primarily concentrated within the Parent (more than 85% of total gross borrowings at year end). Based on its cash flow estimates and considering its investment plans, the Group has sufficient funding to meet its commitments, and maintains sufficient balances available for drawdown from credit facilities to cover liquidity risk. In 2016 and 2015 no payment defaults occurred on the principal of loans or loan interest on the Group s financing. At year end the Group has been granted current and non-current financing totalling Euros 1,819 million and nonrecourse factoring facilities of Euros 420 million. Euros 1,218 million has been drawn down from financing facilities at 31 December 2016 (Euros 135 million from factoring facilities). In 2015, the Group had current and non-current financing facilities of Euros 1,788 million and non-recourse factoring facilities of Euros 420 million. Drawdowns from financing facilities amounted to Euros 1,191 million and drawdowns from factoring facilities amounted to Euros 100 million. At 31 December 2016 cash and cash equivalents amount to Euros 598 million (Euros 480 million in 2015). The high levels of bank borrowings to guarantee mid-term liquidity along with the ongoing effort to reduce working capital continues to provoke high levels of cash in the Group. The cash balances are available and there is no restriction on their use. Cash deposits are always short-term never exceeding three months and with banks of recognised solvency. In addition, the Group continually monitors the maturity of its financial debt, seeking to establish the longest possible maturities. The most significant financing operation during 2016 was the debt rescheduling of the majority of the bilateral loans held by Acerinox S.A., which was undertaken to extend the repayment due dates to between four and five years and to reduce the margins. Details of this financing operation are provided in note An analysis of the Group s payment obligations at the 2016 close is as follows: (Expressed in thousands of Euros) Amount at 31/12/2016 Future cash flow maturities Less than 6 months 6 to 12 months 1 to 2 years 2 to 5 years More than 5 years Non-current payables 936,805-1,005,581-9,368-8, , ,281-84,688 Current payables 281, , ,564-56,390 Suppliers and other payables 780, , ,691 FINANCIAL DERIVATIVES Hedged using interest rate swaps and cross-currency swaps 3,354 3, ,017 2, Export exchange rate insurance 3, , ,637 Import exchange rate insurance 15, , ,656 TOTAL 2,021,498-1,318, ,779-64, , ,574-84,688 Payables to public entities are not included in suppliers and other payables. Future cash flow maturities include the loan principal plus interest based on contractual interest rates at year end. Acerinox Group Page 29 of
33 This item does not include approved investments not capitalised under property, plant and equipment under construction at the reporting date. 4.4 Capital management The aims of the capital management policy are: - To safeguard the Company s capacity for sustained growth - To provide appropriate returns to shareholders - To maintain an optimum capital structure The Company manages its capital structure and makes adjustments based on changes in economic circumstances. To maintain and adjust its capital structure, it can adopt different policies relating to the payment of dividends, the reimbursement of the share premium, share buy-backs, self-financing of investments, non-current borrowings, etc. Capital structure is controlled using different ratios, such as the net financial debt/ebitda ratio, understood to be the period necessary for the resources generated by the Company to cover the level of debt; or the gearing ratio, i.e. the relationship between net financial debt and equity of the Company. Net financial debt is taken to be the sum of current and non-current loans and borrowings, plus notes issued, less cash and cash equivalents. EBITDA reflects operating profit or loss before amortisation, depreciation and changes in trade provisions (which comprise a decrease of Euros 1,840 thousand). The ratio of net financial debt to EBITDA is 1.88x, lower than in 2015 (2.48x) and well within the limits stipulated in the covenants governing Group borrowings, as detailed in note After taking into account investments of Euros million made in in 2016 (Euros 67.6 million in 2015), the Group generated cash flows of Euros million (consumption of Euros 50.2 million in 2015) due to the greater pre-tax profit of Euros million (Euros 76.9 million in 2015) and optimal management of working capital, which fell by Euros 16.3 million (increase of Euros million in 2015). Net financial debt, which amounts to Euros million, is down by 12.8% with respect to the prior year (Euros million). The Group s gearing ratio is 28.6% (35.1% in 2015), the lowest achieved in the past 14 years. As described in note , in May Acerinox restructured the maturities of the majority of its bilateral loans and agreed to simultaneously cancel its previous loans and recognise the the new loans. Through these new agreements (Euros 717 million), the Group extended the maturities of its debt up to 2021, lowered interest rates, reduced payments for the next three years and brought new institutions into its banking pool. As a result, the Group has negotiated advantageous financing conditions and lowered the cost of its debt, without covenants. On 30 June, the US Dollars 135 million principal of the syndicated loan arranged in the United States was repaid in advance. This loan was originally scheduled to mature on 17 February The volume of investments continues to be in line with the Group s strategic plan. The Group did not base its strategic plan, which has been revised for the period, on opportunistic criteria, but rather on industrial rationale and long-term efficiency, meaning that, its financial position permitting, the Group can keep to this plan even when the economic climate is unfavourable. The total remuneration offered to shareholders was Euros 0.45 per share in 2016, as has been offered each year since At the ordinary annual general meeting held on 9 June 2016, the shareholders approved a scrip dividend also known as a flexible dividend in which Acerinox shareholders were able to choose between cash and new shares. Through this decision the Company abided by its traditional policy of maintaining shareholder remuneration. An amount of Euros million was ultimately paid (Euros million in 2015). On 22 July, 9,360,150 new Acerinox shares, created as a result of shareholders representing 77.2% of the Company s share capital opting to receive their dividend in the form of shares, began trading (5,005,253 new shares, for shareholders representing 59.3% of the Company's share capital, in 2015). Acerinox, S.A. s share capital is currently represented by 276,067,543 shares (266,707,393 shares at the 2015 reporting date). Acerinox Group Page 30 of
34 4.5 Insurance As the Group s three integrated flat product production plants, one cold rolling plant and three long product production plants are located in different regions, an accident would not affect more than one-third of total production. This guarantees the continuity of the business, while adequate co-ordination between the remaining factories reduces the consequences of material damage to any of the facilities. Sufficient coverage has been contracted for the Group s factories through material damage and loss-of-profit insurance policies, which account for over 53.52% of the Acerinox Group s insurance expenditure. All assets under construction are covered by both the insurance policies taken out by the respective suppliers in addition to a global building and assembly policy. The Group also has a reinsurance company based in Luxembourg, Inox Re, which manages these risks by assuming a part as self-insurance and accessing the reinsurance market directly. The Acerinox Group has also arranged general liability, environmental, credit, transport, and group life and accident insurance policies to reduce its exposure to these different risks. NOTE 5 SCOPE OF CONSOLIDATION 5.1 Subsidiaries and associates At 31 December 2016 and 2015, in addition to Acerinox, S.A., the Acerinox consolidated group includes 39 fully consolidated subsidiaries and one equity-accounted associate. Acerinox Group Page 31 of
35 Investments in subsidiaries and associates in 2016 are as follows: FULLY CONSOLIDATED COMPANIES COUNTRY COST (in thousands of Euros) INTEREST % OWNERSHIP 2016 COMPANY HOLDING INVESTMENT AUDITORS ACERINOX (SCHWEIZ) A.G. Mellingen, Switzerland % ACERINOX S.A KPMG ACERINOX ARGENTINA S.A. Buenos Aires, % ACERINOX S.A Chinen, Morbelli y Argentina 13 10% INOXIDABLES DE EUSKADI S.A.U asociados ACERINOX AUSTRALASIA PTY. LTD. Sydney, Australia % ACERINOX S.A ACERINOX BENELUX S.A. - N.V. Brussels, Belgium % ACERINOX S.A KPMG ACX DO BRASIL REPRESENTAÇOES, LTDA Sao Paulo, Brazil % ACERINOX S.A % INOXIDABLES DE EUSKADI S.A.U ACERINOX CHILE, S.A. Santiago de Chile, Chile 7, % ACERINOX S.A KPMG ACERINOX COLOMBIA S.A.S Bogota, Colombia % ACERINOX S.A ACERINOX DEUTSCHLAND GMBH Langenfeld, Germany 45, % ACERINOX S.A KPMG ACERINOX EUROPA, S.A.U Algeciras, Spain 341, % ACERINOX S.A KPMG ACERINOX FRANCE S.A.S Paris, France 18, % ACERINOX S.A % INOXIDABLES DE EUSKADI S.A.U KPMG ACERINOX INDIA PVT LTD Mumbai, India % ACERINOX S.A Mehta Chokshi & Shah ACERINOX ITALIA S.R.L. Milan, Italy 78, % ACERINOX S.A Collegio Sindicale - Studio Revisori Associatti ACERINOX MALAYSIA SDN. BHD Johor, Malaysia 4, % ACERINOX S.C. MALAYSIA SDN. BHD KPMG ACERINOX METAL SANAYII VE TICARET Gumussuyu/Beyoglu, % ACERINOX S.A L.S. Turkey % INOXIDABLES DE EUSKADI S.A.U ACERINOX MIDDLE EAST DMCC (DUBAI) Dubai, United Arab Emirates % ACERINOX S.A Al Sharid Auditing and Management Consultancy ACERINOX PACIFIC LTD. Wanchai, Hong Kong 7, % ACERINOX S.A KPMG ACERINOX POLSKA, SP Z.O.O Warsaw, Poland 25, % ACERINOX S.A % INOXIDABLES DE EUSKADI S.A.U KPMG ACERINOX RUSSIA LLC Saint Petersburg, Russia % ACERINOX S.A % ACERINOX SCANDINAVIA AB ACERINOX SCANDINAVIA AB Malmo, Sweden 31, % ACERINOX S.A KPMG ACERINOX S.C. MALAYSIA SDN. BHD Johor, Malaysia 26, % ACERINOX S.A KPMG ACERINOX SHANGAI CO., LTD. Shanghai, China 1, % ACERINOX S.A Shanghai Shenzhou Dalong ACERINOX (SEA), PTE LTD. Singapore, Singapore % ACERINOX S.A KPMG ACERINOX U.K, LTD. Birmingham, United Kingdom 28, % ACERINOX S.A KPMG ACEROL - COMÉRCIO E INDÚSTRIA DE AÇOS INOXIDÁVEIS, UNIPESSOAL, LDA. Maia, Portugal 15, % ACERINOX S.A KPMG BAHRU STAINLESS, SDN. BHD Johor, Malaysia 171,769 67% ACERINOX S.A KPMG COLUMBUS STAINLESS (PTY) LTD. Middelburg, South Africa 279,615 76% ACERINOX S.A KPMG CORPORACIÓN ACERINOX PERU S.A.C Lima, Peru % ACERINOX S.A INOX RE, S.A. Luxembourg 1, % ACERINOX S.A KPMG INOXCENTER CANARIAS, S.A.U Telde (Gran Canaria), Spain % INOXCENTER KPMG INOXCENTER, S.L.U Barcelona, Spain 17, % ACERINOX S.A KPMG INOXFIL S.A. Igualada (Barcelona), Spain 6, % ROLDAN S.A KPMG INOXIDABLES DE EUSKADI S.A.U Vitoria, Spain 2, % ACERINOX EUROPA, S.A.U KPMG ACEROL - COMÉRCIO E INOXPLATE - COMÉRCIO DE PRODUCTOS Maia, Portugal 12, % INDÚSTRIA DE AÇOS DE AÇO INOXIDÁVEL, UNIPESSOAL, LDA. INOXIDÁVEIS, UNIPESSOAL, LDA. KPMG METALINOX BILBAO, S.A.U Galdácano (Vizcaya), Spain 3, % ACERINOX S.A KPMG NORTH AMERICAN STAINLESS INC. Kentucky, U.S.A. 545, % ACERINOX S.A KPMG NORTH AMERICAN STAINLESS CANADA, NORTH AMERICAN STAINLESS Canada 28, % INC INC. KPMG NORTH AMERICAN STAINLESS MEXICO NORTH AMERICAN STAINLESS Apodaca (N.L.), Mexico 18, % S.A. DE C.V. INC. KPMG NORTH AMERICAN STAINLESS FINANCIAL INVESTMENTS LTD. Kentucky, U.S.A % ACERINOX S.A ROLDAN S.A. Ponferrada, Spain 17, % ACERINOX S.A KPMG 2016 INTEREST COST (in % COUNTRY thousands of COMPANY HOLDING INVESTMENT OWNERSHIP ASSOCIATES Euros) BETINOKS PASLANMAZ ÇELIK A.S. Turkey % ACERINOX S.A Acerinox Group Page 32 of
36 The activities of the Group companies are as follows: Acerinox, S.A.: holding company of the Acerinox Group. The Company renders legal, accounting and advisory services to all the Group companies and carries out financing activities within the Group. Acerinox Europa, S.A.U.: manufacture and marketing of flat stainless steel products. North American Stainless, Inc.: manufacture and sale of flat and long stainless steel products. Columbus Stainless (PTY), Ltd.: manufacture and sale of flat stainless steel products. Bahru Stainless, Sdn, Bhd: cold rolling and sale of flat stainless steel products. Roldán, S.A.: manufacture and sale of long stainless steel products. Inoxfil, S.A.: manufacture and sale of stainless steel wire. Inox Re, S.A.: reinsurance company. North American Stainless Financial Investment, Inc.: rendering of foreign trade advisory services. Remaining companies: sale of stainless steel products. Acerinox Group Page 33 of
37 Investments in subsidiaries and associates in 2015 are as follows: FULLY CONSOLIDATED COMPANIES COUNTRY COST (in thousands of Euros) INTEREST 2015 % OWNERSHIP COMPANY HOLDING INVESTMENT AUDITORS ACERINOX (SCHWEIZ) A.G. Mellingen, Switzerland % ACERINOX S.A KPMG ACERINOX ARGENTINA S.A. Buenos Aires, Argentina % ACERINOX S.A Chinen, Morbelli y INOXIDABLES DE EUSKADI 13 10% asociados S.A.U ACERINOX AUSTRALASIA PTY. LTD. Sydney, Australia % ACERINOX S.A ACERINOX BENELUX S.A. - N.V. Brussels, Belgium % ACERINOX S.A KPMG % ACERINOX S.A ACX DO BRASIL REPRESENTAÇOES, LTDA Sao Paulo, Brazil INOXIDABLES DE EUSKADI % S.A.U ACERINOX CHILE, S.A. Santiago de Chile, Chile 7, % ACERINOX S.A KPMG ACERINOX COLOMBIA S.A.S Bogota, Colombia % ACERINOX S.A ACERINOX DEUTSCHLAND GMBH Langenfeld, Germany 45, % ACERINOX S.A KPMG ACERINOX EUROPA, S.A.U Algeciras, Spain 341, % ACERINOX S.A KPMG 18, % ACERINOX S.A ACERINOX FRANCE S.A.S Paris, France INOXIDABLES DE EUSKADI KPMG % S.A.U ACERINOX INDIA PVT LTD Mumbai, India % ACERINOX S.A Mehta Chokshi & Shah ACERINOX ITALIA S.R.L. Milan, Italy 78, % ACERINOX S.A Collegio Sindicale - Studio Revisori Associatti ACERINOX MALAYSIA SDN. BHD Johor, Malaysia 4, % ACERINOX S.C. MALAYSIA SDN. BHD KPMG % ACERINOX S.A ACERINOX METAL SANAYII VE TICARET L.S. Gumussuyu/Beyoglu, Turkey INOXIDABLES DE EUSKADI % S.A.U ACERINOX MIDDLE EAST DMCC (DUBAI) Dubai, United Arab Emirates % ACERINOX S.A Al Sharid Auditing and Management Consultancy ACERINOX NORWAY A.S Oslo, Norway % ACERINOX S.A ACERINOX PACIFIC LTD. Wanchai, Hong Kong 5, % ACERINOX S.A KPMG 25, % ACERINOX S.A ACERINOX POLSKA, SP Z.O.O Warsaw, Poland INOXIDABLES DE EUSKADI KPMG % S.A.U ACERINOX RUSSIA LLC Saint Petersburg, Russia % ACERINOX S.A % ACERINOX SCANDINAVIA AB ACERINOX SCANDINAVIA AB Malmo, Sweden 31, % ACERINOX S.A KPMG ACERINOX S.C. MALAYSIA SDN. BHD Johor, Malaysia 37, % ACERINOX S.A KPMG ACERINOX SHANGAI CO., LTD. Shanghai, China 6, % ACERINOX S.A Shanghai Shenzhou Dalong ACERINOX (SEA), PTE LTD. Singapore, Singapore % ACERINOX S.A KPMG ACERINOX U.K, LTD. Birmingham, United Kingdom 28, % ACERINOX S.A KPMG ACEROL - COMÉRCIO E INDÚSTRIA DE AÇOS INOXIDÁVEIS, UNIPESSOAL, LDA. Maia, Portugal 15, % ACERINOX S.A KPMG BAHRU STAINLESS, SDN. BHD Johor, Malaysia 171,769 67% ACERINOX S.A KPMG COLUMBUS STAINLESS (PTY) LTD. Middelburg, South Africa 279,615 76% ACERINOX S.A KPMG CORPORACIÓN ACERINOX PERU S.A.C Lima, Peru % ACERINOX S.A INOX RE, S.A. Luxembourg 1, % ACERINOX S.A KPMG INOXCENTER CANARIAS, S.A.U Telde (Gran Canaria), Spain % INOXCENTER KPMG INOXCENTER, S.L.U Barcelona, Spain 17, % ACERINOX S.A KPMG INOXFIL S.A. Igualada (Barcelona), Spain 6, % ROLDAN S.A KPMG INOXIDABLES DE EUSKADI S.A.U Vitoria, Spain 2, % ACERINOX EUROPA, S.A.U KPMG INOXPLATE - COMÉRCIO DE PRODUCTOS DE AÇO INOXIDÁVEL, UNIPESSOAL, LDA. Maia, Portugal 13, % ACEROL - COMÉRCIO E INDÚSTRIA DE AÇOS INOXIDÁVEIS, UNIPESSOAL, LDA. METALINOX BILBAO, S.A.U Galdácano (Vizcaya), Spain 3, % ACERINOX S.A KPMG NORTH AMERICAN STAINLESS INC. Kentucky, U.S.A. 545, % ACERINOX S.A KPMG NORTH AMERICAN STAINLESS CANADA, NORTH AMERICAN Canada 28, % INC STAINLESS INC. KPMG NORTH AMERICAN STAINLESS MEXICO S.A. NORTH AMERICAN Apodaca (N.L.), Mexico 18, % DE C.V. STAINLESS INC. KPMG NORTH AMERICAN STAINLESS FINANCIAL INVESTMENTS LTD. Kentucky, U.S.A % ACERINOX S.A ROLDAN S.A. Ponferrada, Spain 17, % ACERINOX S.A KPMG KPMG INTEREST 2015 ASSOCIATES COUNTRY COST (in thousands of Euros) % OWNERSHIP COMPANY HOLDING INVESTMENT BETINOKS PASLANMAZ ÇELIK A.S. Turkey % ACERINOX S.A Acerinox Group Page 34 of
38 5.2 Changes in the consolidated Group In 2016 the only significant change during the period was the liquidation of the Group company Acerinox Norway AS. The company was wholly owned by Acerinox, S.A. and acted as a commission agent for the Group company Acerinox Scandinavia AB, registered in Sweden, for sales in Norway. Acerinox Scandinavia has absorbed the personnel of the entity. This operation had a positive Euros 597 thousand impact on the Parent's results, which was derived from the repatriation of share capital and accumulated reserves. Conversely, this operation had a negative impact of Euros 290 thousand on consolidated profit due to accumulated exchange differences and this company's results until the liquidation date. The loss on the liquidation was recognised under finance costs in the consolidated income statement. During the year, a further 50 shares of the Group company Roldan, S.A. were also acquired from non-controlling shareholders for Euros 1 thousand, thereby raising the ownership interest held by Acerinox, S.A. to 99.77%. The only change in the consolidated Acerinox Group in 2015 was the acquisition in January of the remaining noncontrolling interest of 1.67% in the Spanish trading companies Inoxcenter, S.L.U. and Metalinox Bilbao, S.A.U., giving Acerinox, S.A. a 100% stake in these two companies. These shares were purchased for Euros 1,530 thousand. The Euros 1,241 thousand difference between the acquisition price and the carrying amount of the noncontrolling interest was taken to equity. 5.3 Capital increases and reductions In 2016 the Group company Acerinox Shanghai reduced its capital by Yuan 46,418 thousand, which is equivalent to Euros 6.2 million. This company is a wholly-owned investee of Acerinox, S.A. and its share capital at year end amounts to Yuan 19,331 thousand. The Group company Inoxplate Lda, a wholly owned investee of the Group company Acerol Ltda (both of which are located in Portugal), has reimbursed the supplementary contributions of Euros 900 thousand received from its parent. In 2015 the Parent, Acerinox, S.A., waived a loan granted to its wholly owned investee, the Group company Acerinox Pacific Ltd. This loan amounted to Euros 15.9 million. This loan was waived to redress the Company s equity balance. This transaction had no impact on the consolidated financial statements. In 2015 the Group company Inoxplate Lda, a wholly owned investee of the Group company Acerol Ltda (both of which are located in Portugal), reimbursed the supplementary contributions of Euros 1,100 thousand received from its parent. 5.4 Impairment of investments At 31 December 2016 and 2015 the Parent has analysed the recoverability of its investments in Group companies with indications of impairment to determine whether their carrying amount exceeds their recoverable amount. Following the analyses carried out, the Parent has only recognised impairment on its investment in Acerinox SC Malaysia Sdn. Bhd. The Parent has recognised impairment of Euros 10,792 thousand on its investment in Acerinox SC Malaysia Sdn. Bhd. because its recoverable amount, calculated on the basis of discounted expected cash flows, is less than its carrying amount. At 31 December 2016, this investment has been recorded in the individual annual accounts of Acerinox, S.A. at Euros 26,764 thousand, which is equal to its recoverable amount. During the year the Parent has reversed 2,205 thousand of portfolio impairment recognised in prior years on the investment in Acerinox Pacific, Ltd. This company's streamlined structure, attributable to its sole role as commission agent, and the waiving of the loan in 2015 have improved its prospects, thereby increasing its expected recoverable amount. The carrying amount of Acerinox, S.A.'s investment in this company is Euros 7,467 thousand. Acerinox Group Page 35 of
39 Impairment equal to the amount of the waived loan mentioned in the preceding note, Euros 15.9 million, was recognised in Details of the carrying amounts of investments in Group companies are included in note 5.1. This impairment does not have an impact on consolidated results as these companies are fully consolidated. NOTE 6 SEGMENT REPORTING As described below, the Group is organised internally into operating segments, which are strategic business units. The strategic business units have different products and services and are managed separately. Group management reviews internal reports for each unit at least monthly. The operating segments presented by the Group, associated with the types of products it sells, are as follows: Flat stainless steel products: slabs, flats, coils, plates, sheets, circles and flat bars. Long stainless steel products: bars, angles, wires and wire rod. Other: other stainless steel products not included in the previous segments. The unallocated segment reflects the activities of the holding company and activities that cannot be allocated to specific operating segments. Segment results, assets and liabilities include all items directly or indirectly attributable to a segment. No significant assets are shared between segments and, considering the importance of flat stainless steel products, any assets that could be attributed to both segments are assigned to the flat segment. Inter-segment sales prices are established in accordance with market commercial terms and conditions governing non-related third parties. A segment s performance is measured by its net pre-tax profit. The Group considers this information to be the most relevant in evaluating a segment against other comparable segments in the sector. Acerinox Group Page 36 of
40 6.1 Operating segments Segment results for the year ended 31 December 2016 are as follows: (Expressed in thousands of Euros) 2016 Flat products Long products Other Unallocated Adjustments Total Income statement Revenue 3,576, ,057 33,361 2, ,717 3,988,635 Inter-segment sales -136,409-8, ,717 0 Total revenues 3,439, ,749 33,361 2, ,988,635 Gross operating profit/loss 291,919 48,530 2,597-15, ,228 Amortisation -152,764-15, , ,792 Finance income 5, ,252 Finance costs -13, , ,383 Exchange gains/losses 3, , ,564 Profit/loss before tax 135,327 32,309 2,185-41, ,869 Income tax -63,890-11, , ,566 Consolidated profit/loss for the period 71,437 21,067 1,646-26, ,303 Attributable to: Non-controlling interests -13, ,017 Net profit/loss attributable to the Group 84,447 21,074 1,646-26, ,320 Balance sheet Segment assets 3,949, ,108 17, , ,455,048 Unallocated assets Total consolidated assets 3,949, ,108 17, , ,455,048 Segment liabilities 1,161,579 38,903 14,031 1,071,856 2,286,369 Unallocated liabilities 0 Total consolidated liabilities (excluding equity) 1,161,579 38,903 14,031 1,071, ,286,369 Property, plant and equipment 1,948, ,994 4,399 10, ,086,403 Investments in property, plant and equipment and intangible assets 168,162 4, ,877 Unassigned liabilities essentially comprise the Parent's financial debt. Acerinox Group Page 37 of
41 2015 figures are as follows: (Expressed in thousands of Euros) Flat products Long products 2015 Other Unallocated Adjustments Total Income statement Revenue 3,832, ,930 14,377 3, ,322 4,253,331 Inter-segment sales -167,667-11, ,322 0 Total revenues 3,664, ,275 14,377 3, ,253,331 Gross operating profit/loss 244,523 53,874 1,924-15, ,572 Amortisation and depreciation -146,878-16, ,684 Finance income 2, ,144 4,292 Finance costs -18, ,553-51,175 Exchange gains 1, ,891 Impairment of financial instruments Profit/loss before tax 83,790 37,361 1,599-45, ,896 Income tax -50,438-12, ,292-50,578 Consolidated profit/loss for the period 33,352 25,328 1,200-33, ,318 Attributable to: Non-controlling interests -16, ,573 Net profit/loss attributable to the Group 49,913 25,340 1,200-33, , % 29.22% 1.25% % 60.14% Balance sheet Segment assets 3,546, ,138 20, , ,125,672 Total consolidated assets 3,546, ,138 20, , ,125,672 Segment liabilities 1,010,393 42,775 16,185 1,033,015 2,102,368 Unallocated liabilities 0 Total consolidated liabilities (excluding equity) 1,010,393 42,775 16,185 1,033, ,102,368 Property, plant and equipment 1,873, ,499 4,750 10,754 2,025,856 Investments in property, plant and equipment and intangible assets 90,228 2, ,115 94,011 There are no significant balances that have not been reflected in cash flows other than amortisation and depreciation. Acerinox Group Page 38 of
42 6.2 Geographical segments Revenue from geographical segments is presented on the basis of customer location. Segment assets are determined by geographical location. Data relating to geographical segments in 2016 is presented below: (Expressed in thousands of Euros) Spain 2016 Rest of Europe Americas Africa Asia Other Total Revenue by destination of goods 414,601 1,045,211 1,826, , ,371 11,404 3,968,143 Segment assets by origin 910, ,722 1,767, , , ,455,048 Property, plant and equipment at origin 243,015 66, , , , ,086,403 Investments in property, plant and equipment and intangible assets at origin 43, ,767 12,046 10, , figures are as follows: (Expressed in thousands of Euros) 2015 Spain Rest of Europe Americas Africa Asia Other Total Revenue by destination of goods 423,273 1,181,103 1,927, , ,391 11,409 4,221,426 Segment assets by origin 994, ,355 1,449, , , ,125,672 Property, plant and equipment at origin 237,830 72, , , , ,025,856 Investments in property, plant and equipment and intangible assets at origin 32, ,060 6,497 22, ,011 The Group sells its products in over 80 countries across the five continents. The Group's sales in the following countries exceeded 5% of total consolidated sales in 2016 and 2015: United States; 37.83% (38.23% in 2015), Spain; 10.45% (10.13% in 2015) and Germany; 6.62% (7.28% in 2015). No single transaction with an external customer exceeded 10% of the Group s consolidated revenues for 2016 or Acerinox Group Page 39 of
43 NOTE 7 INTANGIBLE ASSETS Details of the main intangible assets and movement therein are shown below: (Expressed in thousands of Euros) COST Emission allowances Industrial property Computer software and other SUBTOTAL Goodwill Balance at 1 January ,022 24,312 24,236 55,570 69,124 Acquisitions 3, ,259 4,261 Transfers Disposals -1, ,184-3,010 Translation differences Balance at 31 December ,198 24,312 23,967 56,477 69,124 Acquisitions Transfers -8, ,963 Disposals Translation differences Balance at 31 December ,312 25,195 49,507 69,124 ACCUMULATED AMORTISATION AND IMPAIRMENT Emission allowances Industrial property Computer software and other SUBTOTAL Goodwill Balance at 1 January ,310 21,949 46,259 0 Charges Disposals 0 0-1,184-1,184 Translation differences Balance at 31 December ,310 20,986 45,296 0 Charges 0 0 1,239 1,239 Disposals Translation differences Balance at 31 December ,310 22,428 46,738 0 CARRYING AMOUNT Emission allowances Industrial property Computer software and other SUBTOTAL Goodwill Cost at 31 December ,022 24,312 24,236 55,570 69,124 Accumulated amortisation and impairment 0-24,310-21,949-46,259 Carrying amount at 31 December , ,287 9,311 69,124 Cost at 31 December ,198 24,312 23,967 56,477 69,124 Accumulated amortisation and impairment 0-24,310-20,986-45,296 Carrying amount at 31 December , ,981 11,181 69,124 Cost at 31 December ,312 25,195 49,507 69,124 Accumulated amortisation and impairment 0-24,310-22,428-46,738 Carrying amount at 31 December ,767 2,769 69,124 Amortisation for the year is shown under amortisation and depreciation in the income statement. The transfer of emission allowances amounting to Euros 8,198 thousand reflects their reclassification to inventories as established in the additional provision of Royal Decree 602/2016 of 2 December Detailed information on emission allowances is provided in Note 9.1. Acerinox Group Page 40 of
44 The research and development expenses incurred by the Group do not meet the criteria for capitalisation and are therefore recognised as expenses, by type, when they are incurred. Research and development and innovation (R&D&I) costs directly recognised as expenses for the year and taken to the income statement amount to Euros 15,642 thousand (Euros 16,488 thousand in 2015). At 31 December 2016 and 2015 the Group has not entered into any contracts to acquire intangible assets. 7.1 Goodwill impairment testing The Group estimates the recoverable amount of goodwill on an annual basis, or more frequently where there are indications of possible impairment. To this end, goodwill is allocated to the company's cash generating units that are expected to benefit from the synergies of a business combination. At 31 December 2016, goodwill totals Euros 69 million and mainly relates to the acquisition of a controlling interest in Columbus Stainless, Ltd. in This goodwill has been allocated to the Columbus cash-generating unit (CGU), which manufactures and sells flat products only. The recoverable amount of a CGU is determined based on its value in use. These calculations are based on cash flow projections from the financial budgets approved by management over a period of five years. Cash flows beyond this five-year period are extrapolated using the estimated growth rates indicated below. The growth rate does not exceed the average long-term growth rate for the business in which the CGU operates. Forecast volumes of sales and production are based on the current capacities of existing machinery and equipment. Management determined budgeted gross margins based on past experience and forecast market performance. The weighted average growth rates are consistent with the forecasts included in industry reports. The discount rates used are pre-tax values and reflect specific risks related to the relevant segments. Key assumptions such as exchange rates and raw material prices are extrapolated using highly conservative criteria, referring at all times to the most recent market values. In 2016 Columbus Stainless, Ltd improved significantly on the budgeted profit forecast for the year, posting a pretax profit of ZAR million (ZAR million in 2015). The Company is confident that the flows to perpetuity will materialise, mainly in terms of its use of production capacity and margins, while still applying prudent criteria to the growth rates (g) used. The growth rates have been calculated using estimated growth rates for the country and sector, and bearing in mind historical growth in the consumption of stainless steel. The key assumptions used to calculate value in use are as follows: Budgeted EBIT margin (*) 5.1% 5.5% Weighted average growth rate (**) 2.5% 2.5% Discount rate applied (***) 12.6% 11.7% (*) EBIT margin, considered equivalent to operating profit/loss (as a percentage of revenue) (**) Used to extrapolate cash flows beyond the budgeted period (***) Pre-tax discount rate applied The discount rate applied (weighted average cost of capital or WACC) is 12.6%. It is calculated taking as reference the interest rates on South African sovereign debt (ten-year swap on the South African Rand), a market risk premium of 5% and the capital structure of similar companies. When calculating the terminal value, repayments are considered equal to investments and the change in working capital is calculated as the value of the last projected year, 2021, which is understood to be consistent in the long term, increased by the growth rate (g). Acerinox Group Page 41 of
45 The growth rate (g) remains constant at 2.5%. In 2016 the global stainless steel market continued to consolidate the historical market growth rate of 5.9% for the period. Apparent consumption of stainless steel in the South African market has fallen by 8.5% in 2016 compared with 2015 (+1.9%), due to the weakness of the national economy, which is largely related to the temporary decline in the activity of the mining industry and its ancillary sector. Consequently, Columbus' volume of sales in the local market was lower. Nevertheless, the company succeeded in increasing its market share, despite greater pressure from imports. The aforementioned decline in local sales was more than offset by the rise in exports, resulting in an overall increase of 12.7% compared with Turnover grew by 15.3% (+1.5% in 2015). Production also increased, by 10%, during the year was a good year for Columbus Stainless, Ltd, but not without significant challenges. These included the aforementioned weakness of the local economy, the volatility of the South African Rand, the price of raw materials - with substantial growth towards the end of the year - and power cuts (at the end of August and beginning of September), with the consequent rise in costs and reduction in production capacity. Besides adequate management of the situation in the country, the increase in sales in strategic markets, the supply of semi-products to Bahru Stainless, Sdn Bhd, the Group's factory in Malaysia, and increased penetration in the Middle and Far East and Latin America have all contributed to this positive trend. The Company s budgets reflect these factors, as well as a gradual increase in sales to Bahru Stainless, Sdn Bhd as the Malaysian factory achieves higher utilisation of its present installed production capacity. Other relevant key assumptions are the Euro-Rand exchange rate (14.457) and the price of raw materials (10,500 USD/MT), which are established when drawing up the budget. Both assumptions are extrapolated applying very conservative criteria and are held constant over the period analysed. The variables used in 2015 were a Euro-Rand exchange rate of and a raw materials price of 11,000 USD/MT. The impairment test performed at 31 December 2016 shows that the recoverable amount exceeds the carrying amount by Euros 59 million (Euros 66 million in 2015). The discount rate (WACC), the growth rate (g) and the budgeted EBIT margin are considered key assumptions in the impairment test. Following a sensitivity analysis entailing different scenarios, impairment of the carrying amount would only occur by increasing the discount rate (WACC) by 18% (22.3% in 2015). In the case of the growth rate (g), even with a growth rate of 0%, the discount rate (WACC) would have to increase by 9.6% for the carrying amount to show impairment. The average budgeted EBIT margin would have to fall by 18.3% (22.5% in 2015) to 4.1% (4.2% in 2015), with the other two assumptions remaining constant, for impairment to occur. Acerinox Group Page 42 of
46 NOTE 8 PROPERTY, PLANT AND EQUIPMENT Details of property, plant and equipment and movement in 2016 and 2015 are shown in the following table: (In thousands of Euros) COST Land and buildings Technical installations and machinery Other property, plant and equipment Property, plant and equipment under construction TOTAL Balance at 31 December ,418 3,325,272 85, ,708 4,412,072 Additions 1,652 18,592 2,389 67,115 89,748 Impairment Transfers ,153 1,377-12, Disposals ,603-1, ,998 Translation differences 37, ,392 1,941 29, ,373 Balance at 31 December ,982 3,481,622 89, ,930 4,694,938 Additions 2,700 24,273 1, , ,103 Impairment Transfers 61, ,732 3, , Disposals -5,712-9,863-8, ,691 Translation differences 13, ,860 1,639 10, ,211 Balance at 31 December ,445 3,882,624 88, ,152 4,983,756 ACCUMULATED DEPRECIATION AND IMPAIRMENT Land and buildings Technical installations and machinery Other property, plant and equipment Property, plant and equipment under construction TOTAL Balance at 31 December ,419 2,070,615 78, ,440,553 Charges 16, ,236 5, ,079 Transfers -1,198-1,334 2, Disposals ,626-1, ,750 Translation differences 10,872 63,142 2, ,200 Balance at 31 December ,602 2,265,033 86, ,669,082 Charges 17, ,763 4, ,553 Transfers Disposals -3,234-5,224-8, ,583 Translation differences 5,334 69,355 1, ,301 Balance at 31 December ,779 2,475,879 84, ,897,353 CARRYING AMOUNT Land and buildings Technical installations and machinery Other property, plant and equipment Property, plant and equipment under construction TOTAL Cost at 31 December ,418 3,325,272 85, ,708 4,412,072 Accumulated depreciation and impairment -291,419-2,070,615-78, ,440,553 Carrying amount at 31 December ,999 1,254,657 7, ,708 1,971,519 Cost at 31 December ,982 3,481,622 89, ,930 4,694,938 Accumulated depreciation and impairment -317,602-2,265,033-86, ,669,082 Carrying amount at 31 December ,380 1,216,589 2, ,930 2,025,856 Cost at 31 December ,445 3,882,624 88, ,152 4,983,756 Accumulated depreciation and impairment -336,779-2,475,879-84, ,897,353 Carrying amount at 31 December ,666 1,406,745 3, ,152 2,086,403 Acerinox Group Page 43 of
47 Depreciation for the year is shown under amortisation and depreciation in the income statement. Investments Investments in property, plant and equipment and intangible assets for the year amounted to Euros 172,877 thousand. These included North American Stainless' Euros 106,738 thousand investment in a new cold-rolling mill and a bright annealing (BA) line and Acerinox Europa's Euros 39,377 thousand investment in a new mill and a fifth annealing and pickling line. In 2015 investments totalled Euros 94,009 thousand, including Euros 22,719 thousand made by Bahru Stainless, Euros 31,917 thousand by North American Steel and Euros 30,191 thousand by Acerinox Europa. Property, plant and equipment under construction Details of the investments classified under this heading are as follows: (In thousands of Euros) Buildings 35,039 64,890 Technical installations and machinery 123, ,586 Other property, plant and equipment 405 1,307 Advances ,147 TOTAL 159, ,930 During the period, on completion of the start-up period, phase II investments made by the Group company Bahru Stainless, Sdn Bhd were reclassified from work in progress to finished goods. The amount reclassified in this company is Euros 292 million. The start-up of these investments increased depreciation for the year by approximately Euros 1 million a month. Of the total amount recognised under this caption, Euros 114 million corresponds to the aforementioned investments made by North American Stainless, which are due to start up in Spring 2017 (Euros 25 million in 2015), and Euros 38 million to Acerinox Europa's investment, due to enter service at the end of 2017 (Euros 14 million in 2015). Additionally, in 2015 this caption included Euros 302 million in phase II investments of the Malaysian plant. Assets located outside Spain Details of assets located outside Spain are as follows: (In thousands of Euros) Cost Accumulated Accumulated Cost depreciation depreciation Land and buildings 595, , , ,232 Technical installations and machinery 2,750,284-1,441,893 2,356,807-1,256,454 Other property, plant and equipment 42,439-39,953 43,700-42,334 Property, plant and equipment under construction 118, ,771 0 TOTAL 3,507,191-1,663,802 3,249,046-1,461,020 Changes in accounting estimates Estimated useful lives remained unchanged in 2016 and Acerinox Group Page 44 of
48 Guarantees At 31 December 2016 and 2015 none of the Group s assets has been pledged to secure loans and borrowings. Commitments At 31 December 2016 the Group has entered into contracts to purchase new equipment and facilities amounting to Euros 127,034 thousand, of which Euros 26,686 thousand is for the new investments by North American Stainless, Euros 92,412 thousand for Acerinox Europa and Euros 4,783 thousand for investments in the new Malaysian plant. At 31 December 2015 the Group had entered into contracts to purchase new equipment and facilities amounting to Euros 154,781 thousand, of which Euros 62,622 thousand was for new investments by North American Stainless, Euros 78,865 thousand for Acerinox Europa and Euros 11,508 thousand for investments in the new Malaysian plant. Capitalised borrowing costs Borrowing costs of Euros 2,317 thousand have been capitalised in 2016 (Euros 7,377 thousand in 2015). The capitalisation rate in 2016 was 4.23% (3.85% in 2015). Asset disposals A loss of Euros 516 thousand on the sale of property, plant and equipment or removal of assets from service has been recorded under other operating expenses in the 2016 income statement (Euros 332 thousand in 2015). The gain on the sale of property, plant and equipment or the removal of assets from service totals Euros 3,239 thousand and is recognised under other operating income in the 2016 income statement (Euros 517 thousand in 2015). This balance primarily reflects the disposals of investment property referred to in the corresponding note. Environment Property, plant and equipment held to minimise the environmental impact of the Group s activities and to protect and improve the environment at 31 December 2016 and 2015 are as follows: (In thousands of Euros) Nature and use Gross value Accumulated Accumulated Gross value depreciation depreciation Water treatment 95,906-58,705 90,759-51,025 Acid neutralisation 57,331-36,767 41,789-25,181 Gas emission treatment 74,619-62,314 75,210-62,434 Automatic additions systems 8,608-5,878 8,459-5,585 Other items 115,196-75, ,346-76,261 Total 351, , , ,486 During 2016 the Group has received energy saving grants totalling Euros 406 thousand. In 2015 the Group received no grants for investment in infrastructure aimed at protecting the environment. In 2016 the Group incurred environment-related ordinary expenses of Euros 105,611 thousand (Euros 109,674 thousand in 2015). At 31 December 2016 and 2015 no significant contingencies exist relating to the protection and improvement of the environment and, accordingly, no provision has been made in this regard. Acerinox Group Page 45 of
49 Property, plant and equipment not used in ordinary activities Group property, plant and equipment not used in ordinary activities include several industrial bays, which are classified as investment property. Details and the valuation of this property are provided in the corresponding section. One of the production lines of the Group company Columbus Stainless (Pty) Ltd. ceased to be used for production in 2015 given its age and low productivity. Its carrying amount was Euros 200 thousand, which the Group impaired in full. Other information At 31 December 2016 and 2015 there are no litigation cases, seizures or similar measures that may affect items of property, plant or equipment. The Group's companies have taken out insurance policies to cover the risk of damage to their property, plant and equipment. The coverage of these policies is considered sufficient. Investment property Investment property includes Group-owned buildings not occupied by the Group which are held to earn a return, either through rentals or through capital appreciation and subsequent disposal of the buildings. Details of movements in investment property in 2016 and 2015 are as follows: (In thousands of Euros) COST Opening balance 16,714 12,610 Transfers 12,404 4,427 Disposals -5, Impairment -570 Translation differences -605 Balance at 31 December 22,417 16,714 ACCUMULATED DEPRECIATION AND IMPAIRMENT Opening balance 6,053 5,677 Charge Transfers 1, Disposals -3, Translation differences -60 Cost at 31 December 4,181 6,053 CARRYING AMOUNT Cost at 31 December 22,417 16,714 Accumulated depreciation -4,181-6,053 Carrying amount at 31 December 18,236 10,661 The Group currently has several industrial bays in Spain and other countries belonging to various subsidiaries which are classified as investment property. These are industrial bays which were used to carry out commercial activity but are currently idle, and the Group thus intends to rent or sell them. Acerinox Group Page 46 of
50 During the year, an industrial bay belonging to the Group company Acerinox Italia, with a carrying amount of Euros 11.3 million, was transferred to this category. In 2015, an industrial bay belonging to the Group company Acerinox UK and amounting to Euros 4,024 thousand was reclassified to this category. Income from the lease of industrial bays amounted to Euros 378 thousand in 2016 (Euros 150 thousand in 2015). The associated operating expenses, including maintenance and repairs, amount to Euros 94 thousand (Euros 53 thousand in 2015). The increase on the prior year is because the Group has leased its industrial bays in the UK and Italy. During the year the Group disposed of two of its industrial bays classified as investment property, generating a profit of Euros 2.9 million. The carrying amount of these bays totalled Euros 2,382 thousand. In 2015, two industrial bays classified in this category with a net carrying amount of Euros 130 thousand were also sold. Proceeds from the sale totalled Euros 545 thousand, on which the Group recognised a capital gain of Euros 411 thousand under other operating income in the income statement. At 31 December 2016 investment property has a total market value of Euros 23,329 thousand (Euros 20,055 thousand in 2015) and a carrying amount of Euros 18,236 thousand (Euros 10,661 thousand in 2015). One of the Group's industrial bays showed indications of impairment, so the Group requested an independent expert appraisal. Based on the appraisal, the Group has recognised impairment of Euros 570 thousand under other operating expenses in the income statement In 2015, it was not necessary to recognise any impairment for the Group's investment property. 8.1 Impairment As established in IAS 36, and as mentioned in the accounting policies (note 2.8), the Group assesses whether there are any indications of impairment of the assets at each year end. The value of an asset is impaired when its carrying amount exceeds its recoverable amount. The Group considers that indications of impairment exist when, among other things, a company has incurred repeated losses. During the year there have been indications of impairment in the companies Bahru Stainless Sdn. Bhd., Roldan, S.A., Inoxfil S.A. and Acerinox S.C. Malaysia Sdn. Bhd. As detailed below, the results of this analysis do not indicate a need to make any valuation adjustments to the assets Property, plant and equipment and intangible assets represent 48% of the Group s assets. A breakdown by company shows that 94% of the Group s property, plant and equipment and intangible assets are located in the factories, with the remaining 6% held by its 33 other subsidiaries. Subsidiaries % Property, Plant and Equipment ACERINOX EUROPA, S.A.U 8.81% ROLDAN, S.A. 0.88% INOXFIL, S.A. 0.17% NORTH AMERICAN STAINLESS INC % COLOMBUS STAINLESS PTY Ltd 6.98% BAHRU STAINLESS 35.25% Rest of subsidiaries 6.22% TOTAL % The majority of assets do not generate cash inflows independently, as the whole production process needs to be completed. Impairment has therefore not been estimated on an individual basis, but by allocating the assets to cash-generating units. In the case of plants, the smallest cash-generating units that can be considered encompass each plant as a whole. Acerinox Group Page 47 of
51 The recoverable amount of the items has been determined based on their value in use. Value in use of the assets of Bahru Stainless Sdn. Bhd., Roldan, S.A., Inoxfil S.A. and Acerinox S.C. Malaysia Sdn. Bhd was determined based on the estimated future cash flows the entity expects to obtain from the asset and the discount rate, understood to be the weighted average cost of capital (WACC). The following points were taken into consideration when calculating the discount rate: 1. The financing structure or gearing is considered based on market participant assumptions. 2. The cost of debt is obtained using the applicable market risk-free rate plus a spread of 2%. 3. The risk-free rate is based on that applied to ten-year bonds. 4. The risk premium has been estimated at 5%. Future cash flows were estimated considering: a) Reasonable assumptions and management s best estimate of the economic conditions that will exist over the remaining useful life of the asset, based on information available at the analysis date. b) Five-year projections that reflect the financial and macroeconomic circumstances and those of the stainless steel market itself, adapted to the operating environment of each CGU analysed. The different parameters used (expected growth, use of installed production capacity, prices, working capital items, etc.) are therefore projected considering historical figures, particularly the last year closed, as well as targets set by management. Key assumptions such as exchange rates and raw material prices are extrapolated using highly conservative criteria, referring at all times to the most recent market values at the time of the study. The Company is confident that the flows to perpetuity will materialise, mainly in terms of its use of production capacity and margins, while still applying prudent criteria to the growth rate (g). Estimated growth rates for the country and industry in which each CGU is present have been used, in addition to those for the markets to which most of their output is exported. c) Estimated projections for years beyond the period covered have been calculated by extrapolating the previous projections using a growth rate of 2.5% in the case of Bahru Stainless Sdn. Bhd and 2% for Roldán, S.A., Inoxfil, S.A. and Acerinox S.C. Malaysia Sdn. Bhd. It should be noted that in 2016 the global stainless steel market continued to consolidate the historical market growth rate of 5.9% for the period. No impairment has been recognised on property, plant and equipment during the year (with the exception of that mentioned in the note on investment property), as the enterprise value, calculated applying the discounted free cash flow method, exceeds the carrying amount of the Group s operating assets. Bahru Stainless Sdn. Bhd The impairment test performed at 31 December 2016 reveals that its recoverable amount exceeds its carrying amount (Euros million) by Euros million (Euros 175 million in 2015). The discount rate (WACC), 8.75% (8.81% in 2015) the growth rate (g), 2.5% (2.5% in 2015) and the average budgeted EBIT margin, 3.0% (3.4% in 2015) were considered key assumptions in the impairment test. Following a sensitivity analysis entailing different scenarios, impairment of the carrying amount would only occur by increasing the discount rate (WACC) by 17.1% (24.5% in 2015). In the case of the growth rate (g), the growth rate would have to fall by 83% (reducing the investment in the company to zero, with the WACC at 4.3% in 2015) for the carrying amount to begin to show impairment. The average budgeted EBIT margin would have to fall by 22.9% (30.5% in 2015) to 2.3%(2.4% in 2015), with the other two assumptions remaining constant, for impairment to occur. Acerinox Group Page 48 of
52 Roldán, S.A. The impairment test performed at 31 December 2016 reveals that its recoverable amount exceeds its carrying amount (Euros 42.1 million) by Euros million (Euros 147 million in 2015). The discount rate (WACC), 7.31% (7.12% in 2015) the growth rate (g), 2% (2% in 2015) and the average budgeted EBIT margin, 3.9% (4.5% in 2015) were considered key assumptions in the impairment test. According to the sensitivity analysis performed, impairment of the carrying amount would only occur by increasing the discount rate (WACC) by 2.1 times (2.7 times in 2015), while simultaneously bringing the growth rate (g) down to zero. The average budgeted EBIT margin would have to fall by 62.4% (72.4% in 2015) to 1.4% (1.2% in 2015), with the other two assumptions remaining constant, for impairment to occur. Inoxfil, S.A. The impairment test performed at 31 December 2016 reveals that its recoverable amount exceeds its carrying amount (Euros 9.2 million) by Euros 6 million (Euros 7 million in 2015). The discount rate (WACC), 7.31% (7.12% in 2015) the growth rate (g), 2% (2% in 2015) and the average budgeted EBIT margin, 2.4% (2.7% in 2015) were considered key assumptions in the impairment test. The sensitivity analysis performed indicates that impairment of the carrying amount would only occur by increasing the discount rate (WACC) by 54% (51.4% in 2015). In the case of the growth rate (g), even with a growth rate of 0%, the discount rate (WACC) would have to increase by 45.3% (43.9% in 2015) for the carrying amount to begin to show impairment. The average budgeted EBIT margin would have to fall by 38.0% (38.9% in 2015) to 1.5% (1.6% in 2015), with the other two assumptions remaining constant, for impairment to occur. Acerinox S.C. Malaysia Sdn. Bhd. The impairment test performed at 31 December 2016 reveals that its recoverable amount exceeds its carrying amount (Euros 11.2 million) by Euros 32 million. The discount rate (WACC), 8.68%, the growth rate (g), 2%, and the average budgeted EBIT margin, 6.0%, were considered key assumptions in the impairment test According to the sensitivity analysis performed, impairment of the carrying amount would only occur by increasing the discount rate (WACC) by 2.5 times, while simultaneously bringing the growth rate (g) down to zero. The average budgeted EBIT margin would have to fall 68.1% to 1.9%, with the other two assumptions remaining constant, for impairment to occur. NOTE 9 INVENTORIES Details at 31 December are as follows: (In thousands of Euros) 2, Raw materials and other supplies 298, ,937 Work in progress 170, ,405 Finished goods 385, ,565 By-products, waste and recoverable materials 33,444 18,774 Advances TOTAL 887, ,929 Acerinox Group Page 49 of
53 Raw materials and other suppliers include Euros 8,357 thousand reflecting the valuation of the emission allowances held by the Group at the end of the year. In 2015 emission allowances were included in intangible assets. The cost of goods sold is Euros 3,600 million in 2016 (Euros 3,894 million in 2015). In 2016 the Group wrote inventories down to net realisable value where this was lower than cost, with a total adjustment of Euros 1,188 thousand. The adjustment for 2015 amounted to Euros 14,248 thousand. At 31 December 2016, the Group company Columbus Stainless has pledged inventories as collateral for the financing obtained through the Borrowing Base Facility described in note Commitments At 31 December 2016 the consolidated Group has commitments to purchase raw materials for Euros 243,080 thousand (Euros 129,143 thousand in 2015). Although no firm sales commitments exist at these reporting dates, there are formal orders for which the Group does not foresee any circumstances that could prevent delivery by the agreed deadlines. The Group does not have any inventories with a cycle exceeding one year and therefore no borrowing costs have been capitalised. Group companies have taken out insurance policies to cover the risk of damage to their inventories. The coverage of these policies is considered sufficient. 9.1 Emission allowances Pursuant to the additional provision of Royal Decree 602/2016 of 2 December 2016, on 1 January 2016 the Group reclassified emission allowances to inventories. On 15 November 2013 the Spanish Cabinet approved Acerinox Europa, S.A.U. s definitive allocation of free-ofcharge greenhouse gas emission allowances for the period, 1,867,754 allowances in total, which are distributed by year as follows: The following allowances were allocated to the Group company Roldan, S.A.: Movement in emission allowances in 2016 and 2015 is as follows: Number of allowances Value (in thousands of Euros) Balance at 31/12/ ,211 7,022 Allocation for the year 266,158 1,860 Acquisition of emission allowances through swaps 153,284 1,142 Disposal of emission allowances Disposals -231,405-1,824 Balance at 31/12/2015 1,062,999 8,198 Allocation for the year 261,260 2,101 Disposals -254,349-1,942 Balance at 31/12/2016 1,069,910 8,357 Acerinox Group Page 50 of
54 In 2016, CO 2 emissions were made requiring 258,406 allowances, which will be surrendered in 2017 (254,349 in 2015, surrendered in 2016). The Group has not sold its surplus allowances. The expense for the year in respect of CO 2 emissions totals Euros 2,010 thousand in 2016 (Euros 1,937 thousand in 2015) and is included under other operating expenses. This is the value of the allowances surrendered in the year, equivalent to the market value of these allowances when allocated. Disposals for the year are allowances surrendered for CO 2 emissions in the prior year. This information has been audited and approved by an independent expert. Present conditions pose no significant risk of a shortfall in emission allowances for the period. The Group does not hold any futures contracts for the acquisition of emission allowances. At 31 December 2016 the emission allowances held have a fair value of Euros 6,997 thousand (Euros 8,748 thousand at 31 December 2015). The Group company Acerinox Europa carried out a swap of emission allowances whereby Acerinox sold 249 emission allowances for Euros 2 thousand and simultaneously acquired 153,284 emission reduction units (ERUs) for that same amount. It then exchanged the 153,284 ERUs for the same number of emission allowances (EUAs), recognising the new allowances at their fair value at the date of the swap (Euros 1,142 thousand). No significant contingency exists in respect of fines over emissions. NOTE 10 FINANCIAL INSTRUMENTS 10.1 General considerations A financial instrument is a contract that gives rise to a financial asset in one company and, simultaneously, a financial liability or an equity instrument in another company. The Group recognises a financial instrument in its balance sheet when it becomes party to the contract or legal transaction. Acerinox Group Page 51 of
55 10.2 Categories of financial assets and financial liabilities At year end the Group s financial assets are as shown below: (In thousands of Euros) Classes Non-current financial instruments Current financial instruments Equity instruments Debt securities Loans, derivatives and other Equity instruments Debt securities Loans, derivatives and other Categories 2,016 2,015 2,016 2,015 2,016 2,015 2,016 2,015 2,016 2,015 2,016 2,015 Loans and receivables 5,317 2, , ,893 Held-to-maturity investments Assets available for sale - At fair value 12,330 10,382 - At cost Assets at fair value through profit or loss - Held for trading 21, Other Hedging derivatives 2,529 9,375 5,019 15,338 TOTAL 12,618 10, ,846 11, , ,864 Acerinox Group Page 52 of
56 At year end the Group s financial liabilities are as shown below: (In thousands of Euros) Classes Non-current financial instruments Current financial instruments Loans and borrowings Bonds and other marketable securities Derivatives and other Loans and borrowings Bonds and other marketable securities Derivatives and other Categories 2,016 2,015 2,016 2,015 2,016 2,015 2,016 2,015 2,016 2,015 2,016 2,015 Debts and payables 812, , , ,931 2,339 2, , ,887 1,653 1, , ,726 Liabilities at fair value through profit or loss - Held for trading 4,805 14,072 - Other Hedging derivatives 481 3,992 1, TOTAL 812, , , ,931 2,820 6, , ,887 1,653 1, , ,143 Acerinox Group Page 53 of
57 Trade and other receivables Details at 31 December are as follows: (In thousands of Euros) Trade receivables 527, ,537 Personnel Public entities 35,478 23,356 Other receivables 6,858 8,011 Prepayments 8,988 8,909 Impairment of bad debts -7,260-9,815 TOTAL 572, ,367 Impairment of bad debts corresponds entirely to trade receivables. Movements in this account are as follows: (In thousands of Euros) Initial balance 9,815 10,847 Charge Application -2,869-1,150 Reversal Translation differences Balance at 31 December 7,260 9,815 Impairment losses due to bad debts have been included under other operating expenses in the income statement. No interest was accrued on impaired financial assets in 2016 or No allowances have been made for bad debts with related parties in 2016 or At 31 December 2016 certain Group companies had receivables factored without recourse totalling Euros 134,734 thousand with financial institutions in exchange for cash. This amount was equal to 85%-90% of the total amount of the factored invoices, depending on the conditions of the credit insurance coverage (Euros 99,912 thousand in 2015). These amounts have been derecognised as they meet the conditions specified in IAS 39 regarding the transfer of risks and rewards. At 31 December 2016, the Group company Columbus Stainless has pledged receivables as collateral for the financing obtained through the Borrowing Base Facility described in note Trade and other payables Details at 31 December 2016 and 2015 are as follows: (In thousands of Euros) Suppliers and trade payables 715, ,929 Personnel 27,912 24,712 Suppliers of fixed assets 29,137 21,174 Tax and Social Security 23,204 21,482 Other payables Current provisions 7,093 4,721 TOTAL 803, ,726 Acerinox Group Page 54 of
58 In compliance with the disclosure requirements of the Spanish Accounting and Auditing Institute (ICAC) resolution of 29 January 2016, the average payment period for suppliers of the Spanish companies in the Acerinox Group, having eliminated the payments made to Group companies, is as follows: Average payment period for suppliers 73 days 79 days Transactions paid ratio 77 days 82 days Transactions payable ratio 49 days 45 days (Expressed in thousands of Euros) Amount Amount Total payments made 1,227,213 1,607,137 Total payments outstanding 226, ,420 The following table includes payments made to any supplier, whether domestic or foreign, and excludes Group companies. Payments to domestic suppliers, excluding Group companies, are as follows: Days Days Average payment period to suppliers 66 days 68 days Payments made ratio 69 days 70 days Outstanding payments ratio 51 days 54 days Amount Amount Total payments made 631, ,109 Total outstanding payments 104,260 82, Loans and borrowings and bond issues Details of financial debt at 31 December 2016 and 2015, including loans and borrowings and bonds issued by the Group during the year, are as follows: (In thousands of Euros) Non-current Current Bonds issued 124, ,931 1,653 1,653 Loans and borrowings 812, , , ,887 Total financial debt 936, , , ,540 Details of the maturity of outstanding debt at 31 December 2016 are as follows: (In thousands of Euros) and subsequent TOTAL years Financial debt 281, , , , ,170 1,218,419 Total financial debt 281, , , , ,170 1,218,419 Acerinox Group Page 55 of
59 2015 figures are as follows: (In thousands of Euros) and subsequent TOTAL years Financial debt 449, , ,762 8,957 79,478 1,190,701 Total financial debt 449, , ,762 8,957 79,478 1,190,701 Debt by currency is as follows: (In thousands of Euros) Non-current loans Current loans EUR 878, , , ,684 USD 58, ,155 54, ,820 ZAR 42,403 69,022 MYR 14 TOTAL 936, , , ,540 Details of debt by interest rate are as follows: (In thousands of Euros) Non-current loans Current loans Fixed 230, ,200 18,200 Variable 706, , , ,340 TOTAL 936, , , ,540 Borrowings at fixed interest rates reflect only loans originally arranged at fixed rates with credit institutions, and do not include borrowings for which interest rates have been fixed by contracting derivatives. As the majority of bank debt was extended at variable interest rates, its fair value is the same as its amortised cost. Nevertheless, the fair value of fixed-rate loans and borrowings and private placements is Euros 240,910 thousand at 31 December The fair value of these borrowings at 31 December 2015 was Euros 235,885 thousand. Variable interest rates on loans are reviewed at least once a year. At 2016 year end the Group s Euro-denominated financing instruments, Euros 982 million in total, have a weighted average cost, before hedging, of 1.90%, while the average pre-hedging cost of borrowings in US Dollars, amounting to US Dollars 94 million, is 2.43%. In 2015, the Group s Euro-denominated borrowings, Euros 814 million in total, bore an average cost of 2.11%, before hedging, while the average cost of borrowings in US Dollars, amounting to US Dollars 334 million, was 2.33%. The Group has arranged interest rate swaps whereby it can exchange the variable interest rates on its borrowings for fixed interest rates, as described in note At 31 December 2016 accrued interest payable in respect of loans and borrowings totals Euros 2,415 thousand (Euros 2,266 thousand in 2015). In addition, accrued interest payable on bonds issued totals Euros 1,653 thousand at the 2016 and 2015 reporting dates. Total borrowing costs calculated using the effective interest rate on loans at amortised cost amount to Euros 2,253 thousand (Euros 2,243 thousand in 2015). Acerinox Group Page 56 of
60 At 31 December 2016 the Group has credit facilities with financial institutions with a maximum available limit of Euros 1,819 million, of which Euros 1,218 million was drawn down. In 2015 the maximum available limit was Euros 1,788 million, of which Euros 1,191 million had been drawn down. Certain Group companies have contracted reverse factoring facilities with various financial institutions to manage payments to suppliers. Trade payables settled under the management of financial institutions are recognised under trade and other payables until they are settled or repaid or have expired. The most notable financing operation during 2016 has been the restructuring of the maturities of the majority of Acerinox, S.A.'s bilateral loans. In April and May 2016 the Parent signed 12 bilateral loan contracts for terms of four and five years, thus extending the due date for repayment and lowering margins. The 12 financial institutions with which Acerinox S.A. signed these agreements are Banco Santander, Banco de Sabadell, Banco Popular, Bankia, Kutxabank, CaixaBank, Abanca, Unicaja, Banca March, Banco Cooperativo, Liberbank and Bankinter. The loans arranged total Euros 717 million. Given the resulting variations, the Group has for the most part recognised the effects of these new agreements as if they were new loans, and has therefore simultaneously recognised the cancellation and the new loans. Moreover, on 30 June Acerinox S.A. repaid early the syndicated loan arranged in the United States in January The outstanding balance of this loan at the date of early repayment was US Dollars million. This loan originally fell due on 17 February In April 2015, Columbus Stainless Ltd signed a financing agreement (a Borrowing Base Facility) for ZAR 3,500 million with ten financial institutions. Through this transaction, some inventories (raw materials, work in progress and finished products) and some trade receivables are pledged as collateral for this financing. The amount of financing available through this contract primarily depends on Columbus s current assets at any given time. Inventories and receivables extended as collateral at 31 December 2016, which determine total financing available at that date, amount to ZAR 2,596 million (ZAR 1,674 million in receivables and ZAR 922 million in inventories). The amount drawn down at 31 December 2016 amounted to ZAR 613 million, equivalent to Euros 42 million (ZAR 1,170 million at 31 December 2015, equivalent to Euros 69 million). This contract provides Columbus with financing of its working capital for a three-year period. Deutsche Bank AG, Amsterdam Branch, acted as the Co-ordinating Mandated Lead Arranger for this transaction, whilst Deutsche Bank AG, Johannesburg Branch, Bankinter, Banco Bilbao Vizcaya Argentaria, S.A., and FirstRand Bank Limited were the Mandated Lead Arrangers. Other participating banks included Banco Santander S.A., Banco de Sabadell S.A., London Branch, Nedbank Limited, CaixaBank, S.A., HSBC Bank Plc, Johannesburg Branch and Investec Bank Limited. In order to diversify the sources of its financing and extend its debt maturities, in July 2014 the Group filed a base prospectus for the issuance of fixed-income securities of Acerinox S.A. for a maximum notional amount of Euros 500 million at the Spanish National Securities Market Commission. Since then, Acerinox S.A. has carried out two issues through this prospectus: the first issue of Euros 75 million was placed by Deutsche Bank AG, London Branch in July 2014 with a term of ten years and interest of 5%, whilst the second was placed by Banco Bilbao Vizcaya Argentaria, S.A. for a total of Euros 50 million in December 2014 with a term of four years and variable interest of 3-month Euribor %. The Acerinox Group has satisfactorily met the repayment schedules for its financial debt. Non-current borrowings subject to covenants At the 2016 reporting date there are three financing contracts subject to covenants: the two loan contracts signed with the ICO (Spain s Official Credit Institute) in 2007 and 2008 and the Borrowing Base Facility arranged by Columbus in None of the 12 loan contracts signed in the first half of 2016, mentioned earlier, are subject to covenants. The most significant of the financial ratios stipulated in these loan agreements refer to maintenance of minimum equity levels in the case of Columbus, and to net financial debt/ebitda, and net financial debt/equity" ratios in the case of the ICO. At year end, the outstanding amount repayable on the two ICO loans was Euros 32 million and USD million. Final maturity on the first loan is May 2017, and on the second, July In the case of the Columbus Borrowing Base Facility, the amount repayable at year end is ZAR 613 million. Acerinox Group Page 57 of
61 During 2016 the Acerinox Group reached an agreement with Banco Santander and OeKB (Austrian export credit agency) to amend the loan in order to eliminate compliance with the covenants attached. The syndicated loan signed in 2012 with a group of financial institutions in the United States was repaid early on 30 June 2016, and the covenants attached were thus eliminated. Finally, on 30 December 2016 the loan extended by Deutsche Bank and JBIC (Japan Bank for International Cooperation) was repaid early, and compliance with the covenants attached was thus eliminated. This loan originally fell due in July At the 2016 year end (as in 2015) Acerinox, S.A. and Columbus Stainless Ltd comply with the ratios required under the three contracts mentioned above Determination of fair value As established in the accounting policies, the Group measures available-for-sale financial assets and derivative financial instruments at fair value. Financial instruments measured at fair value are classified based on valuation inputs into the following levels: LEVEL 1: quoted prices in active markets LEVEL 2: observable market variables other than quoted prices LEVEL 3: unobservable market variables Details at 31 December 2016 and 2015 are as follows: (In thousands of Euros) LEVEL 1 LEVEL 2 LEVEL 3 LEVEL 1 LEVEL 2 LEVEL 3 Available-for-sale financial assets 12,330 10,382 Financial derivatives (assets) 29,080 25,346 TOTAL 12,330 29, ,382 25,346 0 LEVEL 1 LEVEL 2 LEVEL 3 LEVEL 1 LEVEL 2 LEVEL 3 Financial derivatives (liabilities) 6,692 18,409 TOTAL 0 6, ,409 0 No financial assets or financial liabilities at fair value have been transferred between levels. In the case of Level 2 financial instruments, the Group uses generally accepted valuation techniques that take into account spot and future exchange rates at the valuation date, forward interest rates, interest rate spreads and credit risk of both the Group and its counterparty, i.e. the financial institution with which it operates Available-for-sale financial assets Available-for-sale financial assets total Euros 12,618 thousand at year end, of which Euros 12,330 thousand reflects Acerinox's investment in the Japanese Nisshin Steel Holding Co. Limited., which is listed on the Tokyo Stock Exchange. The quotation value was JPY 1,441 per share at 31 December 2016 (JPY 1,289 per share at 2015 year end). Acerinox holds 1,052,600 shares in this company, representing a percentage ownership of 0.96% (0.96% in 2015). As Nisshin Steel holds a 15.49% interest in Acerinox, this is a strategic investment that Acerinox has no intention of selling. Nisshin Steel not only holds a significant interest in Acerinox, S.A. but is also Acerinox s partner in Bahru Stainless, Sdn. Bhd, which is the Group s fourth flat product stainless steel factory. Acerinox Group Page 58 of
62 Acerinox has not purchased or sold any shares in Nisshin Steel Holding Co. Limited in 2016 or In 2016 and 2015 the Group recognised the variation in the fair value of assets classified in this category in reserves. The revaluation amounted to Euros 1,948 thousand in 2016 (Euros 1,991 thousand in 2015). Also in 2015, the Group company Acerinox Europa acquired a non-controlling interest of 7.36% in Fortia Energía, S.L., whose statutory activity is the acquisition of electricity on behalf of its shareholders, for Euros 275 thousand. The Group's Spanish factories can obtain more competitive electricity prices as a result of this investment Derivative financial instruments As detailed in note 4 in relation to market risk, in its activities the Group is essentially exposed to three types of risk: currency risk, interest rate risk and risk of changes in prices of raw materials. The Group uses derivative financial instruments to hedge its exposure to certain risks. The Group classifies derivative financial instruments that do not qualify for hedge accounting as financial instruments at fair value through profit or loss. Those that qualify as hedging instruments are classified as hedging derivatives and are recognised applying the measurement criteria defined in note Derivative financial instruments classified by category are as follows: (In thousands of Euros) Assets Liabilities Assets Liabilities Hedging derivatives 7,548 1,887 24,713 4,337 Derivatives at fair value through profit or loss 21,532 4, ,072 TOTAL 29,080 6,692 25,346 18,409 A breakdown of the Group s financial derivatives at 31 December 2016 and 2015 by type of hedged risk is as follows: (In thousands of Euros) Assets Liabilities Assets Liabilities Exchange rate insurance 23,853 4, ,170 Interest rate swaps 26 1, ,239 Cross-currency swaps 5, ,652 TOTAL 29,080 6,692 25,346 18,409 The reduction in cross currency swaps is mainly due to the early cancellation of the derivative financial instrument associated with the syndicated loan, as mentioned in note On 30 June 2016, Acerinox, S.A. cancelled early the derivative arranged in January 2012 with four financial institutions to cover the currency and interest rate risk of the syndicated loan signed in the United States. The cancellation cost recognised in profit and loss was Euros 957 thousand. This amount is shown under finance costs. Currency risk The Group operates in a large number of countries and bills customers in different currencies, depending on the country where it is billing. Therefore it uses certain financial instruments to hedge cash flow risks related to the settlement of balances in foreign currencies. The contracted operations mainly comprise forward sales and purchases in foreign currencies. Acerinox Group Page 59 of
63 Derivatives of this nature do not always qualify for consideration as cash flow hedging financial instruments in accordance with IAS 39. At 31 December 2016 the effect of measuring these derivatives at market value was a positive Euros 29,988 thousand, which is recognised under remeasurement of financial instruments to fair value in the income statement (Euros -59,509 thousand in 2015). At 31 December 2016 all exchange rate insurance contracts basically cover both receivables (assets) and payables (liabilities) and include both trade and financing transactions between Group companies. At 31 December 2016 the Group has exchange rate insurance totalling Euros 19,034 thousand (Euros -13,513 thousand in 2015), of which Euros 23,853 thousand is recognised under assets and Euros 4,819 thousand under liabilities. Only Euros 2,307 thousand of this amount qualifies for recognition as hedging instruments. In 2016 an amount of Euros -167 thousand was transferred from the consolidated statement of comprehensive income to profit and loss for the year (Euros -161 thousand in 2015). All of the Group s forward currency purchase and sale contracts have a term of less than one year. At 31 December 2016 the Group has used contracts for foreign currency operations amounting to Euros 326 million for currency sales and Euros 426 million for currency purchases. The comparative figures at 31 December 2015 were Euros 252 thousand for sales and Euros 666 million for purchases. Details of these contracts by currency are as follows: (In thousands of Euros) Assets Liabilities Assets Liabilities USD 185, , , ,950 EUR 56,092 5,067 47,882 8,327 GBP 23, ,508 SEK 27, ,450 PLZ 1, ,459 AUD 6, ,775 NZD MYR 248, ,011 JPY ,187 The Group has contracted derivatives to hedge exposures to currency and interest rate risks affecting its loans and borrowings in currencies other than the functional currency. These instruments are described in the next note. Interest rate risk At 31 December 2016 the Group has arranged the following interest rate swaps and cross-currency swaps, for loans in currencies other than the functional currency of the company in question, to hedge the interest rate risk of a part of its current and noncurrent loans and borrowings: Notional value contracted Outstanding amount Maturity Variable to fixed rate EUR 400 million EUR 32 million 2017 USD variable to USD fixed rate USD 63 million USD million 2017 USD variable to EUR fixed rate USD 160 million USD million 2018 Variable to fixed rate EUR million EUR million 2020 In 2016 no additional interest rate hedges have been arranged. Acerinox Group Page 60 of
64 The average interest rate applicable to USD-denominated financing for which an interest rate hedge has been arranged is 3.55% (3.05% in 2015), while the average rate for Euro-denominated financing with an associated interest rate hedge is 3.83% (3.39% in 2015). The credit spread has been included in both cases. Details at 31 December 2015 were as follows: Notional value contracted Outstanding amount Maturity Variable to fixed rate EUR 30 million EUR 30 million 2016 Variable to fixed rate EUR 15 million EUR 5 million 2016 Variable to fixed rate EUR 10 million EUR 3.33 million 2016 USD variable to EUR fixed rate USD million USD million 2017 Variable to fixed rate EUR 400 million EUR 96 million 2017 USD variable to USD fixed rate USD 63 million USD million 2017 USD variable to EUR fixed rate USD 160 million USD million 2018 Variable to fixed rate EUR million EUR million 2020 The fair value of the fixed interest rate swaps and the cross currency swaps is based on the market value of equivalent derivative financial instruments at the reporting date and amounts to Euros 3,354 thousand (Euros 20,450 thousand at 31 December 2015), which is recognised as follows: Current Non-current Current Non-current Other financial assets 2,697 2,529 15,314 9,375 Other financial liabilities 1, ,992 Net amount 1,306 2,048 15,067 5,383 At 31 December 2016 and 2015 the derivatives contracted qualify as cash flow hedges and therefore the unrealised gain of Euros -7,193 thousand on their measurement at fair value has been recorded in the consolidated statement of comprehensive income (Euros 15,323 thousand in 2015). In 2016 an amount of Euros 12,656 thousand was transferred from the consolidated statement of comprehensive income to profit and loss for the year (Euros 8,251 thousand in 2015). The Group has documented the effectiveness of the derivatives contracted for the purpose of applying hedge accounting, as detailed in note Hedging transactions have been contracted for periods and amounts equivalent to the cash flows deriving from the associated loans. The financial instruments that are considered hedges were not ineffective at any point in 2015 or NOTE 11 CASH AND CASH EQUIVALENTS Details at 31 December are as follows: (In thousands of Euros) Cash in hand and at banks 156, ,388 Current bank deposits 441, ,567 TOTAL 598, ,955 Acerinox Group Page 61 of
65 During the year the Group made term deposits in both Euros and US Dollars. The effective interest rate on current bank deposits is 0.80% for the Euro and 0.94% for the US Dollar (0.51% for the US Dollar and 0.30% for the Euro in 2015). At the reporting date 100% of all deposits have been made by the Group company North American Stainless (72% by North American Stainless and 27% by the Parent in 2015). Deposits are placed for an average term of between 90 days and one week with banks of recognised solvency In 2015 the Group companies generally invested their cash surpluses in deposits with an average term of between 45 days and one week. All cash and cash equivalents are held in current accounts or current deposits. There are no unavailable cash balances at year end. NOTE 12 EQUITY 12.1 Subscribed capital and share premium Movement of issued and outstanding shares in 2016 and 2015 is as follows: (Expressed in thousands of Euros) Number of shares (thousand) Ordinary shares (thousand) Own shares (thousand) Share capital (thousands of Euros) Share premium (thousands of Euros) Balance at 1 January , , ,426 81,403 Capital increase (scrip dividend) 5,005 5,005 1,251 Acquisition of own shares -1 Disposal of own shares Balance at 31 December , , ,677 81,403 Capital increase (scrip dividend) 9,360 9,360 2,340 Acquisition of own shares Disposal of own shares Balance at 31 December , , ,017 81,403 The Parent s share capital solely comprises ordinary shares. All these shares have the same rights and there are no statutory restrictions on their transferability. At 31 December 2016 share capital is represented by 276,067,543 ordinary shares (266,707,393 in 2015) with a par value of Euros 0.25 each, subscribed and fully paid. All the shares are listed on the Madrid and Barcelona stock exchanges. At 31 December 2016 the only holders of 10% or more of the share capital of Acerinox, S.A. are Alba Participaciones, S.A. with 18.96% in 2016 (19.62% in 2015) and Nisshin Steel Holding, Co. Ltd. with 15.49% (15.34% in 2015). At their general meeting the shareholders agreed to increase share capital with a charge to reserves by issuing ordinary shares to be allocated to the shareholders free of charge. Following the shareholders' meeting, on 9 June the board of directors agreed to implement the capital increase by means of a flexible dividend, known as a scrip dividend. The capital increase, through the issue of 9,360,150 shares derived from the scrip dividend, was filed at the Madrid Mercantile Registry on 18 July 2016 (5,005,253 shares in 2015, also derived from the scrip dividend). These new shares were admitted to trading on 22 July On 15 June 2015 the Parent acquired 100 own shares to be exchanged for subscription rights, if necessary, when executing the scrip dividend. There was no movement in own shares in There has been no distribution of the share premium in 2016 or Acerinox Group Page 62 of
66 The share premium is subject to the same restrictions and may be used for the same purpose as the voluntary reserves of the Parent, including conversion into share capital Distribution of dividends At their general meeting held on 9 June 2016, the shareholders agreed that the Parent's losses for 2015, amounting to Euros 20,531 thousand, should be carried forward as prior years' losses. At the same meeting the shareholders also approved a scrip dividend, for which a capital increase was approved, with a charge to reserves by issuing ordinary shares to be allocated to the shareholders free of charge. Based on the agreements reached by the shareholders and the board of directors, those parties who were shareholders of Acerinox at 23:59 hours on 21 June 2016 were to be allocated one right for each share held in the capital increase. The rights were traded on the stock exchange from 22 June to 6 July 2016 and entitled the shareholders to choose between the following options: - Sell the rights to the Company for Euros 0.44 per right between 22 June and 30 June inclusive. - Sell the rights on the stock exchange at the listed market price from 22 June to 6 July 2016 inclusive. - Subscribe shares in Acerinox on the basis of one (1) new share for every twenty-two (22) rights allocated to them on 21 June On 1 July 2016 the definitive amount of the dividend payable and the details of the capital increase were established, as follows: - 60,784,070 rights were sold to Acerinox for Euros 0.44 per right, with the Company therefore paying out Euros 26,744,990.8 to its shareholders on 11 July ,360,150 new shares were issued in the capital increase. On 6 July 2016 Acerinox, S.A. paid out Euros 26,744,990.8 to those shareholders who sold their rights to the Company. The capital increase, through the issue of 9,360,150 shares derived from the scrip dividend, was filed at the Madrid Mercantile Registry on 19 July These new shares were admitted to trading on 22 July For 2015, based on the agreements reached by the shareholders and the board of directors on 3 June 2015, those parties who were shareholders of Acerinox from 16 June to 23:59 hours on 25 June 2015 were to be allocated one right for each share held in the capital increase. The rights were traded on the stock exchange from 17 June to 1 July 2015 and entitled the shareholders to choose between the following options: - Sell the rights to the Company for Euros per right between 17 June and 25 June inclusive. - Sell the rights on the stock exchange at the listed market price from 17 June to 1 July 2015 inclusive. - Subscribe shares in Acerinox on the basis of one (1) new share for every thirty-one (31) rights allocated to them on 16 June On 27 June 2015 the definitive amount of the dividend payable and the details of the capital increase were established, as follows: - 106,539,278 rights were sold to Acerinox for Euros per right, with the Company therefore paying out Euros 47,836, to its shareholders on 6 July ,005,253 new shares were issued in the capital increase Reserves a) Retained earnings Retained earnings include consolidated profit or loss for the year, reserves in fully consolidated companies and equity-accounted investees, as well as Parent reserves other than those mentioned below. Acerinox Group Page 63 of
67 Details of reserves by company are included in note There are no restrictions on the transfer of funds by any Group company in the form of dividends, except for the non-distributable reserves required by applicable legislation. At 31 December 2016 Euros 23,569 thousand of the Group s reserves and retained earnings are subject to restrictions (Euros 21,460 thousand at 31 December 2015). The legal reserve, which is included under retained earnings in the statement of changes in equity, has been appropriated in compliance with article 274 of the Spanish Companies Act, which requires companies to transfer 10% of profits for the year to a legal reserve until this reserve reaches an amount equal to 20% of share capital. At 31 December 2016 the Company has appropriated Euros 12,465 thousand, an amount equivalent to 18.06% of its share capital, to this reserve (Euros 12,465 thousand and 18.69% of share capital in 2015). The legal reserve is not distributable to shareholders and if it is used to offset losses, in the event that no other reserves are available, the reserve must be replenished with future profits. b) Property, plant and equipment revaluation reserve As permitted by Royal Decree-Law 7/1996 of 7 June 1996, containing urgent tax measures and initiatives aimed at boosting and deregulating the economy, the Parent revalued its property, plant and equipment. The amount of the reserve reflects the revaluation gains, net of tax at 3%. The deadline for tax inspection was three years from 31 December Consequently, as no inspection took place, this balance can be used to offset losses or increase the Company s share capital. The balance of this account will only be distributable, either directly or indirectly, to the extent that gains have been realised. c) Hedging reserve The hedging reserve includes cumulative net changes in the fair value of cash flow hedging instruments associated with highly probable future transactions. d) Adjustment of available-for-sale assets to fair value The Company has classified certain financial instruments as available for sale. In accordance with the applicable measurement criteria, any changes in the fair value of these instruments are recognised directly in the consolidated statement of comprehensive income until the financial asset is impaired or derecognised. Note includes a detailed description of instruments classified as available for sale and their value. e) Actuarial valuation reserve This reserve includes the changes in the actuarial value of defined benefit plan obligations. Acerinox Group Page 64 of
68 12.4 Translation differences Details of movement in this account are included in the consolidated statement of changes in equity. Details of cumulative translation differences by company at the 2016 and 2015 reporting dates are as follows: (Expressed in thousands of Euros) GROUP COMPANIES ACERINOX (SCHWEIZ) A.G. 1,377 1,370 ACERINOX ARGENTINA S.A. -4,808-3,470 ACERINOX AUSTRALASIA PTY.LTD ACX DO BRASIL REPRESENTAÇOES, LTDA ACERINOX CHILE S.A ACERINOX COLOMBIA S.A.S ACERINOX INDIA PVT LTD ACERINOX MALAYSIA SDN. BHD ACERINOX METAL SANAYII VE TICARET L.S ACERINOX MIDDLE EAST DMCC (DUBAI) ACERINOX NORWAY A.S ACERINOX PACIFIC LTD. -4,781-4,816 ACERINOX POLSKA,SP Z.O.O -2,273-1,467 ACERINOX RUSSIA LLC ACERINOX SCANDINAVIA AB -3,283-2,249 ACERINOX S.C. MALAYSIA SDN. BHD -1,921-1,985 ACERINOX (SEA), PTE LTD ACERINOX SHANGAI CO., LTD. 1,131 3,028 ACERINOX U.K., LTD. -5,769-1,641 BAHRU STAINLESS, SDN. BHD 47,040 45,419 COLUMBUS STAINLESS INC. -125, ,412 CORPORACIÓN ACERINOX PERU S.A.C NORTH AMERICAN STAINLESS CANADA, INC 9,535 7,714 NORTH AMERICAN STAINLESS MEXICO S.A. DE C.V. 6,720 5,843 NORTH AMERICAN STAINLESS FINANCIAL INVESTMENTS, LTD 5 4 NORTH AMERICAN STAINLESS INC. 383, ,318 SUBTOTAL 301, ,928 ASSOCIATES BETINOKS PASLANMAZ ÇELIK A.S SUBTOTAL TOTAL 301, ,879 Acerinox Group Page 65 of
69 12.5 Details of reserves, profit/loss and non-controlling interests: Contribution by company At 31 December 2016 and 2015 details of the contribution of each of the consolidated companies to reserves and consolidated profit are as follows: (Expressed in thousands of Euros) Reserves Gains/losses Profit/(loss) attributable to noncontrolling interests Total noncontrolling interests Reserves Gains/losses Profit/(loss) attributable to noncontrolling interests ACERINOX, S.A 556,516-7, ,678-19,385 ACERINOX (SCHWEIZ) A.G. 1, , ACERINOX ARGENTINA S.A. 5, , ACERINOX AUSTRALASIA PTY. LTD ACERINOX BENELUX S.A. - N.V ACX DO BRASIL REPRESENTAÇOES, LTDA ACERINOX CHILE, S.A. -3, , ACERINOX COLOMBIA S.A.S ACERINOX DEUTSCHLAND GMBH -16,775 1,197-18,424 1,650 ACERINOX EUROPA S.A.U -74,037 20,425-79,828 5,791 ACERINOX FRANCE S.A.S -9, , ACERINOX ITALIA S.R.L. -15,562-1,020-13, ACERINOX INDIA PVT LTD ACERINOX MALAYSIA SDN. BHN -5, , ACERINOX METAL SANAYII VE TICARET L.S ACERINOX MIDDLE EAST DMCC (DUBAI) ACERINOX NORWAY A.S ACERINOX PACIFIC LTD. -21, ,529-2,972 ACERINOX POLSKA, SP Z.O.O ACERINOX RUSSIA LLC ACERINOX SCANDINAVIA AB -2,590 1,009-3, ACERINOX S.C. MALAYSIA SDN. BHD -34, ,303-1,449 ACERINOX SHANGAI CO., LTD , ,119 ACERINOX (SEA), PTE LTD ACERINOX U.K., LTD. 1,629 1, ACEROL - COMÉRCIO E INDÚSTRIA DE AÇOS -2,586-1,314-2, INOXIDÁVEIS, UNIPESSOAL, LDA. Total noncontrolling interests BAHRU STAINLESS, BDN. BHD -110,454-39,763-19,100 34,003-68,537-41,897-20,927 52,316 COLUMBUS STAINLESS (PTY) LTD. 70,949 18,416 6,090 55,906 57,021 13,928 4,368 41,871 CORPORACIÓN ACERINOX PERU S.A.C INOX RE, S.A. 25, ,458 1,434 INOXCENTER CANARIAS S.A.U 1, , INOXCENTER, S.L.U -21,868 6,602-24,781 3,913 INOXFIL S.A. -1, INOXIDABLES DE EUSKADI S.A.U 1,708 1, ,059 INOXPLATE - COMÉRCIO DE PRODUCTOS DE AÇO 1, , INOXIDÁVEL, UNIPESSOAL, LDA. METALINOX BILBAO S.A.U 15,904 1,826 14,507 1,397 NORTH AMERICAN STAINLESS CANADA, INC 13,042 4,027 10,563 2,480 NORTH AMERICAN STAINLESS MEXICO S.A. DE C.V. 2, , NORTH AMERICAN STAINLESS FINANCIAL INVESTMENTS LTD. -9,054 9,051-8,015 8,013 NORTH AMERICAN STAINLESS INC. 1,161,050 63,363 1,090,305 70,850 ROLDAN S.A. 14,995-3, ,123-5, SUBTOTAL 1,546,479 80,320-13,017 89,989 1,525,442 42,891-16,573 94,277 ASSOCIATES BETINOKS PASLANMAZ ÇELIK A.S SUBTOTAL TOTAL 1,546,215 80,320-13,017 89,989 1,525,178 42,891-16,573 94,277 Acerinox Group Page 66 of
70 The two companies with non-controlling interests are Columbus Stainless, Ltd, 24% of which is held by the South African group IDC (Industrial Development Corporation) and Bahru Stainless Sdn. Bhd, whose main noncontrolling shareholder is Nisshin Steel Holding. Co, Ltd. with an interest of 30%, in addition to Metal One Corporation, which holds a 3% interest. Details of the assets of these two Group companies are as follows: Columbus's total assets amount to Euros 476 million (Euros 383 million in 2015), of which Euros 147 million is non-current (Euros 133 million in 2015). The assets of Bahru Stainless, Sdn. Bhd. amount to Euros 940 million (Euros 890 million in 2015), of which Euros 736 million is non-current (Euros 734 million in 2015). Neither of these companies distributed dividends in 2015 or Application of loss and shareholder remuneration The application of the loss for 2016 of the Parent, Acerinox, S.A., as proposed by the board of directors, to be submitted to the shareholders for approval at their annual general meeting is as follows: (Expressed in thousands of Euros) (Expressed in thousands of Euros) 2016 Basis of allocation: Profit for the year 1,336 Application: Legal reserves 134 Prior years losses 1,202 As regards shareholder remuneration, at the board of directors' meeting held on 21 December it was resolved to make a single payment in July in the manner and for the amount determined by the shareholders at their annual general meeting. The application of loss for the year ended 31 December 2015 was approved by the shareholders at their general meeting on 9 June The losses for 2015, amounting to Euros 20,531, were carried forward as prior years' losses Earnings per share Basic earnings per share are calculated by dividing the profit for the year attributable to equity holders of the Parent by the weighted average number of ordinary shares outstanding during the year, excluding own shares purchased and held by the Group. (Expressed in thousands of Euros) Profit attributable to the Group 80,320 42,891 Weighted average number of ordinary shares outstanding 270,895, ,964,789 Earnings per share (in Euros) The weighted average number of shares has been calculated considering the shares outstanding both prior and subsequent to the capital increase and the number of days for which they had been outstanding. The Group has not issued any financial instruments that give access to capital or convertible debt and therefore diluted earnings per share are the same as basic earnings per share. Acerinox Group Page 67 of
71 NOTE 13 DEFERRED INCOME Movement in deferred income, comprising non-refundable government grants, which include emission allowances received free of charge (see note 9.1) and other capital grants, is as follows: (Expressed in thousands of Euros) Balance at 1 January 7,513 6,430 Grants awarded 3,815 4,352 Transfer to the income statement -3,530-3,269 Translation differences 0 0 Balance at 31 December 7,798 7,513 Deferred income primarily reflects grants received by Acerinox Europe for its research and development activities, and the balancing entry for emission allowances allocated free of charge under the National Allocation Plan and not used during the year (see note 9.1). The Group considers that it has met or will meet all the conditions for receipt of these grants in the period stipulated and therefore no significant contingencies exist in connection with the grants obtained. NOTE 14 PROVISIONS AND CONTINGENCIES Details of non-current provisions included in the balance sheets for 2016 and 2015 are as follows: (Expressed in thousands of Euros) Employee benefits 12,686 10,509 Other provisions 2,789 3,189 TOTAL 15,475 13, Employee benefits Defined contribution plans In accordance with legislation in force in their countries of operation, certain Group companies make contributions to pension plans managed by external institutions. An expense of Euros 8,047 thousand has been recognised for the year under personnel expenses in the consolidated income statement in respect of such plans (Euros 8,157 thousand in 2015). Acerinox Group Page 68 of
72 Defined benefit plans Details of provisions for employee benefits by type of commitment are as follows: (Expressed in thousands of Euros) Pension plans 2,775 2,497 Early retirement benefits Supplements Post-employment benefits 8,896 7,048 TOTAL 12,686 10,509 The amount recorded under pension plans comprises the contributions made by North American Stainless to pension plans for certain employees. These liabilities have been duly externalised and the Company has no additional obligations. The Company has recorded an asset for the same amount. Post-employment obligations reflect post-retirement medical care plans provided by certain Group companies to specified plan members. No new members have joined the plan. The Company performs actuarial valuations of the obligations every two years. The most recent valuation was performed in The assumptions made were as follows: discount rate of 9% (8.8% according to the previous valuation performed in 2013) and 7% inflation of medical services (6.9% in the prior valuation). The opening balance for the period reconciles with the closing balance as follows: (Expressed in thousands of Euros) Balance at 1st January 7,048 8,084 Contributions paid Service cost recognised in the income statement Interest cost Actuarial loss recognised in comprehensive income -188 Translation differences 1,217-1,391 Balance at 31 December 8,896 7, Other provisions Movement in 2016 is as follows: (Expressed in thousands of Euros) CO 2 Litigation Other provisions Total Balance at 31 December , ,189 Charge to provision 2, ,221 Application -1, ,942 Reversal Translation differences Balance at 31 December , ,789 CO 2 These are provisions for CO 2 emissions during the year for which the emission allowances have not yet been surrendered (see note 9.1). Acerinox Group Page 69 of
73 Applications for the year are mainly due to the derecognition of emission allowances for 2016 totalling Euros 1,943 thousand (Euros 1,824 thousand in 2015) (see note 9.1). Litigation Litigation includes legal actions for immaterial amounts with the Port Authority of Algeciras and Électricité de France. In 2016 a balance of Euros 168 thousand was recognised due to a claim received from CDTI to repay a portion of the grant given in 2009 to a consortium of eleven companies, including Acerinox. As a result of the economic crisis and regulatory changes in relation to alternative energies, certain members of this consortium filed for insolvency, and the CDTI demanded the amount of the grant that had not been justified from the other companies of the consortium. Additionally, Euros 120 thousand was released from a provision for the employee claims of one Group company, since an agreement was reached in the negotiations. Other provisions Other provisions reflect Inoxcenter, S.L.U. s estimate of the probable obligations totalling Euros 386 thousand arising from the workforce restructuring plan implemented in 2013 pursuant to Royal Decree-Law 5/2013. There has been no movement in this provision during the year. In 2015 a provision of Euros 545 thousand was made, since the validations of the environmental deductions applied to income tax from 2012 to 2014 were rejected by the Regional Government of Andalusia. The Company has already adjusted these deductions in the income tax return for 2015 filed this year and, accordingly, has released the provision Guarantees provided At 31 December 2016 the Group has provided guarantees to third parties, mainly government bodies, totalling Euros 18 million (Euros 31 million in 2015). This amount includes the guarantee provided to the Italian taxation authorities as a result of the assessments arising from the inspection, as explained in note 17.5, which were reduced by Euros 6.5 million in 2016 as a result of the approval of the amicable settlement explained in that note. Group management does not expect any significant liabilities to arise from these guarantees Contingencies In addition to the tax contingencies discussed in note 17.5, in 2016 Gas Natural Comercializadora, S.A requested declaratory proceedings be opened against the Group companies Acerinox Europa, S.A.U., Roldan, S.A. and Inoxfil, S.A. for an alleged breach of the natural gas supply contracts and requested the payment of the compensation due to unilateral termination, as agreed in these contracts, totalling Euros 8.2 million. Gas Natural Comercializadora S.A. submitted a bid in the supply service tender held by Acerinox during 2016 and 2017, but a different company was selected. The Group considers that it is unlikely that any amount payable will arise following the related legal proceedings that are underway. Acerinox Group Page 70 of
74 NOTE 15 INCOME AND EXPENSES 15.1 Revenue Details of revenue in 2016 and 2015 are as follows: (Expressed in thousands of Euros) Sale of goods 3,962,292 4,211,615 Services rendered 5,851 9,811 Self-constructed assets 6,927 18,888 Operating lease income Gains on disposal of fixed assets 3, Income from grants and subsidies Income from emission allowances 3,026 2,967 Other income 6,357 9,014 TOTAL 3,988,635 4,253, Personnel expenses Details of personnel expenses in 2016 and 2015 are as follows: (Expressed in thousands of Euros) Salaries and wages 284, ,304 Social Security 69,148 67,216 Contributions to employee benefit plans 8,047 8,157 Termination benefits Change in the provision for employee benefits Other personnel expenses 11,501 9,922 TOTAL 374, ,176 The average headcount in 2016 and 2015, distributed by category, is as follows: University graduates Administrative staff Manual workers 5,082 5,080 TOTAL 6,784 6,769 Acerinox Group Page 71 of
75 At 31 December a breakdown of personnel by gender and category, including directors, is as follows: Board members Male Female 2 1 Senior management personnel Male 4 4 Female 0 0 University graduates Male Female Administrative staff Male Female Manual workers Male 4,932 4,908 Female TOTAL 6,809 6,756 This figure includes 224 employees that have taken partial retirement (235 in 2015). At 31 December 2016 the number of employees in Spain with a disability of at least 33% is 57 (53 male and 4 female) (52 in 2015; 48 male and 4 female). As a general rule, all of the Spanish companies comply with the provisions of the General Law on the Rights and Social Integration of Disabled Persons Other operating expenses Details are as follows: (Expressed in thousands of Euros) Rentals 8,388 9,324 Trading costs 172, ,356 Utilities 202, ,266 Maintenance 56,956 53,830 External services 75,352 72,807 Insurance 14,109 14,584 Other operating expenses 31,133 29,162 Taxes other than income tax 17,935 15,376 Losses on disposal of fixed assets Impairment of fixed assets Other extraordinary expenses TOTAL 580, ,452 Other operating expenses include Euros 3,833 thousand in bank fees and securities depository fees (Euros 3,745 thousand in 2015). Acerinox Group Page 72 of
76 NOTE 16 NET FINANCE COST Details of the net finance cost are as follows: (Expressed in thousands of Euros) Interest and other finance income 6,017 3,869 Income from dividends Gain on remeasurement of financial instruments to fair value (exchange rate insurance) 30, Reversal of impairment of investments 3 Exchange gains 0 62,400 TOTAL FINANCE INCOME 36,994 67,580 Interest expense and other finance costs -42,136-51,175 Loss on remeasurement of financial instruments to fair value (exchange rate insurance) ,397 Loss on hedging instruments -957 Loss on liquidation of investments in consolidated companies -290 Exchange losses -22,424 0 TOTAL FINANCE COSTS -66, ,572 NET FINANCE COST -29,567-43,992 NOTE 17 TAXATION 17.1 Legislative amendments Spain On 2 December a new suite of tax measures aimed at shoring up public finances was approved in Spain. Among the tax measures approved, the measures that could have an impact on the Group are as follows: Effective for periods beginning on or after 1 January 2016, the limit on the deduction of prior years' losses is reduced, for those companies with revenues of over Euros 60 million, from the 60% in force for 2016 (70% from 2017 onwards) to 25% of the taxable income earned in the year. Since the Group has capitalised tax credits in Spain, this measure increases the periods in which they can be recovered. Note 17.3 analyses the recoverability of the Group's tax credits. Also, from 1 January 2016 onwards, the impairment of investments in Group companies recognised for tax purposes prior to 2013 and not yet offset at that date will be reversed in a maximum of five years. The amount to be reversed is the greater of the profit earned by these companies in the tax period and one fifth of the amount not yet reversed. Although the Group has deducted impairment for tax purposes, this impairment is not impairment for accounting purposes and, therefore, the related deferred tax liabilities have already been recognised. Impairment on investments accounted for by the Parent were not tax deductible. Impairment on investments pending reversal by the Group at 1 January 2016 amounted to Euros 64,634 thousand. During the year the Company has reversed an amount of Euros 13,977 thousand, and therefore the balance pending reversal at the reporting date is Euros 50,657 thousand, to be reversed within the next four years. A limit is set on the application of double taxation relief at 50% of the gross tax payable. As of 1 January 2017 onwards, the exemption of gains arising from the transfer of investments is also applicable to losses, which therefore will not be deductible, unless the company is extinguished. Acerinox Group Page 73 of
77 As regards instalment payments, Royal Decree 2/2016 also introduced substantial changes aimed at increasing proceeds in this connection. In addition to increasing the percentage for the calculation of the interim payment, a minimum amount of 23% of the profit reflected in the income statement is thus established for the first three, nine or 11 months of each calendar year. This amount is to be decreased only by the amount of the instalment payments made previously for the same tax period. Legislative amendments in other countries In 2016 and 2015 the following tax rates applicable to certain Group companies were amended pursuant to local legislation: - In Malaysia the tax rate decreased from the 25% applicable in 2015 to 24% applicable for years beginning on or after 1 January This rate reduction did not have an impact on the financial statements of the Group companies in this country since they did not have any deferred tax assets recognised. - In Italy the tax rate decreased from 27.5% to 24%, applicable from 2016 onwards. The Group reduced the tax credits recognised in this country, which entailed a higher tax expense of Euros 1,305 thousand. - In the UK progressive modifications have been made to the income tax rate. The applicable rate will be 20% from 1 April 2016 onwards, 19% from 2017 and 17% in The Group has deferred tax assets and liabilities in this country, which it recognised at 17%. The impact on income for the year was Euros 54 thousand. - In Chile a progressive increase in tax rates has been applied, from 17% in 2013 to 27% from 2018 onwards. The applicable rate in 2015 was 22.5% and in 2016 it will be 24% Income tax expense Details of the tax expense are as follows: (Expressed in thousands of Euros) Current tax 57,212 51,474 Deferred tax ,885 Total income tax 57,025 45,589 In 2016 the Parent received dividends from some of its foreign subsidiaries amounting to Euros 15.3 million (Euros 13.8 million in 2015). Under the corresponding double taxation conventions, some of these dividends were subject to withholdings at source amounting to Euros 1,177 thousand (Euros 826 thousand in 2015), which have been recognised under other taxes in the income statement. This account also reflects other withholdings on interest paid to Group companies. Acerinox Group Page 74 of
78 A reconciliation of the income tax expense recognised in the income statement and accounting profit is presented below: (Expressed in thousands of Euros) Net profit for the year 80,320 42,891 Non-controlling interests -13,017-16,573 Income tax 57,025 45,589 Other taxes 3,541 4,989 Profit before tax 127,869 76,896 Income tax at the local tax rate 25.00% 31, % 21,531 Effects on tax payable: Effect of tax rates of foreign operations 9,592 7,081 Non-deductible expenses 7,548 7,279 Tax incentives not recognised in the income statement -10,046-12,190 Non-taxable income Prior year adjustments 1, Adjustment of tax rates, deferred taxes 2,505 1,008 Unrecognised tax credits and impairment 14,723 18,865 Other 307 1,890 Total income tax 57,025 45,589 The tax rate resulting from the Group s consolidated income statement for 2016 was 47% (66% in 2015). This is explained by the combined effect of a higher contribution made to Group profits by the US company North American Stainless, which is taxed at a rate of 35%, and losses of Euros 59 million (Euros 77 million in 2015) at certain companies whose tax credits have not been capitalised. Additionally, tax credits amounting to Euros 1 million (Euros 2.8 million in 2015) have been derecognised in the year, either due to expiry before it was possible to offset them, or because there was no evidence that they could be recovered within a reasonable period, meaning that they should not be carried forward in the accounts. In addition, the lower tax rates in Italy and the UK also contributed to increasing the tax expense by Euros 1,360 thousand. On the contrary, the Group company North American Stainless saw the rates applied to its deferred tax liabilities rise, and recognised an expense of Euros 1,145 thousand Deferred tax Movement in deferred tax assets and liabilities is as follows: (Expressed in thousands of Euros) Deferred tax assets Deferred tax Deferred tax liabilities assets Deferred tax liabilities Balance at 1 January 188, , , ,285 Expense/income for the period -8,575-8,762-9,103-14,988 Taxes recognised directly in equity -1, , Exchange rate fluctuations , ,791 Transfers ,521 7,521 Other changes Balance at 31 December 178, , , ,167 Acerinox Group Page 75 of
79 Other changes reflect the reduction of the environmental deductions applied from 2012 to 2014 that were rejected by the Regional Government of Andalusia in The provision recognised by the Group in the previous year was applied this year due to the Company's adjustment of the available deductions in this regard in its income tax settlement, as explained in note The origin of deferred tax assets and liabilities is as follows: (Expressed in thousands of Euros) Assets Liabilities Net Goodwill 0 0-8,344-7,731-8,344-7,731 Property, plant and equipment 5,225 5, , , , ,175 Financial assets 1,574 1,574-13,886-16,886-12,312-15,312 Inventories 3, , Other assets Provisions 8,039 6,262-12,213-11,673-4,174-5,411 Employee benefit plans 4,123 3,671 1, ,174 4,607 Financial liabilities 328 1, ,744 Other liabilities Non-deductible finance costs 29,300 29,922 29,300 29,922 Other tax deductions 29,280 29,856 29,280 29,856 Unused tax losses 149, , , ,845 Deferred tax assets/liabilities 230, , , ,507-49,501-38,276 Offsetting of deferred tax assets and liabilities -51,885-62,340 51,885 62,340 Deferred tax assets/liabilities 178, , , ,167-49,501-38,276 Deferred tax liabilities recognised in property, plant and equipment are mainly due to the different tax and accounting depreciation criteria permitted by legislation in force in certain countries. These liabilities essentially relate to North American Stainless, Inc and Columbus Stainless, Ltd. Most of the deferred taxes have a reversal period of more than one year. The Group has unrecognised assets of Euros 7.5 million arising from temporary differences relating to accounting impairment which is not tax-deductible. At 31 December 2016 and 2015, the Group has tax credits available as follows: (Expressed in thousands of Euros) Availability limit to 5 years to 10 years to 15 years 4,226 5, to 20 years 0 0 No prescription date 144, ,364 TOTAL 149, ,845 The Group also has uncapitalised tax credits in respect of certain Group companies' tax losses of Euros 274 million (uncapitalised tax credits of Euros 60,477 thousand in 2015), which have not been recognised as they did not meet the necessary criteria. The period for recovery of these credits is open ended, in accordance with prevailing tax legislation. Acerinox Group Page 76 of
80 On 22 June 2015, the Group company Bahru Stainless received confirmation from the Malaysian Ministry of Economy of approval of fiscal aid in respect of investments made in the country from 2009 to This aid consists of income tax deductions for an amount equal to the investments made in certain items of property, plant and equipment, which amount to Malaysian Ringgit 1,811 million (Euros 383 million). The company submitted the rectifying tax returns accrediting the amount of aid receivable. As with tax credits relating to tax loss carryforwards, the Group has not recorded a deferred tax asset as it cannot yet estimate their recoverability. The Group company North American Stainless also has tax credits similar to those extended to Bahru Stainless, for investments in assets that contribute to recycling. These credits are deducted from the calculation of the Kentucky state tax and amount to Euros 539 million. The company used Euros 2,297 thousand in 2015 and expects to use Euros 2,284 thousand in the income tax return for The Group has capitalised tax credits in this connection amounting to Euros 15.1 million, which is the amount expected to be recovered within approximately five years. The Group prepares projections of profit and loss on an individual basis for all companies with available tax credits to determine whether the credits will be recoverable within a reasonable timeframe and within the periods stipulated by respective legislation. To this end, the Group requests a budget covering five to ten years from each company that has capitalised tax assets in order to determine their recoverability. Furthermore, the Group takes into account the limitations regarding offsetting tax loss carryforwards stipulated in certain jurisdictions. The Group also assesses the existence of deferred tax liabilities against which tax losses may be offset in the future. Based on these criteria, the directors consider that, in spite of the new limits introduced in Spain, all capitalised tax credits are still likely to be recovered through future taxable income, in a reasonable period of approximately 10 years and in no case exceeding that permitted by the corresponding local authorities in each country. The tax credits capitalised were the result of the crisis years and the Group has been reducing these credits since The estimates of results made by the Group reflect financial and macroeconomic circumstances as well as the stainless steel market. Key assumptions such as exchange rates and raw material prices are, therefore, extrapolated using highly conservative criteria, referring at all times to the most recent market values. These budgets are approved by Group management Current tax At 31 December 2016 the Group has a current tax asset of Euros 12,254 thousand (Euros 17,394 thousand in 2015) and a current tax liability of Euros 3,418 thousand (Euros 1,092 thousand in 2015) Tax inspections and years open to inspection In accordance with current legislation, taxes cannot be considered definitive until they have been inspected and agreed by the taxation authorities or until the inspection period has elapsed. Pursuant to the Corporate Income Tax Law, tax loss carryforwards declared in the tax returns for years open to inspection become statute-barred ten years from the day following the deadline for filing the tax return or selfassessment for the tax period in which the right to offset arises. Once this period has elapsed, taxpayers must submit the assessment or self-assessment and the accounting records, as well as evidence that they have been filed at the Mercantile Registry during the aforementioned period, in order to demonstrate that these tax loss carryforwards and the amount thereof are appropriate. At 31 December 2016 and 2015 Acerinox, S.A. and the companies in the consolidated tax group have open to inspection by the taxation authorities all the main applicable taxes for the following years: Tax rate Income tax 2008 to to 2014 Value added tax 2013 to to 2015 Customs duties 2013 and and 2015 Personal income tax 2013 to to 2015 Acerinox Group Page 77 of
81 The other Group companies have open to inspection the taxes for the years stipulated by their respective local legislation. The directors of the Company and subsidiaries do not expect that any significant additional liabilities would arise in the event of an inspection. The situation with regard to tax inspections underway or for which appeals are open at the end of 2016 is as follows: Portugal In 2011 a tax inspection of 2007 and 2008 took place at the Group company Acerol Ltda. in Portugal. This inspection gave rise to a transfer pricing adjustment for sale and purchase transactions between Acerol, Ltda and the Group s plants, primarily Acerinox, S.A. and Roldán, S.A. The adjustment to taxable income amounted to Euros 10 million. However, as the subsidiary had tax losses of Euros 6.7 million pending offset, the amount paid totalled Euros 708 thousand, including interest of Euros 32 thousand. These assessments considered that no offence had been committed and, accordingly, no tax penalties were imposed. On 31 July 2012 an application was submitted to the Directorate-General for Taxation through the European Arbitration Convention based on Convention 90/436/EEC of 23 July 1990, requesting the elimination of double taxation arising from the tax assessments issued in Portugal. On 28 December, the affected Spanish companies received the notifications relating to the agreement reached between the Spanish and Portuguese authorities that ended the mutual agreement procedure. On 17 January 2017 the same agreement was received by the Portuguese company. This agreement entails the Spanish and Portuguese authorities accepting the complete elimination of the double taxation. This means that the adjustment made by the competent Portuguese authority to Acerol will be reduced to Euros 4 million for 2007 and Euros 720 thousand for 2008 and that the competent Spanish authorities will make a correlative adjustment of the same amount to the various Spanish Group companies affected. The Group recognised the refundable amounts in Spain and Portugal, which amount to Euros 1.3 million, in addition to an increase in tax credits amounting to Euros 179 thousand. The Group has already sent the letters stating its agreement and, therefore, it expects to be sent the related corrections in South Africa On 24 June 2014 notice was received of the initiation of a tax inspection of transfer prices for 2010 to 2012 at the Group company Columbus Stainless (Pty) Ltd. In 2015 the assessments were received, finalising the inspections. The assessments stipulated adjustments to taxable income in relation to transfer prices, amounting to Euros 32 million. These adjustments did not result in any payable amounts in South Africa, as the company has carried forward tax losses which exceed the amount of the assessment. The assessments did not impose any penalties. The company considers the facts on which the proposed adjustments are based to be incorrect, and also considers the interpretation of the applicable legislation to be erroneous, as they are not in line with the principles or any of the methods approved by OECD guidelines. The transfer pricing method adopted by Columbus is in line with that of the rest of the Group and is OECD-approved. Subsequent to the filing of the related submissions within the periods established, in 2016 the company was notified of the possibility of engaging in alternative proceedings to resolve the conflict related to 2010 by appointing an independent arbitrator ("Alternative Dispute Resolution"). The company considered it appropriate to exhaust all options prior to resorting to the courts. The outcome of the proceedings was highly satisfactory to the company, since on 7 February 2017 it received notification from the South African tax authorities that the elimination of all the adjustments proposed for 2010 had been accepted. In addition, the notification approves the transfer pricing policy followed by the Group. The company expects that these agreements reached for 2010 will also extend to 2011 and Italy In 2011 the subsidiary Acerinox Italia S.r.l. underwent an inspection of taxes for 2007, 2008 and Acerinox Group Page 78 of
82 Between 2012 and 2014 the assessment notices for the three years were received, primarily indicating transfer pricing adjustments in relation to sales and purchases with Group factories. The resulting payable tax assessment amounted to Euros 16 million, plus Euros 3.5 million in interest. No penalties were imposed. The company challenged these assessments in appeals filed by the respective deadlines before the provincial tax commission of Milan, in which it was also requested that stays be placed on the tax debt until completion of the proceedings. These stays were accepted by the Italian authorities, subject to the pledging of bank guarantees of Euros 7.9 million. On 9 December 2013 the Group applied to the Spanish and Italian authorities for the elimination of double taxation pursuant to Convention 90/436/EEC of 23 July As most of these transactions are with companies resident in Spain (Acerinox, S.A. and Roldán, S.A.), any adjustment relating to transfer prices is protected by Convention 90/436/EEC on the elimination of double taxation in connection with the adjustment of profits of associated enterprises. This Convention guarantees the elimination of double taxation due to transfer pricing adjustments within the European Union. Following negotiations between the Spanish and Italian taxation authorities, or an arbitrator s ruling if necessary, this initial adjustment, or whichever adjustment is agreed, will therefore be neutralised by a counter-adjustment in the other member state. Although the financial effect of the time that elapses until completion of the proceedings is not specifically covered by the Convention, when the Spanish authorities record an adjustment in favour of the taxpayer, this either includes accrued interest or another method is used to ensure that the financial effect does not entail a charge for the taxpayer. The Spanish Directorate-General for Taxation and the Italian authorities have confirmed their acceptance of the initiation of the procedure. This should therefore be concluded within approximately two years from the date of acceptance, although the period is often longer. Italian legislation requires that internal appeals be withdrawn to accept the international arbitration proceedings to eliminate double taxation. Therefore, after it was announced that the proceedings had been accepted, the Group withdrew the internal claims relating to transactions with countries in the European Union. Initiation of the mutual agreement procedure allows the company to reduce the bank guarantees provided, which it did in 2016, as explained in note With regard to transfer pricing adjustments, the company considers it unlikely that the final amount of the obligation will be that shown in the assessments and it is difficult to calculate the definitive amount as the inspectors have failed to take into account numerous arguments based on both OECD transfer pricing regulations and Italian (and Spanish) law. On 23 March 2014 the company was notified of the ruling in its favour, in relation to the assessment of transfer prices for The Spanish taxation authorities were also notified of the ruling and filed no submissions. The proceedings were therefore considered to be completed, with a ruling in favour of the company. The corrections required by this tax assessment include adjustments to the transfer prices applied in transactions between Acerinox Italia and the Spanish Group company Roldán, S.A. The amount recognised in income in 2014 totalled Euros 1 million. The company expects the same criteria and arguments that led the courts to find in its favour in those cases to be applicable to the assessments for 2007, 2008 and Based on the information available to date, although this company could be required by the Italian taxation authorities to adjust certain amounts, it considers that it would be difficult to determine the amounts of these adjustments. At the reporting date and the date of presentation of these annual accounts, the adjustments derived from the inspection in Italy are therefore considered a contingent liability in that company, which in any case would be offset in the consolidated annual accounts. In addition to the transfer pricing adjustments for 2007, 2008 and 2009, the assessment contained less significant adjustments for 2006 to 2009 reflecting the consideration of the interest on a loan received by the company from a Group company registered in Switzerland as non-deductible, as well as applying withholdings which the company had not applied, as permitted by the Double Tax Treaty between Italy and Switzerland. The company also filed submissions in relation to these matters. The Provincial Court of Milan rejected the company's claim in relation to interest for 2006 and The maximum risk of these adjustments amounted to Euros 1.6 million (including interest). The company eventually decided to settle with the Italian authorities for Euros 336 thousand, which was included as a tax expense in the income statement for the year. As a result of this agreement, all the lawsuits filed against the Italian taxation authorities were resolved, leaving only the transfer pricing adjustments, which will largely depend on any future agreements reached between Italy and Spain. In respect of 2016, based on the request received in October from the Italian authorities, the company filed the transfer pricing documentation for On 28 December 2016, with no prior notification of the commencement of tax inspections, the company received an assessment of transfer prices giving rise to adjustments to the tax base of Euros 4.3 million and an amount payable of Euros 1.5 million, plus interest. No penalties were imposed. Acerinox Group Page 79 of
83 The company expects to follow the same procedure as with the assessments for prior years, within the periods established by law. Germany As regards the inspections of taxes for 2007, 2008, 2009 and 2010 initiated in 2011 at the Group subsidiary Acerinox Deutschland, GmbH, the assessments of the income tax, solidarity surcharge and VAT for 2007 to 2010 were received on 8 July The assessments mostly indicate transfer pricing adjustments to the tax base for sales and purchases between the subsidiary and the Group s factories. No penalties were imposed. The company filed the pertinent submissions on 8 August The amount payable in Germany was Euros 384 thousand for the VAT assessments, Euros 2,804 thousand for income tax plus the solidarity surcharge and Euros 489 thousand in interest. These amounts were paid in In the event that the ruling on the objections submitted is in favour of the company, the German authorities will be required to repay these amounts, plus interest of 6%. As is the case with Italy, as most of these transactions are with the companies resident in Spain, any adjustment relating to transfer prices is protected by Convention 90/436/EEC on the elimination of double taxation in connection with the adjustment of profits of associated enterprises. This Convention guarantees the elimination of double taxation due to transfer pricing adjustments within the European Union. Following negotiations between the Spanish and German taxation authorities, or an arbitrator s ruling if necessary, this initial adjustment, or whichever adjustment is agreed, will therefore be neutralised by a counter-adjustment in the other member state. The company has submitted a request for elimination of double taxation in both Spain and Germany and has received confirmation from the taxation authorities of the both countries of their acceptance. On 29 November 2016 it was notified of the commencement of inspections for 2011 to The inspections will begin in March Malaysia On 24 and 28 December 2014, notice was received of the start of an inspection of taxes for 2010 and 2011 of the Group company Bahru Stainless Sdn. Bhd. Subsequently, on 4 March 2015, notification was received that the inspection was to be extended to 2012 and All requested information has been submitted to date. On 25 November 2015 a notification was received that the inspection had been postponed until further notice. In addition, on 20 January 2015 notification was received of the commencement of an inspection of Acerinox SC Malaysia, Sdn. Bhd. in relation to transfer prices in the period from 2010 to All the information requested has been submitted and, to date, no report on the findings has been received which would allow conclusions to be reached with regard to any adjustments. Spain On 7 January 2016, the Economic-Administrative Tribunal issued a ruling upholding in full the submissions filed by Acerinox, S.A. against the assessment decisions arising from the inspection of rights, anti-dumping and VAT for 2009, 2010 and Agreements to enforce the rulings were received on 27 April 2016, for amounts of Euros 925 thousand in the case of antidumping (this amount was guaranteed), Euros 649 thousand in respect of VAT on imports (which had been deducted by Acerinox at the time) and Euros 41 thousand in respect of payable external tariffs. The Company has filed an appeal against the assessment decisions, contesting the interest calculation. Euros 61 thousand relating to guarantee expenses were also recovered. On 15 April 2015 the Group was notified of the commencement of an inspection of its import duties and VAT for The inspection was completed on 27 October The Company did not accept the assessment with regard to the external tariff in an amount of Euros 24 thousand plus interest or that concerning VAT on imports amounting to Euros 182 thousand. Both amounts were paid. The tax payment arose from the inclusion by the Spanish taxation authorities of services relating to the installation and assembly of machinery imported from Japan as an increase in the value of the imported goods for customs purposes. Acerinox Group Page 80 of
84 France On 29 November 2016 the Group company Acerinox France, S.A.S was notified of the commencement of a verification of the tax returns for 2014 and All the information requested has been submitted and, to date, no report on the findings has been received which would allow conclusions to be reached with regard to any adjustments. Poland On 2 December 2016 notification was received of the commencement of tax inspections at the Group company Polska Sp. z o.o. for the income tax for The inspections are currently underway. NOTE 18 RELATED PARTY BALANCES AND TRANSACTIONS 18.1 Identity of related parties The consolidated financial statements include transactions with the following related parties: - Equity-accounted associates; - Key management personnel of the Group and members of the boards of directors of Group companies; - Significant shareholders of the Parent. Transactions between the Company and its subsidiaries, which are related parties, are carried out in the ordinary course of the Company's business and have been eliminated on consolidation. Therefore, they are not disclosed in this note Related party balances and transactions All transactions between related parties are carried out at arm s length, and are listed below. a) Associates No transactions were carried out with associates in 2016 or b) Directors and key management personnel Remuneration received by the four members of senior management who do not hold positions on the board of directors of Acerinox, S.A. amounts to Euros 1,531 thousand. Euros 977 thousand of this amount reflects salaries, Euros 84 thousand comprises allowances and Euros 470 thousand is variable remuneration relating to profit for In 2015, the four senior management personnel received Euros 2,054 thousand, of which Euros 1,055 thousand reflected salaries, Euros 102 thousand comprised allowances and Euros 897 thousand was variable remuneration relating to profit for The difference in salaries is due to the replacement of a member of senior management. In 2016 members of the board of directors of Acerinox, S.A., including those that hold key management positions and sit on the boards of other Group companies, received Euros 2,080 thousand in fixed remuneration for attending board meetings and fixed and variable salaries (the latter based on the results from the prior year), of which Euros 1,309 thousand reflect salaries and fixed board member remuneration, Euros 383 thousand comprises allowances and Euros 388 thousand is variable remuneration relating to results from the prior year. In 2015 the remuneration received totalled Euros 2,387 thousand, of which Euros 1,356 thousand reflected salaries and fixed remuneration, Euros 381 thousand comprised allowances and Euros 650 thousand was variable remuneration relating to results from the prior year. Acerinox Group Page 81 of
85 Commitments with all senior management, totalling Euros 1,040 thousand in 2016, have been accounted for correctly and are adequately covered through insurance contracts (Euros 1,555 thousand in 2015). No commitments have been contracted with directors representing shareholders or independent directors of Acerinox, S.A. At 31 December 2016 no advances or loans have been extended to the members of the board of directors or senior management and the Company has no balances receivable from or payable to these executives. The directors of the Company and their related parties have had no conflicts of interest requiring disclosure in accordance with article 229 of the Revised Spanish Companies Act. c) Significant shareholders The Group has entered into the following financing transactions with Banca March, part of the March Group (shareholder of Corporación Financiera Alba), all under market conditions: - Guarantees up to a limit of Euros 0.06 million, of which Euros 0.06 million has been drawn down. - Reverse factoring facilities for Euros 3 million, of which Euros 0.2 million has been drawn down. - Non-current loan of Euros 30 million, which has been drawn down in full. - Factoring facilities for Euros 70 million, of which Euros million has been drawn down. In 2015 the Group arranged the following financing transactions with Banca March, all of which were under market conditions: - Credit facilities up to a limit of Euros 4 million, of which Euros 0 million had been drawn down. - Guarantees up to a limit of Euros 0.06 million, of which Euros 0.06 million had been drawn down. - Reverse factoring facilities for Euros 16 million, of which Euros million had been drawn down. - Non-current loan of Euros 30 million, which had been drawn down in full. - Factoring facilities for Euros 70 million, of which Euros million had been drawn down. Details of the Group s transactions with Banca March in 2016 and 2015 are as follows: (Expressed in thousands of Euros) Interest Commissions TOTAL The terms and conditions of the loans and financial transactions listed in the preceding paragraph are in accordance with market conditions. Insurance premiums and other transactions totalling Euros 11,564 thousand (Euros 8,967 thousand in 2015) have been brokered through March J.L.T. Correduría de Seguros (a March Group company). The Acerinox Group has also carried out the following commercial transactions with its shareholder Nisshin or other companies belonging to its Group: (Expressed in thousands of Euros) Dividends Finance costs Sales of goods 1,264 1,232 Trade and other receivables Services rendered 1, Acerinox Group Page 82 of
86 NOTE 19 AUDIT FEES Details of fees and expenses accrued by KPMG Auditores S.L. (principal auditor) and associate firms for services provided to the consolidated companies are as follows: (Expressed in thousands of Euros) 2016 KPMG Auditores, S.L. KPMG International TOTAL Audit services Tax advisory services Other services TOTAL 411 1,146 1, KPMG Auditores, S.L. KPMG International TOTAL Audit services Tax advisory services Other services TOTAL 395 1,124 1,519 The amounts detailed in the above table include the total fees for services rendered in 2016 and 2015, irrespective of the date of invoice. Other audit firms invoiced the Group fees and expenses for audit services amounting to Euros 72 thousand in 2016 (Euros 88 thousand for audit services in 2015). NOTE 20 EVENTS AFTER THE REPORTING PERIOD The following significant events occurred between the reporting date and the date of authorisation for issue of these annual accounts: On 2 February the US government ratified the anti-dumping measures approved provisionally in 2016 against several stainless steel manufacturers from the People's Republic of China. NAS has begun to use its new machinery in its steel-rolling activity. In 2015 the board of directors of Acerinox S.A. authorised new investments to be made at the Group's factory in Ghent (Kentucky, USA) to increase NAS's production capacity in respect of 2B and BA cold-rolled coils. The first tests have been carried out in February and it is expected that the quantity and quality of production will normalise during the first half of the year. Acerinox Group Page 83 of

87 ACX 2016 Annual Report Acerinox 1
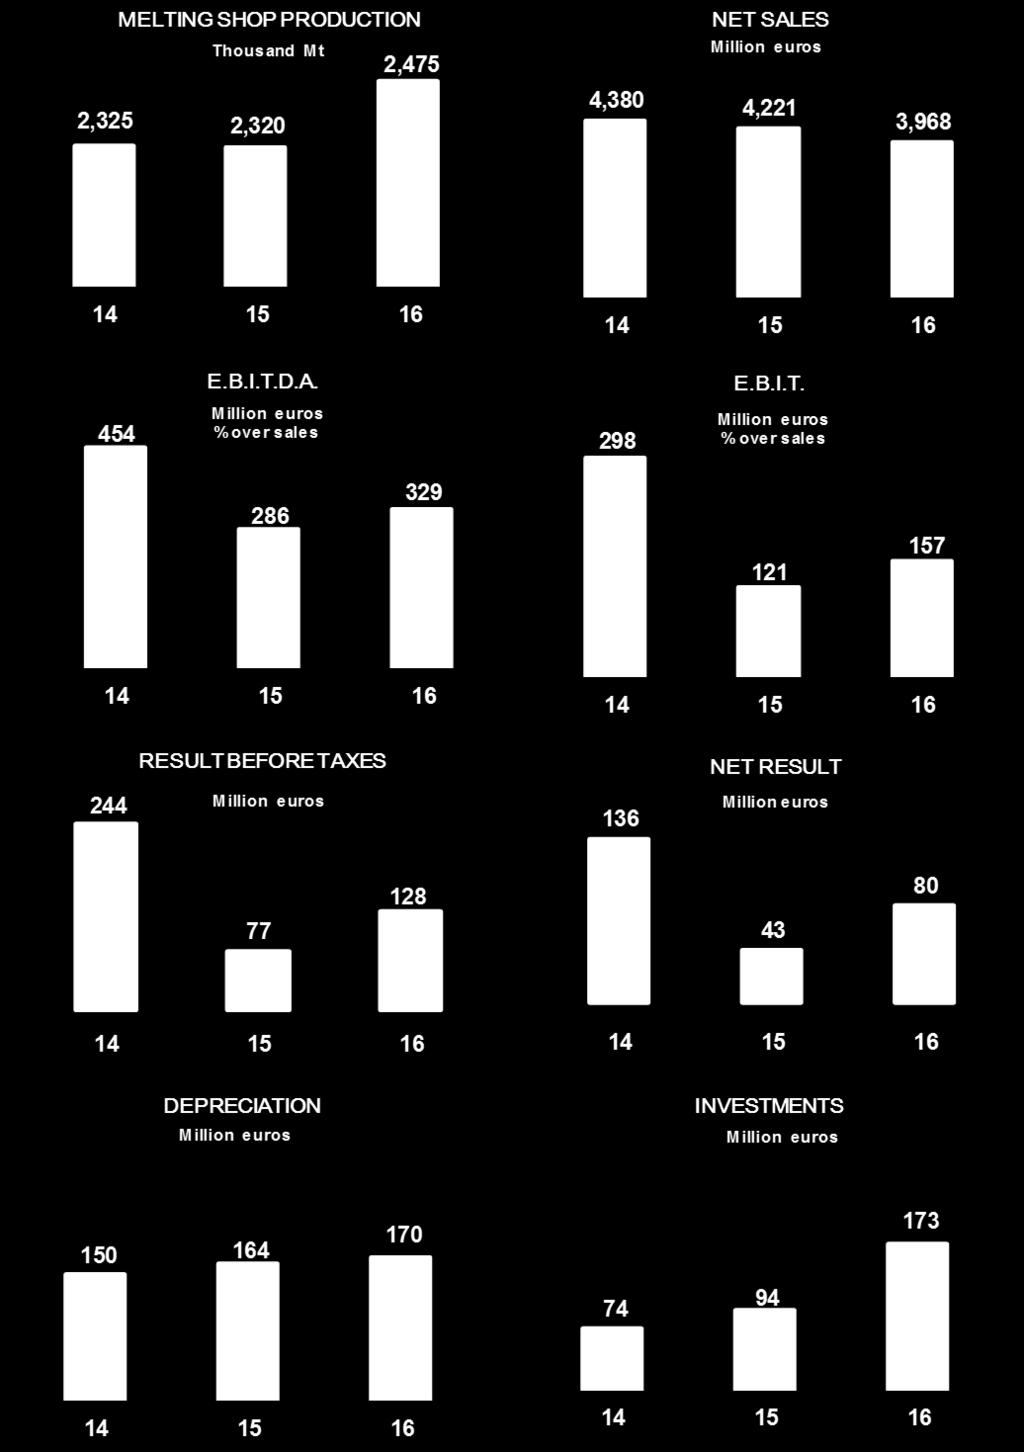
88 2
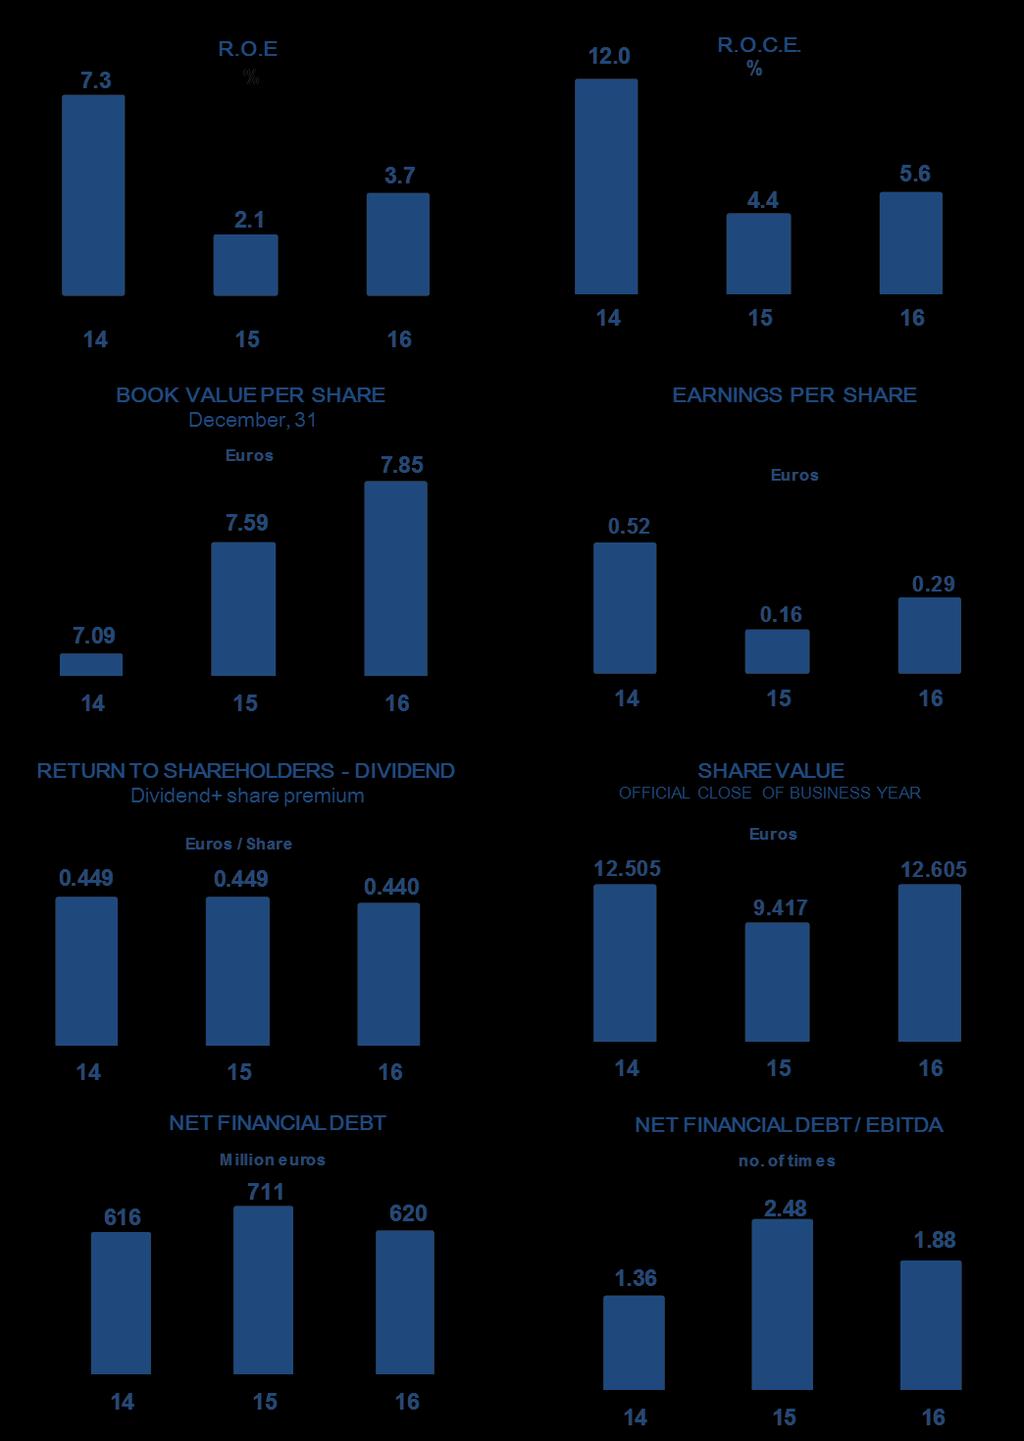
89 3
90 INDEX 1. Our business Production Companies Marketing Companies Results Management review of the year The Stainless Steel Market Europe Americas Africa and Middle East... Error! Marcador no definido Asia Global Production of Stainless Steel Acerinox Group Production Excellence Plan Investments in Fixed Assets Raw Materials Human Capital R+D+i Digital Transformation Risk Management The Acerinox Group s Individual Companies Relevant events ocurring after the close of the year Financial Report Evolution of shares Capitalization Shareholder Remuneration Corporate Governance and Compliance Share Capital The Board of Directors and its Committees General Shareholders' Meeting Main Executives of the Group s companies

91 1. Our business ACERINOX, CREATED IN 1970, HAS GROWN TO BECOME THE ONLY GLOBAL PRODUCER AND ONE OF THE MOST COMPETITIVE COMPANIES IN THE MANUFACTURE AND SALE OF STAINLESS STEEL 5
92 Acerinox is one of the largest manufacturers of stainless steel in the world (with a 5.5% market share of production) and is the only company in its sector with a global nature and factories on four continents. The Group came into being with a clear export vocation. When the first stone was laid in what was to become its first factory in Los Barrios in 1970 (Campo de Gibraltar), it was designed to produce ten times more stainless steel than the total amount consumed in Spain that year. The Acerinox Group is currently the market leader in North America, where it casts about 50% of the stainless steel, and in Africa, where the Company maintains a market share close to 55%. The Acerinox Group is one of the main producers in Europe, ASEAN and Oceania, with market shares above 10%. The Company has three integral process plants for the production of flat products: the one mentioned above in Campo de Gibraltar (Spain, 1970), the first to exceed one million tonnes per year (in 2001), North American Stainless, NAS (Kentucky, USA, 1990), also fully integrated since February 2002, and Columbus Stainless (Middleburg, South Africa), which joined the Acerinox Group in Bahru Stainless, the building of which began in 2008, will become the group s fourth integral factory. It is located at one of the most strategic points in the world, the Strait of Johor (Malaysia), due to its importance as an axis of global trade. Within its productive network, the Group has two long product factories in Ponferrada (Spain) and Igualada (Spain), chiefly designed to supply the European market, and another integrated into NAS. The Company has undergone strong growth throughout its 46-year history, with a mainly organic development based on the creation and expansion of its factories and commercial network. Acerinox has reference shareholders characterized by their continuity and permanence within the Group. This connection, in the case of Nisshin Steel Co. Ltd., dates back to the creation of the company itself in 1970 and in the cases of Omega Capital to 1998, the Alba Financial Corporation to 2001 and IDC to

93 1.1. Production Companies Acerinox Europa - Factory in Campo de Gibraltar (Andalusia, Spain) Acerinox Europa is one of the most efficient stainless steel factories in Europe as a result of its cutting-edge technology and the experience of the 2,081 employees who work there. Located in Campo de Gibraltar, Acerinox Europa is one of the main exporters and creators of employment in Andalusia, where it has had its head offices since 2014, and it is the company with the third highest economic turnover in the region and the highest in the province of Cádiz. Acerinox Europa is one of the key assets of the Company s new Strategic Plan for the coming years. As a continuation of the factory s policy of constant investment and improvement since its creation in 1970, it will be expanded in 2017, following a significant investment of 140 million euros, to include a new annealing and pickling line and a new cold-rolling mill. The experience acquired in manufacturing techniques and the constant search for excellence in the production processes at the plant have been fundamental for the success of the other Group factories, which have benefited from the profound knowledge that Acerinox Europa has accumulated on how to manufacture and sell stainless steel. 7

94 North American Stainless - Factory in Ghent (Kentucky - USA) North American Stainless (NAS) casts about 50% of stainless steel throughout North America and has a market share in the United States which stands at around 35%, figures which guarantee its leadership of the American market. It is the Group s largest factory, fully-owned by Acerinox, and has continued to grow steadily, with a cumulative investment of 2,233 million euros since its construction in NAS is a worldwide reference in the sector due to its technical efficiency and economic profitability and stands at the forefront of high-quality stainless steel production. In 2017 the factory will once again increase its cold-rolling capacity, reduce delivery times to customers and offer a wider range of products with the launch of a new BAfinish bright annealing line and a cold-rolling mill, in which the Company has invested 116 million euros. 8

95 Columbus Stainless - Factory in Middelburg (Mpumalanga, Republic of South Africa) Columbus Stainless is a leader in terms of production and sales on the African continent, with significant market share in South Africa, its main market. Acerinox acquired the plant in 2002 after reaching an agreement with the South African government through its investment arm the IDC (Industrial Development Corporation) and the mining companies Anglo-American and BHP Billiton. At present, the IDC has 24% of the shareholdings of Columbus and Acerinox 76%. The IDC is also represented on the Board of Directors of Acerinox S.A, where it a participation of 3.05%. The products from the South African plant supply its domestic market and are also exported to five continents. The Columbus plant enjoys a privileged strategic location, due to its proximity to areas where the raw materials essential for the manufacture of stainless steel can be acquired and transformed. 9
96 Bahru Stainless Factory in Johor Bahru (Johor, Malaysia) Bahru Stainless is probably the world s most cutting-edge and technologically advanced stainless steel production centre. The company was set up as a joint venture between Acerinox and Nisshin Steel, companies with a long history of mutual cooperation going back 46 years. The ownership structure in the project for NISSHIN STEEL is (30%), Metal One (3%) and ACERINOX (67%). Construction began in 2008 in Johor, at the beginning of the Strait of Malacca, one of the most strategic geographical points for world trade. Bahru is currently operating as a cold-rolling mill and, when the project has been completed, it will be an integral factory with a production capacity of 1 million tonnes/year. The factory is designed to supply the emerging market in Southeast Asia. Bahru further contributes to the Group by means of the purchase of semi-finished products from other factories of the Group. The Company s productive activity is thus increased and the production costs of the supply factories are improved. 10

97 Roldán and Inoxfil - Factories in Ponferrada and Igualada (Spain) The plants in Roldán (Ponferrada, Spain) and Inoxfil (Igualada, Spain) specialize in long products. Roldán manufactures wire rod, angles and bars from billet produced in Campo de Gibraltar. Inoxfil is a wire drawing producer. These companies form part of the Acerinox Europa production chain, as the latter supplies billet to Roldán and Inoxfil receives wire rod from Ponferrada. The Ponferrada long product factory is the oldest in the Group, as it already existed prior to the creation of Acerinox. Up until now, 99.77% of the shares of Roldán, the company which owns the factory, belong to Acerinox. 11

98 1.2. Marketing Companies As of 31 December 2016, the sales network of the Acerinox Group present in 48 countries is made up of 19 service centres, 27 warehouses and 34 sales or representative offices, as well as sales representatives in different countries where it has no permanent offices. This structure enables it to perform sales in 82 countries on five continents. These include the most advanced economies in the world and virtually all the developing countries which aspire to offer high levels of quality of life to their citizens. ACERINOX GROUP COMMERCIAL NETWORK IN

99 2. Results 13
100 ONE OF THE BEST RESULTS SINCE THE BEGINNING OF THE CRISIS WAS ACHIEVED IN THIS RESULT AND THE COMPANY S MID-TERM OPERATIONAL AND FINANCIAL STRENGTH WAS BASED ON THE EXECUTION OF THE STRATEGIC PLAN AND ITS PILLARS OF EXCELLENCE IN THE OPERATION, PRODUCTION-CAPACITY OPTIMIZATION AND EXECUTION OF RAPID RETURN INVESTMENTS. WITHIN A COMPLEX ENVIRONMENT, ACERINOX ONCE AGAIN WAS ABLE GENERATE HIGH CASH FLOW, ALLOWING IT TO MAKE PAYMENTS TO ITS SHAREHOLDERS, GUARANTEE ITS FINANCIAL SOLIDITY THROUGH DEBT REDUCTION AND CONTINUE ITS PROGRAMME OF EXPANSION AND FUTURE GROWTH OF THE GROUP BY MEANS OF EXECUTING AMBITIOUS INVESTMENTS CURRENTLY UNDER WAY. THE ACERINOX GROUP ACHIEVED A NEW RECORD OF ACTIVITY IN 2016 WITH THE UNITS SOLD INCREASING BY 9% IN COMPARISON WITH THE PREVIOUS YEAR AND THE FACTORIES REACHING A NEW HIGH IN TERMS OF COLD-ROLLING PRODUCTION WAS ALSO THE SECOND BEST YEAR FOR ACERINOX IN TERMS OF STEEL PRODUCTION AND HOT- ROLLING. 14
101 Acerinox ended the 2016 financial year with a profit of 80 million euros after taxes and minority interests, thereby improving on that achieved in 2015 by more than 87%, when it obtained 43 million euros. Following three quarters of consecutive losses due to the continual decline in raw materials (the last two in 2015 and the first in 2016), once the nickel price stabilised, the results underwent a steady progression during the year, from the losses of eight million euros in the first quarter to a profit of 35 million euros in the last. The EBITDA for 2016 totalled 329 million euros, an amount which lies 15% above that obtained in 2015 (286 million euros). The Acerinox Group increased the number of physical units sold by 9%, although the Group s turnover of 3,968 million euros in 2016 was 6% lower than that of the previous year, owing to the lower average price of the raw materials used during the year. The results are even more relevant if they are situated within the context in which they were achieved: the lowest nickel price since 2008, the pressure exerted by the new production exporters and the still incipient recovery from a serious consumption crisis. They were made possible as a result of the determined effort to reduce costs arising from the Excellence Plan IV, which led to savings of 50 million euros, and a strong focus on stock management. In accordance with the Company s Strategic Plan, an increase in activity in the group s factories was achieved as another of the pillars upon which the achievement of these profits was based. Last year was the best in history since the foundation of the Group (1970) in terms of cold-rolling production and the second best year for steel production and hot-rolling million tonnes were cast at the steel mill (a figure only exceeded in 2006) and 2.21 million tonnes were hot-rolled (only in 2006 has there been a greater volume of production). The new cold-rolling production record was set at 1.72 million tonnes. During the year, due to the increase in the consumption rates, there were base price increases in both the North American and European markets. The situation led to a growth in the margins, situating the EBITDA in double digits which reflects the level of competitiveness reached during the second half of the year, a circumstance which, with the exception of 2014, had not occurred since 2006, when the nickel price soared by 150%, with the corresponding revaluation of the Company inventories. 15
102 3. Management review of the year Last year was marked by an international environment fraught with numerous uncertainties. There were doubts about the strength of China s economy, the UK s possible exit from the European Union, the electoral process in the USA, the political instability in the Middle East and the tensions between Russia and the European Union, among others. Within this context, especially during the first half of the year, the different international organizations were very cautious about the expectations for the growth of the economy in general, and this same impression affected the forecasts for the growth of stainless steel and, in general, the expectations for all the raw materials. The institutions estimates did not come to pass and the economy eventually performed better than expected. The world economy grew; China closed the year with an increase of 6.6% and its disposable income per capita rose by 6.3%, India underwent an upturn of 7.6%, the Eurozone advanced by 1.6% and the GDP in the USA rose by 1.6% in spite of the instability arising from the electoral process. The maintenance of constant growth in these circumstances, in the wake, moreover, of the period of sharp deceleration suffered in recent years, highlights both the solidity of the world economy and the stability of a global system which continues to create wealth and tends towards steadiness. 3.1 The Stainless Steel Market In both the presentation of the 2015 annual results and the accompanying report, Acerinox declared, with regard to the Company s prospects, that sales of physical units are increasing, the order book has improved and there have been two price increases in the American market. The inventories are below normal levels and actual consumption remains solid in the main user sectors. Due to all the above factors, the situation should improve, once the price of nickel stabilizes. The forecasts for the stainless steel market suggested global growth of around 2% in 2016, which, if they had been fulfilled, would have meant a significant slowdown, as our product grows at a historical average of 5.9%. However, the year ended with estimated growth of 8.9%, according to the ISSF (International Stainless Steel Forum), as a result of which the market recovered and returned to figures which were slightly higher than usual. Once again, the increase in the worldwide consumption of stainless steel confirms that this material remains extremely competitive. In the applications in which its use is most common it is impossible to find a substitute with better characteristics and its use is extending to new products. The benefits of stainless steel make its growth over time superior to that of comparable materials. 16

103 The trend of the price during the year in all markets was an upward one. In the USA throughout the year, in Asia from the second quarter of the year onwards and during the second half of the year in Europe. At the end of the year, according to our information, the price in Asia remained below that of the USA, while Europe maintained a price differential with respect to the other markets. Prices of stainless steel plate 2.0mm cold-rolled AISI and 2016 Below we analyse the evolution of our main markets throughout
104 3.1.1 Europe Apparent consumption of flat products in Europe increased by 7.2%, reaching a level of 5.2 million tonnes, according to Acerinox estimates. This consumption is the second highest ever, exceeded only in 2006, and therefore Europe appears to have achieved the levels of consumption of stainless steel recorded before the crisis. Significant growth was achieved in all major markets, except the United Kingdom. We should highlight the performance of Spain, where Acerinox also increased its market share. Imports of flat products, despite the anti-dumping measures against China and Taiwan, increased by 11.9% mainly in hot-rolled products. The increase in imports, therefore, exceeded that of the market and stood at levels prior to to the anti-dumping measures imposed in 2015 by the European Commission. The main exporter of stainless steel to Europe was South Korea, with a sharp rise in imports of cold-rolled products. As for China, it became the second largest importer of flat products on the continent; affected by the anti-dumping measures, the country replaced its imports of cold-rolled products with hot-rolled products. The inventories in Europe underwent a steady decline during the year, after a small recovery in the initial months, eventually reaching levels suitable for European consumption. This year, the Acerinox group also increased its presence in Russia and Turkey, markets which without a doubt will be important in the future. 18

105 Base prices eventually increased slightly, aided by good market dynamics and developments in raw materials during the second half of the year. Prices of stainless steel plate 2.0mm cold-rolled AISI and 2016 Within the sectors we should highlight the automotive industry, which after a number of years with significant growth follows this trend, +5.5% according to Eurofer estimates, while white goods also evolve positively, +1.1% according to Eurofer estimates. The first signs of both public and private investment were detected in the construction industry Americas The performance of the American market during the year was affected by the restrictions on Chinese steel imports announced on 12 July by the United States Department of Commerce. Among the above, it announced preliminary anti-subsidy measures ranging between 57.3% and 193.1%. On 13 September, preliminary antidumping tariffs were subsequently added to these ranging from 63.9% to 76.6% on China s cold-rolled flat product. In a global world, the different stainless steel markets are closely linked and these measures altered the flow of material around the world. The flat product market increased by 7% in the United States. However, the growth in the country s total apparent consumption was lower (4.1%), affected by the lack of investment in the Oil & Gas sector, which resulted in a 13.6% decrease in long products. The evolution of apparent consumption in the American market was uneven throughout the year: after a moderate first semester, the market accelerated later in the year with a sharp rise following the regularization of stocks and the announcement by the US 19

106 Department of Commerce, which led to a sharp decline in imports from China, although the latter was partially offset by the arrival of products from other countries such as Vietnam, Italy and Mexico. Stock levels during 2016 maintained the evolution of the apparent consumption, undergoing a decline during the first quarter of the year and a subsequent increase to levels similar to 2015, adequate for consumption in the US market. After the sharp falls in 2015, base prices recovered from the beginning of the year onwards, ending with values which were still somewhat lower than those recorded at the start of At the time of writing this text, new price increases have already been announced and have been in effect since the beginning of Prices of stainless steel plate 2.0mm cold-rolled AISI and 2016 The main sectors of consumption of stainless steel evolved favourably. These include the automotive sector, +1.3% according to Wards Auto estimates, which once again grew at record levels, and the construction industry, which increased sharply for the second consecutive year, +4.5% according to US Census Bureau estimates. Considerable signs of improvement were detected in the market following the increase in price of oil. Alongside the United States, the markets in Canada and Mexico recorded good performances given the reciprocity with the USA. In South America, according to the Company s own estimates, the increases in apparent consumption in Colombia and Chile were particularly significant. We should also mention the negative performance of the Brazilian market, the largest in South America, where apparent consumption fell by 5%. 20
107 3.1.3 Africa and Middle East The Acerinox Group was, once again, a leader throughout the continent and especially in South Africa, its most important market. According to our own estimates, in South Africa, the main market on the continent, apparent consumption of stainless steel flat products fell by 8.5%, affected by the country s weak economy, chiefly due to the temporary fall in activity in the mining sector and in the auxiliary industry. Despite this fall, Columbus increased its market share exceeding the pressure of imports. Meanwhile, the evolution of prices in South Africa during 2016 followed a trend similar to the one recorded in the European market although price recovery was lower due to the pressure of Asian prices. The shortage and high prices of electrical energy in the country forced an adjustment of the production schedules, although the factory continued to enjoy many of the benefits afforded by its location near the raw materials. Despite weak local market conditions, Columbus benefited from exports due to the depreciation of the Rand and the improvement of the US and EU economies. These advantages meant that, in 2016, the Company managed to export to 66 countries, seven of them new ones. On the rest of the African continent, due to the sharp rise in the apparent consumption, there were significant developments in Algeria and Morocco, countries where the Acerinox Group considerably increased its presence. In the Middle East we should highlight the United Arab Emirates, where Acerinox recorded a remarkable increase in sales and estimated apparent consumption rose by 10% in
108 3.1.4 Asia In 2016, once again, China was the country with the highest apparent consumption in the world, with around 19 million tonnes and an increase of 15.7% in comparison with In view of the lack of new projects and the continued natural growth of demand in the country, the factories in the area could achieve stabilization between production capacity and market demand in the coming years, reducing the flow of surplus production to the rest of the world. The local market prices followed a similar evolution to the other world markets until the fourth quarter of the year, reducing the difference in price with respect to the rest of the planet. Meanwhile, the main consumption sectors in China evolved very positively, particularly the automotive sector, with a rise of 14.4% according to CAAM estimates, the construction industry, with an upturn of 6.9% according to NBS estimates, and white goods, where production went up by 3.0%, NBS estimates. China remains the driving force of the world growth of stainless steel consumption. The year ended with the inventories of Wuxi and Foshan, the main official markets in the area, at above-average levels, albeit well below the highs recorded in July Meanwhile, throughout the region, tariffs were imposed on trade by means of antidumping and other restrictive import measures which did not favour free trade. Bahru Stainless, the Acerinox plant in Malaysia, was able to increase its market shares in the main Asean markets: Malaysia, Indonesia, Vietnam and Thailand, despite the difficult context and the complex regulations in these countries. The Malaysian factory continued to increase sales as a result of the Acerinox Group s powerful commercial network. In 2016, Bahru sold its products in 38 countries on five continents, complementing its main market (ASEAN) with sales to other strategic points of the globe such as the Middle East. With the help of Nisshin Steel, its Japanese industrial partner, Bahru Stainless began supplying some of the most important Japanese car and motorcycle manufacturers in the area. 22


109 3.2 Global Production of Stainless Steel Following the stagnation recorded during 2015, production in 2016 returned to normal, with increases above 6%. Worldwide production of stainless steel Thousands of tonnes Worldwide steel production reached 45.3 million tonnes, an increase of 8.9% over 2015, according to the ISSF s provisional data. Evolution of global steel production Million tonnes 23


110 After a start to the year when world steel production in the first quarter was similar to that of 2015, growth accelerated and recorded a double-digit increase during the second semester. Production increases were recorded on all the continents, with special mention for China, which has accounted for most of the world growth in recent years. In this country, the rise stood at 13.6% with respect to the previous year, with around 25 million tonnes, accounting for 54% of all the steel produced in the world. Even so, it is particularly interesting that, during 2016, the first closures of stainless steel factories took place in China, in keeping with the policy announced by Beijing. The closure of these plants for environmental reasons was aimed at reducing industrial surpluses and limiting the overproduction the country suffers from. News of possible further closures continues to arrive, in keeping with the above decisions. In the United States, the announcement of the definitive closure of the Allegheny Midland plant in October was particularly significant. 24

111 3.3 Acerinox Group Production 2016 was a good year in terms of production. All the Group s plants increased their production with respect to the previous year. In all, 2.5 million tonnes of steel were produced, together with 2.2 million tonnes of hot-rolled and 1.7 million tonnes of coldrolled products. The latter figure is especially significant, by virtue of being the record for cold-rolling in the entire history of the Group. Meanwhile, the steel and hot-rolling figures are the second highest ever and strengthen the leadership position Acerinox holds on continents such as America and Africa. Bahru, in the development stage, was able to achieve its objectives and increased its production by 18%, gradually enabling it to gain market share in the ASEAN area and, in general, in the Far East, while its consumption of hot-rolled coil led to optimum uses of the respective steel mills in Campo de Gibraltar and South Africa. 25

112 3.4 Excellence Plan The Excellence Plan is a tool to improve manufacturing costs, essentially the variable costs, and stem from a prior benchmarking process applied to all the best practices available in the activities under analysis in the Group s different units. The accumulated savings are consolidated and form the basis of the next plan. They constitute a powerful management and improvement tool, which already forms part of the Group s culture. In 2016, the IV Excellence Plan was completed, covering the years 2015 and 2016, with 74% of the objectives achieved, which represents a recurring impact of 50 million euros per year on the Group s results. 94% of the Plan s objectives were achieved in 2016, together with a record level of competitiveness in the Group s operations, working capital management, supply chain optimization and commercial and personnel management. Other milestones included a reduction of inventories in physical units (6.6%), despite the increases in sales (9.0%) and production (6.7%). At its December meeting, the Board of Directors approved the Company s V Excellence Plan, incorporating new features in several sections. This new plan will be conducted during 2017 and 2018 and envisages a recurring savings target of 50 million euros per year. 26
113 3.5 Investments in Fixed Assets A major Investment Plan was approved in 2015, including a BA-finish bright annealing line and a rolling mill at NAS, as well as the acquisition of a pickling and annealing line and a cold-rolling mill at the Campo de Gibraltar factory. These investments, whose total cost is 256 million euros, will lead to an increase in cold-rolling production capacity and supply to the American market, as well as cost and quality improvements and the manufacture of products with greater added value for our customers in Europe. This ambitious Investment Plan was made possible as a result of the profits generated by the Group s good performance in a complex context for the world stainless steel market. During 2016, the construction of the equipment took place in accordance with the agreed deadlines and budgets, something remarkable in works of this complexity. In January 2017, the first coils at the new rolling mill in the USA began to be cold-rolled, thereby increasing the potential production of NAS, while the start of the bright annealing line is expected for March. During the fourth quarter of 2017, the new annealing and pickling line is expected to begin in Spain, together with the new rolling mill. 27


114 These investments include the latest advances within the framework of the digital revolution, such as high sensitivity equipment, big data, artificial vision and advanced mathematical prediction models. The registered amounts of fixed assets arising from the progressive execution of the approved investments are as follows: 28

115 3.6 Raw Materials The pessimistic production forecasts for 2016 had their logical effect on the prices of the main raw materials, which recorded a clear downward trend at the start of the year. However, the reality of the year did not coincide with the forecasts and the greater demand ended up reversing the trend. OFFICIAL PRICE OF RAW MATERIALS ON THE LME However, prices did not improve sufficiently to encourage the opening of mines and facilities which had closed in previous years, which, with an eye on the good prospects for 2017, has generated a certain degree of fear and moments of unease in some cases with regard to the scarcity of some minerals, such as ferrochrome, as we will see in the following sections, with very large and very sharp rises in prices towards the end of the year. 29

116 3.6.1 Nickel Nickel prices started the year by recording a new low, with levels of 7,700 USD/tonne in early February. This led to cuts in production, as well as the closure of some production plants, although the impact on prices was limited. The main basis for the improvement was the announcement in July and the subsequent execution of an environmental audit in the Philippines on nickel ore producers, which resulted in the temporary closure of some facilities. In the past two years the Philippines has become the main source of minerals for nickel pig iron producers in China. Uncertainty over the future availability of the mineral, coupled with the improvement of nickel consumption worldwide, led to a recovery of the prices quoted on the LME (London Metal Exchange), which stood at between 10,000 and 11,000 USD/tonne until the beginning of November, when they exceeded 11,700 USD/tonne. The end-of-year corrections left nickel prices at around 10,000 USD/tonne. It is estimated that, at these prices, about one-third of producers still cannot cover their production costs. For the first time in five years, world nickel consumption outpaced production, with an estimated year-end deficit of 65,000 tonnes, although the global stock levels of nickel remained high. During 2016 the nickel stock on the LME fell by 69,228 tonnes, ending the year at 372,066 tonnes. This reduction was partially offset by an increase of 45,573 tonnes on the Shanghai Stock Exchange, which ended the year at 93,312 tonnes. Together with the other stocks within the supply chain, it was possible to end the year with an overall stock equivalent to 6 months of consumption, slightly lower than the 7 months recorded at the end of

117 All the metals improved their prices during 2016: zinc rose by 64.9%, followed by copper by 18.4%, nickel by 17.6% and aluminium by 16.9%. The global contracting volume on the LME fell by 7.7%, with nickel being the only metal which maintained the same volume as in 2015, about 124 million traded tonnes, approximately 62 times its annual consumption Ferrochrome There were two clearly different periods for chrome prices in the first and second halves of They started with a fall in the first quarter to 92 US /Lb, driven by the feeling of weak global demand, mainly in China, and fell again to 82 US /Lb in the second quarter. We have to go back as far as 2009 to find such low prices. These price levels, unsustainable for much of the industry, led to a further closure of a South African producer at the end of the first quarter. In the last two years South Africa has lost three ferrochrome producers. The improvement in world demand, as well as China s need to replenish stocks of the mineral for local production, which had recorded historical lows, and ferrochrome, led to a recovery of prices in the second half of the year, with two consecutive rises to 98 US /Lb in the third quarter and 110 US /Lb in the fourth. This situation intensified at the end of the year and the fear of a shortage of material in the short term led to a figure of $165 US /lb in the first quarter of We have to go back as far as 2006 to find similar price values. 31

118 3.6.3 Molybdenum Despite last year s molybdenum production cuts and consumption uncertainty, chiefly caused by the weak recovery of the energy sector, molybdenum prices remained stable at around 5.5 USD/Lb during the first months of the year. The worldwide recovery of steel production and the announcements of new molybdenum production cuts led to a recovery in May, when the price reached an annual high of 8.6 USD/Lb. However, the excess production in China and the lack of confidence in the firmness of consumption led to a correction of prices in the following months. In spite of a slight recovery in prices, due to a stock replenishment prior to the summer period, the trend in prices in the rest of the year was a downward one, ending at levels of 6.5 USD/Lb. These levels remain unsustainable for the vast majority of primary molybdenum producers and only producers of secondary molybdenum, a sub-product obtained from the extraction of copper, can operate at these price levels. 32

119 3.6.4 Scrap Iron Scrap iron prices rose steadily from mid-february onwards, reaching an annual high of 280 USD/tonne in May as a result of the improved global demand for steel, the sharp increase in imports from countries such as Turkey and India and the recovery of iron ore prices. However, following the replenishment of stocks from the importing countries, prices fell in July. The political situation in Turkey, the world s leading importer, as well as the announcement of steel production cuts in China, kept prices stable until mid-october when, owing to the strong recovery of metallurgical coal and iron ore, scrap iron prices increased again, ending the year at around 255 USD/tonne. 33
 had their jobs outside the European continent.")
 and 624 in Asia (9.5%). The number of employees grew slightly at all the large plants, due to the higher levels of production, and remained stable in the different regions in which the company operates.")
120 3.7 Human Capital Working on the purchase and processing of raw materials, steel manufacturing and marketing, deliveries and Group management, Acerinox had 6,573 employees as of 31 December, not including partially-retired personnel. Of the above, more than half (52.2%) had their jobs outside the European continent. Number of employees as of 31 December by geographical locations: Specifically, Acerinox had 3,140 employees in Europe (47.8%), 1,460 in America (22.2%), 1,349 in Africa (20.5%) and 624 in Asia (9.5%). The number of employees grew slightly at all the large plants, due to the higher levels of production, and remained stable in the different regions in which the company operates. Number of employees as of 31 December by group companies: 34
121 More than 90% of the Acerinox workforce was linked to the company by a permanent and full-time contract. The company creates and maintains stable, high-quality work, with professional prospects and international opportunities. They are well-paid jobs full of challenges and opportunities for learning and development. Due to this employment profile and the activity performed by the company, the ability to work in a team and learn is fundamental at Acerinox. The Group particularly values proactive people with initiative and proposals. The thorough knowledge of the steel industry and its processes, the experience accumulated over more than 45 years in the sector and the skills developed for the correct management are the main assets by which the company leads the sector in whole continents such as North America and Africa, achieving very high market shares in many of the most developed economies. To maintain all the above knowledge and to make it available to all the members of the Group, Acerinox conducts very ambitious internal training programmes. In some of them, as an illustration of their ties and feeling of belonging to the Group, retired Acerinox personnel take part as teachers, generously making their knowledge available to the younger generations. The arrival and application of new ideas are also essential for remaining competitive. For the above, for the new, to innovate, to improve and to capitalize on the rapid development of technology, Acerinox needs people who are ready with alert minds. Last year, the Group signed new agreements with universities for joint collaboration in the training of engineers and technicians and for taking advantage of the enormous opportunities offered by the industry for the intensive use of the new digital technologies. These agreements contribute to the training of young professionals and help them in their career development in countries like the United States, Spain, South Africa and Malaysia. The Group entered into agreements with the Universidad Pontificia de Comillas, Universidad Complutense in Madrid, Universidad Politécnica in Madrid, Universidad de Alcalá de Henares, Universidad Carlos III in Madrid, Universidad Rey Juan Carlos in Madrid, Universidad de Cádiz and Universidad de Algeciras, the Louisville School of Engineering, the University of Pretoria and the University of Cape Town. The Group values gender diversity for the creation of value and promotes exchanges between technicians from all its factories and sales offices located in different countries, with the aim of achieving the best practices by means of benchmarking and cultural exchange. 35

122 3.8 R+D+i Investment in new equipment and the modernization of that already in existence, the use of the latest available technologies, the study of improvements in the processes and the development of new types of stainless steel have resulted in an average annual investment of over 180 million euros since 2008 for the Acerinox Group. An investment designed to create new production lines, maintain the existing ones and implement new technological systems so as to increase the manufacturing capacity, improve efficiency and extend the range of final products of its factory. This constant economic and human endeavour is in keeping with the very nature of the Company s activity. Industry is a sector in which remaining the leader at the forefront of activity is only possible by means of study and a daily search for improvement in the processes. This is why many of the world s leading experts in the manufacture of stainless steel form part of the Acerinox workforce and constantly analyse, study, propose and apply improvements in each of the steps of the lines. These advances enable the Group to continue to increase production, reduce costs, expand the range of stainless steels and enhance the technical and mechanical qualities of the material. Among other items, Acerinox assigned a total of 15.6 million euros to the activities of the research and innovation laboratories located in the factories the Group has on four continents. With a view to involving all its employees in this challenge, Acerinox conducts important internal training programmes and each year organizes the Rafael Naranjo Awards, worth 40,000 euros, to reward the best ideas in this field. 36
123 This year the following projects received awards: The first Quality in Progress award went to Juan Pedro Fuentes Martínez from the cold-rolling department, for his work titled Efficiency and savings in the polishing process. This award was accompanied by a prize totalling 15,000 euros. The second Quality in Progress award went to the project titled Method of taper tension operation by Juan Manuel Ocaña Laza from the cold-rolling department, accompanied by a prize totalling 10,000 euros. The third Quality in Progress award went to the work titled System for the cleaning of plasma by Luis Marcos Sánchez Peña from the hot-rolling department, with a prize totalling 5,000 euros. The Safety award, accompanied by a prize totalling 10,000 euros, went to Juan Ricardo Mateos Serrano from the maintenance department, for the project titled: Modification of the location of the receivers of the vertical laser barriers by means of the intercalation of mirrors in the hot-rolling slab furnace. CEDINOX, the Stainless Steel Research and Development Association, held 17 seminars in order to bring the University closer to the different applications of stainless steel, in which 1,139 attendees from different Spanish universities took part. In 2016, Cedinox organized the first Acerinox Award, in which university students from nine Spanish universities took part in projects related to stainless steel. The award seeks to promote knowledge of the applications of this material among young architects and engineers. Acerinox CEO Bernardo Velázquez personally presented the award to the winner, Carlos Sanz San Miguel, an engineering student at the University of Zaragoza, for his final degree paper titled Comparative study of behaviour due to corrosion by chloride ions between stainless steels. At North American Stainless, the Group allocated 6.3 million euros to research tasks, with ambitious projects for the development of new types of steel for high added value applications, improvements in product quality and improvement in production. North American Stainless maintains cooperation and training agreements with the Louisville School of Engineering in Kentucky. In Columbus, two million euros were invested in research and development projects specific to the plant s activity. By means of its training programme, students from the University of Pretoria, in partnership with others from the University of Cape Town, are working on research to improve stainless steel intended for cars. Our researchers create value and innovation for our customers and for society by means of better products and more efficient processes. 37
124 3.9 Digital Transformation One of the keys to Acerinox s success was, and will continue to be, the importance given to innovation and to staying ahead in the industrial technology used in the manufacture of stainless steel. In contrast to the widespread perception that the steel industry is a technologically mature industry, it is actually a sector which makes significant investment in Research and Development, with highly advanced technology in its factories and pioneering techniques applied to its production lines. Within this context, many of the tools contained in the so-called digital transformation, such as the application of artificial intelligence elements, the handling of large amounts of information, predictive maintenance and programmes to improve energy efficiency, have formed part of the culture and approach employed at Acerinox for many years. Acerinox remains attentive to all the social areas in order to maintain its technological leadership. During the year, the Group was involved in all kinds of entrepreneurial, institutional, sectoral and academic forums and associations, acquiring new ideas and knowledge related to the so-called Digital Transformation. With the above in mind it will study how to update and enhance the areas of digitization, sensorization and connectivity by means of new technologies related to industry, information and communications. Last year, Acerinox also joined the Universidad Pontificia Comillas ICAI-ICADE University in order to initiate the Chair in Connected Industry, with a view to studying the opportunities for Spanish industry and the economy offered by the so-called Fourth Industrial Revolution. The activities of the Research and Development programmes conducted at each of the plants undertake projects which use the new tools available for improving the production processes and our steels. The following projects in this field have already been implemented at our factories 1. The SiMoDiM project is designed for the predictive maintenance of the industrial machinery used in the hot-rolling process: Acerinox is experimenting with a predictive analytics system which will allow it, in real time, to capture, manage and process large amounts of data by means of intelligent sensors, Big Data techniques and neural networks. 2. System for the detection of the status of the refractory of the blast furnace: An implemented project which combines an X-ray meter and a robot which identifies the location and seriousness of the breakdowns of the hot refractory, automatically proceeding to its repair. 38
125 3. The detection of mill scale by DECAREX, which continuously locates the mill scale present on the surface of the material by means of a camera system and enables conditions of the pickling process to be altered in order to eliminate these defects. 4. Ausinox is targeted at obtaining austenitic stainless steels with minimum inclusion content from the development of new advanced simulation models in the steelworks processes. 5. Ferrinop is focused on the experimental development of new advanced technological solutions for the manufacturing of ferritic stainless steels optimized through the analysis and control of oxidation by means of identification of the origin of the micro cracks which cause it. 6. The Horus Project seeks to obtain a new design of the reheating oven. It focuses on the installation of new cameras inside the over in order to know the temperature of the slabs and, therefore, their thermal evolution. This information will be used to optimize the hot-rolling process. 7. Ultraslim is a project of which its objective is to develop an austenitic stainless steel of fine grain size to increase the mechanical properties for the automotive industry. Acerinox has also developed an action plan in the Group s Information Systems with the following objectives: Unification of the computer platform in all its units, as well as the applications which manage the main business activities - commercial, financial, costs and production - and support activities - warehouses and maintenance. Management of communication to guarantee the sending of information between the different units with full security. The use of these tools currently enables the Company to make rapid business decisions, serving as a basis for undertaking future projects. 39
126 3.10 Risk Management The Board of Directors, at its meeting held on 15 December 2015, approved the Risk Control and Management Policy of Acerinox, S.A. and its Group of Companies, in which it establishes the basic principles and general framework for the control and management of the risks of all kind faced by Acerinox and its Group of Companies. Through the General Risk Control and Management Policy, the Board of Directors establishes the basic mechanisms and principles for the adequate management of risks and opportunities, with a level of risk which enables it to: Achieve the strategic objectives determined by the Group. Provide full guarantees for the shareholders. Protect the Group s results and reputation. Defend the interests of the shareholders, customers, other groups interested in the progression of the Group and society in general. Ensure business stability and financial solidity in a sustained manner over time. Acerinox has implemented a Risk Management Model, promoted by the Senior Management and designed to identify, classify and assess any potential events which may affect the organization s relevant units and functions, with the ultimate aim of managing the risks and providing a reasonable level of security with respect to achieving its objectives, whether they be related to strategy, operations, compliance or information. Acerinox is aware of its exposure to a series of uncertainties which are unique and inherent to the industrial sector in which it operates, chiefly characterized by volatility in terms of its most important indexes and values, which can affect both the financial and the non-financial results. Acerinox's Main Risks Financial risk This is normally defined as a lack of liquidity, restricted access to funding sources, increasing funding costs, volatility of exchange rates, volatility of interest rates and credit risk. The Group s financial strength has increased this year, with an improvement in its financial indicators. Similarly, the credit risk indices remain at very acceptable levels, with an increase in sales and without missing out on any business opportunities. Raw Material Price Volatility The production of stainless steel requires considerable amounts of raw materials (mainly nickel, chrome and molybdenum, etc.). The price of nickel, which is listed on the LME (London Metal Exchange), is subject to the volatility of the financial markets, which has a direct effect on the apparent consumption of stainless steel. The fundamental parameters which govern the sector stabilized throughout 2016, especially the price of nickel, contributing to an improvement in expectations. 40
127 Overcapacity This risk envisages a global excess of installed capacity, resulting in lower prices. The stainless steel industry is affected by global production capacity and fluctuations in imports and exports. Global production capacity has increased considerably, particularly in China, which is currently the world's largest stainless steel manufacturer by a large margin. We are witnessing surplus reductions during the year, with closures of facilities in major markets, including China, which, if this trend is maintained in the mid term, will give rise to a more balanced relationship between installed capacity and consumption. Economic crises and cycles The demand for steel products is directly related to the global economy s fluctuations. These circumstances produce imbalances between supply and demand and have a significant impact on prices. The complex global political and economic situation will remain a risk for the developed and emerging economies. Competition The stainless steel market is characterised by a high level of competition, which leads to price reductions in order to increase or maintain market share on a global scale. Regulatory risks The Acerinox Group s significant presence on the international stage means that it carries out its activities in a number of different countries, under different and sometimes contradictory regulatory frameworks and in different business areas within the stainless steel sector. In mid-2015 Acerinox launched a regulatory compliance programme which enables it to achieve higher levels of assurance in all areas - regulation, compliance and corporate governance, raising the levels of transparency with all its stakeholders. 41
128 3.11 The Acerinox Group s Individual Companies ACERINOX EUROPA In 2016 the steel production of the factory was 827,715 tonnes which represents an increase of 1.1% compared to The year began at the Campo de Gibraltar plant with the announcement of a significant investment of 140 million euros for the construction of an annealing and pickling line and a new cold-rolling mill, as well as civil work and auxiliary equipment necessary for the functioning of these large facilities and the means to optimize the factory production, improve the quality of its products, reduce costs and reduce the environmental impact. The construction work for this equipment took place during the year and it will be able to start operation and join the plant s production line towards the end of Market conditions in 2016 led to a sharp price rise based on greater demand, the increase in the activity of industries which require stainless steel and the restrictions on the imports of this material imposed on China and Taiwan on the continent. The European Commission imposed anti-dumping measures against imports from China and Taiwan, which reduced the distortions caused by the entry of material from these countries at below-market prices. Despite the announced measures, imports into the European Union remained at 23% of the market, due to the replacement of the imports from the affected countries with those from other Asian countries. Although the imports eventually stayed at a similar level, the anti-dumping measures contributed to stabilizing prices, as the new importers which substituted China and Taiwan were private companies from market economy countries. Europe in general and Spain in particular recovered during the year and the improvement of the economy had a considerable impact on the increase in product margins. Our factory also benefited from the fall in electrical energy prices in Spain, although it remained at a disadvantage in comparison with the competing neighbouring countries. NAS In 2016 the steel production of the factory was tonnes which represents an 8.0% increase compared to North American Stainless began the year with a complex market situation due to the low prices with which it ended 2015, considerably lower than those of Europe due to the strong imports from China. From then onwards, the market entered a stabilization process leading to a rise in base prices and allowing an increase in factory production, which exceeded that of the previous year by 10%. Even so, by the end of the year prices had not reached the level 42
129 at which they began 2015 and, on average, they were lower than those of the previous year. Despite the above-mentioned recovery and the stabilization of the market conditions, the 2016 results were affected by the difficult start to the year and, in spite of the good second semester for NAS, they were lower than those recorded in Two external factors were decisive in the normalization of the conditions in America. Firstly, in June 2015 the US Department of Commerce announced provisional protective measures against China s unfair imports of cold-rolled stainless steel products. Subsequently, in October, Allegheny Technologies Inc announced the closure of its Midland plant, which reduced installed capacity in the USA. The start-up of the new BA-finish bright annealing line and the cold-rolling mill, in which the Company is investing more than 120 million dollars, will lead, in early 2017, to an increase in the Group s production capacity and an expansion of its range of final products. The launch of the new lines and the consolidation of market conditions allow for a certain degree of optimism in COLUMBUS In 2016 the steel production of the factory was 582,001 tonnes which represents a 13.1% increase compared to The first half of the year was affected by the steady decline in the price of raw materials and the final prices of the finished products. Under these conditions, the good management of stocks and good use of the competitiveness generated by the depreciation of the rand, the local currency, together with the plant s proximity to the producers of raw materials, allowed it to achieve praiseworthy results in a difficult year, during which the Columbus Stainless plant made a profit every month. During the second half of the year, Columbus was unable to benefit from the slight but constant increase in the price of the raw materials. However, the improvement of the market conditions resulted in a considerable uptick in production in the different plant workshops, accompanied by higher volume and amount of sales. The South African subsidiary suffered from a rise in the price of electrical power, a trend affecting the whole country. Columbus offset the restrictions by intensifying the use of liquid ferrochrome and concentrating the plant s hours of peak activity during the night shift, thereby preventing any loss of production. The rising cost of electrical power is having a negative impact on the competitiveness of Columbus and South African industry in general. 43
130 BAHRU In 2016 the cold-rolling production of the factory was 169,422 tonnes which represents an 18.9% increase compared to Bahru Stainless displayed a positive EBITDA during the second half of the year, allowing it to end it with a net contribution to the Group totalling 19 million euros, as a result of the contributions of the EBITDAs of the other Group companies resulting from the supply of black coil. In a difficult and aggressive market environment, owing to the Chinese producers need to transfer a large part of their overproduction to areas where this was possible, Bahru Stainless ended the year with an EBITDA almost in breakeven. The application of barriers to Chinese imports in Europe and the United States, while benefiting other Group productions, hindered activity in Southeast Asia. In recent years the increase in the supply generated by China has led to a fall in prices in the area, from which it has yet to recover. Moreover, as this factory is located further from raw material suppliers, it needs greater stocks, as a result of which their fall in price is particularly punishing. Even so, Bahru managed to have a good year. The collaboration with its Japanese partners at Nisshin Steel in the development of new customers was especially productive and there were notable increases in sales in Asia. As a result of this joint work Bahru was able to export to 38 countries, 17 more than in the previous year. Together with the above, the Company increased its market share in the Middle East, capitalizing on its enormous potential. ROLDÁN AND INOXFIL The results at the factory in Roldán (Ponferrada) underwent a positive evolution during 2016, recovering from losses during the first half of the year to making profits in the second, with two consecutive quarters with gains. Sales were slightly lower than in 2015, due to the fall in bar products, although the increase in rolled products was significant. Production also went down in comparison with the previous year. In 2016, the Roldán plant also collaborated in the production of the Campo de Gibraltar factory with the processing of more than 100,000 tonnes of billet. Inoxfil achieved production totalling 10,000 tonnes and a net positive result in The plant is also developing a strategy of product and service excellence for the improvement of its processes. 44
131 3.12 Relevant events since the end of the year Since the end of the financial year and as of the date of the publication of this report, the following significant events have occurred: On 2 February the US administration ratified the anti-dumping measures provisionally approved in 2016 against several stainless steel manufacturers from the People s Republic of China. Among them, it affirmed antidumping duties ranging from 63.86% to 76.64% on the imports, and anti-subsidy rates ranging from 75.60% to %. NAS has begun rolling with its new equipment. In 2015 the Board of Directors of Acerinox SA authorized further investments to be made at the Group s factory in Ghent (Kentucky/USA), designed to increase the capacity of NAS to produce 2B and BA-type cold-rolled coils. The first tests and the start-up of the new equipment took place in February, and production is expected to rise as these six months progress in terms of both quality and quantity. 45

132 4. Financial Report The profits after taxes and minority interests, 80 million euros, were 87% higher than in the previous year. The quarterly evolution was very favourable once the prices of raw material prices stabilized, as a result of the gradual improvement of the market conditions in the United States and Europe, where apparent consumption rose by 7% in both cases. Quarterly EBITDA As shown in the chart, the sharp drop experienced in the second half of 2015 was overcome, with the EBITDA/sales margins rising from 4% to 10% in the second half of Most significant Acerinox figures The net turnover, 3,968 million euros, was 6% lower than in the previous year, despite the 9% increase in the number of tonnes sold. The main reason was the lower price of stainless steel mainly due to the decrease in Nickel price. In 2016 (according to Platts) the average price of the AISI 304 coil fell by 18% in the United States, by 11% in Europe and by 10% in Asia compared with the average price in
 and the higher")


133 Geographical Distribution of Acerinox Revenue in 2016 Despite the production levels achieved (+7% higher than in 2015) and the higher number of tonnes sold, the operating expenses, totalling 577 million euros, were slightly lower than in the previous year, personnel costs increased a little, by 2%, and amortisation rose by 4%, due to the investments at Bahru Stainless. The reduction of 33% in net financial costs is especially noteworthy. 47


134 The pre-tax result, 128 million euros, was 66% higher than in the previous year. The post-tax profits, 80 million euros, increased by 87%. With regard to the main balance sheet items, there was an increase of 172 million euros in tangible fixed assets in the course of the year. The working capital increased by 4 million euros. Inventories at the end of the year fell by 25,000 tonnes, although their value rose by 62 million euros due to the appreciation of Nickel; the evolution of customers and suppliers reflected the improvement in market activity. The net financial debt, 620 million euros, fell by 91 million euros. The treasury, standing at 598 million euros on 31 December, will enable the Company to meet the debt maturities for the next 3 years. 48

135 In May, Acerinox reached financing agreements with 12 banking entities for a total amount of 717 million euros. With these new contracts, the Group extended its debt maturities until 2021, reduced interest rates, moderated payments for the next three years and added new institutions to its banking pool. The above enabled it to procure favourable financing conditions and reduce the cost of the debt, without covenants. On 30 June, the 135 million dollars pending from the syndicated loan principal in the United States, whose maturity was set for 17 February 2017, was paid in advance. At the end of 2016, Acerinox held valid credit lines worth 1,819 million euros, 33% of which were available for use. Evolution of the net financial debt Millions of euros The cash flow from operating activities amounted to 269 million euros. The cash flow after investments was positive, standing at 111 million euros, after having made investment payments totalling 156 million euros. The shareholder remuneration was performed as in previous years, by means of a scrip dividend, with 23% of the shareholders opting for cash. Thus, the remuneration paid to the shareholders totalled 27 million euros. 49

136 Abbreviated status of cash flows Millions of euros 50
137 In relation to the information to be included in the Annual Report by implementation of the Resolution of 29 January 2016 of the Institute of Accounting and Account Audits (ICAC), the average period for payment to suppliers of the Spanish companies which form part of the Acerinox Group, and after excluding payments made to companies of the Group, is as stated below: Avarage period for payment to suppliers 73 days 79 days Ratio of paid transactions 77 days 82 days Ratio of outstanding transaction payments 49 days 45 days (Figures in thousands of euros) Amount Amount Total payments made Total outstanding payments This table includes the payments made to any supplier, whether nationally and internationally and excludes companies of the Group. The same figures, including national suppliers only, would be those detailed below: Avarage period for payment to suppliers 66 días 68 días Ratio of paid transactions 69 días 70 días Ratio of outstanding transaction payments 51 días 54 días (Figures in thousands of euros) Amount Amount Total payments made Total outstanding payments Alternative Performance Measures (definitions) Savings related to the Excellence Plans: estimated efficiency savings on the basis of the study defined for each Plan Operating Working Capital: Inventories + Customers - Trade payables Net Cash Flow: Result after tax and minority interests + amortisation Net Financial Debt: Interest-bearing loans and borrowings + bond issue - cash EBIT: Operating income EBITDA: Operating income + amortisation + provisions ROCE: Operating Income / (Equity + Net financial debt) ROE: Result after taxes and minorities / Equity Net financial expenses: Financial income - financial costs ± exchange rate differences Debt Ratio: Net Financial Debt/Equity 51

138 4.1 Evolution of shares The Ibex 35, the main reference index of the Spanish stock market, ended 2016 in the red, with a loss of 2.01%, in a very difficult year due to the numerous socio-political uncertainties encountered by investors. At no point in the year did the Ibex manage to exceed the level at the beginning of the year and it experienced its worst moment on 27 June, just after the United Kingdom s No to the EU, when the index fell by about 20% (since the beginning of the year). It later displayed a significant reaction capacity and only lost 2% by the end of the year. This decline can be added to that of 2015, during which the IBEX 35 closed with losses totalling 7%. Evolution of the IBEX 35 Daily data in EUR In Europe, the British FTSE 100 recorded a 14.43% rise in 2016 and even reached a historic high of 7, points. These increases, despite Brexit, were due to the strong influence of the mining companies and the depreciation of the pound, which favoured the listed export companies. The other continental indexes registered losses almost all year, although the appreciations recorded in December, following the American elections, enabled the German DAX and the French CAC to close with respective increases of 6.87% and 4.86%. 52

139 The US markets, on the other hand, registered positive figures from March onwards and the year ended with a 13.42% rise in the Dow Jones, 9.54% in the S&P 500 and 7.50% in the Nasdaq. The market was also attentive to the central banks. The Federal Reserve was expected to raise interest rates in The postponement of these rises following Brexit and the good economic data led to an increase in confidence among the investment community. In 2016 the share trend changed with respect to the performance in the previous year. The year s low was set in the initial weeks when, on 20 January, it closed at 7.2 euros/share, while, at the end of the year, a high was reached on 15 December, with a figure of 13.2 euros/share. This represents an 85.9% appreciation from low levels. Acerinox is one of eleven Ibex securities which ended the year with an appreciation of more than 10%. In fact, it was the index security with the second greatest appreciation in Market evolution of Acerinox and the Ibex 35 Daily percentages, 2016 At the end of the year, 58% of analysts recommended buying set against 12% who recommended selling. In 2016, Acerinox shares were traded for the 257 days the Continuous Market was open for business. The total number of shares traded totalled 487,243,138, equivalent to 1.76 times the number of shares which make up the share capital, with average daily trading of 1,895,887 shares. The volume traded in 2016 totalled 5,057 million euros, a figure which which represents a daily average of 19,686 million euros. 53

 Market capitalization of")
140 Shares and volume traded 4.2 Capitalization On 31 December 2016, Acerinox s market capitalization totalled 3,480 million euros (39% higher than in 2015) Market capitalization of Acerinox, S.A. Millions of euros 54

 For the fourth consecutive year, the General Meeting decided to make a scrip dividend available to shareholders, in view of the success of")
141 4.3 Shareholder Remuneration The General Shareholders Meeting held on 9 June 2016 approved the payment of a scrip dividend up to a maximum amount of 120,018, euros, equivalent to the approximate sum of 0.45 euros per share. This amount is the same as the one the company has offered shareholders since 2007, despite the difficulties of this period. Annual shareholder remuneration (euros / share) For the fourth consecutive year, the General Meeting decided to make a scrip dividend available to shareholders, in view of the success of the operation in the previous three years. In 2016, shareholders representing 77.21% of the share capital also opted to acquire new shares. The rate applied was 1 new share for every 22 shares already held. 55

142 On 22 July 2016, the 9,360,150 new shares resulting from the capital increase of the scrip dividend approved at the General Meeting were admitted to official trading on the Madrid and Barcelona Stock Markets through the continuous market. Shareholders who chose to subscribe to shares with their free allotment rights saw their number of shares increase by 4.55%. During recent years, the share remuneration has increasingly been the option preferred by our shareholders. The scrip dividend of recent years and the uptake of the option by shareholders in the last four years are summarized in the following table: 56
143 5. Corporate Governance and Compliance The Acerinox Annual Corporate Governance Report corresponding to the 2016 financial year forms part of the Management Report and, when the annual accounts have been published, it will be available for consultation on the web page of the National Securities Market Commission and the Acerinox web page. In 2015, the Acerinox Group, via its listed parent company, Acerinox, S.A., began the major process of adapting its corporate governance to the provisions of the recent Spanish Capital Companies Act, as well as to the recommendations made in the new Corporate Governance Report for Spanish Listed Companies. These changes have essentially involved improvements in the Group s corporate governance, mainly thanks to the strengthening of the role of the Board of Directors committees, with more clearly defined responsibilities and a higher number of independent board members on them. The Board of Directors also decided to set in motion all the procedures designed to meet the highest number of the Recommendations detailed in the Corporate Governance Report in the shortest time possible. Details of said levels of compliance can be found in the Annual Corporate Governance Report hosted on our website at In 2016, in keeping with the above, the articles of the Board s Regulations were modified to establish that the majority of the members of the Audit Committee should be Independent and the number of Boards on which our Board Members can sit should be limited. Moreover, during 2016, all the Company s general policies were approved and can now be found on our website. The most relevant events which occurred in 2016, are listed below. Modifications to the Regulations of the Board of Directors Despite its recent nature, the Capital Companies Act has already undergone several amendments. The most significant one, as far as Acerinox is concerned, is the need for the majority of the members of the Audit Committee to be independent board members. Although it was possible to envisage the above in the original wording of the Regulations of the Company s Board of Directors, it was not formulated as a requirement, as a result of which it was necessary to modify the recent Regulations to establish it clearly and accurately. Once the amendment had been performed, it became necessary to restructure the Commission to reflect the majority. This was done immediately and the Audit Committee currently consists of a single proprietary director. 57
144 Compliance with the recommendations of the Code of Good Governance. From the beginning, the Company made a great effort to comply with the greatest possible number of recommendations, following the entry into force of the new Unified Code of Good Governance, an objective it achieved. To do so it made a series of decisions of great importance. The first one was to make a commitment to ensure that, by 2020, at least 30% of the members of the board would belong to the less represented gender. The Company has also acted accordingly and prioritized the search for suitable candidates for the appointments of Independent Board Members made since that date. The second decision approved was to broadcast the General Meeting in real time. This was done for the first time in 2016, with great success in terms of quality and fidelity of reproduction. Similarly, two new items were added to the agenda of the Meeting, of a non-binding nature, so that the Chairman would be accountable and explain to the attendees the level of compliance with the recommendations of good governance and the modifications made to the regulations of the Board of Directors explained above. Approval of the policies advocated by the Code of Good Governance and the Capital Companies Act Between December 2015 and October 2016, the Board of Directors, following a report by the Appointments, Remuneration and Corporate Governance Committee, approved eight general policies which, in the future, will define the orientation, slant and general guidelines of the Company and its Group of companies in the following matters, corresponding to their title and content: - General Policy for Selection of Acerinox, S.A. Directors - General Policy of Corporate Social Responsibility of Acerinox, S.A. and it s Group of Companies - General Policy for the Remuneration of Acerinox, S.A Directors - General Policy for Risk Management and Control at Acerinox, S.A and its Group of Companies. - General Policy for Communication and Contact with Shareholders and Investors of Acerinox, S.A. and its Group of companies. - Tax Policy of Acerinox, S.A and its Group of Companies. - General Corporate Governance Policy of Acerinox, S.A. - General Treasury Stock Policy of Acerinox S.A Due to their general interest, these policies are available on the Company s website so that they can be viewed and compared by any interested party. Prevention and compliance model At the last session held in 2015, the Board of Directors approved the prevention and compliance model bringing together and governing all the actions of the Spanish companies of the Acerinox Group. A Chief Compliance Officer was appointed at the same session. The above Model, which was implemented during 2016, meant the 58
145 appointment of prevention and compliance officers in all the Spanish units of the Group, as well as the analysis of compliance risks and their respective preventive measures. In order to support the Chief Compliance Officer in his role, a Committee made up of specialists in the field was appointed, with the presence of the financial, legal and internal audit departments. Market Abuse The entry into force in July of Community regulation 596/2014 had significant consequences for Acerinox. Firstly, given the greater conceptual and time-based rigidity of the prohibitions on operating in the market applying to companies which hold proprietary directors in others, two proprietary members of the Board of Directors chose to resign from it, although their principal decided on - and announced - the maintenance of their stake in Acerinox. Secondly, the new Regulation and its development regulations underlined the need to update the internal regulation governing the performance of Acerinox and its board members and directors in the stock markets. The regulation then in force, dating back to 2004, needed updating to include the new requirements and, at the same time, to provide greater certainty for those interested in their actions and an authorization and registration system suitable for the new parameters. To achieve the above, the Board of Directors replaced the Code of Conduct in matters related to the stock market with a new one, together with its annexes. The new standard, Internal Code of Conduct, was sent to the National Securities Market Commission and published on the Acerinox website. As a result of its entry into force, the Company created the appropriate records and demanded the declarations of knowledge and compliance envisaged in it. Code of Conduct In 2009 the Board of Directors approved an initial Code of Conduct for the Group companies. Even though it was a fully valid and useful regulation, the Board suggested introducing new subjects into it which had not been covered in the original version. The above, together with the desire to take advantage of the review to turn the Code of Conduct into a regulation which would also serve as a basis for the regulatory compliance and crime prevention system, in accordance with the patterns established in the Prevention Plan approved at the end of 2015, meant that the systematic and qualitative changes were greater than those initially envisaged when initiating the new wording. The new Code, which was announced by the Appointments, Remuneration and Corporate Governance Committee and approved by the Board of Directors, clearly distinguishes between the axiomatic principles of the system, the fundamental standards grouped in accordance with the conducts whose breach could be subject to reproach by the jurisdiction and the procedural or adjectival provisions which, in the first instance, must monitor and ensure its fulfilment. The geographical spread of the companies of the Acerinox Group around the world made it necessary to pay particular attention to the rules of validity of this Code, which logically cannot ignore the existence of specific requirements in several countries in 59
146 which the Group operates. This Code is therefore a higher standard for the internal purposes of Acerinox but respects the existence and validity of specific regulations in countries where it is necessary to enact ethical standards of a nature similar to the Group Code. The bodies and functions of social or ethical committees in the companies where they are already established are also maintained, without detriment to the need for a report to be established for reasons of the coordination and control of the corporate policies. As in the previous cases, this new Code of Conduct can be found on the Acerinox website. Board Member Portal The growing need for transparency, agile management and the rapid and constant flow of information which characterize the governing bodies of a company with such a strong international component requires the constant improvement of the internal communication channels. This issue is particularly relevant when it involves ensuring the quality and speed of the information within the governing bodies themselves. The recent standards and the most reputable recommendations postulate a constant improvement in the channels of communication and the decision-making of boards of directors and their committees. For several months, studies have been conducted on how to improve and streamline the channels of interaction between the company and its directors, choosing, following the inevitable search and selection process, a digital platform which favours the above purposes and optimizes the reception of information, its classification and its subsequent search, while offering high standards of reliability and security for users. This project, called Board Member Portal, began in the second half of the year so as to completely replace paper correspondence from 1 January 2017 onwards. Change of auditors The 2016 General Shareholders Meeting, at the proposal of the Board of Directors, approved the appointment of PricewaterhouseCoopers Auditores, S.L. as the auditor for 2017, 2018 and 2019, for the purpose of the review and legal audit of the financial statements of Acerinox S.A. and its Consolidated Group. At the same meeting, it was also agreed to appoint KPMG Auditores, S.L. to perform the review and legal audit of the financial statements of Acerinox S.A. for
147 Changes in the Board of Directors The following changes occurred on the Board of Directors in 2016: - José Ramón Guerediaga Mendiola resigned from his position as Independent Director on the occasion of the General Meeting held on 9 June 2016, having completed the four-year term for which he was appointed. He could not be reelected, having reached the maximum age allowed in the articles of association and in the Board Regulations on re-elections and appointments. In order to replace Mr Guerediaga, the General Meeting appointed Laura Abasolo García de Baquedano as an Independent Director. - Óscar Fanjul Martín resigned from his position as Proprietary Director at the Board Meeting held on 27 July 2016 on a voluntary basis, as a result of the recent entry into force of Community Regulation 596/2014 and the limitations it introduces for operating with shares in investee companies which have proprietary directors in them. The position of Mr Fanjul Martín on the Board has not been covered on the date of publication of this report. - Diego Prado Pérez-Seoane resigned from his position as Proprietary Director at the Board Meeting held on 27 July 2016 on a voluntary basis, as a result of the recent entry into force of Community Regulation 596/2014 and the limitations it introduces for operating with shares in investee companies which have proprietary directors in them. The position of Mr Prado Pérez-Seoane on the Board has not been covered on the date of publication of this report. - Javier Fernández Alonso resigned from his position as Proprietary Director at the Board Meeting held on 21 December 2016, due to taking on other professional responsibilities within the Alba Financial Corporation. In order to replace Mr Fernández Alonso, Tomás Hevia Armengol was appointed as Proprietary Director of Acerinox by co-optation at the Board Meeting held on 21 December
148 5.1 Share Capital At year-end 2016, Acerinox s capital stock totalled 69,016, euros, divided into 276,067,543 shares, each with a nominal value of 0.25 euros. On 22 July 2016, a total of 9,360,150 new shares of Acerinox, S.A. were floated on the Madrid and Barcelona Stock Exchanges as a result of the capital increase approved at the Ordinary General Shareholders Meeting held on 9 June 2016, held to set up the scrip dividend system. All the shares are listed on the official stock markets in Madrid and Barcelona and are traded on the Continuous Market. As of 31 December 2015, Acerinox had a total of 33,595 shareholders. 5.2 The Board of Directors and its Committees MAIN GOVERNANCE BODIES: THE BOARD OF DIRECTORS AND OTHER EXECUTIVE BODIES The Board of Directors The Board of Directors is the body responsible for directing, administering and representing the Company, without prejudice to the powers conferred on the General Shareholders' Meeting. The Board has three committees: the Executive Committee, the Appointments, Remuneration and Corporate Governance Committee and the Audit Committee. As of 31 December 2016 the Board of Directors was made up of 13 members, given that, after the General Shareholders Meeting, the resignations of two Proprietary Directors took place. These positions were still to be covered at the end of December. The Secretary does not qualify as a Member of the Board. Its composition responds to the traditional principles of diversity and balance. The company only has one executive director - namely the CEO - and has six proprietary directors and six independent directors, one of them being the Chairman of the Company. All Board members have extensive professional experience in the business and academic worlds, and public administration. The Council reflects the diversity existing in the Group: four of its components are of foreign nationality and come from three different continents. In 2010, the company, in keeping with the best practices of Good Governance, decided to separate the positions of Chairman of the Board and of the General Meeting from the responsibilities of the Chief Executive Officer, the organisation s top executive. Pursuant to the Capital Companies Act, the General Shareholders Meeting held on 9 June 2016 approved the Remuneration Policy for Acerinox Directors for 2016, 2017 and 62
149 2018, with the favourable vote of 88.41% of the shareholders who attended the Meeting. In line with this transparency policy, the Group made public that, in 2016, all the remunerations arising from the Board Members belonging to and attending the Board of Directors and its committees totalled 1,256,202 euros during the year (excluding the amounts paid to the CEO as a salary for his managerial position). For more information on this subject, you may review the Annual Corporate Governance Report and the Report on the Remunerations received by Board Members ( The General Shareholder Meeting held on 9 June 2016, on the motion of the Board of Directors, agreed to re-elect the following Board Members for a period of four years, as established in the Articles of Association: - Óscar Fanjul Martín, as External Proprietary Director representing Feynman Capital, S.L. (Omega Capital) who later resigned as already mentioned in the section on changes in the Board of Directors. - Braulio Medel Cámara as External Independent Director. Similarly, the General Meeting of Shareholders, at the proposal of the Board of Directors, agreed to appoint Ms Laura Abasolo García de Baquedano as Director. This appointment was made to cover the Board Member vacancy left by Mr José Ramón Guerediaga Mendiola, who resigned from his position due to having reached the age limit established in the Articles of Association to be re-elected. In total, the Board of Directors held eight meetings in The Executive Committee The Board of Directors appointed an Executive Committee in 2008 to attend to the normal course of business and facilitate its regular monitoring. This body, which has proportions of proprietary and independent directors similar to those of the Board of Directors, is presided over by the Chairman of the Board. The CEO is necessarily a member of the Executive Committee. In order to facilitate transparency and communication among the governing bodies, the Company s rules empower the Chairman to propose to the full Board the ratification or further deliberation of any matter discussed or decided on by the Executive Committee. The increase to eight in the number of sessions of the Board of Directors, following the recommendations of good governance, meant a corresponding reduction in the number of meetings of the Executive Committee, which met three times in
150 The Audit Committee This Committee met in 2016 on a total of eight occasions, allowing it to develop its planned work schedule and fulfil its main responsibilities, involving: - Reporting on the annual, biannual and quarterly accounts. - Supervising internal audit services and the effectiveness of the company's internal monitoring and risk management systems. - Supervising the process of preparing and presenting the regulated financial information. - Proposing to the Board of Directors the appointment of the accounts auditors, to be approved by the General Shareholders' Meeting. The Audit Committee is chaired by an Independent Director, while the Secretary of the Board of Directors acts as its secretary. Appointments, Remuneration and Corporate Governance Committee It held five meetings during It continued with its initiative of previous years of proposing the maintenance of the remunerations of the Board Members, without any changes, to the Board of Directors, by means of the Board Member Remuneration Policy. It was also involved in setting the remunerations of the senior management. Similarly, it informed the Board of Directors of the re-election of the Proprietary Director Óscar Fanjul Martín, proposed that of Independent Director Braulio Medel Cámara and performed the selection and proposed the appointment of Laura Abasolo García de Baquedano as Independent Director. It also announced the appointment of Tomás Hevia, having made sure that he met the requirements necessary for the position. This Committee coordinates, at the request of the Chairman of the Board, the assessment of the Board's performance. The Appointments, Remunerations and Corporate Governance Committee is chaired by an Independent Director, and the Secretary of the Board of Directors acts as its secretary. 64

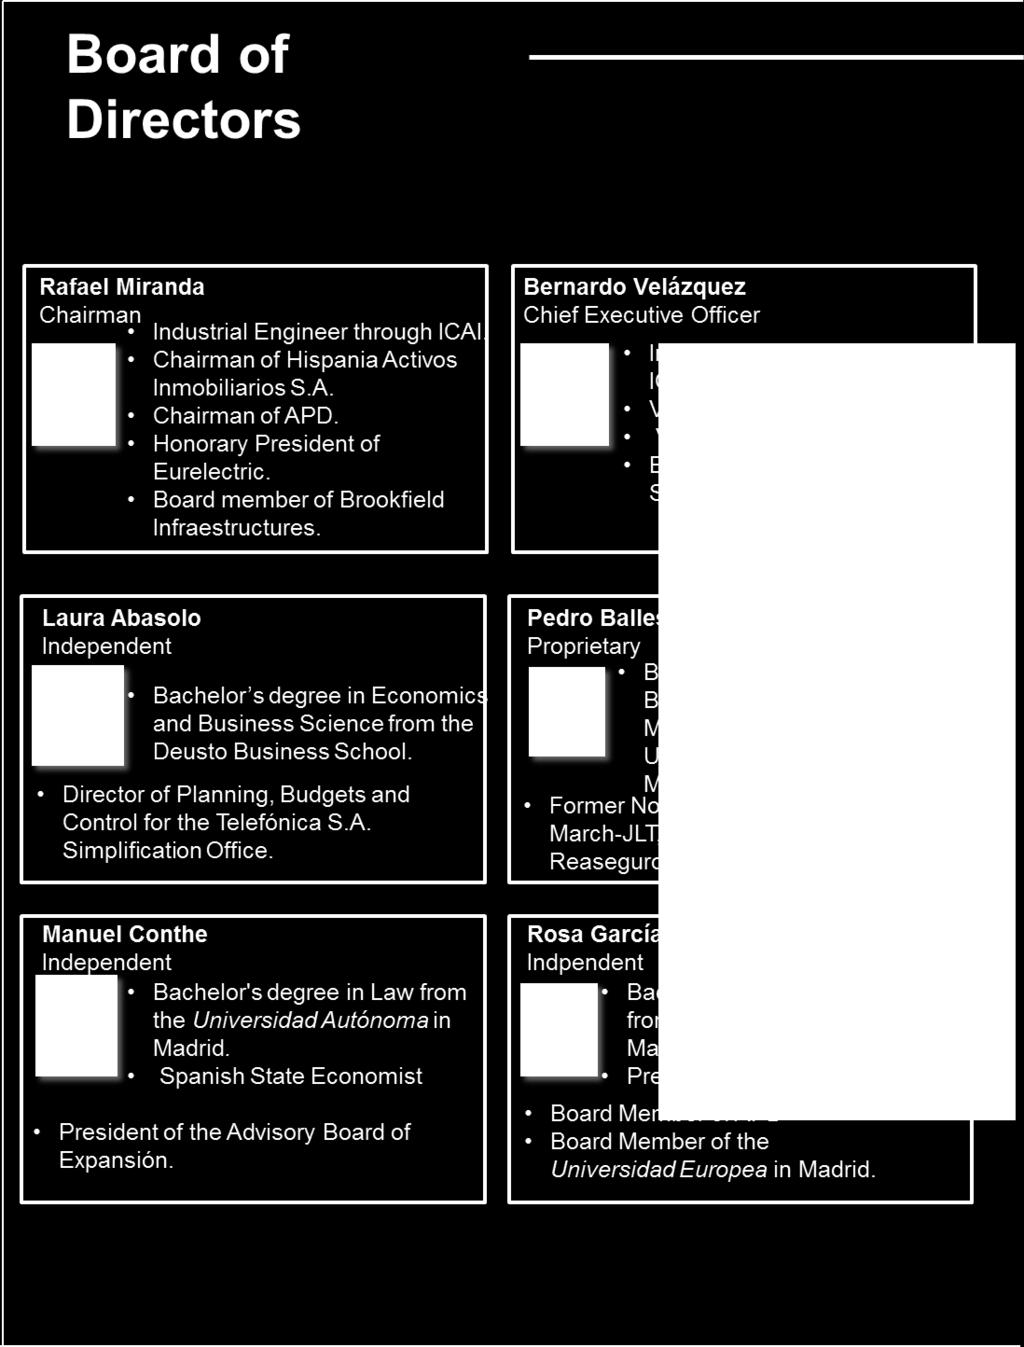
151 65
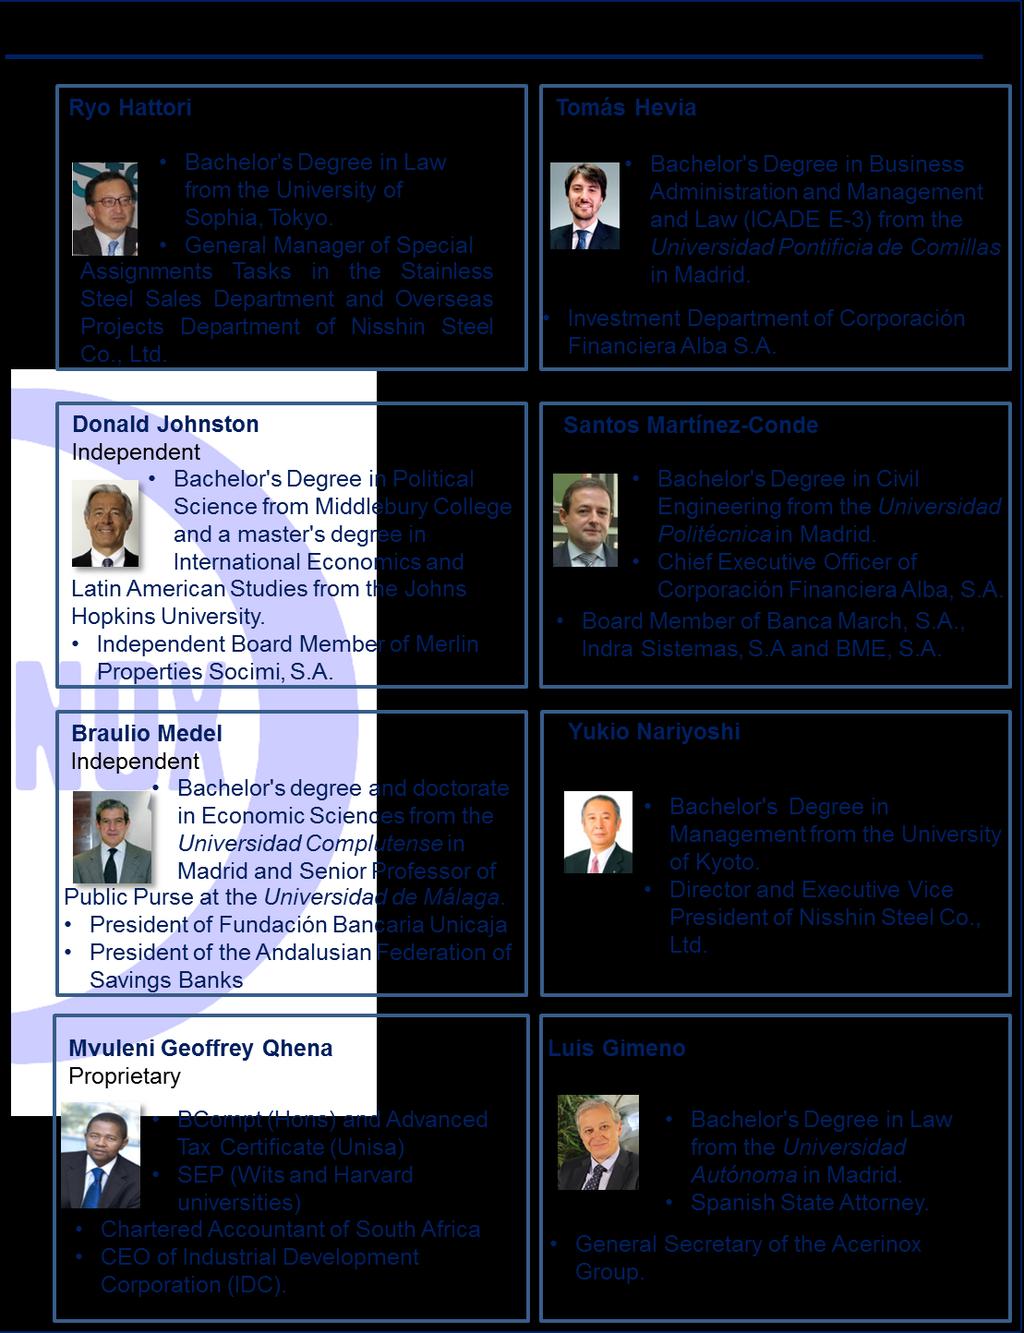
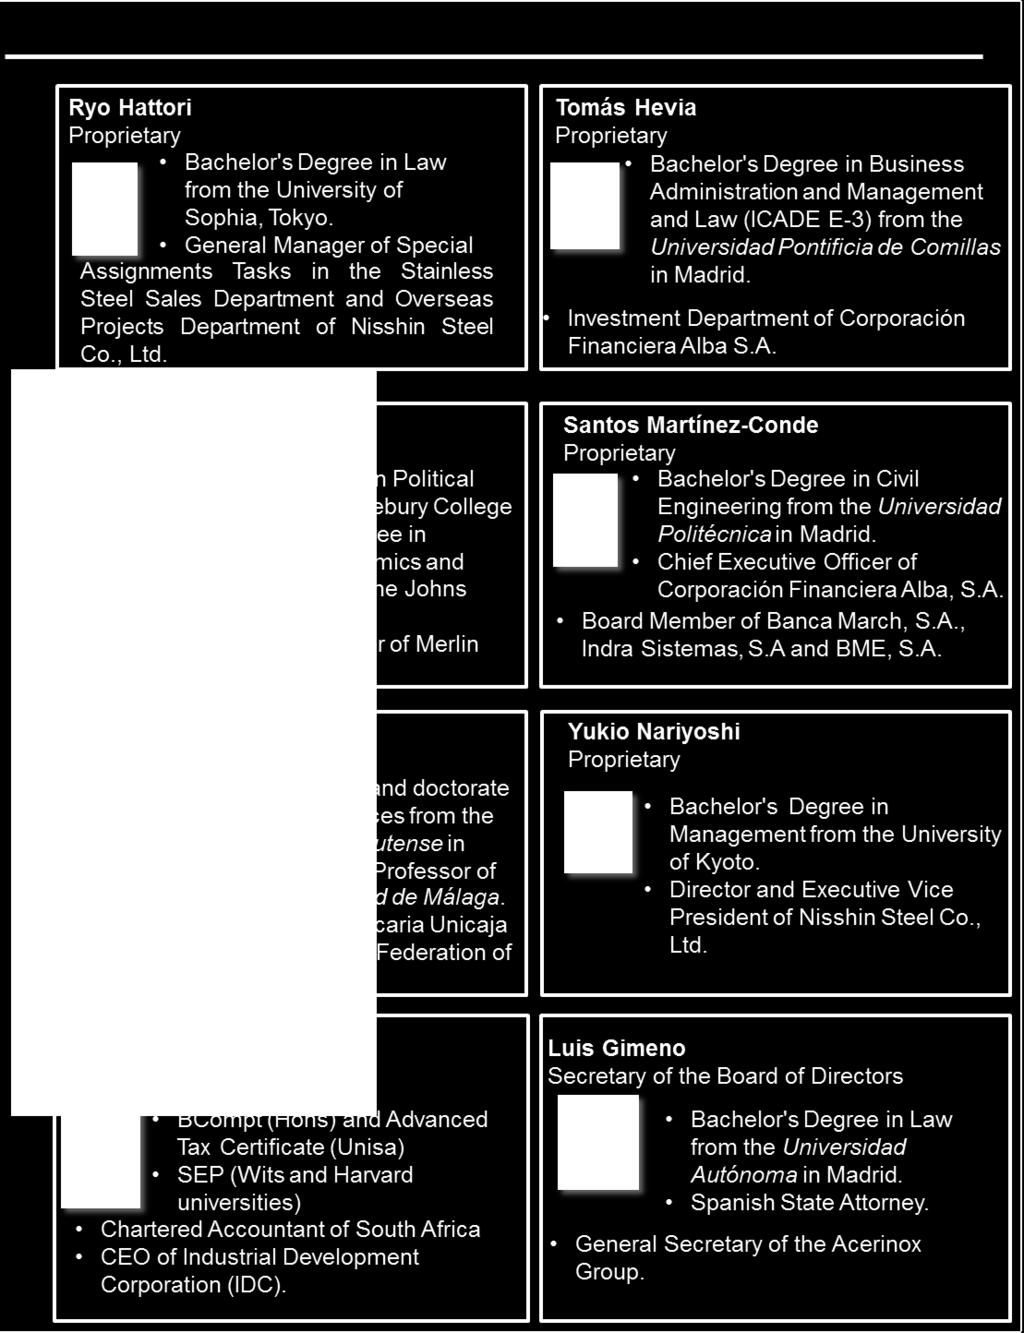
152 66
ACERINOX, S.A. AND SUBSIDIARIES. 31 December 2015
 ACERINOX, S.A. AND SUBSIDIARIES Annual Accounts of the Consolidated Group 31 December 2015 (Free translation from the original in Spanish. In the event of discrepancy, the Spanishlanguage version prevails.)
GRIFOLS, S.A. Annual Accounts and Directors Report. 31 December (With Auditor's Report Thereon)
") Annual Accounts and Directors Report 31 December 2014 (With Auditor's Report Thereon) (Free translation from the original in Spanish. In the event of discrepancy, the Spanishlanguage version prevails)
Annual Accounts and Directors Report 31 December 2014 (With Auditor's Report Thereon) (Free translation from the original in Spanish. In the event of discrepancy, the Spanishlanguage version prevails)
DEOLEO, S.A. AND SUBSIDIARIES
 1 Translation of consolidated financial statements originally issued in Spanish and prepared in accordance with the regulatory financial reporting framework applicable to the Group (see Notes 2 and 34).
 ABERTIS INFRAESTRUCTURAS, S.A. Financial Statements and Directors' Report for the year ended 31 December 2017 CONTENTS Balance sheets as at 31 December... 2 Statements of profit or loss... 4 Statements
FLUIDRA, S.A. AND SUBSIDIARIES. Consolidated Financial Statements and Consolidated Management Report. 31 December 2017
 FLUIDRA, S.A. AND SUBSIDIARIES Consolidated Financial Statements and Consolidated Management Report 31 December 2017 (Together with the Audit Report thereon) Translation of consolidated financial statements
PAO TMK Consolidated Financial Statements Year ended December 31, 2017
 Consolidated Financial Statements Consolidated Financial Statements Contents Independent auditor s report...3 Consolidated Income Statement...8 Consolidated Statement of Comprehensive Income...9 Consolidated
FLUIDRA, S.A. AND SUBSIDIARIES. Consolidated Financial Statements and Consolidated Management Report. December 31, 2016
 FLUIDRA, S.A. AND SUBSIDIARIES Consolidated Financial Statements and Consolidated Management Report December 31, 2016 (Together with the Audit Report thereon) Translation of consolidated financial statements
PAO TMK Consolidated Financial Statements Year ended December 31, 2016
 Consolidated Financial Statements Consolidated Financial Statements Contents Independent auditor s report...3 Consolidated Income Statement...8 Consolidated Statement of Comprehensive Income...9 Consolidated
EDP Renováveis, S.A. Condensed Consolidated Financial Statements 30 June 2012
 EDP Renováveis, S.A. Condensed Consolidated Financial Statements 30 June 2012 EDP Renováveis, S.A. and subsidiaries Condensed Consolidated Income Statement for the six months period ended 30 June 2012
The notes on pages 7 to 59 are an integral part of these consolidated financial statements
 CONSOLIDATED BALANCE SHEET As at 31 December Restated Restated Notes 2013 $'000 $'000 $'000 ASSETS Non-current Assets Investment properties 6 68,000 68,000 - Property, plant and equipment 7 302,970 268,342
ACCOUNTING POLICIES 1 PRESENTATION OF FINANCIAL STATEMENTS. for the year ended 30 June BASIS OF PREPARATION 1.2 STATEMENT OF COMPLIANCE
 14 MURRAY & ROBERTS ANNUAL FINANCIAL STATEMENTS 15 ACCOUNTING POLICIES for the year ended 30 June 2015 1 PRESENTATION OF FINANCIAL STATEMENTS 1.1 BASIS OF PREPARATION These consolidated and separate financial
Profit/(Loss) before income tax 112, ,323. Income tax benefit/(expense) 11 (31,173) (37,501)
 before income tax 112, ,323. Income tax benefit/(expense) 11 (31,173) (37,501)") Income statement For the year ended 31 July Note 2013 2012 Continuing operations Revenue 2,277,292 2,181,551 Cost of sales (1,653,991) (1,570,657) Gross profit 623,301 610,894 Other income 7 20,677 10,124
Income statement For the year ended 31 July Note 2013 2012 Continuing operations Revenue 2,277,292 2,181,551 Cost of sales (1,653,991) (1,570,657) Gross profit 623,301 610,894 Other income 7 20,677 10,124
ACCOUNTING POLICIES. for the year ended 30 June MURRAY & ROBERTS ANNUAL FINANCIAL STATEMENTS 13
 12 MURRAY & ROBERTS ANNUAL FINANCIAL STATEMENTS 13 ACCOUNTING POLICIES for the year ended 30 June 2013 1 PRESENTATION OF FINANCIAL STATEMENTS These accounting policies are consistent with the previous
For personal use only
 Statement of Profit or Loss for the year ended 31 December Note Continuing operations Revenue 2 100,795 98,125 Product and selling costs (21,072) (17,992) Royalties (149) (5,202) Employee benefits expenses
ABERTIS INFRAESTRUCTURAS, S.A. Financial Statements and Directors' Report for the year ended 31 December 2016
 ABERTIS INFRAESTRUCTURAS, S.A. Financial Statements and Directors' Report for the year ended 31 December 2016 CONTENTS Balance sheets as at 31 December... 2 Statements of profit or loss... 4 Statements
Linamar Corporation December 31, 2012 and December 31, 2011 (in thousands of dollars)
") CONSOLIDATED FINANCIAL STATEMENTS Linamar Corporation, and, (in thousands of dollars) 1 MANAGEMENT S RESPONSIBILITY FOR THE CONSOLIDATED FINANCIAL STATEMENTS The management of Linamar Corporation is responsible
CONSOLIDATED FINANCIAL STATEMENTS Linamar Corporation, and, (in thousands of dollars) 1 MANAGEMENT S RESPONSIBILITY FOR THE CONSOLIDATED FINANCIAL STATEMENTS The management of Linamar Corporation is responsible
Red Eléctrica Corporación, S.A. and Subsidiaries. Consolidated Annual Accounts 31 December Consolidated Directors Report 2013
 Red Eléctrica Corporación, S.A. and Subsidiaries Consolidated Annual Accounts 31 December 2013 Consolidated Directors Report 2013 (With Auditors Report Thereon) (Free translation from the original in Spanish.
YIOULA GLASSWORKS S.A. AND SUBSIDIARIES NOTES TO THE CONSOLIDATED FINANCIAL STATEMENTS JUNE 30, 2011
 1. CORPORATE INFORMATION: Yioula Glassworks S.A., a corporation formed under the laws of the Hellenic Republic (also known as Greece), οn August 5, 1959, by Messrs Kyriacos and Ioannis Voulgarakis is the
The consolidated financial statements were authorised for issue by the Board of Directors on 1 June 2015.
 ACCOUNTING POLICIES for the year ended 31 March 2015 Transnet SOC Ltd (the Company ) is a company domiciled in South Africa. The consolidated financial statements for the year ended 31 March 2015 comprise
Financial statements. The University of Newcastle newcastle.edu.au F1
 Financial statements The University of Newcastle newcastle.edu.au F1 Income statement For the year ended 31 December Consolidated Parent Revenue from continuing operations Australian Government financial
BLUESCOPE STEEL LIMITED FINANCIAL REPORT 2011/2012
 BLUESCOPE STEEL LIMITED FINANCIAL REPORT / ABN 16 000 011 058 Annual Financial Report - Page Financial statements Statement of comprehensive income 2 Statement of financial position 3 Statement of changes
Vitafoam Nigeria Plc. Consolidated and Separate financial statements Year ended 30 September 2014
 . Year ended 30 September 2014 Table of Contents Statement of Directors Responsibilities... i Report of the independent auditors... 1 & Statement of Profit or Loss and other Comprehensive Income... 2 &
ACCOUNTING POLICIES 1 PRESENTATION OF FINANCIAL STATEMENTS MURRAY & ROBERTS ANNUAL FINANCIAL STATEMENTS 17
 20 ACCOUNTING POLICIES FOR THE YEAR ENDED 30 JUNE 2017 1 PRESENTATION OF FINANCIAL STATEMENTS 1.1 Basis of preparation These consolidated and separate financial statements have been prepared under the
Accounting policies extracted from the 2016 annual consolidated financial statements
 Steinhoff International Holdings N.V. (Steinhoff N.V.) is a Netherlands registered company with tax residency in South Africa. The consolidated annual financial statements of Steinhoff N.V. for the period
TOWARDS A SUSTAINABLE ENERGY FUTURE
 > INDEPENDENT AUDIT > CONSOLIDATED CONSOLIDATED ANNUAL ACCOUNTS TOWARDS A SUSTAINABLE ENERGY FUTURE 2 CONTENTS INDEPENDENT AUDIT 3 CONSOLIDATED BALANCE 5 CONSOLIDATED 14 CONSOLIDATED DIRECTOR S 84 InDEPENDENT
NOTES TO THE FINANCIAL STATEMENTS
 NOTES TO THE FINANCIAL STATEMENTS 1. ACCOUNTING POLICIES 1.1 Nature of business Super Group Limited (Registration number 1943/016107/06), the holding Company (the Company) of the Group, is a Company listed
CONSOLIDATED STATEMENT OF FINANCIAL POSITION as at 31 March 2016
 CONSOLIDATED STATEMENT OF FINANCIAL POSITION as at 31 March Notes (Restated) (Restated) 2014 ASSETS Non-current assets 5 604 3 654 3 368 Property, equipment and vehicles 5 3 199 2 985 2 817 Intangible
Financial statements and Directors report
 Financial statements and Directors report Contents 04 Auditing 07 Economic profile of the Elecnor Group 15 Consolidated Annual Report 109 Directors Report 123 Economic profile of Elecnor, S.A. CUENTAS
Financial review Refresco Financial review 2017
 Financial review 2017 Financial review 2017 Financial review 2017 1 69 Consolidated income statement For the year ended December 31, 2017 (x 1 million euro) Note December 31, 2017 December 31, 2016 Revenue
BlueScope Financial Report 2013/14
 BlueScope Financial Report /14 ABN 16 000 011 058 Annual Financial Report - Page Financial statements Statement of comprehensive income 2 Statement of financial position 4 Statement of changes in equity
Introduction Consolidated statement of comprehensive income for the year ended 31 December 20XX... 6
 PKF International Limited administers a network of legally independent member firms which carry on separate businesses under the PKF Name. PKF International Limited is not responsible for the acts or omissions
OAO GAZ. Consolidated Financial Statements
 Consolidated Financial Statements for the year ended 31 December 2012 Contents Auditors Report 3 Consolidated Statement of Comprehensive Income 5 Consolidated Statement of Financial Position 7 Consolidated
YIOULA GLASSWORKS S.A. AND SUBSIDIARIES NOTES TO THE CONSOLIDATED FINANCIAL STATEMENTS SEPTEMBER 30, 2012
 1. CORPORATE INFORMATION: Yioula Glassworks S.A., a corporation formed under the laws of the Hellenic Republic (also known as Greece), οn August 5, 1959, by Messrs Kyriacos and Ioannis Voulgarakis is the
Consolidated Financial Statements of ANGOSTURA HOLDINGS LIMITED. December 31, 2011 (Expressed in Trinidad and Tobago Dollars)
") Consolidated Financial Statements of ANGOSTURA HOLDINGS LIMITED (Expressed in Trinidad and Tobago Dollars) Limited and its subsidiaries (the Group), which comprises the consolidated statement of We have
Consolidated Financial Statements of ANGOSTURA HOLDINGS LIMITED (Expressed in Trinidad and Tobago Dollars) Limited and its subsidiaries (the Group), which comprises the consolidated statement of We have
Open Joint Stock Company Power Machines and subsidiaries. Consolidated Financial Statements For the Year Ended 31 December 2006
 Open Joint Stock Company Power Machines and subsidiaries Consolidated Financial Statements For the Year Ended 31 December 2006 OPEN JOINT STOCK COMPANY POWER MACHINES AND SUBSIDIARIES TABLE OF CONTENTS
TÉCNICAS REUNIDAS, S.A.
 This version of the annual accounts is a free translation from the original, which is prepared in Spanish. All possible care has been taken to ensure that the translation is an accurate representation
RANBAXY SOUTH AFRICA (PTY) LTD (Registration Number 1993/001413/07) Audited Consolidated and Separate Annual Financial Statements for the year ended
 LTD (Registration Number 1993/001413/07) Audited Consolidated and Separate Annual Financial Statements for the year ended") Audited Consolidated and Separate Annual Financial Statements for the year ended 31 March Audited Consolidated and Separate Annual Financial Statements for the year ended 31 March Index The reports and
Audited Consolidated and Separate Annual Financial Statements for the year ended 31 March Audited Consolidated and Separate Annual Financial Statements for the year ended 31 March Index The reports and
Uni Systems Information Systems AE
 Uni Systems Information Systems AE Consolidated and Separate Financial Statements for the Year 2010 (period from 1 January to 31 December 2010) compiled in accordance with the International Financial Reporting
BAWAN COMPANY AND SUBSIDIARIES (SAUDI JOINT STOCK COMPANY)
") CONSOLIDATED FINANCIAL STATEMENTS AND INDEPENDENT AUDITOR S REPORT CONSOLIDATED FINANCIAL STATEMENTS INDEX PAGE Independent auditor s report 3-9 Consolidated statement of financial position 10 Consolidated
CONSOLIDATED FINANCIAL STATEMENTS AND INDEPENDENT AUDITOR S REPORT CONSOLIDATED FINANCIAL STATEMENTS INDEX PAGE Independent auditor s report 3-9 Consolidated statement of financial position 10 Consolidated
Consolidated Income Statement
 59 Consolidated Income Statement For the year ended 31 December In millions of EUR Note 2016 2015 Revenue 5 20,792 20,511 income 8 46 411 Raw materials, consumables and services 9 (13,003) (12,931) Personnel
Amadeus IT Group, S.A. Auditors Report, Annual Accounts and Directors Report for the year ended December 31, 2014
 Amadeus IT Group, S.A. Auditors Report, Annual Accounts and Directors Report for the year ended December 31, 2014 Amadeus IT Group, S.A. Auditors Report for the year ended December 31, 2014 Amadeus IT
QUAYSIDE HOLDINGS LIMITED AND SUBSIDIARIES
 QUAYSIDE HOLDINGS LIMITED AND SUBSIDIARIES ANNUAL FINANCIAL STATEMENTS For the year ended 30 JUNE 2015 CONTENTS PAGE Auditor s Report 1 Income Statement 4 Statement of Comprehensive Income 5 Statement
CONSOLIDATED FINANCIAL STATEMENTS
 CONSOLIDATED FINANCIAL STATEMENTS Linamar Corporation Consolidated Financial Statements, and, (in thousands of dollars) 1 MANAGEMENT S RESPONSIBILITY FOR THE CONSOLIDATED FINANCIAL STATEMENTS The management
ACCOUNTING POLICIES Year ended 31 March The numbers
 ACCOUNTING POLICIES Year ended 31 March 2015 Basis of preparation The consolidated and Company financial statements have been prepared on a historical cost basis. They are presented in sterling and all
OAO Silvinit. Consolidated Financial Statements for the year ended 31 December 2010
 Consolidated Financial Statements for the year ended 31 December 2010 Contents Independent Auditors Report 3 Consolidated Statement of Comprehensive Income 4 Consolidated Statement of Financial Position
Consolidated financial statements PJSC Dixy Group and its subsidiaries for with independent auditor s report
 Consolidated financial statements PJSC Dixy Group and its subsidiaries for 2016 with independent auditor s report Consolidated financial statements PJSC Dixy Group and its subsidiaries Contents Page Independent
TÉCNICAS REUNIDAS, S.A. Audit report, Annual Accounts and Directors Report at 31 December 2015
 TÉCNICAS REUNIDAS, S.A. Audit report, Annual Accounts and Directors Report at 31 December 2015 This version of our report is a free translation of the original, which was prepared in Spanish. All possible
Financial Statements for the year ended December 31 st, 2006 in accordance with International Financial Reporting Standards («IFRS»)
") INFO-QUEST S.A. Financial Statements for the year ended December 31 st, 2006 in accordance with International Financial Reporting Standards («IFRS») The attached financial statements have been approved
INFO-QUEST S.A. Financial Statements for the year ended December 31 st, 2006 in accordance with International Financial Reporting Standards («IFRS») The attached financial statements have been approved
Salam International Investment Limited Q.S.C. Consolidated financial statements. 31 December 2015
 Consolidated financial statements 31 December 2015 Consolidated financial statements Contents Page(s) Independent auditors report 1-2 Consolidated statement of financial position 3-4 Consolidated statement
Principal Accounting Policies
 1. Basis of Preparation The accounts have been prepared in accordance with Hong Kong Financial Reporting Standards ( HKFRS ). The accounts have been prepared under the historical cost convention as modified
2.4 SUMMARY OF SIGNIFICANT ACCOUNTING POLICIES
 Franshion Properties (China) Limited Annual Report 2013 175 2.4 SUMMARY OF SIGNIFICANT ACCOUNTING POLICIES Subsidiaries A subsidiary is an entity (including a structured entity), directly or indirectly,
 Financial Statements for the year ended 31 December 2017 Financial Highlights Group Company 2017 2016 % 2017 2016 % N'000 N'000 change N'000 N'000 change Revenue 89,178,082 82,572,262 8 826,507 912,307
Independent auditor s report on the consolidated financial statements of Lenta Limited and its subsidiaries for the year ended 31 December 2017
 Independent auditor s report on the consolidated financial statements of Lenta Limited and its subsidiaries for the year ended February 2018 Independent auditor s report on the consolidated financial statements
Uni Systems Information Systems AE
 Uni Systems Information Systems AE Consolidated and Separate Financial Statements for the Year 2008 (period from 1 January to 31 December 2008) complied in accordance with the International Financial Reporting
Livestock Improvement Corporation Limited (LIC) ANNUAL REPORT. Year Ended 31 May 2014
 ANNUAL REPORT. Year Ended 31 May 2014") Livestock Improvement Corporation Limited (LIC) ANNUAL REPORT Year Ended 31 May 2014 Income Statement For the year ended 31 May 2014 In thousands of New Zealand dollars Note 2014 2013 2014 2013 Revenue
Livestock Improvement Corporation Limited (LIC) ANNUAL REPORT Year Ended 31 May 2014 Income Statement For the year ended 31 May 2014 In thousands of New Zealand dollars Note 2014 2013 2014 2013 Revenue
OAO Scientific Production Corporation Irkut
 Consolidated Financial Statements for the year ended 31 December 2011 Consolidated Financial Statements for the year ended 31 December 2011 Contents Independent Auditors Report 3 Consolidated Income Statement
Accounting policies Year ended 31 March The numbers
 Accounting policies Year ended 31 March 2014 Basis of preparation The consolidated and Company financial statements have been prepared on a historical cost basis. They are presented in sterling and all
Coca-Cola Hellenic Bottling Company S.A. Annual Report 2012 (IFRS Financial Statements)
") Bottling Company S.A. Annual Report 2012 (IFRS Financial Statements) Table of Contents A. Independent Auditors Report B. Consolidated Financial Statements Consolidated Balance Sheet 5 Consolidated Income
Bottling Company S.A. Annual Report 2012 (IFRS Financial Statements) Table of Contents A. Independent Auditors Report B. Consolidated Financial Statements Consolidated Balance Sheet 5 Consolidated Income
FInAnCIAl StAteMentS
 Financial STATEMENTS The University of Newcastle ABN 157 365 767 35 Contents 106 Income statement 107 Statement of comprehensive income 108 Statement of financial position 109 Statement of changes in equity
Independent Auditor s Report
 Independent Auditor s Report To the shareholders of China Communications Construction Company Limited (incorporated in the People s Republic of China with limited liability) We have audited the consolidated
Consolidated Financial Statements of ANGOSTURA HOLDINGS LIMITED. December 31, 2014 (Expressed in Trinidad and Tobago Dollars)
") Consolidated Financial Statements of (Expressed in Trinidad and Tobago Dollars) Consolidated Statement of Comprehensive Income Year ended (Expressed in Trinidad and Tobago Dollars) Restated Notes 2014
Consolidated Financial Statements of (Expressed in Trinidad and Tobago Dollars) Consolidated Statement of Comprehensive Income Year ended (Expressed in Trinidad and Tobago Dollars) Restated Notes 2014
May & Baker Nig Plc RC. UNAUDITED CONSOLIDATED FINANCIAL STATEMENTS 31 MARCH 2017
 ` May & Baker Nig Plc RC. 558 UNAUDITED CONSOLIDATED FINANCIAL STATEMENTS 31 MARCH 2017 UNAUDITED CONSOLIDATED STATEMENT OF PROFIT OR LOSS AND OTHER COMPREHENSIVE INCOME Note Continuing operations Revenue
Auriga Global Investors, Sociedad de Valores, S.A., Sociedad Unipersonal
 Auriga Global Investors, Sociedad de Valores, S.A., Sociedad Unipersonal Annual Accounts 31 December 2016 Directors Report 2016 (With Independent Auditor s Report Thereon) (Free translation from the original
JAMAICAN TEAS LIMITED CONSOLIDATED FINANCIAL STATEMENTS 30 SEPTEMBER 2017
 CONSOLIDATED FINANCIAL STATEMENTS CONSOLIDATED FINANCIAL STATEMENTS I N D E X PAGE Independent Auditors' Report to the Members 1-4 FINANCIAL STATEMENTS Consolidated Statement of Profit or Loss and Other
Group accounting policies
 81 Group accounting policies BASIS OF ACCOUNTING AND REPORTING The consolidated financial statements as set out on pages 92 to 151 have been prepared on the historical cost basis except for certain financial
NOTES TO THE FINANCIAL STATEMENTS For the year ended 31st December, 2013
 1. GENERAL Cosmos Machinery Enterprises Limited (the Company ) is a public limited company domiciled and incorporated in Hong Kong and its shares are listed on The Stock Exchange of Hong Kong Limited (the
Continuing operations Revenue 3(a) 464, ,991. Revenue 464, ,991
 464, ,991. Revenue 464, ,991") STATEMENT OF PROFIT OR LOSS For the year ended 30 June 2017 Consolidated Consolidated Note Continuing operations Revenue 3(a) 464,411 323,991 Revenue 464,411 323,991 Other Income 3(b) 4,937 5,457 Share
STATEMENT OF PROFIT OR LOSS For the year ended 30 June 2017 Consolidated Consolidated Note Continuing operations Revenue 3(a) 464,411 323,991 Revenue 464,411 323,991 Other Income 3(b) 4,937 5,457 Share
UNITED INTERNATIONAL TRANSPORTATION COMPANY (A SAUDI JOINT STOCK COMPANY) AND IT S SUBSIDIARY
 AND IT S SUBSIDIARY") (A SAUDI JOINT STOCK COMPANY) AND IT S SUBSIDIARY CONSOLIDATED FINANCIAL STATEMENTS 31 DECEMBER 2018 CONSOLIDATED FINANCIAL STATEMENTS 31 DECEMBER 2018 INDEX PAGE 1-6 Consolidated Statement of Profit or
(A SAUDI JOINT STOCK COMPANY) AND IT S SUBSIDIARY CONSOLIDATED FINANCIAL STATEMENTS 31 DECEMBER 2018 CONSOLIDATED FINANCIAL STATEMENTS 31 DECEMBER 2018 INDEX PAGE 1-6 Consolidated Statement of Profit or
NOTES TO THE GROUP ANNUAL FINANCIAL STATEMENTS FOR THE YEAR ENDED 30 SEPTEMBER 2014
 14 NOTES TO THE GROUP ANNUAL FINANCIAL STATEMENTS 1. ACCOUNTING POLICIES The financial statements are presented in South African Rand, unless otherwise stated, rounded to the nearest million, which is
notes to the Financial Statements 30 april 2017 (Cont d)
") 2.4 Summary of accounting policies (contd.) (d) Intangible assets (contd.) (ii) Research and development expenditure Research expenditure is recognised as an expense when it is incurred. Development expenditure
2.4 Summary of accounting policies (contd.) (d) Intangible assets (contd.) (ii) Research and development expenditure Research expenditure is recognised as an expense when it is incurred. Development expenditure
Group Income Statement For the year ended 31 March 2015
 Income Statement For the year ended 31 March Note Pre exceptionals Restated Exceptionals (note 11) Pre exceptionals Exceptionals (note 11) Continuing operations Revenue 5 10,606,080 10,606,080 11,044,763
(Continued) ~3~ March 31, 2017 December 31, 2016 March 31, 2016 Assets Notes AMOUNT % AMOUNT % AMOUNT % Current assets
 ~3~ March 31, 2017 December 31, 2016 March 31, 2016 Assets Notes AMOUNT % AMOUNT % AMOUNT % Current assets") Current assets DAVICOM SEMICONDUCTOR, INC. AND SUBSIDIARIES CONSOLIDATED BALANCE SHEETS (Expressed in thousands of New Taiwan dollars) (The consolidated balance sheets as of March 31,2017 and 2016 are
Current assets DAVICOM SEMICONDUCTOR, INC. AND SUBSIDIARIES CONSOLIDATED BALANCE SHEETS (Expressed in thousands of New Taiwan dollars) (The consolidated balance sheets as of March 31,2017 and 2016 are
Accounting policies for the year ended 30 June 2016
 Accounting policies for the year ended 30 June 2016 The principal accounting policies adopted in preparation of these financial statements are set out below: Group accounting Subsidiaries Subsidiaries
Financial statements. The University of Newcastle. newcastle.edu.au F1. 52 The University of Newcastle, Australia
 Financial statements The University of Newcastle 52 The University of Newcastle, Australia newcastle.edu.au F1 Contents Income statement................. 54 Statement of comprehensive income..... 55 Statement
 Balance Sheets 31 December 2017 and 2016 (Expressed in ) Assets Note 2017 2016 Intangible assets Note 5 12,911,968 10,356,819 Computer softw are 12,911,968 10,356,819 Property, plant and equipment Note
Notes To The Financial Statements For the year ended 31 December 2014
 1. Corporate information Ornapaper Berhad is a public limited liability company, incorporated and domiciled in Malaysia, and is listed on the Main Market of Bursa Malaysia Securities Berhad. The principal
Coca- Cola Hellenic Bottling Company S.A.
 Coca- Cola Hellenic Bottling Company S.A. Annual Report Table of Contents A. Independent Auditor s Report B. Consolidated Financial Statements Consolidated Balance Sheet... 1 Consolidated Income Statement........
FINANCIAL STATEMENTS AND INDEPENDENT AUDITOR S REPORT FOR THE YEAR ENDED DECEMBER 31, 2018
 DOHA STATE OF QATAR FINANCIAL STATEMENTS AND INDEPENDENT AUDITOR S REPORT FOR THE YEAR ENDED DECEMBER 31, 2018 FINANCIAL STATEMENTS AND INDEPENDENT AUDITOR S REPORT CONTENTS Page Independent auditor s
159 Company Income Statement 160 Company Balance Sheet 162 Notes to the Company Financial Statements
 73 Annual Report and Accounts 2018 Consolidated and Company Financial Statements 2018 Page Consolidated Financial Statements, presented in euro and prepared in accordance with IFRS and the requirements
Fomento de Construcciones y Contratas, S.A. and Subsidiaries
 Fomento de Construcciones y Contratas, S.A. and Subsidiaries Consolidated Financial Statements for the year ended 31 December 2014 and Consolidated Directors Report, together with Independent Auditor's
Selecta Group B.V. and its subsidiaries, Amsterdam (The Netherlands)
") Selecta Group B.V. and its subsidiaries, Amsterdam (The Netherlands) Consolidated financial statements for the year ended 30 September and report of the independent auditor Table of Contents Consolidated
Selecta Group B.V. and its subsidiaries, Amsterdam (The Netherlands) Consolidated financial statements for the year ended 30 September and report of the independent auditor Table of Contents Consolidated
NOTES TO FINANCIAL STATEMENTS
 NOTES TO FINANCIAL STATEMENTS 1. CORPORATE INFORMATION CNT Group Limited is a limited liability company incorporated in Bermuda. The principal place of business is located at 31st Floor and Units E & F
Independent Auditor s Report to the Members of Caltex Australia Limited
 61 Independent Auditor s Report to the Members of Caltex Australia Limited Report on the financial report We have audited the accompanying financial report of Caltex Australia Limited (the Company), which
Coca-Cola Hellenic Bottling Company S.A Annual Report
 Annual Report Independent auditor s report To the Shareholders of the We have audited the accompanying consolidated financial statements of and its subsidiaries (the Group ) which comprise the consolidated
Notes to the Financial Statements
 1. CORPORATE INFORMATION The Company was incorporated as an exempted company with limited liability in the Cayman Islands on 26 November 2003 under the Companies Law, Cap. 22 (Law 3 of 1961, as consolidated
Consolidated Cash Flow Statement
 Consolidated Cash Flow Statement For the Financial 30 September 2016 Notes 000 000 Cash flows from operating activities Profit after taxation 8,722 33,782 Depreciation of property, plant and equipment
Group Income Statement
 MASSMART GROUP ANNUAL FINANCIAL STATEMENTS 2014 Group Income Statement December 2014 December 2013 Rm Notes 52 weeks 53 weeks Revenue 5 78,319.0 72,512.9 Sales 5 78,173.2 72,263.4 Cost of sales (63,610.8)
QATARI GERMAN COMPANY FOR MEDICAL DEVICES Q.S.C. FINANCIAL STATEMENTS FOR THE YEAR ENDED 31 DECEMBER 2013
 FINANCIAL STATEMENTS FINANCIAL STATEMENTS CONTENTS Page(s) Independent auditors report 1-2 Financial statements Statement of financial position 3 Statement of comprehensive income 4 Statement of changes
Frontier Digital Ventures Limited
 Frontier Digital Ventures Limited Significant accounting policies This note provides a list of the significant accounting policies adopted in the preparation of these consolidated financial statements
International Financial Reporting Standards Consolidated Financial Statements and Auditors Report
 JSC Chelyabinsk Zinc Plant International Financial Reporting Standards Consolidated Financial Statements and Auditors Report For the years ended 31 December 2005, 2004 and 2003 Contents STATEMENT OF MANAGEMENT
in accordance with International Financial Reporting Standards (IFRS) as adopted by the European Union (EU)
 as adopted by the European Union (EU)") Financial Statements as at 31 December 2017 and for the year then ended in accordance with International Financial Reporting Standards (IFRS) as adopted by the European Union (EU) (Translation) Contents
Financial Statements as at 31 December 2017 and for the year then ended in accordance with International Financial Reporting Standards (IFRS) as adopted by the European Union (EU) (Translation) Contents
Notes to the Accounts
 Notes to the Accounts 1. Accounting Policies Statement of compliance The Group financial statements consolidate those of the Company and its subsidiaries (together referred to as the Group ), equity account
2007 Financial Statements. Consolidated Financial Statements of the Nestlé Group Financial Statements of Nestlé S.A.
 2007 Financial Statements Consolidated Financial Statements of the Nestlé Group Financial Statements of Nestlé S.A. Consolidated Financial Statements of the Nestlé Group Principal exchange rates...2 Consolidated
For personal use only
 FINANCIAL REPORT FOR THE FINANCIAL YEAR ENDED 30 JUNE 1 FINANCIAL STATEMENTS YEAR ENDED 30 JUNE CONTENTS Page Directors Responsibility Statement 3 Independent Auditor s Report 4 Consolidated Income Statement
Notes to the financial statements
 11 1. Accounting policies 1.1 Nature of business Super Group Limited (Registration number 1943/016107/06), the holding Company of the Group (the Company), is a Company listed on the Main Board of the JSE
Maria Perrella. Andrew Hider. Chief Executive Officer. Chief Financial Officer
 MANAGEMENT S RESPONSIBILITY FOR FINANCIAL REPORTING The preparation and presentation of the Company s consolidated financial statements is the responsibility of management. The consolidated financial statements
SUMMARY OF SIGNIFICANT ACCOUNTING POLICIES For the financial year ended 31 December 2013
 Unless otherwise stated, the following accounting policies have been applied consistently in dealing with items that are considered material in relation to the financial statements. These policies have
Nigerian Aviation Handling Company PLC
 Nigerian Aviation Handling PLC Financial Statements -- Q1 2018 Nigerian Aviation Handling PLC Consolidated Statement of Comprehensive Income 1 Consolidated Statement of Financial Position 2 Statement of
COMVITA LIMITED AND GROUP FINANCIAL STATEMENTS
 COMVITA LIMITED AND GROUP FINANCIAL STATEMENTS For the year ended 31 March 2015 Comvita Financial Statements 2015 - P2 CONTENTS P4 P5 P6 P7 P8 P9 P10 P52 P53 P58 DIRECTORS DECLARATION INCOME STATEMENT
INTERNATIONAL FINANCIAL REPORTING STANDARDS
 INTERNATIONAL FINANCIAL REPORTING STANDARDS Model Financial Statements 2006 (Preliminary Version) About Deloitte Touche Tohmatsu Deloitte refers to one or more of Deloitte Touche Tohmatsu, a Swiss Verein,