JUDGING PRICE RISKS IN MARKETING HOGS 1
|
|
|
- Vernon Morris
- 5 years ago
- Views:
Transcription

1 JUDGING PRICE RISKS IN MARKETING HOGS 1 R. M. GREEN AND E. A. STOKDYK THE PROBLEM OF JUDGING THE HOG MARKET The hog producer must judge market risks in planning both his production and marketing program. During the breeding period he must decide whether to increase or decrease the size of his hog business. During the feeding period he must decide whether to attempt to finish the hogs in a short period of time or to lengthen the feeding period. Either consciously or unconsciously, the hog producer makes a market forecast. (Fig. 1.) If he increases his production he evidently believes the outlook to be bright. If he decides to lengthen
2
3 the ordinary feeding period he predicts a more favorable outlook in the future. Right or wrong, he makes up his mind and acts accordingly. The majority of hog producers are too often influenced by prevailing prices rather than by prospective prices. If hog prices and the feeding situation are favorable at breeding time, they increase production, while if the reverse is true, they decrease production. This practice has proved disastrous in the majority of cases. The seasonal fluctuations in hog prices add to the risks involved in the production and marketing of hogs. Here again the actions of the majority influence the trend in prices. By following the line of least resistance and marketing at the time that is most convenient, many hog producers find that their hogs are ready to go to market at the time that many other producers are sending theirs to market. The purpose of this circular is to point out some of the risks involved in the marketing of hogs. The hog producer can never eliminate the element of risk, but he can plan his operation in such a way as to take the least risk possible rather than in a way to make him run the greatest risks. AVERAGE SEASONAL FLUCTUATIONS IN HOG PRICES The seasonal trend in hog prices is quite generally recognized as being influenced by the marketing of the fall and spring pig crops. Market receipts tend to increase in May and June when the bulk of the preceding fall pig crop moves to market. Then again receipts increase in October, November and December, when the spring pig crop moves to market. As a consequence, the trend in hog prices is usually downward during these months of the year. This is illustrated in figure 2. The upper portion of the figure shows the average of monthly top prices at Kansas City for a period of 47 years ( ) while the lower portion shows the average monthly receipts at the principal markets for a period of 11 years ( ). The relation between receipts and prices is quite evident. The periods of increasing receipts are periods of declining prices and the periods of decreasing receipts are the periods of rising prices. Averages are frequently misleading, however, for exceptionally high prices in a few years out of the many that go to make up the average may influence the average to such an extent that a true picture of the situation is not given. To overcome the distortion that averages may present in the seasonal price curve as shown in figure 2, a second figure, figure 3, was constructed. The lower portion of

4 this figure gives an idea of the frequency with which the price trend, as shown in the upper portion, occurred. For instance, this graph shows that in the 47 years under consideration the top price for hogs in July was higher than the top price in June 36 times. On the other hand, it shows that in only 5 years out of the 47 was the top price in November higher than the top price in October. This does not mean that the November price was the high price for the year. It only means that the November market was higher than the October market in 5 out of 47 years. It is important to bear in mind how the lower graph of figure 3 is constructed, for the method is used quite frequently in this circular.
5 The lower portion of figure 3 brings out some important points in connection with the average seasonal trend as presented in the upper portion of the figure. It shows that the April market is not so strong a market as the upper portion of the figure would lead one to believe. In fact, it shows that April prices were above March prices less than half the time, or in only 23 out of 47 years. Likewise, the August and September markets are not as frequently tending upward as the average of monthly prices indicates.
6
7 The seasonal trends do, however, remain quite distinct even when the chances for abnormal movements are considered. The important factor influencing this seasonal trend is the variation in monthly receipts. The reason for the variation in monthly receipts is mainly due to the fact that the easiest methods in hog production tend to throw hogs on the market at certain seasons of the year. Pigs farrowed in the early spring require more attention than those farrowed later in the spring and even then they must be handled with skill to be ready for market before the fall price decline starts. Furthermore, advancing corn prices during the summer months frequently make hog feeders check their operations and wait until new crop corn is available. Usually, however, it is the man who goes to the trouble to avoid the periods of heavy marketing who gets the advantage of the high points in the market. RISKS OF CHANGES IN HOG PRICES Hog prices not only move up and down from one season of the. year to another, but they shift to higher or lower levels from one year to another. (Figs. 1 and 4.) The average seasonal tendency is for hog prices to be high in August and September. Such an average is, however, a cross between years when hog prices are shifting to higher levels and years when they are shifting to lower levels. It, therefore, pictures a situation about half way between two opposing realities. The hog producer is really faced with two risks-seasonal price fluctuations and year-to-year changes in price levels. THE SUMMER PRICE ADVANCE WHEN HOG PRICES ARE WORKING TO HIGHER OR LOWER LEVELS Higher hog prices in July have occurred 26 years out of the 29 in which hog prices were working to higher levels. On the other hand, when the general tendency of hog prices was toward lower levels, the July price advanced 12 years out of 19 and declined 7 years. There is a greater risk in expecting strong August and September prices in years of declining price tendencies (Table I) than in years of advancing price tendencies (Table II). It is evident from this that high August and September hog prices are not a sure bet. The ordinary seasonal tendency of hog prices is itself affected by the general direction that production or some other factor is causing prices to take.
8
9
10 SUMMER AND EARLY AUTUMN PRICES COMPARED WITH THE AVERAGE PRICE FOR THE WHOLE YEAR A July price above the average price for the year prevailed 25 out of 28 years when hog prices in general were tending upward, as compared with a July price above the year s average price 7 times in 18 years of generally declining hog prices. The August price was above the year s average 27 years out of 28 years in generally advancing prices and 13 pears out of 18 years of declining prices. September prices were above average 27 years out of 28 in years of advancing hog prices and 10 years out of 18 in years of declining hog prices. October prices were above the year s average price 23 years out of the 28 when hog prices were tending toward higher levels and only 4 times out of 18 when hog prices were tending toward lower levels. In years of advancing price tendencies, the chances are about 9 out of 10 that late summer and early autumn hog prices will be better than the average price for the year. On the other hand, the chances are only about fifty-fifty, or 5 out of 10, in years of declining.price tendencies, in spite of the seasonal tendency toward strength in August and September. CHANCES OF PRICE ADVANCES OR DECLINES IN ANY MONTH MUCH GREATER SOME YEARS THAN OTHERS The risk of price declines in April (Tables I and II) is much greater in years of declining hog prices than in years of advancing prices. Likewise, the chances of December advances are much greater in years of advancing prices than in years of declining prices. Reference to Tables I and II shows much the same situation with regard to other months. There is no one distinct seasonal tendency in hog prices that always holds true in the way that a simple average of hog prices shows. AVERAGE SEASONAL PRICE TREND MORE NEARLY LIKE WHAT HAPPENS IN GOOD MARKET YEARS A statistical average, like the sausage coming out of a sausage mill, savors very much of the material that went into the other end of the machine. There is no magic in a 5-, l0-, 15-, 20-, or even a 50-year average. When 5 or 10 consecutive calendar years are averaged, the result leans toward the condition that is biggest and prevalent the longest time during the period. For a long time, hog prices, in spite of their ups and downs, have been working up and away from $3 and $4 a hundred levels toward $7 and $8 levels. This in itself tends to make the later months in any average higher in price than the earlier months.
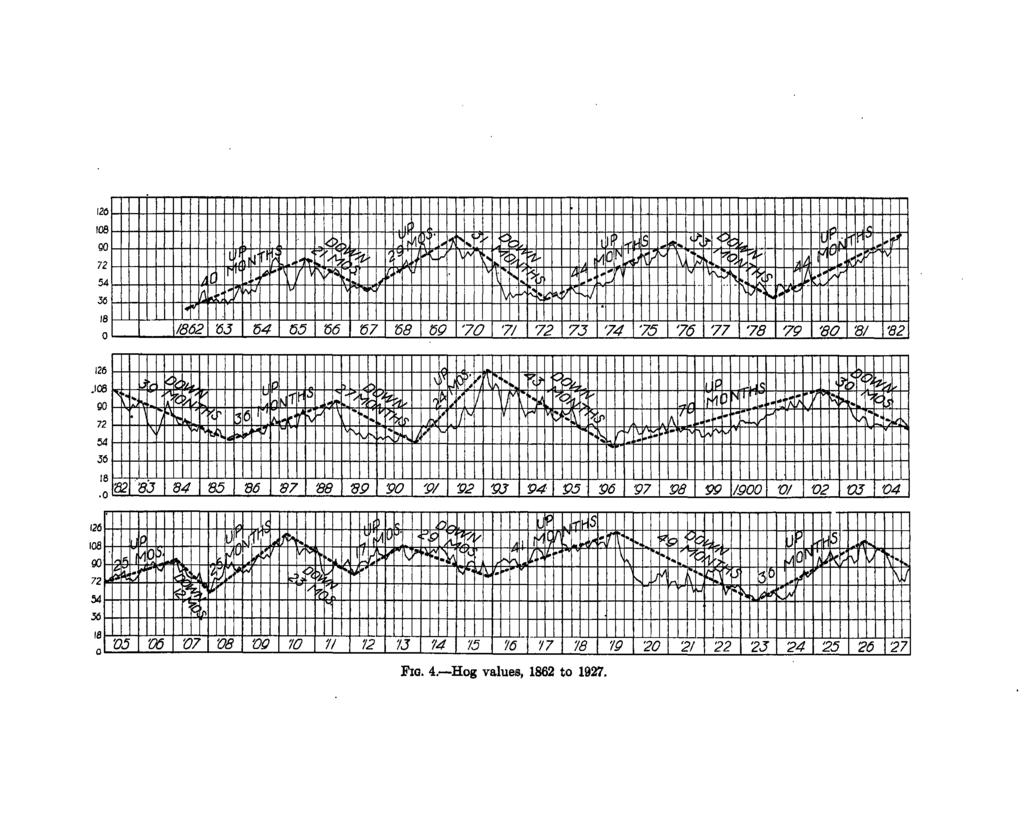
 the average length of the advance has been 36 months, while the ayerage length of decline has been 31 months.")
11 Furthermore, it will be found that while hog values have been up and down since Civil War times, every 2 to 4 years (fig. 4) the average length of the advance has been 36 months, while the ayerage length of decline has been 31 months. From 1901 to 1926 the period of decline averaged 20 months; the period of advancing prices 27 months. Thus advances cover longer periods than declines. In in-. discriminately averaging consecutive calendar years, there is considerable likelihood of including more months under the influence of advancing price tendencies than under the influence of declining tendencies because of the longer periods covered by price advances. This again would tend to make later months higher in the average than earlier months. All of this goes to make August and September prices relatively high in the average, as they really are in years of good hog prices. The average seasonal price, therefore, is the optimist s price. It needs to be understood in order not to be misleading at times. HOW HOG PRODUCTION AFFECTS THE TREND OF HOG VALUES A record of hog values since 1862 shows 11 distinct upward and downward swings. (Fig. 4.) The average length of time that values moved upward was 36 months, and the average length of time that values moved downward was 31 months.² Several factors are responsible for the swings in hog values, but the increase and decrease in production is one of the chief factors. When hog values are high some producers expand their business and others get into the hog business. On the other hand, when hog values are low some producers curtail their hog business and others liquidate entirely. An illustration of the influence of hog values on production is close at hand. The last peak in hog values was in June, Hog values had been on an upward swing for 36 months since May, Then production began to increase. The 1926 fall pig crop was 3 per cent larger than the year before and the 1927 spring pig crop was 3½ per cent larger than the 1926 spring pig crop. Again, the 1927 fall pig crop, as reported by the December pig crop survey by the United States Department of Agriculture, showed an increase of 11 per cent over the 1926 fall pig crop. The result was, of course, a change in the direction of hog values.
12 It must not be assumed that the inorease In production in the United States was altogether responsible for the decline in hog values since It must be understood that European production was also increasing and at a much faster rate than in the United States. This cut off our export demand to a large extent, and as a result added to the burden of increased production in the United States. Hog producers apparently increase production more slowly under the encouragement of advancing prices than they decrease production under the influence of declining prices. This is shown by the fact that values continue on an upward swing longer than they do on a downward swing. HOW TO GET SOME IDEA OF WHICH WAY PRODUCTION IS TENDING Which way hog production is tending is an important judgment to reach in order to make the foregoing observations of practical value. Attention in this discussion is called to two bases of judgment. No doubt there are others. The following, however, are offered because they are two with which the writers have had some experience. Twice a year the United States Department of Agriculture issues a report on the size of the pig crop. The June 1 report indicates, among other things, the number of pigs saved from the spring pig crop. The December 1 report gives the number of pigs saved from the fall pig crop. The size of the spring pig crop will materially affect the number of hogs coming to market between October and March, inclusive. The fall pig crop will determine to a large extent the size of hog receipts from April to September, inclusive, Other factors aside from the size of the pig crop, however, affect, the movement of hogs to market, as will be shown later. A strong advance in corn prices may increase hog receipts by sending in hogs that would otherwise stay on the farm. A decline in corn prices may encourage holding and feeding to heavier weights. A pronounced drop in hog prices themselves may encourage holding back for a while. If the decline continues it may result later in a large increase in receipts. If even a rough account is taken of these factors, the sine of the pig crop gives some idea of what to expect of receipts. In Table III hog receipts at 67 markets were estimated for the period April to September, 1927, inclusive, on the basis of the size of the 1926 fall pig crop. Since the pig crop in the fall of 1926 was 3 per cent larger than that of 1925, an increase of 3 per cent in receipts might theoretically be expected. Out of the 1925 fall pig crop
13 there came to market between April and September, 1926, inclusive, 17,788 thousand hogs. A 3 per cent increase in the 1926 fall pig crop would mean, therefore, 18,322 thousand hogs for the period April to September, Merely on the basis of the 1920-'24 average monthly distribution of receipts, 17.3 per cent of the number should come to market in April. This gives a theoretical figure of 3,170. This corresponds with actual April receipts of 3,142. Likewise, estimated receipts for other months can be determined and compared with the average. It will be noted that the greatest errors come in June, July and August. No doubt the spring advance in corn prices and the decline in hog prices followed by some improvement in hog prices by July, August and September was a disturbing influence. Even a 5 per cent arbitrary increase in the estimate of receipts for the three months, June, July and August, reduces the total error in the estimates about one-half. By watching the trend of receipts the first month, if there is a decided change from the original estimate one can often correct his
14 estimates for future months and reduce his first error of judgment. Without the employment of more involved statistical methods, this is about all that can be done to make these figures of practical value. Carefully worked-out statistical measurements have shown that when corn prices increase and hog prices decline, or either one alone changes so as to make hog feeding less attractive, receipts compared with the previous year are affected. Receipts 6 to 18 months later are decreased 2 to 10 per cent. 3 Apparently, the longer time influence of a bad corn- and hog-price relationship is to decrease production, and consequently receipts. The immediate influence, however, seems to be to increase receipts at the market for a time, as in June, July and August, 1927, referred to above. PRICE TENDENCIES IN MARCH AND APRIL AS INDICATORS OF THE GENERAL TREND OF HOG PRICES January, February and March prices are more frequently up than down even in years when hog prices for the year are generally tending downward. In 19 such years the January price was higher than the December price 16 times and lower only 3 times. February price was higher than January price 12 times and lower 7 times. Likewise, March price was higher than February price 11 times and lower 8 times. However, when it comes to April (Table I) prices have risen only 3 times and declined 16 times. This compares with higher April prices 20 times and lower April prices 9 times in the 29 years when hog prices for the year were tending upward. Higher April prices only 3 times and lower April prices 16 times in 19 years, when the general trend of hog prices has been down, point to April as a seasonal turning point in the market. Higher April prices 20 times and lower April prices only 9 times in 29 years, when the general trend of hog prices was upward, point to the same conclusion. April marks about the end of the marketing of the heavier winterfed hogs and the beginning of the spring marketing of the fall pig crop. April receipts are most frequently the low point in hog receipts for the first six months of the calendar year. In 26 years, April receipts at four principal markets were the low point for the first six months of the year 17 times, or all but 9 years. The low point in the first six months receipts came in March 4 times, in May once, and in June 4 times. The time of heaviest pork exports is most commonly from January to March, inclusive. Exports usually show a decided decline
15 in April or the two following months. Furthermore, the fall pig crop, which begins to come to market in April, is in total smaller than the spring pig crop, which moves to market mostly from October to March, inclusive. For these several reasons, April hog price is most often, though not always, quite sensitive to changes in hog-market influences. APRIL AN IMPORTANT TURNING POINT IN HOG PRICES I. Years of Declining Price Tendencies (19 Years).-In 16 of the 19 years of declining hog price tendencies, the April price of hogs was either lower than or only equal to the March price. In 13 of these 16 years, the following July price was also lower than the March price. In 11 of the 16 years when April price was down, the following August price was also lower than the March price. In 12 of the 16 years the following September price remained below the previous March price and in all 16 years the December price was lower than the previous March price. In years of declining hog price tendencies, therefore, the chances are about 5 to 1 that April price will be lower than the March price. If such happens to be the case then the chances are about 2 or 3 to 1 that prices in later months, even at the strongest times will be lower than the previous March price. II. Years of Advancing Price Tendencies (29 Years).-In 20 of the 29 years when hog prices tended generally upward throughout the year, the April price of hogs was higher than the March price. In all 20 of these years the following July price was also higher than the March price. In 18 of the 20 years, August price was higher than the March price; in 19 years of the 20, September price remained above the previous March price; and in 9 of the 20 years, or nearly half the time, even the December price, though seasonally low, was still above the previous March price. In years of upward trend in hog prices, therefore, the chances are about 2 to 1 that the April price will be higher than the March price. When the April price is above the March price under these circumstances, there is very little risk in expecting July, August and September prices to be higher than the previous March price. There is even about a fifty-fifty chance that the seasonally low December price will be higher than the previous March price. While there is no infallibility in the March-April price relationship, it has, in the case of top hog prices at Kansas City, been some aid along with other factors in getting some idea of the general trend of prices under the influence of changing production.
16 HOW CORN PRODUCTION AND PRICES AFFECT THE MOVEMENT OF HOGS TO MARKET Corn prices have a marked influence on the movement of hogs to market. In years of large corn crops and low corn prices there is a distinct tendency to slow up market receipts from August to January. 4 Hogs are held both for the purpose of increasing breeding stock and for the later feeding of the cheaper new corn. This ultimately, results in an increase in average live weight of hogs received at the markets. The tendency to withhold hogs from market for feeding and breeding when corn prices are low results in a larger proportion of the season s hog production going to market between February and the following August. In years of small corn crops and high corn prices market receipts tend to fluctuate to a greater extent than in years of low corn prices. As a consequence, the price trend in small corn-crop years is much more erratic than in large corn-crop years. The spring price decline is more severe, and similarly the summer rise is more pronounced. (Figs. 5 to 12.) The relation between corn prices and hog prices is always an important factor in influencing market receipts. Hog prices may be low, but this factor may be offset by a very low corn price. The relation between the two prices is termed the corn-hog ratio. It represents the number of bushels of corn that it would take to buy 100 pounds of live pork. It does, not express, as is sometimes assumed, the number of bushels of corn that it takes to produce 100 pounds of pork. It has been found, over a long period of years, that it takes approximately 11 bushels of corn to buy 100 pounds of live hogs. The average or normal ratio then is said to be 11 to 1. When corn is relatively cheap and hogs are relatively high, the corn-hog ratio is said to be high, and that is a profitable hog-feeding situation. On the contrary, when the ratio falls below 11 to 1 hog feeding becomes unprofitable except to only the most efficient feeders. As a consequence there is a tendency to dispose of feeding and breeding stock in periods when the corn-hog ratio is low. In estimating the influence of the size of corn cro on market receipts, many factors must be taken into consideration, such as the relation between the size of the corn crop and the numbers of live stock, the amount of corn carried over from the preceding crop, and the quality and condition of the corn crop. However, a simple
17 method, which most anyone can employ, that has been used satisfactorily is to compare the particular year under consideration with the three years on either side of it. This gives a seven-year moving average. Roughly, this method classes a corn-crop year since the World War of around three billion bushels as a large corn crop and one below three billion bushels as a small corn crop. HOW HOG PRODUCTION AND THE SIZE OF THE CORN CROP TAKEN TOGETHER AFFECT THE SEASONAL FLUCTUATIONS IN HOG PRICES The foregoing discussions have pointed out some of the major influences affecting the movement of hogs to market and the influence of this movement on hog-price trends. It is difficult, indeed, to give proper consideration to each factor influencing hog prices and feel certain that the proper weight has been given to each factor. It is apparent, however, that hog producers have had four distinct types of markets on which they sold their hogs. These may be classed as follows: 1. Years which follow small corn crops when hog production is increasing and the major trend in hog prices is downward. (Figs 6 and 10.) 2. Years which follow large corn crops when hog production is increasing and the major trend in hog prices is downward. (Figs 5 and 9.) 3. Years which follow small corn crops when hog production is decreasing and the major trend in hog prices is upward. (Figs. 8 and 12.) 4. Years which follow large corn crops when hog production is decreasing and the major trend in hog prices is upward. (Figs. 7 and 11.) These four types of markets have distinct seasonal trends. When a price-trend chart for each is made, this becomes apparent. Figure 6, which shows the hog-price trend for the nine years since 1880, which followed small corn crops when hog production was increasing and the major trend in hog prices was downward, is quite different from the price-trend curve (fig. 3) showing the average of all years combined. Here the spring market shows a higher average than the fall market, the March market showing the peak price for the year. Figure 5 shows the same general trend. However, figure 8, which pictures the price trend in years following small corn crops when hog production was decreasing, shows the fall market at higher levels than the spring market. The lower portion of the figure indicates the frequency with which prices advanced in a given month. It shows the upward swing well sustained from 50 to 90 per cent of the time. Figure 7 also shows a well-sustained seasonal advance in hog prices in years which follow large corn crops when hog production is decreasing.
18
19
20
21
22
23
24
25
26 These price trends are well worth considering when one attempts to gauge the risks in the hog market. It is unfortunate that daily price records prior to 1902 are not available, for a closer study of hog prices is often desirable. Price records since 1902 were separated into four groups similar to the price data by months since These, however, were divided into 10-day periods in order to get a closer view of the hog price trends in each group of years. These are shown in figures 9 ro 12. Here again it is apparent that the factor of increasing to decreasing production is the major influence in determining the general direction of hog prices. The size of the corn crop does, however, influence the shape of the price curve. In years following small corn crops, hog prices in the spring of the year are strengthened as a result of heavier marketings than usual the fall before. Also, because of less tendency to hold on to hogs after a small corn crop, midsummer hog prices are better maintained than in years following large corn crops. It is the hog producer who looks ahead and gauges the situation correctly that profits most. It takes nerve to go contrary to what the majority do, but the majority usually are practicing the wrong procedure. HOW CHANGES IN DEMAND AFFECT PRICES I. Changes in Export Demand.-Demand for pork in foreign countries depends in part upon the general trend of commodity prices in those countries. If the prices of most commodities are going up. the price of pork is likely to take a similar trend before long. Buyers will have increased buying power for pork as more is received for other commodities. Since prices in one country engaged in international trade cannot for long get out of line with the prices of another, it is quite likely that increasing pork prices abroad will closely parallel increasing prices in the United States. As price increases tend to parallel each other, the effect will finally be to decrease the quantity demanded at both ends of the line. Parallel advancing prices seem to affect hog production in somewhat the same way, both in the United States and abroad. Rising prices at about the same time start increased production at about the same time. This runs into a decrease in quantity of pork demanded in both countries, and, therefore, tends to start prices down in the United States and abroad at about the same time. It is evident from this that increased production in this country is
27 very likel to run into increased production abroad. This increased production abroad will be another factor tending to lessen foreign demand. At the very time our own prices begin to decline, demand abroad at previous prices is likely to begin to lessen. Foreign demand] therefore, is more likely to parallel our home demand rather than step in and bolster up our prices when our home market is weakening. II. Changes in Demand in the United States.-Many factors affect home demand. Perhaps as good a measure of this demand as the producer can very easily watch is the general trend of commodity prices. Such index numbers as the Bureau of Labor and Fisher s index appear in various current publications and on the market pages of many newspapers. They indicate whether most commodity prices are tending up or down. When commodity prices are tending upward some improvement in hog prices within 6 to 12 months is usually to be expected. When commodity prices are on the down turn some decline in hog prices may, as a rule, be expected in 6 to 12 months. Increasing commodity prices indicate improved demand for pork before long. Conversely, declining commodity prices are a warning that hog prices cannot stand out alone forever, but are likely to soon meet a lessening demand. Reference to Table IV shows how commodity prices in general in, the United States have tended up and down since 1903, the number of months these prices have been up and down, to what extent the ups and downs of hog values parallel this general commodity price movement, what the Chicago average hog price was at the high and low times, and to what extent English pork prices went up and down at the same time as United States hog prices. A study of this table will substantiate some of the things just said about shifts in demand for pork products.
28 MONTHLY SUMMARY OF MARKET FACTORS The Department of Agricultural Economics and the Division of College Extension of Kansas State Agricultural College issue a monthly publication entitled The Kansas Agricultural Situation. This publication gives a brief summary of the various market factors, together with an indication of the probable price trend for the next 30 days. It will be sent free on request. Address, Director of College Extension, Manhattan, Kan. RADIO MARKET SERVICE The information in The Kansas Agricultural Situation is released from Station KSAC at 12:35 p. m. on the tenth of each month. If the tenth falls on Saturday or Sunday the report is given on the following Monday.
29
MARGIN M ANAGER The Leading Resource for Margin Management Education
 Margin Management Since 1999 MARGIN M ANAGER The Leading Resource for Margin Management Education March 2015 Learn more at MarginManager.Com INSIDE THIS ISSUE Dear Ag Industry Associate, Margin Watch Reports
INSIGHTS REPORT VOLUME 08 WHAT S INSIDE. A variable swine market means there are key areas producers should focus on for shortand long-term planning.
 INSIGHTS REPORT VOLUME 08 WHAT S INSIDE A variable swine market means there are key areas producers should focus on for shortand long-term planning. With the current state of the ag economy, it s more
Using the Futures Market in Response to Low Market Prices By Gary Schnitkey
 Monday, Aug 2, 1999 Using the Futures Market in Response to Low Market Prices By Gary Schnitkey Cash market hog prices have been below $20 per cwt. during late October and November, their lowest levels
 We have seen extreme volatility for commodity futures recently. In fact, we could make a case that volatility has been increasing steadily since the original significant moves which began in 2005-06 for
Minnesota Farm Supply Cooperatives
 May 1955 Minnesota Farm Supply Cooperatives ARVID C. KNUDTSON E. FRED KOLLER Introduction. CONTENTS Size of business operations Large volume of credit sales.. Seasonal variations in the use of credit...
World Payments Stresses in
 World Payments Stresses in 1956-57 INTERNATIONAL TRANSACTIONS in the year ending June 1957 resulted in net transfers of gold and dollars from foreign countries to the United States. In the four preceding
GRAIN MARKETS SENSITIVE TO EXPORTS, SOUTH AMERICAN WEATHER
 December 15, 1999 Ames, Iowa Econ. Info. 1779 GRAIN MARKETS SENSITIVE TO EXPORTS, SOUTH AMERICAN WEATHER October, November, and the first 10 days of December were unusually dry over a large part of southern
QUARTERLY GENERAL FUND REVENUE REPORT. October 2013 Barry Boardman, Ph.D. Fiscal Research Division North Carolina General Assembly
 QUARTERLY GENERAL FUND REVENUE REPORT October 2013 Barry Boardman, Ph.D. Fiscal Research Division North Carolina General Assembly 0 Highlights Prior year General Fund revenues were $537.6 million (2.7%)
The Miller's Use of the Commodity Exchange
 The Miller's Use of the Commodity Exchange Fred W. Lake... In outlining the use of the commodity market by millers, there will be instances where millers use the markets in their role as grain merchandisers
Turner s Take WASDE Expectations vs. Sept WASDE report:
 Published by: Craig Turner 11/4/2013 4:02:09 PM In this issue 1) CORN: USDA Friday exected to be bearish. Looking to short Corn ahead of WASDE 2) SOYBEANS: Short Bean Ideas with Long Call Protection 3)
AirPlus International Travel Management Study 2017 Part 1 Forecast of business travel costs and bookings. Where will 2017 take us?
 AirPlus International Travel Management Study 2017 Part 1 Forecast of business travel costs and bookings SWITZERLAND Where will 2017 take us? To kick off the New Year, we bring you the latest forecasts
February 2018 Monthly Commodity Market Overview Newsletter. Stock Index Futures
 February 2018 Monthly Commodity Market Overview Newsletter By the ADMIS Research Team Stock Index Futures There was a severe decline in the first week of February with S&P 500 futures posting the biggest
HEDGING WITH FUTURES AND BASIS
 Futures & Options 1 Introduction The more producer know about the markets, the better equipped producer will be, based on current market conditions and your specific objectives, to decide whether to use
Table of Contents. Introduction
 Table of Contents Option Terminology 2 The Concept of Options 4 How Do I Incorporate Options into My Marketing Plan? 7 Establishing a Minimum Sale Price for Your Livestock Buying Put Options 11 Establishing
Interest Rates during Economic Expansion
 Interest Rates during Economic Expansion INTEREST RATES, after declining during the mild recession in economic activity from mid-1953 to the summer of 1954, began to firm in the fall of 1954, and have
Movements in Time and. Savings Deposits
 Movements in Time and Savings Deposits 1951-1962 Introduction T i m e A N D S A V IN G S D E P O S IT S of commercial banks have increased at very rapid rates since mid- 1960. From June 1960 to December
statistical report monthly NINTH DISTRICT CDNDITI federal reserve bank of minn
 Volume 4, Issue 11 Issued November 12, 1970 statistical report monthly NINTH DISTRICT CDNDITI federal reserve bank of minn JOBLESSNESS REMAINS NEAR ~ PtHCENI in average weekly hours worked in manufacturing
Basis: The price difference between the cash price at a specific location and the price of a specific futures contract.
 Section I Chapter 8: Basis Learning objectives The relationship between cash and futures prices Basis patterns Basis in different regions Speculators trade price, hedgers trade basis Key terms Basis: The
deep cup formed over many months, it makes sense that the measure rule
 34 Rounding Bottoms R E S U L T S SNAPSHOT Appearance A long, rounded upward turn in prices if waited for upside breakout Long-term (over 6 months) consolidation 38% Average rise Percentage meeting predicted
TRADING THE CATTLE AND HOG CRUSH SPREADS
 TRADING THE CATTLE AND HOG CRUSH SPREADS Chicago Mercantile Exchange Inc. (CME) and the Chicago Board of Trade (CBOT) have signed a definitive agreement for CME to provide clearing and related services
Cross Hedging Agricultural Commodities
 Cross Hedging Agricultural Commodities Kansas State University Agricultural Experiment Station and Cooperative Extension Service Manhattan, Kansas 1 Cross Hedging Agricultural Commodities Jennifer Graff
Before we get to all the details, we are going to look at a couple of trades in the first
 CHAPTER 1 Let s Get Started Before we get to all the details, we are going to look at a couple of trades in the first two chapters. From them you will get a good idea where we are heading, and how we are
Answer each of the following questions by circling True or False (2 points each).
.") Name: Econ 337 Agricultural Marketing, Spring 2019 Exam I; March 28, 2019 Answer each of the following questions by circling True or False (2 points each). 1. True False Some risk transfer premium is appropriate
Name: Econ 337 Agricultural Marketing, Spring 2019 Exam I; March 28, 2019 Answer each of the following questions by circling True or False (2 points each). 1. True False Some risk transfer premium is appropriate
Managing Feed and Milk Price Risk: Futures Markets and Insurance Alternatives
 Managing Feed and Milk Price Risk: Futures Markets and Insurance Alternatives Dillon M. Feuz Department of Applied Economics Utah State University 3530 Old Main Hill Logan, UT 84322-3530 435-797-2296 dillon.feuz@usu.edu
1. On Jan. 28, 2011, the February 2011 live cattle futures price was $ per hundredweight.
 Econ 339X Spring 2011 Homework Due 2/8/2011 65 points possible Short answer (two points each): 1. On Jan. 28, 2011, the February 2011 live cattle futures price was $107.50 per hundredweight. If the cash
The Gann Analysis Rule Book
 2006 Gann Managament Ltd. All Rights Reserved. Gann Management Limited is authorised and Regulated by the Financial Services Authority The Gann Analysis Rule Book A Man Who Never Changes His Mind Will
MARGIN M ANAGER The Leading Resource for Margin Management Education
 Margin Management Since 1999 MARGIN M ANAGER The Leading Resource for Margin Management Education Learn more at MarginManager.Com March INSIDE THIS ISSUE Dear Ag Industry Associate, The USDA released several
Contract Hog Production: Contract hog production
 1 MF-1070 Hog enterprise management Contract Hog Production: Contract hog production involves an agreement between a contractor and a grower. The contractor owns and provides feeder pigs for feeder pig
Business insights. Employment and unemployment. Sharp rise in employment since early 1975
 Business insights Employment and unemployment Early each month, usually the first Friday, the United States Bureau of Labor Statistics (BLS) issues its report, "The Employment Situation." This publication
December 2018 Monthly Commodity Market Overview Newsletter. Stock Index Futures
 December 2018 Monthly Commodity Market Overview Newsletter By the ADMIS Research Team of Steve Freed, Alan Bush, Michael Niemiec & Chris Lehner Stock Index Futures Stock index futures have come under pressure
Gordon Thiesssen: The outlook for the Canadian economy and the conduct of monetary policy
 Gordon Thiesssen: The outlook for the Canadian economy and the conduct of monetary policy Remarks by Mr Gordon Thiessen, Governor of the Bank of Canada, to the Calgary Chamber of Commerce, Calgary, on
Brian Grossman (312) ZANER Ag. Burn It All Down Monday Markets
 ZANER Ag. Burn It All Down Monday Markets") Brian Grossman (312) 277-0119 @AgHedgeBrian bgrossman@zaner.com Ag Burn It All Down Monday Markets USDA report day, Friday did little to entice much of any market direction and ultimately left much market
Brian Grossman (312) 277-0119 @AgHedgeBrian bgrossman@zaner.com Ag Burn It All Down Monday Markets USDA report day, Friday did little to entice much of any market direction and ultimately left much market
A BULLISH CASE FOR CORN AND SOYBEANS IN 2016
 A BULLISH CASE FOR CORN AND SOYBEANS IN 2016 Probabilities for higher prices, and the factors that could spur price rallies. Commodity markets tend to move on three variables: perception, momentum and
Price Risk. Management in December Corn Futures. Wayne D. Purcell Alumni Distinguished Professor Department of Agricultural and Applied Economics
 Price Risk Management in December Corn Futures Wayne D. Purcell Alumni Distinguished Professor Department of Agricultural and Applied Economics Agricultural Competitiveness Virginia s Rural Economic Analysis
STRATEGY F UTURES & OPTIONS GUIDE
 STRATEGY F UTURES & OPTIONS GUIDE Introduction Using futures and options, whether separately or in combination, can offer countless trading opportunities. The 21 strategies in this publication are not
AGRIBUSINESS PROFITS AND THE EXTENSION OF CREDIT
 AGRIBUSINESS PROFITS AND THE EXTENSION OF CREDIT There exists no single sector of our economy that has not been impacted by the rapidly rising costs of extending trade and customer credit. As interest
A BOND MARKET IS-LM SYNTHESIS OF INTEREST RATE DETERMINATION
 A BOND MARKET IS-LM SYNTHESIS OF INTEREST RATE DETERMINATION By Greg Eubanks e-mail: dismalscience32@hotmail.com ABSTRACT: This article fills the gaps left by leading introductory macroeconomic textbooks
Exploring the Economy s Progress and Outlook
 EMBARGOED UNTIL Friday, September 9, 2016 at 8:15 A.M. U.S. Eastern Time OR UPON DELIVERY Exploring the Economy s Progress and Outlook Eric S. Rosengren President & Chief Executive Officer Federal Reserve
Economy Is Weaker Than It Seems & Scary Facts On National Debt
 Economy Is Weaker Than It Seems & Scary Facts On National Debt November 9, 2016 by Gary Halbert of Halbert Wealth Management 1. US Unemployment Rate Dropped to 4.9% in October 2. Why the US Economy is
Center for Commercial Agriculture
 Center for Commercial Agriculture The Great Margin Squeeze: Strategies for Managing Through the Cycle by Brent A. Gloy, Michael Boehlje, and David A. Widmar After many years of high commodity prices and
Many students of the Wyckoff method do not associate Wyckoff analysis with futures trading. A Wyckoff Approach To Futures
 A Wyckoff Approach To Futures by Craig F. Schroeder The Wyckoff approach, which has been a standard for decades, is as valid for futures as it is for stocks, but even students of the technique appear to
Wisdom from Edwin Coppock
 Wisdom from Edwin Coppock Edwin Coppock, a US investment adviser and the founder of Trendex, invented the Coppock indicator. He designed the index to do only one thing indicate the time to buy long term
TRADING STRATEGY SERIES LEARN HOW TO SPOT OPPORTUNITIES IN VOLATILE MARKETS fpmarkets.com.au
 1 TRADING STRATEGY SERIES LEARN HOW TO SPOT OPPORTUNITIES IN VOLATILE MARKETS This educational material does not constitute financial product advice and does not take into account your investment objectives,
factors that affect marketing
 Grain Marketing / no. 26 factors that affect marketing Crop Insurance Coverage Producers who buy at least 80 percent Revenue Protection for corn are more likely to indicate that crop insurance is an important
Investment Analysis and Project Assessment
 Strategic Business Planning for Commercial Producers Investment Analysis and Project Assessment Michael Boehlje and Cole Ehmke Center for Food and Agricultural Business Purdue University Capital investment
FEDERAL RESERVE BULLETIN
 FEDERAL RESERVE BULLETIN VOLUME 40 NUMBER 2 Demand deposits and currency increased about 1.5 per cent in 1953. Demand deposits held by individuals and businesses showed a less than seasonal decline early
The End of the Business Cycle?
 to look at not only how much we save, but also at how that saving is invested and how productive that investment is. Much saving goes ultimately into business investment, where it raises future productivity
MARGIN M ANAGER INSIDE THIS ISSUE. Margin Watch Reports. Features DAIRY WHITE PAPER. Dairy... Pg 11 Beef... Corn... Beans... Pg 16 Wheat...
 MARGIN M ANAGER Margin Management Since 1999 The Leading Resource for Margin Management Education Learn more at MarginManager.Com Monthly INSIDE THIS ISSUE Margin Watch Reports Dairy... Pg 11 Beef... Pg
The Impact of the Brazilian Crisis in the Tenth District
 The Impact of the Brazilian Crisis in the Tenth District By Ricardo C. Gazel and Chad R. Wilkerson The recent economic turmoil in Brazil, triggered by the devaluation in January of the real (Brazil s currency),
Market Insight: Turn Down the News Volume, Listen to the Market
 August 9, 2018 Market Insight: Turn Down the News Volume, Listen to the Market If you just listened to the news headlines, it would be hard to find reasons to like this market. Trade Wars ; Tariff Threats
November 2017 Monthly Commodity Market Overview Newsletter
 November 2017 Monthly Commodity Market Overview Newsletter By the ADMIS Research Team Stock Index Futures S&P 500, Dow Jones, NASDAQ and Russell 2000 futures registered new historical highs in November.
New Statistics of BTS Panel
 THIRD JOINT EUROPEAN COMMISSION OECD WORKSHOP ON INTERNATIONAL DEVELOPMENT OF BUSINESS AND CONSUMER TENDENCY SURVEYS BRUSSELS 12 13 NOVEMBER 27 New Statistics of BTS Panel Serguey TSUKHLO Head, Business
Figure1: Alberta Index 100 Weekly Average Hog Price
 Hog Market Contracting in Western Canada Introduction Hog prices vary significantly over time as shown in Figure 1. The chart shows that producers face significant price risk. Sometimes producers have
"Sharing real experiences from decades of profitable trading. Focusing on the important factors that lead to trading success.
 "Sharing real experiences from decades of profitable trading. Focusing on the important factors that lead to trading success. May 20, 2017 Continuation vs. Continuous Futures Charting Background The Apr
Commodity products. Grain and Oilseed Hedger's Guide
 Commodity products Grain and Oilseed Hedger's Guide In a world of increasing volatility, customers around the globe rely on CME Group as their premier source for price discovery and managing risk. Formed
I produce these economics and markets reports every two months. We produce, more frequently, more in-depth reports, for clients.
 I produce these economics and markets reports every two months. We produce, more frequently, more in-depth reports, for clients. It was all over the 'News'. Stocks are crashing. Is this a Recession beginning?
Lars Heikensten: Monetary policy and the economic situation
 Lars Heikensten: Monetary policy and the economic situation Speech by Mr Lars Heikensten, Governor of the Sveriges Riksbank, at Handelsbanken, Karlstad, 26 January 2004. * * * It is nice to meet a group
STAFF PAPERS In addition
 Federal Reserve Security Transactions, 1954-63 by STEPHEN H. AXILROD AND JANICE KRUMMACK IN THE LAST 3 YEARS of the decade 1954-63, Federal Reserve open market transactions in U.S. Government securities
Automatic transfers: Evolution of the service and impact on money
 Automatic transfers: Evolution of the service and impact on money Randall C. Merris Commercial banks began offering automatic transfers from consumer savings to checking accounts November 1. With transfers
Some Thoughts on Roller Coaster Investing
 Some Thoughts on Roller Coaster Investing Take a look at this roller coaster stock price chart. The stock crashed by 63% in just 118 days between late 2008 and early 2009. Then, after a rise over the next
EC Grain Pricing Alternatives
 University of Nebraska - Lincoln DigitalCommons@University of Nebraska - Lincoln Historical Materials from University of Nebraska- Lincoln Extension Extension 1977 EC77-868 Grain Pricing Alternatives Lynn
18 INTERNATIONAL FINANCE* Chapter. Key Concepts
 Chapter 18 INTERNATIONAL FINANCE* Key Concepts Financing International Trade The balance of payments accounts measure international transactions. Current account records exports, imports, net interest,
Volume URL: Chapter Title: Cash and the Volume of Transactions. Chapter URL:
 This PDF is a selection from an out-of-print volume from the National Bureau of Economic Research Volume Title: Corporate Cash Balances, 1914-43: Manufacturing and Trade Volume Author/Editor: Friedrich
Patterns of Unemployment
 Patterns of Unemployment By: OpenStaxCollege Let s look at how unemployment rates have changed over time and how various groups of people are affected by unemployment differently. The Historical U.S. Unemployment
in North Dakota GARY M. BEDKER EDDIE DUNN TIMOTHY A. PETRY
 jricultural Economics Report No. 112 March 1976 THE FEASIBILITY OF A Cooperatively Owned Large-Scale Hog Farrowing System in North Dakota GARY M. BEDKER EDDIE DUNN TIMOTHY A. PETRY Department of Agricultural
MARKETLINE. Soybeans: Bullish Acreage Report. Cash Only. Future Hedgers. What to Sell. Future Hedgers. Only
 MARKETLINE www.progressiveag.com 701-277-9210 1-800-450-1404 April 1, 2016 What to Sell Cash Only Cash Only Future Hedgers Future Hedgers Week s Rank 2015 2016 2015 2016 1. HRS Wheat 30% 0% 30% 0% 2. Soybeans
Introduction to Agricultural Economics Agricultural Economics 105 Spring 2018 Third Hour Exam
 1 Name Introduction to Agricultural Economics Agricultural Economics 105 Spring 2018 Third Hour Exam There is only ONE best, correct answer per question. Place your answer on the attached sheet. DO NOT
Seasonal price patterns of selected agricultural commodities
 Special Report Iowa Agricultural and Home Economics Experiment Station Publications 9-1968 Seasonal price patterns of selected agricultural commodities Allan P. Rahn Iowa State University Follow this and
Comparison of Premiums and Returns in Organic Pork Production
 Iowa State University Management/Economics Comparison of Premiums and Returns in Organic Pork Production Ben Larson, research assistant and James Kliebenstein, professor; Department of Economics; and Mark
Federal Reserve Bulletin: May Seasonally NONINOUSTRIAL INDUSTRIAL i I I I! » 1960
 THE LABOR MARKET HAS REFLECTED the high rate of general economic activity prevailing this year. Seasonally adjusted nonfarm employment has risen somewhat further. Total labor income has continued to increase
Strike prices are listed at predetermined price levels for each commodity: every 25 cents for soybeans, and 10 cents for corn.
 Types of Options If you buy an option to buy futures, you own a call option. If you buy an option to sell futures, you own a put option. Call and put options are separate and distinct options. Calls and
Financial Management Practices of New York Dairy Farms
 July 2002 R.B. 2002-09 Financial Management Practices of New York Dairy Farms By Brent A. Gloy, Eddy L. LaDue, and Kevin Youngblood Agricultural Finance and Management at Cornell Cornell Program on Agricultural
Fin 4200 Project. Jessi Sagner 11/15/11
 Fin 4200 Project Jessi Sagner 11/15/11 All Option information is outlined in appendix A Option Strategy The strategy I chose was to go long 1 call and 1 put at the same strike price, but different times
Anyone studying the stock market intends to remove themselves from the ranks of the public that
 Serving a trading apprenticeship The Wyckoff method of trading stocks part 13 by Jack K. Hutson Anyone studying the stock market intends to remove themselves from the ranks of the public that dabbles with
PROCEEDINGS OF THE AGRICULTURAL ECONOMISTS HELD AT CORNELL UNIVERSITY, ITHACA; NEW YORK, AUGUST 18 TO AUGUST 29, 1930
 PROCEEDINGS OF THE SECOND,, INTERNATIONAL. CONFERENCE OF AGRICULTURAL ECONOMISTS HELD AT CORNELL UNIVERSITY, ITHACA; NEW YORK, AUGUST 18 TO AUGUST 29, 1930 U:l]e
TREASURY DEPARTMENT Washington
 TREASURY DEPARTMENT Washington (The following address by Roy Blough, Director of the Division of Tax Research Treasury Department, was delivered before the Tax Institute, New York on February 7, 1944.)
OSCILLATORS. TradeSmart Education Center
 OSCILLATORS TradeSmart Education Center TABLE OF CONTENTS Oscillators Bollinger Bands... Commodity Channel Index.. Fast Stochastic... KST (Short term, Intermediate term, Long term) MACD... Momentum Relative
PFIN 10: Understanding Saving and Investing 62
 PFIN 10: Understanding Saving and Investing 62 10-1 Reasons for Saving and Investing OBJECTIVES Explain the difference between saving and investing. Describe reasons for saving and investing. Describe
AGRICULTURAL LENDER SURVEY RESULTS
 Summer 2017 AGRICULTURAL LENDER SURVEY RESULTS Summer 2017 / Agricultural Lender Survey Results / 1 Contents Key Takeaways... 3 Introduction... 4 Agricultural Economy... 5 Farm Profitability and Economic
Northern Trust Investments is proud to sponsor this podcast Investing in a World of
 INVESTING IN A WORLD OF BUBBLES Northern Trust Investments is proud to sponsor this podcast Investing in a World of Bubbles. This podcast will be of particular interest to advisors looking to help temper
Malawi Tea 2020 Revitalisation programme towards living wage. Wages Committee progress report 2016
 Malawi Tea 2020 Revitalisation programme towards living wage Wages Committee progress report 2016 By Richard Anker and Martha Anker October 2016 This paper provides an update to October 2016 (date of
A moving average line is just that. It smoothes price over time, reducing erratic, shorter-term swings to
 Volume-adjusted moving averages by Richard W. Arms Jr. A moving average line is just that. It smoothes price over time, reducing erratic, shorter-term swings to a smoother, more comprehensible line. Any
CONTENTS INTRODUCTION... 4 AGRICULTURE'S CONTRIBUTION... 4 U.S. BALANCE OF PAYMENTS FIGURES
 CONTENTS Page SU~RY. o o o o 3 INTRODUCTION...................................................... 4 AGRICULTURE'S CONTRIBUTION....... 4 U.S. BALANCE OF PAYMENTS............................................
HOG RISK MANAGEMENT SURVEY: SUMMARY AND PRELIMINARY ANALYSIS
 HOG RISK MANAGEMENT SURVEY: SUMMARY AND PRELIMINARY ANALYSIS by George F. Patrick, Purdue University Alan E. Baquet, University of Nebraska Keith H. Coble, Mississippi State University, Thomas O. Knight,
FED POLICY POST OCTOBER 6. Remarks by. David P. Eastburn. President. Federal Reserve Bank of Philadelphia. Before the. Philadelphia Chapter
 FED POLICY POST OCTOBER 6 Remarks by David P. Eastburn President Federal Reserve Bank of Philadelphia Before the Philadelphia Chapter Financial Executives Institute Philadelphia, Pennsylvania November
THE HIGHTOWER REPORT
 Futures Analysis & Forecasting HightowerReport.com March 21, 214 Strategies for March 31st Report: Non-standard Options New, non-standard options at the CME can be great tools for commodity traders, especially
JULY 2017 Monthly Commodity Market Overview Newsletter. Stock Indexes. By the ADMIS Research Team
 JULY 2017 Monthly Commodity Market Overview Newsletter By the ADMIS Research Team Stock Indexes S&P 500, Dow Jones and NASDAQ futures advanced to new historical highs in spite of several bearish economic
Assessor s Office. Our Township Blackberry Our Community. Any Relief in Sight for Property Taxes? Uwe Rotter CIAO. Did You Know?
 Assessor s Office Uwe Rotter CIAO Any Relief in Sight for Property Taxes? Many residents of our township have contacted my office questioning the value of their assessment in a steadily declining market
Welcome again to our Farm Management and Finance educational series. Borrowing money is something that is a necessary aspect of running a farm or
 Welcome again to our Farm Management and Finance educational series. Borrowing money is something that is a necessary aspect of running a farm or ranch business for most of us, at least at some point in
Resistance to support
 1 2 2.3.3.1 Resistance to support In this example price is clearly consolidated and we can expect a breakout at some time in the future. This breakout could be short or it could be long. 3 2.3.3.1 Resistance
A Business Newsletter for Agriculture
 A Business Newsletter for Agriculture Vol. 10, No. 8 June 2006 www.extension.iastate.edu/agdm Accumulator Contracts by Steven D. Johnson, Ph.D., Farm & Ag Business Management Field Specialist, Iowa State
The Dairy Margin Protection Program - Is It Right for Me?
 The Dairy Margin Protection Program - Is It Right for Me? Many dairy producers have questions regarding the new government Margin Protection Program including if they should sign up for it and how it will
SRC Annual Summary of Agricultural Conditions
 SRC Annual Summary of Agricultural Conditions The Division of Supervision, Regulation, and Credit at the Federal Reserve Bank of Minneapolis conducts an annual survey of Ninth District state member banks
FOREX LEARNING BY MADIBA MALEBO
 FOREX LEARNING BY MADIBA MALEBO INTRODUCTION TO TREND AND ANALYSIS TREND ANALYSIS. PEAKS AND TROUGHS. SPOTTING UPTRENDS. SPOTTING DOWNTRENDS. TAKING ADVANTAGE OF TRENDS. TAKING ADVANTAGE OF DOWNTREND.
Counter-Cyclical Agricultural Program Payments: Is It Time to Look at Revenue?
 Counter-Cyclical Agricultural Program Payments: Is It Time to Look at Revenue? Chad E. Hart and Bruce A. Babcock Briefing Paper 99-BP 28 December 2000 Revised Center for Agricultural and Rural Development
MOLONEY A.M. SYSTEMS THE FINANCIAL MODELLING MODULE A BRIEF DESCRIPTION
 MOLONEY A.M. SYSTEMS THE FINANCIAL MODELLING MODULE A BRIEF DESCRIPTION Dec 2005 1.0 Summary of Financial Modelling Process: The Moloney Financial Modelling software contained within the excel file Model
Ashley Gulke Leavitt Gulke Group, Inc
 Ashley Gulke Leavitt Gulke Group, Inc How To Read Market Charts Cell Phone: 815-520-4227 Email:Ashley@gulkegroup.com Technical Analysis: Looking at past price movements to project future movements. Pros/
presented by Thomas Wood MicroQuant SM Divergence Trading Workshop Day One Naked Trading Part 2
 presented by Thomas Wood MicroQuant SM Divergence Trading Workshop Day One Naked Trading Part 2 Risk Disclaimer Trading or investing carries a high level of risk, and is not suitable for all persons. Before
WASHINGTON NOTES NOTES 307
 NOTES 307 American. Thus, quite apart from political understanding such as was manifested in the Ishii-Lansing agreement, the "consciousness of difference" must in time be displaced, to use Professor Giddings'
The Mortgage Guide. Helping you find the right mortgage for you. Brought to you by. V a
 The Mortgage Guide Helping you find the right mortgage for you Brought to you by V0050713a Hello. We re the Which? Mortgage Advisers team. Buying a house is the biggest financial commitment most of us