"Sharing real experiences from decades of profitable trading. Focusing on the important factors that lead to trading success.
|
|
|
- Barbra Craig
- 6 years ago
- Views:
Transcription

1 "Sharing real experiences from decades of profitable trading. Focusing on the important factors that lead to trading success. May 20, 2017 Continuation vs. Continuous Futures Charting Background The Apr 16, 2017 Factor Update addressed a member s question on the use of Continuation vs. Continuous futures charting. I came down hard in favor of Continuation charts and against Continuous charts (in hindsight I was actually too harsh toward Continuous graphs). My good friend and peer Jack Schwager posted a piece on LinkedIn taking the other side of the debate. See for his post, Should Futures Charts Be Spread-Adjusted at Contract Rollovers? A Difference of Opinion. A PDF copy of Jack s LinkedIn post is a companion piece to this document. Please read Jack s post before proceeding In a private dialogue with Jack we agreed that a public response by me to his post might be of educational value to traders attempting to better understand the characteristics of Continuation and Continuous charts. This document should IN NO WAY be viewed as a rebuttal to Jack he and I have way too much respect and fondness for each other to engage in a debate that reflects any criticism. It is difficult for me to imagine having greater respect for another trader or human being than I have for Jack Schwager. Jack will go down as THE AUTHOR ON RECORD in this generation for great trading books (such as the Market Wizard series) and the definitive book on futures trading (The Complete Guide to the Futures Market, John Wiley and Sons). It was one of my career highlights to write the forward to one of the books in Jack s Market Wizard series. Understanding the issue Individual futures contracts have limited lives sometimes only a matter of months from inception to expiration. The challenge is to construct a longer-term chart of a futures market given the limited lifespan of individual contract months. Most speculators concentrate their trading activity in the nearest (and most active) contract month. Usually just prior to or in the first week of an expiration month traders will move their trading activity to next contract month in the series. Some markets have very few major contract months, such as currencies (Mar, Jun, Sep and Dec) while other markets have a contract for every month of the year (Crude Oil). Most commonly, the price of the soon-to-expire contract month will be trading at a lower price than the next contract month in line which will be trading at a lower price than the second contract in line, and so on. This is referred to as backwardation (or carrying-charge) pricing structure. 1
2 In some markets the price of the expiring contract may be higher than the price of the next contract month in line which may be higher than the second contract month in line, and so on. This condition is especially true during times of short supply or supply-chain disruption. This condition is referred to as a contango (or inverted) pricing structure as shown in the graph on page 1. Long-term charts of futures markets are constructed by linking or stringing together contracts in their sequential chronological order. There are two approaches to do this and three variations of the two different approaches. Continuation charting. This method rolls one contract month to the next contract month without any adjustment when the two contracts are at different prices at the time of the roll. This is the approach I highly favor, even though a sizable price gap might exist between the contract month being dropped and the next contract month in line. Continuous (or roll-adjusted) charting. This method back-adjusts the price history of the contract being expired or rolled to eliminate the price gap between the expiring contract and the contract replacing it. The price of the contract being dropped is adjusted upwards or downwards to the price level of the contract being picked up in the series on the day of the roll. This is the approach preferred by Jack Schwager and others. The three variations of each approach. There are three variations on when the roll occurs on Continuation and Continuous graphs. Roll at first trading day of expiration month. On my trading platform (Trade Navigator) this is referred to as 055 for the Continuation charts and 065 for the Continuous (roll-adjusted) charts. Retail traders are generally not allowed by their FCMs to hold positions past the first notice day of an expiration month. Roll at contract expiration. On Trade Navigator this is referred to as 056 for the Continuation charts and 066 for the Continuous (roll-adjusted) charts. Roll based on volume and open interest. This charting variation rolls from an expiring contract to the next contract in the series when the next contract becomes the most actively traded. On Trade Navigator this is referred to as 057 for the Continuation charts and 067 for Continuous (roll-adjusted) charts. It is not unusual for the 055 and 057 to roll on the same exact day or within a day or two of each other (also true for 065 and 067). Why I prefer Continuation charts vs. Continuous (roll-adjusted) charts The entire raison d etre for the futures markets is to enable commercial interests to lock in the approximate price at which they will buy or sell an underlying commodity or instrument in the cash or spot market at some future date thus, the benchmark or reference point for all futures pricing is the cash or spot market. In short, the futures markets cannot exist in an orderly manner if the pricing structure is not linked to cash settlement (as is the case in most financial instruments) or delivery of actual commodity items (as is the case in most agricultural instruments). The price of an expiring futures contract will converge upon the cash price of an underlying financial instrument or commodity item as expiration approaches. The price of an expiring futures contract for a financial instrument is often identical to the cash market price on the date of expiration. There is a strong tendency for the price of an expiring raw material futures contract to converge with its corresponding cash market price on the day of expiration but the convergence is not to the degree characterized by financial instrument futures contracts. There are several factors that may prevent convergence between the cash market and an expiring commodity futures contract for deliverables. 2
3 Dislocation of supply in relationship to delivery locations specified by the contract specifications Disruption of the supply chain Tightness of supply Yet, the fact futures contracts are subject to delivery of physical commodities forces convergence most of the time. For example, an extreme premium in the price of an expiring Live Cattle contract relative to the cash market price could prompt cattle feedlot facilities to sell futures contracts with the intent upon making delivery. This process would tend to correct the price imbalance. Similarly, an extreme discount in the price an expiring Live Cattle contract relative to the cash market could prompt beef processors to buy futures contract with the intend upon taking delivery. The delivery process acts as a form of arbitrage. To repeat futures markets could not exist in an orderly manner if delinked from their corresponding cash markets. In fact, cash markets ranging from Corn at a local grain elevator in Mankato, Minnesota to Soybeans on a barge in the Gulf of Mexico to copper wire in a warehouse in Hamburg, Germany to a pile of Gold bars in South Africa to U.S. Treasury Notes being traded in London all are expressed in relationship to futures prices. For me, the question is whether Continuation or Continuous (roll-adjusted) charting of a given market better reflects the historical price trends of the underlying instrument (financial or commodity). I will examine this question through a series of price graphs. The first sequence (pages 4-9) stacks Continuation charts, cash charts and Continuous charts for several markets. I suggest that readers look at these to determine whether Continuation charts or Continuous charts better reflect the price history of the respective cash markets. The second sequence (pages 10-16) stacks the actual spread (or differential charts) charts of the cash market vs. the Continuation chart and cash market vs. the Continuous (or back-adjusted) chart for several commodities. I will let you the reader make up your own mind on whether Continuation or Continuous graphs are a better match to the reality expressed by the underlying cash markets for which the futures markets are intended by design and contract specifications to represent. A discussion begins on page 17. 3

4 Lean Hogs 4

5 Kansas City Wheat 5

6 Crude Oil 6
7 Corn 7

8 Soybeans 8

9 Natural Gas 9
10 Spread charts Cash Market minus Continuation Pricing (top) and Cash Market minus Continuous Pricing (bottom) Crude Oil. With the exception of two brief spikes in the spread differential between the Cash market and the Continuation nearby contract month, the two have reliably converged to within a 60-point range during the past 30 years. In short, the Continuation chart has converged with cash. The spread differential between the Cash market and Continuous chart (back-adjusted) has a 30-year range of $70 per barrel, or a price far greater than the current flat price of Crude Oil. The Continuous Chart does not accurately track the historical cash market. 10
11 Soybeans. With the exception of a few spikes in the spread differential between the cash market and the Continuation nearby contract month, the two have reliably converged to within a 40-cent range during the past 45 years. The spikes have occurred during the old crop/new crop transition. In short, the Continuation chart has converged with cash. The spread differential between the Cash market and Continuous chart (back-adjusted) has a 45-year range of more than $20 per bushel, or a price far greater than Soybeans have ever traded. The Continuous chart does not accurately track the historical cash market. 11
12 Soybean Meal. With the exception of a few recent (and large) spikes in the spread differential between the cash market and the Continuation nearby contract month, the two have reliably converged to within a $30 per ton range during the past 45 years. The spikes have occurred during the old crop/new crop transition. In short, the Continuation chart has converged with cash. The spread differential between the cash market and Continuous chart (back-adjusted) has a 45-year range of more than $1,200 per tone, or double the all-time high price of Meal. The Continuous chart does not accurately track the historical cash market. 12
13 DJIA. With the exception of a few spikes in the spread differential between the cash market and the Continuation nearby contract month, the two have reliably converged over the years. More often than not the expiring contract and cash have been near identical at the moment of expiration. In short, the Continuation chart has converged with cash. I will not even comment on the chart below, representing the spread differential between cash and Continuous chart (back-adjusted). There are some technical reasons the spread differential between Continuous chart and the cash market has steadily trended down. 13
14 Lean Hogs. Despite the tendency for large roll gaps in Lean Hogs, the the spread differential between the Cash market and the Continuation nearby contract month have reliably converged over the years. The spread differential between the Cash market and Continuous chart (back-adjusted) has a 45-year range of more than $250 per hundred weight, or nearly double the all-time high price of Hogs. The Continuous chart does not accurately track the historical cash market. 14
15 Platinum. Same story of convergence. Same story of lack of convergence. 15
16 Sugar. Convergence. Lack of convergence. 16
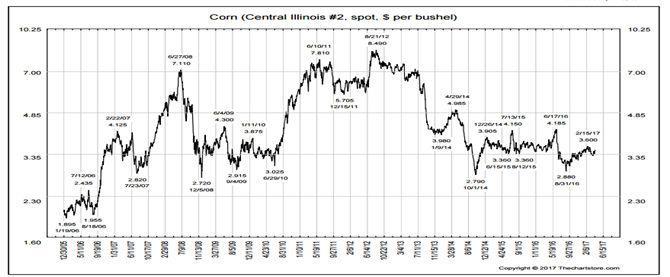
17 Discussion The real value of price charts are: Charts show where markets have been and presently are from an historical perspective Charts can help identify the timing of asymmetrical profit to risk trading opportunities Charts can show a price level where the directional bet and/or timing of a trade are wrong Given that most individual futures contract months have a very limited lifespan, it is necessary to patch expiring contracts together to generate longer-term price charts. How to do it? That is the question. Which method of constructing longer-term charts Continuation or Continuous (roll-adjusted) provides a better pictorial record of actual historical pricing? In his blog post Jack to his credit selected two of the very best examples of contract rolls showing the temporary inadequacy of the continuation method of charting. These are two examples I would have used had I wished to stake a claim on Continuous Charting. Corn Corn supplies were extremely tight in the 2012/2013 crop year. The carryout supplies in Sep 2013 were 621 million bushels representing only 20 days of demand, draining the channels of distribution. Prices remained high though the expiration of the Jul 2013 contract. At that point the grain market assumed that the all-time record acreage of Corn planted in the spring of 2013 would produce an all-time record harvest, which in fact occurred. Thus, the Jul 2013 contract expired at $7.01 and was replaced on the Continuation chart by the Sep 2013 contract priced at $5.42 creating a $1.59 gap. There is no doubt that a Continuation chart with a $1.59 roll gap creates a problem. 17
18 Lean Hogs Jack also selected Lean Hogs as a market that displays roll-gap problems on Continuation graphs. I will readily admit that the Lean Hog market is the single most problematic market for roll gaps, followed by Live Cattle. In fact, agricultural markets in general experience the largest roll gaps. In defense of Continuation chart The issue is not whether roll gaps exist in Continuation charts. The issue is which charting style, Continuation or Continuous, best represent the actual pricing history on longer-term charts so that the following questions can be assessed: Which charting method best shows where a market has been and where it is now relative to its historical pricing structure (i.e., trends, support and resistance levels, etc.)? Which charting method might display a classical chart configuration corresponding to a potential chart pattern-based trend in the underlying cash market? As a trader who believes underlying cash markets drive futures markets the answer to these two questions is unqualified and unequivocal CONTINUATION CHARTS. Continuous charting in its attempt to removed roll gaps can completely distort past price history beyond any resemblance of actual reality. The past pricing history of Continuous charts is artificial with the exception of the current nearby contract month being plotted. With Continuation charts I know for certain that each bar in the time frame viewed represented the pricing of the actual contract month in the nearby position in other words, REAL PRICES that actually occurred. In short, Continuous charting can create a distorted price history in its efforts to eliminate the roll gap. If the charts on the previous pages have not hit home on this premise, let me once again review the Continuation vs. Continuous charts of two markets Soybeans and Live Cattle. We know that every bar on the Continuation charts represents ACTUAL prices and that nearly every bar on the Continuous charts prior to the current nearby contract is manufactured. 18
19 19
20 20
21 Can Continuous Charts provide value to traders? While preferring Continuation charts for overall market analysis and to identify asymmetric reward to risk trading opportunities, I do find some common ground with Jack. Continuous charts provide two distinct advantages over Continuation graphs. Firstly, Continuous data is required to properly back-test a systematic trading approach or set of computerized trading rules precisely because the gap rolls are eliminated. Using the Corn example from page 17, a back-tested trading system would have covered a simulated position in Jul Corn at 7.01 and re-established the position in the Sep contract at 5.42, a much lower price. The 1.59 price differential between the two contracts would not have caused a gain or loss in a simulated Continuous trade. The systematic trading rules applied to Jul Corn would simply be switched over the Sep contract. In contrast to Continuous data, Continuation data cannot be used to back-test a systematic trading program. Secondly (and related to the first point), a Continuous chart indicates whether the roll structure of a particular market has displayed a long-term bias in favor of either long or short position holders. A Continuous chart is a proxy for what would have happened to a trader who continuously maintained a long or short position throughout an extended length of time. This feature of Continuous charts is best explained by two examples. The Continuation chart of KC Wheat displays a market that is about where it was in late However, the Continuous chart of KC Wheat shows that a trader continuously long KC Wheat would have done very poorly while a trader continuously short KC Wheat would have done quite well. Thus, the roll structure in K.C. Wheat has favored traders on the short side (top and bottom left). By contrast, the roll structure in Soybeans has favored traders on the long side (top and bottom right). 21
22 The final take-away For me, Continuation charting is far superior to Continuous charting for plotting prices that accurately reflect historical reality Continuation charts track quite well with the cash market for a commodity or financial instrument whereas Continuous charts can greatly misrepresent the price history of the underlying markets Continuation charts are mandatory for displaying levels of long-term support and resistance Continuous data is mandatory for back-testing systematic trading rules Continuous charting provides insight as to whether the roll structure of a market has historically favored the long side or short side If a trader can make money using Continuous Charts, who am I to object. I believe that every trader needs to discover the things that work for them. For me it is Continuation charting. Neither Continuation or Continuous prices are tradeable trading must be conducted in individual contract months While Continuation charts provide a best long-term perspective on historic levels of support and resistance, trades should only be made when the chart of an individual contract month provides an appropriate trading signal. Neither Continuation nor Continuous charts are valuable by themselves for short- to intermediate-term timing. plb ### 22
Basis: The price difference between the cash price at a specific location and the price of a specific futures contract.
 Section I Chapter 8: Basis Learning objectives The relationship between cash and futures prices Basis patterns Basis in different regions Speculators trade price, hedgers trade basis Key terms Basis: The
ACE 427 Spring Lecture 6. by Professor Scott H. Irwin
 ACE 427 Spring 2013 Lecture 6 Forecasting Crop Prices with Futures Prices by Professor Scott H. Irwin Required Reading: Schwager, J.D. Ch. 2: For Beginners Only. Schwager on Futures: Fundamental Analysis,
Improving Your Crop Marketing Skills: Basis, Cost of Ownership, and Market Carry
 Improving Your Crop Marketing Skills: Basis, Cost of Ownership, and Market Carry Nathan Thompson & James Mintert Purdue Center for Commercial Agriculture Many Different Ways to Price Grain Today 1) Spot
DIGGING DEEPER INTO THE VOLATILITY ASPECTS OF AGRICULTURAL OPTIONS
 R.J. O'BRIEN ESTABLISHED IN 1914 DIGGING DEEPER INTO THE VOLATILITY ASPECTS OF AGRICULTURAL OPTIONS This article is a part of a series published by R.J. O Brien & Associates Inc. on risk management topics
Fundamental Factors Affecting Agricultural and Other Commodities. Research & Product Development Updated July 11, 2008
 Fundamental Factors Affecting Agricultural and Other Commodities Research & Product Development Updated July 11, 2008 Outline Review of key supply and demand factors affecting commodity markets World stocks-to-use
Passive Investors and Managed Money in Commodity Futures. Part 3: Volatility. Prepared for: The CME Group. Prepared by:
 Passive Investors and Managed Money in Commodity Futures Part 3: Prepared for: The CME Group Prepared by: October, 2008 Table of Contents Section Slide Number Objective and Approach 3 Graphs 4-13 Correlation
Chart Pattern Secrets
 Chart Pattern Secrets April 09, 2019 Next Alert: 04/11/19 The Trading System: Application of Trading Chart Patterns with Futures and Option Contracts Copyright 1997 All rights reserved. 1 The dollar made
Answer each of the following questions by circling True or False (2 points each).
.") Name: Econ 337 Agricultural Marketing, Spring 2019 Exam I; March 28, 2019 Answer each of the following questions by circling True or False (2 points each). 1. True False Some risk transfer premium is appropriate
Name: Econ 337 Agricultural Marketing, Spring 2019 Exam I; March 28, 2019 Answer each of the following questions by circling True or False (2 points each). 1. True False Some risk transfer premium is appropriate
2013 Risk and Profit Conference Breakout Session Presenters. 4. Basics of Futures and Options: Part 1
 2013 Risk and Profit Conference Breakout Session Presenters Sean Fox 4. Basics of Futures and Options: Part 1 John A. (Sean) Fox is a native of Ireland and has been on the faculty
Goldman Sachs Commodity Index
 600 450 300 29 Jul 1992 188.3 150 0 Goldman Sachs Commodity Index 31 Oct 2007 598 06 Feb 2002 170.25 Average yearly return = 23.8% Jul-94 Jul-95 Jul-96 Jul-97 Jul-98 Jul-99 Jul-00 Jul-01 Jul-02 Jul-03
COMMODITY PRODUCTS Moore Research Report. Seasonals Charts Strategies GRAINS
 COMMODITY PRODUCTS 28 Moore Research Report Seasonals Charts Strategies GRAINS Welcome to the 28 Moore Historical GRAINS Report This comprehensive report provides historical daily charts, cash and basis
COMMODITY PRODUCTS Moore Research Report. Seasonals Charts Strategies SOYBEAN COMPLEX
 COMMODITY PRODUCTS 8 Moore Research Report Seasonals Charts Strategies SOYBEAN COMPLEX Welcome to the 8 Moore Historical SOYBEAN COMPLEX Report This comprehensive report provides historical daily charts,
Commodity Price Outlook & Risks
 Commodity Outlook & Risks Research Department, Commodities Team March, 2 www.imf.org/commodities commodities@imf.org This monthly report presents a price outlook and risk assessment for selected commodities
Influences on the Market. Common Marketing Terms. Types of Contracts. Terms of Contracts
 Jackie Reichter DeBruce Grain, Nebraska City Grain Marketing Commodity od Exchanges/Futures Symbols Influences on the Market Common Marketing Terms Types of Contracts Terms of Contracts Commodity Exchanges
MARGIN M ANAGER The Leading Resource for Margin Management Education
 Margin Management Since 1999 MARGIN M ANAGER The Leading Resource for Margin Management Education June 2015 Learn more at MarginManager.Com INSIDE THIS ISSUE Feature Article Open Outcry Goes Dark Pg 2
FNCE4040 Derivatives Chapter 2
 FNCE4040 Derivatives Chapter 2 Mechanics of Futures Markets Futures Contracts Available on a wide range of assets Exchange traded Specifications need to be defined: What can be delivered, Where it can
HEDGING WITH FUTURES. Understanding Price Risk
 HEDGING WITH FUTURES Think about a sport you enjoy playing. In many sports, such as football, volleyball, or basketball, there are two general components to the game: offense and defense. What would happen
AGRICULTURAL RISK MANAGEMENT. Global Grain Geneva November 12, 2013
 AGRICULTURAL RISK MANAGEMENT Global Grain Geneva November 12, 2013 Managing Price Risk is Easier to Swallow Than THE ALTERNATIVE Is Your Business Protected Is Your Business Protected Is Your Business Protected
Skewness Strategies in Commodity Futures Markets
 Skewness Strategies in Commodity Futures Markets Adrian Fernandez-Perez, Auckland University of Technology Bart Frijns, Auckland University of Technology Ana-Maria Fuertes, Cass Business School Joëlle
Commodity Price Outlook & Risks
 Commodity Outlook & Risks Research Department, Commodities Team 1 December 22, 20 www.imf.org/commodities commodities@imf.org This monthly report presents a price outlook and risk assessment for selected
Informed Storage: Understanding the Risks and Opportunities
 Art Informed Storage: Understanding the Risks and Opportunities Randy Fortenbery School of Economic Sciences College of Agricultural, Human, and Natural Resource Sciences Washington State University The
Chart Pattern Secrets
 Chart Pattern Secrets April 02, 2019 Next Alert: 04/04/19 The Trading System: Application of Trading Chart Patterns with Futures and Option Contracts Copyright 1997 All rights reserved. 1 The dollar made
MARGIN M ANAGER The Leading Resource for Margin Management Education
 Margin Management Since 1999 MARGIN M ANAGER The Leading Resource for Margin Management Education March 2015 Learn more at MarginManager.Com INSIDE THIS ISSUE Dear Ag Industry Associate, Margin Watch Reports
Analyze the Market for a Seasonal Bias. It is recommended never to buck the seasonal nature of a market. What is a Seasonal Trend?
 The seasonal trend in a market is our way of taking the fundamental price action of a market...and then chart it year-by-year. Analyze the Market for a Seasonal Bias STEP 5 Using Track n Trade Pro charting
By Tom Leffler and Larry Glenn. 14- Day RSI. 10-Day Moving Avg. Today's Low
 www.lefflercom.com By Tom Leffler and Larry Glenn TODAY S THOUGHT Friday, December 30, 2016 HAPPY NEW YEAR 2017 MONDAY, JAN 2 ND GRAINS OPEN AT 7 PM.TUESDAY, JAN 3 RD LIVESTOCK OPENS AT 8:30 AM Tues Jan
Saturday, January 5, Notes from Al
 Get This Newsletter Every Saturday from Al Kluis Commodities..."Your Markets, Right Now"...AlKluis.com Saturday, January 5, 2013 Notes from Al Happy New Year and welcome to a volatile 2013. It has been
Factor LLC Colorado Springs, CO Web:
 Factor Update, July 3, 2016 This Update is being released during market hours on Friday, July 1. Happy July 4 th weekend to U.S. citizens! Due to the July 4 th Holiday this is an abbreviated Update. Market
BROAD COMMODITY INDEX
 BROAD COMMODITY INDEX COMMENTARY + STRATEGY FACTS APRIL 2017 80.00% CUMULATIVE PERFORMANCE ( SINCE JANUARY 2007* ) 60.00% 40.00% 20.00% 0.00% -20.00% -40.00% -60.00% -80.00% ABCERI S&P GSCI ER BCOMM ER
Trading Commodities. An introduction to understanding commodities
 Trading Commodities An introduction to understanding commodities Brainteaser Problem: A casino offers a card game using a deck of 52 cards. The rule is that you turn over two cards each time. For each
Daily Commentary. Corn (888) Monday, July 22, Today s Trade Action. Today s Closing Prices. Recommendations.
 Monday, July 22, Today s Trade Action. Today s Closing Prices. Recommendations.") Corn The market finished lower but off it earlier lows as soybeans supplied support for the corn market today. The USDA cut the good to excellent rating by 3 points in crop condition report released after
Corn The market finished lower but off it earlier lows as soybeans supplied support for the corn market today. The USDA cut the good to excellent rating by 3 points in crop condition report released after
26th International Copper Conference Madrid. Christoph Eibl Chief Executive March 2013
 26th International Copper Conference Madrid Christoph Eibl Chief Executive March 2013 Preferences Copper form a Fund Manager s point of view As a strategic investor (i.e. long only) fundamentals rule Deficit
December 2018 Monthly Commodity Market Overview Newsletter. Stock Index Futures
 December 2018 Monthly Commodity Market Overview Newsletter By the ADMIS Research Team of Steve Freed, Alan Bush, Michael Niemiec & Chris Lehner Stock Index Futures Stock index futures have come under pressure
November 2017 Monthly Commodity Market Overview Newsletter
 November 2017 Monthly Commodity Market Overview Newsletter By the ADMIS Research Team Stock Index Futures S&P 500, Dow Jones, NASDAQ and Russell 2000 futures registered new historical highs in November.
June 2018 Monthly Commodity Market Overview Newsletter. Stock Index Futures. By the ADMIS Research Team
 June 2018 Monthly Commodity Market Overview Newsletter By the ADMIS Research Team Stock Index Futures Stock index futures performed well in spite of increased global trade tensions. In fact NASDAQ and
Brian Grossman (312) ZANER Ag. Burn It All Down Monday Markets
 ZANER Ag. Burn It All Down Monday Markets") Brian Grossman (312) 277-0119 @AgHedgeBrian bgrossman@zaner.com Ag Burn It All Down Monday Markets USDA report day, Friday did little to entice much of any market direction and ultimately left much market
Brian Grossman (312) 277-0119 @AgHedgeBrian bgrossman@zaner.com Ag Burn It All Down Monday Markets USDA report day, Friday did little to entice much of any market direction and ultimately left much market
Soybeans face make or break moment Futures need a two-fer to avoid losses By Bryce Knorr, senior grain market analyst
 Soybeans face make or break moment Futures need a two-fer to avoid losses By Bryce Knorr, senior grain market analyst A year ago USDA shocked the market by cutting its forecast of soybean production, helping
Commodity Price Outlook & Risks
 Commodity Outlook & Risks Research Department, Commodities Team 1 September 18, 20 www.imf.org/commodities commodities@imf.org This monthly report presents a price outlook and risk assessment for selected
New Paradigms in Marketing: Are Speculators or the Fundamentals Driving Prices? Scott H. Irwin
 New Paradigms in Marketing: Are Speculators or the Fundamentals Driving Prices? Scott H. Irwin Outline of Presentation Role of speculation in the recent commodity price boom Changing fundamentals Convergence
September futures traded to a new low for the move of 3.46 ¾ probing under the June 19 th low. Resistance is at the winter lows of 3.70, the 50% retra
 Technical Overview Corn prices have continued to drop and are testing the lows on the nearby contracts from last winter near 3.35, completely retracing the winter/spring rally. The next support is the
Recent Convergence Performance of CBOT Corn, Soybean, and Wheat Futures Contracts
 The magazine of food, farm, and resource issues A publication of the American Agricultural Economics Association Recent Convergence Performance of CBOT Corn, Soybean, and Wheat Futures Contracts Scott
Opal Financial Group FX & Commodity Summit for Institutional Investors Chicago. Term Structure Properties of Commodity Investments
 Opal Financial Group FX & Commodity Summit for Institutional Investors Chicago Term Structure Properties of Commodity Investments March 20, 2007 Ms. Hilary Till Co-editor, Intelligent Commodity Investing,
Commodity products. Grain and Oilseed Hedger's Guide
 Commodity products Grain and Oilseed Hedger's Guide In a world of increasing volatility, customers around the globe rely on CME Group as their premier source for price discovery and managing risk. Formed
THE HIGHTOWER REPORT
 Futures Analysis & Forecasting HightowerReport.com March 21, 214 Strategies for March 31st Report: Non-standard Options New, non-standard options at the CME can be great tools for commodity traders, especially
Commodity Price Outlook & Risks
 Commodity Outlook & Risks Research Department, Commodities Team 1 December 17, 20 www.imf.org/commodities commodities@imf.org This monthly report presents a price outlook and risk assessment for selected
Oxford Energy Comment March 2009
 Oxford Energy Comment March 2009 Reinforcing Feedbacks, Time Spreads and Oil Prices By Bassam Fattouh 1 1. Introduction One of the very interesting features in the recent behaviour of crude oil prices
Merricks Capital Wheat Basis and Carry Trade
 Merricks Capital Wheat Basis and Carry Trade Executive Summary Regulatory changes post the Global Financial Crisis (GFC) has reduced the level of financing available to a wide range of markets. Merricks
JUDGING PRICE RISKS IN MARKETING HOGS 1
 JUDGING PRICE RISKS IN MARKETING HOGS 1 R. M. GREEN AND E. A. STOKDYK THE PROBLEM OF JUDGING THE HOG MARKET The hog producer must judge market risks in planning both his production and marketing program.
factors that affect marketing
 Grain Marketing / no. 26 factors that affect marketing Crop Insurance Coverage Producers who buy at least 80 percent Revenue Protection for corn are more likely to indicate that crop insurance is an important
NASDAQ Commodity Index Family
 Index Overview NASDAQ Commodity Index Family The NASDAQ Commodity Index Family provides a broad way to track U.S. dollar denominated commodities traded on U.S. and U.K. exchanges. NASDAQ s transparent
Cross Hedging Agricultural Commodities
 Cross Hedging Agricultural Commodities Kansas State University Agricultural Experiment Station and Cooperative Extension Service Manhattan, Kansas 1 Cross Hedging Agricultural Commodities Jennifer Graff
Module 12. Alternative Yield and Price Risk Management Tools for Wheat
 Topics Module 12 Alternative Yield and Price Risk Management Tools for Wheat George Flaskerud, North Dakota State University Bruce A. Babcock, Iowa State University Art Barnaby, Kansas State University
First Trust Global Tactical Commodity Strategy Fund (FTGC) Consolidated Portfolio of Investments March 31, 2018 (Unaudited) Stated.
 Consolidated Portfolio of Investments March 31, 2018 (Unaudited) Stated.") Consolidated Portfolio of Investments Principal Description Stated Coupon Stated Maturity TREASURY BILLS 80.1% $ 48,000,000 U.S. Treasury Bill (a)... (b) 04/12/18 $ 47,978,254 10,000,000 U.S. Treasury
Consolidated Portfolio of Investments Principal Description Stated Coupon Stated Maturity TREASURY BILLS 80.1% $ 48,000,000 U.S. Treasury Bill (a)... (b) 04/12/18 $ 47,978,254 10,000,000 U.S. Treasury
26th International Aluminium Conference Moscow. Christoph Eibl Chief Executive September 2012
 26th International Aluminium Conference Moscow Christoph Eibl Chief Executive September 2012 Preferences Aluminium form a Fund Manager s point of view As a strategic investor (i.e. long only) fundamentals
Jake Bernstein Advanced Trader Sessions (ATS)
") Jake Bernstein Advanced Trader Sessions (ATS) http://www.jakebernstein.com 800-678-5253 831-430-0600 ATS 1 Session 4 16 February 2012 January Effect Weekly Trigger: Status Big Moves and COT: A Much Closer
Jake Bernstein Advanced Trader Sessions (ATS) http://www.jakebernstein.com 800-678-5253 831-430-0600 ATS 1 Session 4 16 February 2012 January Effect Weekly Trigger: Status Big Moves and COT: A Much Closer
Grain Marketing. Innovative. Responsive. Trusted.
 Grain Marketing Extension is a Division of the Institute of Agriculture and Natural Resources at the University of Nebraska Lincoln cooperating with the Counties and the United States Department of Agriculture.
Hedging in 2014 "" Wisconsin Crop Management Conference & Agri-Industry Showcase 01/16/2014" Fred Seamon Senior Director CME Group"
 Hedging in 2014 Wisconsin Crop Management Conference & Agri-Industry Showcase 01/16/2014 Fred Seamon Senior Director CME Group Disclaimer Futures trading is not suitable for all investors, and involves
PRESENTS FUTURES TRADING BASICS
 PRESENTS FUTURES TRADING BASICS PRESENTED BY SCOTT COLE TACTICALTRADINGRESEARCH.COM Mission Statement Provide intelligent trading solutions to individual investors and financial professionals who actively
Overcoming Greed and Fear in Commodity Markets. Larry Martin, Ph. D. Agrifood Management Excellence ,
 Overcoming Greed and Fear in Commodity Markets Larry Martin, Ph. D. Agrifood Management Excellence 519 841 1698, dlm@xplornet.com Introduction Presentation based on our company s recent column in Country
Web Resources. Acknowledgements
 GUY BOWER Web Resources Daniels Trading offer comprehensive, reliable and customer-focused commodity futures brokerage services to address all trading preferences. Their website is also a great place for
Day 2 (Notice Day) Prior to open of trade, the clearinghouse matches the seller with the oldest long position and notifies both parties.
 Prior to open of trade, the clearinghouse matches the seller with the oldest long position and notifies both parties.") Delivery Process and Convergence of Cash and Futures Prices 1-to-3% of all agricultural futures contracts are delivered upon. ex) Delivery process on CBT cleared contracts (i.e., grains) Day 1 (Position
Delivery Process and Convergence of Cash and Futures Prices 1-to-3% of all agricultural futures contracts are delivered upon. ex) Delivery process on CBT cleared contracts (i.e., grains) Day 1 (Position
October 2017 Monthly Commodity Market Overview Newsletter. Stock Index Futures
 October 2017 Monthly Commodity Market Overview Newsletter By the ADMIS Research Team Stock Index Futures S&P 500, Dow Jones, NASDAQ and Russell 2000 futures registered new historical highs in October.
December 6, To Our Clients and Friends:
 FINAL CFTC RULE ON POSITION LIMITS December 6, 2011 To Our Clients and Friends: On October 18, the U.S. Commodity Futures Trading Commission (the CFTC ) adopted new Part 151 (the Final Rule ) of its regulations
USCF Dynamic Commodity Insight Monthly Insight September 2018
 Key Takeaways The US Commodity Index Fund (USCI) and the USCF SummerHaven Dynamic Commodity Strategy No K-1 Fund (SDCI) gained 1.94% and 1.84%, respectively, last month as September was the best month
Thanks also to Daniels Trading who provided some of the data and technical assistance.
 GUY BOWER Contents 1. Introduction 3 2. Mini Glossary 4 3. Strategy #1: The Bull Spread 6 4. Strategy #2: The Bear Spread 8 5. Strategy #3: The Inter Commodity Spread 10 6. Summation 12 7. About the Author
Presented By: Jack Hughes, CMT. 54 Canal Street Boston, MA Office #
 Presented By: Jack Hughes, CMT 54 Canal Street Boston, MA 02114 Office # 617.901.7951 jh@beanpotfs.com www.beanpotfs.com Those who develop the vision to create and use new methods that can monitor the
Crops Marketing and Management Update
 Crops Marketing and Management Update Grains and Forage Center of Excellence Dr. Todd D. Davis Assistant Extension Professor Department of Agricultural Economics Vol. 2017 (2) February 16, 2017 Topics
Provide a brief review of futures. Carefully review alternative market
 Provide a brief review of futures markets. Carefully review alternative market conditions i and which h marketing strategies work best under alternative conditions. Have an open and interactive discussion!!
Strike prices are listed at predetermined price levels for each commodity: every 25 cents for soybeans, and 10 cents for corn.
 Types of Options If you buy an option to buy futures, you own a call option. If you buy an option to sell futures, you own a put option. Call and put options are separate and distinct options. Calls and
UK Grain Marketing Series January 19, Todd D. Davis Assistant Extension Professor. Economics
 Introduction to Basis, Cash Forward Contracts, HTA Contracts and Basis Contracts UK Grain Marketing Series January 19, 2016 Todd D. Davis Assistant Extension Professor Outline What is basis and how can
FEDERAL RESERVE BANK OF MINNEAPOLIS BANKING AND POLICY STUDIES
 FEDERAL RESERVE BANK OF MINNEAPOLIS BANKING AND POLICY STUDIES Minneapolis Options Report Feb 1 th Median inflation expectations decreased over the two week period for both inflation tenors. The probability
TRADING THE CATTLE AND HOG CRUSH SPREADS
 TRADING THE CATTLE AND HOG CRUSH SPREADS Chicago Mercantile Exchange Inc. (CME) and the Chicago Board of Trade (CBOT) have signed a definitive agreement for CME to provide clearing and related services
DBIQ Diversified Agriculture Index
 05 November 2012 DBIQ Index Guide DBIQ Diversified Agriculture Index Summary DBIQ Diversified Agriculture Index is based on 11 commodities drawn from the agriculture sectors Of the 11 commodities comprising
Intro to Trading Volatility
 Intro to Trading Volatility Before reading, please see our Terms of Use, Privacy Policy, and Disclaimer. Overview Volatility has many characteristics that make it a unique asset class, and that have recently
6,479,864 (Cost $6,480,320) (c) Net Other Assets and Liabilities 26.1%... 2,286,259 Net Assets 100.0%... $ 8,766,123
 (c) Net Other Assets and Liabilities 26.1%... 2,286,259 Net Assets 100.0%... $ 8,766,123") Consolidated Portfolio of Investments Principal TREASURY BILLS 73.9% Description Stated Coupon Stated Maturity $ 1,000,000 U.S. Treasury Bill (a) (b) 4/12/18 $ 999,547 1,500,000 U.S. Treasury Bill (a)
Consolidated Portfolio of Investments Principal TREASURY BILLS 73.9% Description Stated Coupon Stated Maturity $ 1,000,000 U.S. Treasury Bill (a) (b) 4/12/18 $ 999,547 1,500,000 U.S. Treasury Bill (a)
Commodity Chart Book
 Commodity Chart Book Cents / Bushel 920-0 Corn CORN - CBOT MONTHLY SELECTED FUTURES Chart Chart High: 843.75 on 08/10/2012 Chart Low 142.00 on 02/17/1987 Chart Low: 142.00 on 02/17/1987 Cents / Bushel
Examples of Derivative Securities: Futures Contracts
 Finance Derivative Securities Lecture 1 Introduction to Derivatives Examples of Derivative Securities: Futures Contracts Agreement made today to: Buy 5000 bushels of wheat @ US$4.50/bushel on December
PERFORMANCE STUDY 2013
 US EQUITY FUNDS PERFORMANCE STUDY 2013 US EQUITY FUNDS PERFORMANCE STUDY 2013 Introduction This article examines the performance characteristics of over 600 US equity funds during 2013. It is based on
AGRICULTURAL PRODUCTS. Self-Study Guide to Hedging with Livestock Futures and Options
 AGRICULTURAL PRODUCTS Self-Study Guide to Hedging with Livestock Futures and Options TABLE OF CONTENTS INTRODUCTION TO THE GUIDE 4 CHAPTER 1: OVERVIEW OF THE LIVESTOCK FUTURES MARKET 5 CHAPTER 2: FINANCIAL
When Basis and Spreads Speak, We Listen Tregg Cronin
 When Basis and Spreads Speak, We Listen Tregg Cronin Cronin Farms, Inc. Halo Commodities Background Fourth Generation, Century Farm in Gettysburg, SD 8,500 acres of corn, soybeans, spring and winter wheat,
The Role of Market Prices by
 The Role of Market Prices by Rollo L. Ehrich University of Wyoming The primary function of both cash and futures prices is the coordination of economic activity. Prices are the signals that guide business
VOLATILITY TRADING IN AGRICULTURAL OPTIONS
 R.J. O'BRIEN ESTABLISHED IN 1914 VOLATILITY TRADING IN AGRICULTURAL OPTIONS This article is a part of a series published by R.J. O Brien on risk management topics for commercial agri-business clients.
Econ 338c. April 12, 2007
 60 Econ 338c April 12, 2007 10 Traits of a Successful Grain Marketer Starts Early (before planting) Knows production, storage costs & risk bearing ability Understands basis & mkt. carry Follows several
THE ALTERNATIVE BENCHMARK COMMODITY INDEX: A FACTOR-BASED APPROACH TO COMMODITY INVESTMENT
 THE ALTERNATIVE BENCHMARK COMMODITY INDEX: A FACTOR-BASED APPROACH TO COMMODITY INVESTMENT AIA RESEARCH REPORT Revised Oct 2015 Contact: Richard Spurgin ALTERNATIVE INVESTMENT ANALYTICS LLC 400 AMITY STREET,
BUYERS, BUBBLES, AND BUTTERFLIES Senior Analyst Darin Newsom. DTN/The Progressive Farmer 2010 Ag Summit December 10, 2010
 BUYERS, BUBBLES, AND BUTTERFLIES Senior Analyst Darin Newsom DTN/The Progressive Farmer 2010 Ag Summit December 10, 2010 Buyers -! "In other words, demand driven markets! "Demand driven markets: Increased
BROAD COMMODITY INDEX
 BROAD COMMODITY INDEX COMMENTARY + STRATEGY FACTS JULY 2018 100.00% 80.00% 60.00% 40.00% 20.00% 0.00% -20.00% -40.00% -60.00% CUMULATIVE PERFORMANCE ( SINCE JANUARY 2007* ) -80.00% ABCERI S&P GSCI ER BCOMM
Crops Marketing and Management Update
 Crops Marketing and Management Update Grains and Forage Center of Excellence Dr. Todd D. Davis Assistant Extension Professor Department of Agricultural Economics Vol. 2018 (2) February 14, 2018 Topics
BESTER DERIVATIVE TRADING TECHNICAL BRIEF
 9 November 2018 US DOLLAR INDEX BESTER DERIVATIVE TRADING TECHNICAL BRIEF The US Dollar Index is developing the third upward leg inside an upward sloping channel which started in September. Resistance
AGBE 321. Problem Set 5 Solutions
 AGBE 321 Problem Set 5 Solutions 1. In your own words (i.e., in a manner that you would explain it to someone who has not taken this course) explain the concept of offsetting futures contracts. When/why
Managing Hog Price Risk: Futures, Options, and Packer Contracts
 Managing Hog Price Risk: Futures, Options, and Packer Contracts John D. Lawrence, Extension Livestock Economist and Director, Iowa Beef Center, and Alan Vontalge, Extension Economist, Iowa State University
Considerations When Using Grain Contracts
 Considerations When Using Grain Contracts Overview The grain industry has developed several new tools to help farmers manage increasing risks and price volatility. Elevators can use grain options markets
HEDGING WITH FUTURES AND BASIS
 Futures & Options 1 Introduction The more producer know about the markets, the better equipped producer will be, based on current market conditions and your specific objectives, to decide whether to use
What Is Driving The Metal Markets?
 What Is Driving The Metal Markets? In all likelihood, Mark Twain did not have metal markets in mind when he said, history does not repeat itself, but it does rhyme Nevertheless, it seems as though we are
JULY 2017 Monthly Commodity Market Overview Newsletter. Stock Indexes. By the ADMIS Research Team
 JULY 2017 Monthly Commodity Market Overview Newsletter By the ADMIS Research Team Stock Indexes S&P 500, Dow Jones and NASDAQ futures advanced to new historical highs in spite of several bearish economic
/ CRB Index May 2005
 May 2005 / CRB Index Overview: Past, Present and Future Founded in 1957, the Reuters CRB Index has a long history as the most widely followed Index of commodities futures. Since 1961, there have been 9
1. On Jan. 28, 2011, the February 2011 live cattle futures price was $ per hundredweight.
 Econ 339X Spring 2011 Homework Due 2/8/2011 65 points possible Short answer (two points each): 1. On Jan. 28, 2011, the February 2011 live cattle futures price was $107.50 per hundredweight. If the cash
Accounting for Hedging Transactions
 CLAconnect.com Accounting for Hedging Transactions Paul Neiffer, CPA Paul Neiffer Bio Paul is an Agribusiness CPA and Principal with CliftonLarsonAllen LLP located in the Kennewick and Yakima, Washington
Commodity Risk Through the Eyes of an Ag Lender
 Commodity Risk Through the Eyes of an Ag Lender Wisconsin Banker s Association April 5 th, 2017 Michael Irgang, Executive Vice President 1 Michael Irgang: Bio Michael Irgang is currently Executive Vice
A Beginners Guide To Making Money Trading Binary Options
 A Beginners Guide To Making Money Trading Binary Options What Are Binary Options? A binary option has now become a fairly common term amongst traders. A Binary Option deals with a kind of purchased asset
Futures markets allow the possibility of forward pricing. Forward pricing or hedging allows decision makers pricing flexibility.
 II) Forward Pricing and Risk Transfer Cash market participants are price takers. Futures markets allow the possibility of forward pricing. Forward pricing or hedging allows decision makers pricing flexibility.
Introduction to Futures & Options Markets
 Introduction to Futures & Options Markets Kevin McNew Montana State University Marketing Your Crop Marketing: knowing when and how to price your crop. When Planting Pre-Harvest Harvest Post-Harvest How