Chapter 4.2. Technical Analysis: Fibonacci
|
|
|
- Marylou Hancock
- 5 years ago
- Views:
Transcription


1 1 Chapter 4.2 Technical Analysis: Fibonacci 0
2 Contents TECHNICAL ANALYSIS: FIBONACCI Fibonacci analysis is the study of identifying potential support and resistance levels in the future based on past price trends and reversals. Fibonacci analysis is based on the mathematical discoveries of Leonardo Pisano also known as Fibonacci. He is credited with discovering a sequence of numbers that now bears his name: the Fibonacci sequence. The Fibonacci sequence is a series of numbers that progresses as follows, 0, 1, 1, 2, 3, 5, 8, 13, 21, 34, 55. To arrive at each subsequent number in the sequence, you simply find the sum of the two preceding numbers in the sequence. For example, to find the number that follows 55 in the sequence, you find the sum of (the two preceding numbers in the sequence). The sum of is 89. This is therefore the next number in the sequence. What intrigued Fibonacci about this sequence was not the numbers themselves but rather the relationships among the numbers, or the ratios created by various numbers in the sequence. Perhaps the most important ratio is also known as the golden ratio, or golden mean. This number can be found throughout nature (in sea shells, growth rings, etc.) and throughout the Fibonacci sequence. Each number in the Fibonacci sequence is times larger than the preceding number. For example, 89 is times larger than 55 (89 55 = 1.618). The golden ratio and the other ratios that exist within the Fibonacci sequence represent the natural ebb and flow of life. They also apply to the natural ebb and flow of stocks and CFDs. In this section, you will learn how Fibonacci ratios can be applied to stocks and CFDs using the following analysis tools: Fibonacci retracements Fibonacci projections Fibonacci fans 1
3 FIBONACCI RETRACEMENTS When a stock price reverses trend, stock and CFD traders naturally want to know how far the stock price is most likely to move in its new direction. Fibonacci retracement levels can help. Certain Fibonacci ratios are useful when you are trying to determine how far a stock price is going to retrace, or move against, a previous trend. The ratios you will be using in your stock and CFD trading will help you find the following retracement levels: 61.8 percent This level is found by dividing a number in the Fibonacci sequence by the number immediately following it in the sequence (55 89 = 61.8%) percent This level is found by dividing a number in the Fibonacci sequence by the second number following it in the sequence (34 89 = 38.2%) percent This level is found by dividing a number in the Fibonacci sequence by the third number following it in the sequence (21 89 = 23.6%). You will also use three other levels in your retracement analysis. Whilst the following levels are not calculated using numbers within the Fibonacci sequence, they are based on the Fibonacci levels above: 50 percent This level is determined by finding the middle between 61.8 percent and 38.2 percent ((61.8% %) 2 = 50%) percent This level is determined by finding the distance from 38.2 percent and 23.6 percent (38.2% % = 14.6%) and adding it to 61.8 percent (61.8% % = 76.4%). 100 percent This level is determined simply by finding where the previous trend began. Determining all six Fibonacci retracement levels provides you with potential support and resistance levels you can use in your stock and CFD trading. You can see these Fibonacci levels on the daily Boeing (BA:xnys) chart below. Each of the illustrated levels was calculated based on the trend highlighted by the red arrow. You could have used each level to help you determine when to enter and exit your investments as the stock price began to turn around and move higher. 2

4 3
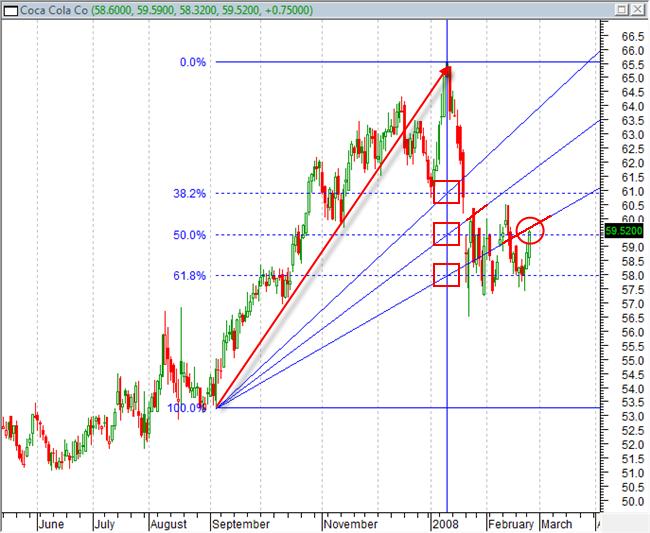
5 Notice how the stock price moved back and forth, bouncing off both the 23.6 percent retracement level and the 38.2 percent retracement level. FIBONACCI PROJECTIONS Trends never go straight up or straight down. Trends move in one direction initially, then they pull back and move in the opposite direction for a while, and then they turn around and resume moving in the previous direction. This is the natural ebb and flow of a trend. When a stock price resumes its previous trend, stock and CFD traders naturally want to know how far the stock price is most likely to continue moving. Fibonacci projection levels can help. Certain Fibonacci ratios are useful when you are trying to determine how far the stock price is going to move once it resumes its previous trend. The ratios you will be using in your stock and CFD trading will help you find the following projection levels: percent This level is found by dividing a number in the Fibonacci sequence by the number immediately preceding it in the sequence (89 55 = 161.8%) percent This level is found by dividing a number in the Fibonacci sequence by the second number preceding it in the sequence (89 34 = 261.8%) percent This level is found by dividing a number in the Fibonacci sequence by the third number preceding it in the sequence (89 21 = 423.8%). Determining all three Fibonacci projection levels provides you with potential support and resistance levels that you can use in your stock and CFD trading. You can see these Fibonacci levels on the daily Coca Cola (KO:xnys) chart below. Each of the illustrated levels reflects the trend highlighted by the red arrow. If Coca Cola resumes its upward trend, you can use each level to help you determine where to set your profit targets (potential exit levels) if you buy the stock or CFD. 4
6 5
7 Notice that the stock price, based on the previous trend, has the potential to move up to the percent projection level in the near future. If it reaches this level, you could set the percent projection level as your next profit target level. FIBONACCI FANS Fibonacci levels provide diagonal levels of support and resistance as well as horizontal levels of support and resistance. The diagonal levels of support and resistance are called Fibonacci fans. Fibonacci fans are based on three Fibonacci retracement levels percent, 50 percent and 38.2 percent. To construct a Fibonacci fan you have to do the following: Now that you have your Fibonacci fans drawn you can use them to project potential support and resistance levels that you can use in your stock and CFD trading. You can see a Fibonacci fan on the daily Coca Cola (KO:xnys) chart below. Each of the illustrated levels was calculated based on the trend highlighted by the red arrow. You could have used the rays from the fan to help you determine when to enter and exit your trades as the stock price began to turn around and move higher. Notice how the stock price bounced off the middle ray of the Fibonacci fan in early January and is currently at the resistance level formed by the bottom ray of the fan. 1. Identify a trend 2. Identify the three horizontal Fibonacci levels (61.8 percent, 50 percent and 38.2 percent) as they relate to that trend 3. Draw a vertical line that crosses through these levels at the point where the trend ended 4. Draw three lines, each one beginning where the trend began and crossing through a separate point where the vertical line intersects one of the Fibonacci levels 6

8 7

9 8
10 Disclaimer None of the information contained herein constitutes an offer to purchase or sell a financial instrument or to make any investments. Saxo Bank A/S and/or its affiliates and subsidiaries (hereinafter referred to as the Saxo Bank Group ) do not take into account your personal investment objectives or financial situation and make no representation, and assume no liability to the accuracy or completeness of the information provided, nor for any loss arising from any investment based on a recommendation, forecast or other information supplied from any employee of Saxo Bank, third party, or otherwise. Trades in accordance with the recommendations in an analysis, especially, but not limited to, leveraged investments such as foreign exchange trading and investment in derivatives, can be very speculative and may result in losses as well as profits. You should carefully consider your financial situation and consult your financial advisor(s) in order to understand the risks involved and ensure the suitability of your situation prior to making any investment or entering into any transactions. All expressions of opinion are subject to change without notice. Any opinions made may be personal to the author and may not reflect the opinions of Saxo Bank. Danish banks are required to categorize investment products offered to retail clients depending on the product s complexity and risk as: green, yellow or red. The categorization is made according to a graduation made by the Danish Financial Supervisory Authority which reflects the risk of losing the deposit. A CFD is categorized as a red product as it is considered an investment product with a high complexity and a high risk. See also our Product Risk Categorisation located under our General Business Terms on Stocks are categorized as yellow or red products depending on the individual instrument. For more information about the categorization of the individual instrument and the level of risk involved, please see the Product Risk Categorisation located under our General Business Terms on 9
Chapter 4.2. Technical Analysis: Fibonacci
 1 Chapter 4.2 Technical Analysis: Fibonacci 0 Contents TECHNICAL ANALYSIS: FIBONACCI Fibonacci analysis is the study of identifying potential support and resistance levels in the future based on past price
Chapter 4.2. Technical Analysis: Fibonacci
 1 Chapter 4.2 Technical Analysis: Fibonacci 0 Contents TECHNICAL ANALYSIS: FIBONACCI Fibonacci analysis is the study of identifying potential support and resistance levels in the future based on past price
Chapter 1.4 Trends 0
 Chapter 1.4 Trends 0 TECHNICAL ANALYSIS: TRENDS, SUPPORT AND RESISTANCE Charts, charts, charts. When most people think about trading Forex, they think about watching price movements flash by them on the
TRADING CFDs ON SAXOTRADER PLATFORM
 Saxo Bank A/S Headquarters Philip Heymans Allé 15 DK - 2900 Hellerup, Denmark Phone: +45 3977 4000 Fax: +45 3977 4200 Web: www.saxobank.com TRADING CFDs ON SAXOTRADER PLATFORM How to trade in CFDs of STOCKS,
Chapter 1.3. Technical Analysis: Trends, Support and Resistance
 1 Chapter 1.3 Technical Analysis: Trends, Support and Resistance 0 Contents TECHNICAL ANALYSIS: TRENDS, SUPPORT AND RESISTANCE Stocks are rising. Stocks are falling. If you watch or read financial news
Chapter 4.1. Market Rotations
 1 Chapter 4.1 Market Rotations 0 Contents MARKET ROTATIONS Stock markets ebb and flow as investors move their money in and out of the markets themselves as well as in and out of various sectors within
Chapter 2.3. Technical Analysis: Technical Indicators
 Chapter 2.3 Technical Analysis: Technical Indicators 0 TECHNICAL ANALYSIS: TECHNICAL INDICATORS Charts always have a story to tell. However, from time to time those charts may be speaking a language you
TRADE SIGNALS POWERED BY AUTOCHARTIST
 SAXO TRADER GO TRADE SIGNALS POWERED BY AUTOCHARTIST Trade Signals is a SaxoTraderGO tool that uses Autochartist technology to identify emerging and completed patterns in most leading financial markets.
INTERMEDIATE EDUCATION GUIDE
 INTERMEDIATE EDUCATION GUIDE CONTENTS Key Chart Patterns That Every Trader Needs To Know Continution Patterns Reversal Patterns Statistical Indicators Support And Resistance Fibonacci Retracement Moving
TRADE SIGNALS POWERED BY AUTOCHARTIST
 SAXO TRADER GO TRADE SIGNALS POWERED BY AUTOCHARTIST Trade Signals is a SaxoTraderGO tool that uses Autochartist technology to identify emerging and completed patterns in most leading financial markets.
TRADE SIGNALS POWERED BY AUTOCHARTIST
 SAXO TRADER GO TRADE SIGNALS POWERED BY AUTOCHARTIST Trade Signals is a SaxoTraderGO tool that uses Autochartist technology to identify emerging and completed patterns in most leading financial markets.
TRADE SIGNALS POWERED BY AUTOCHARTIST
 SAXO TRADER GO TRADE SIGNALS POWERED BY AUTOCHARTIST Trade Signals is a SaxoTraderGO tool that uses Autochartist technology to identify emerging and completed patterns in most leading financial markets.
Chapter 2.3. Technical Indicators
 1 Chapter 2.3 Technical Indicators 0 TECHNICAL ANALYSIS: TECHNICAL INDICATORS Charts always have a story to tell. However, sometimes those charts may be speaking a language you do not understand and you
Trading the Hidden Divergence. Presented by Sunil Mangwani
 Trading the Hidden Divergence Indicators in technical analysis. Indicators along with chart patterns, trend lines, resistance / support levels etc., are an essential part of technical analysis. But there
THE TRUTH ABOUT FIBONACCI TRADING
 PRESENTS THE TRUTH ABOUT FIBONACCI TRADING ALL TRADING INFORMATION REVEALED 1 INTRODUCTION The truth about Fibonacci levels is that they are useful (like all trading indicators). They do not work as a
TRADE SIGNALS POWERED BY AUTOCHARTIST
 TRADE SIGNALS POWERED BY AUTOCHARTIST Trade Signals is a powerful tool available in BiGlobal Trade for identifying trading opportunities based on chart patterns using Autochartist technology. As an introduction
Chapter 3.3. Price Patterns
 1 Chapter 3.3 Price Patterns 0 TECHNICAL ANALYSIS: PRICE PATTERNS Traders vote with their chequebooks. If they believe a stock or CFD is going to move higher then they will buy the stock or CFD. If they
FOREX. analysing made easy. UNDERSTANDING TECHNICAL ANALYSIS An educational tool by Blackwell Global
 FOREX analysing made easy UNDERSTANDING TECHNICAL ANALYSIS An educational tool by Blackwell Global Risk Warning: Forex and CFDs are leveraged products and you may lose your initial deposit as well as substantial
Copyright by Profits Run, Inc.
 The Truth About Fibonacci Trading 2 Disclaimer: Forex, stock, futures, and options trading is not appropriate for everyone. There is a substantial risk of loss associated with trading these markets. Losses
Fibonacci s: Hidden Support & Resistance DENNIS W. WILBORN, SR.
 Fibonacci s: Hidden Support & Resistance WWW.ACTIVETRENDTRADING.COM DENNIS W. WILBORN, SR. DWW@ACTIVETRENDTRADING.COM Disclaimer U.S. GOVERNMENT REQUIRED DISCLAIMER COMMODITY FUTURES TRADING COMMISSION
very High Probability High Risk/Reward Ratio Risk Management Capital Efficiency
 First, I look for Stocks and ETF s (Exchange Trades Funds) to TRADE, this is different than a long term Buy and Hold investment strategy. The typical time that I hold each Stock or ETF is one month to
FOREX INDICATORS. THEIR PRIORITY and USE
 FOREX INDICATORS THEIR PRIORITY and USE by G. C. Smith U.S. Government Required Disclaimer Trading foreign exchange markets on margin carries a high level of risk, and may not be suitable for all investors.
Neal Hughes "FibMaster"
 This Lesson Can Be Printed See Instructions Below Neal Hughes "FibMaster" We are indeed fortunate in this lesson to have Neal Hughes give some of his time and explain some of the basics of Fibonacci trading.
Naked Trading and Price Action
 presented by Thomas Wood MicroQuant SM Divergence Trading Workshop Day One Naked Trading and Price Action Risk Disclaimer Trading or investing carries a high level of risk, and is not suitable for all
Forex Price Direction Analysis.
 Forex Price Direction Analysis. September 24 2010 1 Sign Up Now to Upshots forex trade signals disclaimer The information provided in this report is for educational purposes only. It is not a recommendation
This is the complete: Fibonacci Golden Zone Strategy Guide
 This is the complete: Fibonacci Golden Zone Strategy Guide In this strategy report, we are going to share with you a simple Fibonacci Trading Strategy that uses the golden ratio which is a special mathematical
Real Life Fibonacci Trading & Dynamic Targeting with MQ Trend
 presented by Thomas Wood MicroQuant SM Divergence Trading Workshop Day One Real Life Fibonacci Trading & Dynamic Targeting with MQ Trend Risk Disclaimer Trading or investing carries a high level of risk,
The Truth About Fibonacci. Trading
 The Truth About Fibonacci Trading 2 The Truth About Fibonacci Trading The truth about Fibonacci levels is that they are useful (like all trading indicators). They do not work as a standalone system of
Chapter 3.1. Hedging with CFDs
 1 Chapter 3.1 Hedging with CFDs 0 Contents HEDGING WITH CFDS Successful share and CFD traders realize that protecting the money they have is just as important, if not more so, than earning more money from
Weekly Report - For the week of May 1, 2017 Page 1
 Page 1 Market Overview The University of Michigan Consumer Sentiment final figures for April indicated an overall decrease to 97.0. And, not only was this lower than the preliminary reading, but it was
Table of Contents. Risk Disclosure. Things we will be going over. 2 Most Common Chart Layouts Anatomy of a candlestick.
 Table of Contents Risk Disclosure Things we will be going over 2 Most Common Chart Layouts Anatomy of a candlestick Candlestick chart Anatomy of a BAR PLOT Indicators Trend-Lines Volume MACD RSI The Stochastic
Weekly Report - For the week of January 9, 2017 Page 1
 Page 1 Market Overview December nonfarm payrolls figures were released on Friday. And, the 156,000 figure was below some analyst's expectations. However, the November figure was revised upward to 204,000
 This material is protected under the Digital Millennium Copyright Act of 1998 and various international treaties. This material may not be replicated and redistributed. You may make one or more copies
Part 1. ForEx Easy Mode
 Part 1 DISCLAIMER Any income claims are typical of top performers not all users and your results will vary. Past performance of any system is not indicative of future results. Trading foreign exchange
Methodology. Our team of analysts uses technical and chartist analysis to draw an opinion and make decisions. The preferred chartist elements are:
 Methodology Technical analysis is at the heart of TRADING CENTRAL's expertise. Our methodology is proven. Our chartist and quantitative approach allows us to intervene on different investment horizons.
INTRODUCTION 2 INSTALLATION AND CHART SETUP 3 BUY AND SELL ZONES 4 BBOX TICKSPEED INDICATOR 6 TRADING RULES AND CONDITIONS 7
 BLACK-BφX.COM INTRODUCTION 2 INSTALLATION AND CHART SETUP 3 BUY AND SELL ZONES 4 BBOX TICKSPEED INDICATOR 6 TRADING RULES AND CONDITIONS 7 BUY CONDITIONS 7 SELL CONDITIONS 9 IMPORTANT NOTES: 11 TAKE PROFIT
CMS PRIME DAILY MARKET REPORT
 CMS PRIME DAILY MARKET REPORT August 17, 2018 EURUSD long position at 1.1380 with SL : 1.1350 and with targets at 1.1400 and 1.1430 short position at 1.1350 with SL : 1.1400 and with targets at 1.1330
Chapter 4.3. Speculating with CFDs
 1 Chapter 4.3 Speculating with CFDs 0 Contents SPECULATING WITH CFDS Traders often have moments when they feel the stars are aligned to favour a particular trade. And, though they may not be able to explain
Williams Percent Range
 Williams Percent Range (Williams %R or %R) By Marcille Grapa www.surefiretradingchallenge.com RISK DISCLOSURE STATEMENT / DISCLAIMER AGREEMENT Trading any financial market involves risk. This report and
Trends. Define the term Trend Explain why Trend is important Identify Primary, Secondary, and Short-Term trends
 Trends Define the term Trend Explain why Trend is important Identify Primary, Secondary, and Short-Term trends 1 What is a Trend? Uptrend Prices rise and fall in Trends Trend is defined as: Up (Rising)
Rule One Transformational Investing Webinar #13
 Rule One Transformational Investing Webinar #13 Webinar #13 Review The Process Finding a Wonderful Company WFM is a company that I use, a company that reflects my values, that will be bigger and better
 Types of charts Bar charts Candlestick charts Constant volume charts Line charts Tflow charts, exclusively CQG Bar Charts Vertical line representing the high and low of the sessions Horizontal line on
CMS Prime DAILY MARKET REPORT
 CMS Prime DAILY MARKET REPORT April 25, 2018 EURUSD 1.2210 (SL) with targets at 1.2245 and 1.2265 1.2210 with targets at 1.2180 and 1.2150 Resistance 1 : 1.2245 Resistance 2 : 1.2265 Resistance 3 : 1.2290
GOLD: Was that the low? September 18, 2018
 GOLD: Was that the low? September 18, 2018 In early 2018 the sentiment on gold was running high. After failing on multiple attempts to deliver new highs, that began to gradually change. The net commercial
Chapter 3.1. Capital and Trade Flow Drive Currency Values
 Chapter 3.1 Capital and Trade Flow Drive Currency Values 0 Contents CAPITAL AND TRADE FLOW DRIVE CURRENCY VALUES Supply and demand are the simple concepts behind all price movement in the forex market,
CMS Prime DAILY MARKET REPORT
 CMS Prime DAILY MARKET REPORT May 14, 2018 EURUSD BULLISH BIAS long position at 1.1960 with SL : 1.1925 and with targets at 1.1990 and 1.2020 short position at 1.1925 with SL : 1.1970 and with targets
TABLE OF CONTENTS C ORRELATION EXPLAINED INTRODUCTION...2 CORRELATION DEFINED...3 LENGTH OF DATA...5 CORRELATION IN MICROSOFT EXCEL...
 Margined Forex trading is a risky form of investment. As such, it is only suitable for individuals aware of and capable of handling the associated risks. Funds in an account traded at maximum leverage
Fibonacci Retracement Waiting for the Right Moment. The Fibonacci sequence is a series of numbers that were first derived by Leonardo of Pisa in the
 Author: Ng Ee Hwa, Market Strategist for ChartNexus Fibonacci Retracement Waiting for the Right Moment IT has been 3 years since the Singapore stock market begun its amazing bull run, scaling to new highs
What Came First... Fundamentals or the Technicals? By Jared Martinez
 What Came First... Fundamentals or the Technicals? By Jared Martinez I am honored to share my thoughts on our methodologies, focusing on the current technical movements and conditions of the FOREX Markets,
Technical Analysis. Dealing Room Peter Leonidou. Peter Leonidou
 Technical Analysis Dealing Room Questions Traders Should Ask What is the trend? What is the pivot point? What is the support levels? What is the resistance levels? Strong or weaker USD? What 1. Trade
CMS Prime DAILY MARKET REPORT
 CMS Prime DAILY MARKET REPORT May 09, 2018 EURUSD BEARISH BIAS short position at 1.1855 with SL : 1.1900 and with targets at 1.1835 and 1.1800 long position at 1.1900 with SL : 1.1835 and with targets
Market Observations as of Dec 8, 2017
 Market Observations as of Dec 8, 2017 By Carl Jorgensen - For Objective Traders - For educational purposes only. Not Financial Advice. The Market Rotation we saw last week, with an exit from Tech into
Technical Analysis Basics. Identifying Tops
 Technical Analysis Basics. Identifying Tops June 2011 1 Sign Up Now to Upshots forex trade signals disclaimer The information provided in this report is for educational purposes only. It is not a recommendation
Ichimoku Kinko Hyo System PDF Strategy Guide + MT4 Indicator Download
 Ichimoku Kinko Hyo System PDF Strategy Guide + MT4 Indicator Download ForexStrategiesWork.com Congratulations! You might not know it yet but you are in for a REAL treat in the Forex World. You now have
WTI Crude Oil Volatility Skew
 6 WTI Crude Oil Volatility 12 5 11 4 1 3 9 2 8 1 Implied volatility (%, left) Implied volatility 3-day (%, left) Price (USD/barrel, right) 7 6 45 WTI Crude Oil Volatility Skew 15 4 1 35 5 3 25 2 Change
Introduction 3. Charts: line, bar and candle 4. Critical price levels 6
 Contents page Introduction 3 Charts: line, bar and candle 4 Critical price levels 6 Resistance, support and pivot points 6 Definitions 6 Reasoning 7 Pivot points 8 Fibonacci retracements 9 Relative Strength
PART 3 - CHART PATTERNS & TECHNICAL INDICATORS
 Tyler Chianelli s EASYOPTIONTRADING by OPTION TRADING COACH PART 3 - CHART PATTERNS & TECHNICAL INDICATORS A SIMPLE SYSTEM FOR TRADING OPTIONS WORKS IN UP, DOWN, AND SIDEWAYS MARKETS PART 3.1 - PRIMARY
Raising Investment Standards TRADING SEMINAR
 Raising Investment Standards TRADING SEMINAR Raising Investment Standards DISCLAIMER Leveraged foreign exchange and options trading carries a significant level of risk, and may not be suitable for all
Trading With Price Action Alone
 Trading With Price Action Alone The very premise of technical analysis, based on the efficient market hypothesis, is that all the information about a financial product or market is reflected in its price.
Futures Contract Advanced Strategies
 Futures Contract Advanced Strategies 0 HEDGING Producers and manufacturers can make use of the futures market to hedge the price risk of commodities that they need to purchase or sell in order to protect
Three skills to help you trade forex
 Three skills to help you trade forex AN INTRODUCTION TO TRADING CURRENCIES A FOREX.com educational guide FOREX.com is a trading name of GAIN Capital UK Limited, FCA No. 113942. Our services include products
Magical Forex Trading System
 Magical Forex Trading System By : Alex Buzby Buzby All Rights Reserved - 1 - www.magicalforex.com PLEASE READ: Limits of liability / Disclaimer of Warranty: The author and the publisher of this book and
- My 4 Favorite Trades - Essential Trades of a Professional Trader
 presented by Thomas Wood MicroQuant SM Divergence Trading Workshop Day One - My 4 Favorite Trades - Essential Trades of a Professional Trader Risk Disclaimer Trading or investing carries a high level of
Nihilist Trend Strength
 2015 Nihilist Trend Strength A Forex Trend Following System This System is designed to follow the currency trend and it s power without stressing any more with charts, our aim to trade Risk free trades
US Dow Jones Index / US30Cash (Weekly chart) System price target 14,720.00
 System price target 14,720.00") DAILY TECHNICAL US Dow Jones Index / US30Cash (Weekly chart) System price target 14,720.00 Tuesday, February 04, 2014 S1=14,705.00 Support R1=16,551.00 ADX Signal Comment: Short positions for the US Dow
DAILY TECHNICAL US Dow Jones Index / US30Cash (Weekly chart) System price target 14,720.00 Tuesday, February 04, 2014 S1=14,705.00 Support R1=16,551.00 ADX Signal Comment: Short positions for the US Dow
The Fish Hook Pattern
 The Fish Hook Pattern GOAL The Fish Hook Pattern is a trade entry method that is mentioned from time to time in Jim s Chartbook and on the Premium Alert Service. The idea behind the Fish Hook is that it
No-BS Trading System
 No-BS Trading System Techniques The Professionals Don t Want To Be Revealed DISCLAIMER U.S. Government Required Disclaimer - Commodity Futures Trading Commission Futures and Options trading has large potential
Chart Pattern Secrets
 Chart Pattern Secrets June 14, 2018 Next Alert: 06/19/18 The Trading System: Application of Trading Chart Patterns with Futures and Option Contracts Copyright 1997 All rights reserved. 1 2 3 4 5 5/15/18:
1. Introduction 2. Chart Basics 3. Trend Lines 4. Indicators 5. Putting It All Together
 Technical Analysis: A Beginners Guide 1. Introduction 2. Chart Basics 3. Trend Lines 4. Indicators 5. Putting It All Together Disclaimer: Neither these presentations, nor anything on Twitter, Cryptoscores.org,
The Gann Analysis Rule Book
 2006 Gann Managament Ltd. All Rights Reserved. Gann Management Limited is authorised and Regulated by the Financial Services Authority The Gann Analysis Rule Book A Man Who Never Changes His Mind Will
Master Trader Joe Ross
 The purpose of the Trader's Trick Entry (TTE) is to get us into a trade prior to entry by most other traders. Trading is a business in which the more knowledgeable have the advantage over the less knowledgeable.
Remarkable Results with Renkos
 Remarkable Results with Renkos Years ago, when I first began trading futures, I remember my struggle to find a system that I could depend on to consistently generate the income level that would support
US Dow Jones Index / US30Cash (DAILY CHART) System price target 15,660.00
 System price target 15,660.00") DAILY TECHNICAL US Dow Jones Index / US30Cash (DAILY CHART) System price target 15,660.00 Thursday, January 30, 2014 S1=15,660.00 Support R1=16,564.00 R2=16,048.00 ADX Signal Comment: Short positions for
DAILY TECHNICAL US Dow Jones Index / US30Cash (DAILY CHART) System price target 15,660.00 Thursday, January 30, 2014 S1=15,660.00 Support R1=16,564.00 R2=16,048.00 ADX Signal Comment: Short positions for
TRADE PLANNING WITH SIMPLE SUPPORT & RESISTANCE. Presented by Nabil Mattar FX Technical Analyst
 TRADE PLANNING WITH SIMPLE SUPPORT & RESISTANCE Presented by Nabil Mattar FX Technical Analyst 1 DISCLAIMER IG Asia Pte Ltd (Co. Reg. No. 20051002K) holds a capital markets services licence from the Monetary
Chapter 1.5. Money Management
 Chapter 1.5 Money Management 0 Contents MONEY MANAGEMENT The most important part of investing is money management. Money management involves determining how much of your overall portfolio you are willing
How to Use Charting to Analyze Commodity Markets
 How to Use Charting to Analyze Commodity Markets Introduction Agriculture commodity markets can be analyzed either technically or fundamentally. Fundamental analysis studies supply and demand relationships
The Master Trader Counter-Trend Trade Set-Ups
 The Master Trader Counter-Trend Trade Set-Ups Trading Concepts, Inc. The Master Trader Counter-Trend Trade Set-Ups By Todd Mitchell Copyright 2014 by Trading Concepts, Inc. All Rights Reserved This training
C y c l e C a n d l e s T r a d i n g W o r k s h o p
 C y c l e C a n d l e s Trading Workshop Risk Disclaimer Trading or investing carries a high level of risk, and is not suitable for all persons. Before deciding to trade or invest you should carefully
Follow Price Action Trends By Laurentiu Damir Copyright 2012 Laurentiu Damir
 Follow Price Action Trends By Laurentiu Damir Copyright 2012 Laurentiu Damir All rights reserved. No part of this book may be reproduced or transmitted in any form or by any means, electronic or mechanical,
Market Observations as of Nov 17, 2017
 Market Observations as of Nov 17, 2017 By Carl Jorgensen - For Objective Traders - For educational purposes only. Not Financial Advice. This week we saw a variety of market moves. The daily charts for
Technical Analysis and Charting Part II Having an education is one thing, being educated is another.
 Chapter 7 Technical Analysis and Charting Part II Having an education is one thing, being educated is another. Technical analysis is a very broad topic in trading. There are many methods, indicators, and
BY JIM PRINCE
 No part of this publication may be reproduced, stored in a retrieval system, or transmitted in any form or by any means electronic, mechanical, photocopying, recording, or otherwise without the prior permission
The Engulfing Trader Copyright 2014
 Www.ForexWinners.Ru Prologue and Introduction This book is for all those that are just fed up with all the hype out there in the market. So called guru s selling expensive strategies and systems guaranteeing
BUY SELL PRO. Improve Profitability & Reduce Risk with BUY SELL Pro. Ultimate BUY SELL Indicator for All Time Frames
 BUY SELL PRO Improve Profitability & Reduce Risk with BUY SELL Pro Ultimate BUY SELL Indicator for All Time Frames Risk Disclosure DISCLAIMER: Crypto, futures, stocks and options trading involves substantial
Wave-to-Wave Trading Analysis June 1, 2012
 Trading Wave-to-Wave 1 Wave-to-Wave Trading Analysis June 1, 2012 S&P 500 Index ETF (SPY) Successful traders understand that there are waves within waves 5-minute waves inside of 60-minute waves inside
Trading EveryDay reserves the right to change this privacy statement at any time. Be sure to check this page periodically for updates.
 This content is provided by The Trading EveryDay Group, LLC. This site, including its contents, is provided "as educational content only" without warranty or guarantee of any kind, either expressed or
Lecture 9, Part 2. Graphical Patterns Analysis. Continuation Patterns
 Lecture 9, Part 2 Graphical Patterns Analysis Continuation Patterns The graphical configurations we would look into are called continuation patterns. Such models usually mean that the period of price stagnation
High Probability Trades with the SPX Weekly Option
 High Probability Trades with the SPX Weekly Option An article for Traders World Magazine, by Dale Brethauer This article will take an honest look at why most traders lose and how to flip the script. The
WELCOME
 www.facebook.com/fxdd www.twitter.com/fxdd WELCOME Part 1: Building the Forex Traders Foundation Greg Michalowski Email: greg@fxdd.com www.livestream.com/fxdd www.fxddnow.com Twitter: gregmikefx Disclaimer
WOW33 How to build Iron Condor. Guest: Shawn Howell, Pro Market Advisors LLC Host: Georgio Stoev, Product Manager Saxo Bank
 WOW33 How to build Iron Condor Guest: Shawn Howell, Pro Market Advisors LLC Host: Georgio Stoev, Product Manager Saxo Bank June 3, 2016 Iron Condors A Friend When There is No Trend. Important Information
GUIDE TO FOREX PROFITS REPORT
 GUIDE TO FOREX PROFITS REPORT CONTENTS Introduction... 3 First things first, get a demo!... 4 The Setup... 5 Indicators Explained... 8 IMACD... 8 Average Directional Movement Index... 8 The Strategy...
Pinpointing Entry & Exit Points
 This tutorial was originally titled The Four Steps to 80% Day Trading Success and was recorded at the Online Trading Expo Pinpointing Entry & Exit Points Dr. John F. Clayburg Email - clayburg@pionet.net
T-VALUATION Trading Made Simple. The Fibonacci Channel Indicator Classic. Table of Contents. 1 The Fibonacci Channel Indicator Classic: Overview 2
 The Fibonacci hannel Indicator lassic Table of ontents 1 The Fibonacci hannel Indicator lassic: Overview 2 2 Using the Fibonacci hannel Indicator 3 3. Alerts 9 4. Using the T-Bars Paint Study 10 5. Inputs
Stocks, Bonds, U.S. Dollar Index, Precious Metals and Special Opportunities Updated Every Monday, Wednesday and Friday (except U.S.
 Stocks, Bonds, U.S. Dollar Index, Precious Metals and Special Opportunities Updated Every Monday, Wednesday and Friday (except U.S. Holidays) The SM is service marked and copyrighted by Elliott Wave International
CMS Prime DAILY MARKET REPORT
 CMS Prime DAILY MARKET REPORT May 1,5 2018 EURUSD BEARISH BIAS short position at 1.1935 with SL : 1.1960 and with targets at 1.1910 and 1.1890 long position at 1.1960 with SL : 1.1910 and with targets
INTRODUCTION CHAPTER 1
 INTRODUCTION CHAPTER 1 Autochartist offers traders automated market-scanning tools that highlight trade opportunities based on support and resistance levels. Autochartist products include: Chart pattern
Market Observations - as of May 11, 2018
 Market Observations - as of May 11, 2018 By Carl Jorgensen - For Objective Traders - For educational purposes only. Not Financial Advice. After about four weeks of very little net change in the major indexes
Resistance to support
 1 2 2.3.3.1 Resistance to support In this example price is clearly consolidated and we can expect a breakout at some time in the future. This breakout could be short or it could be long. 3 2.3.3.1 Resistance
Trend Channels: How to Identify Easy Profit-Making Opportunities Using Simple Chart Analysis
 Trend Channels: How to Identify Easy Profit-Making Opportunities Using Simple Chart Analysis Trend channels produce a very powerful trading technique. They are very visible, which makes them easy to utilize