PPG Industries, Inc. Second Quarter 2017 Financial Results Earnings Brief July 20, 2017
|
|
|
- Marian Anderson
- 5 years ago
- Views:
Transcription


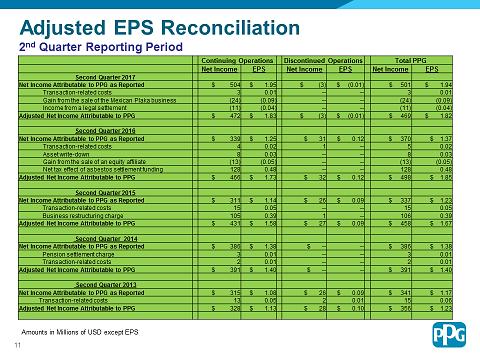
1 PPG Industries, Inc. Second Quarter 2017 Financial Results Earnings Brief July 20, 2017 Second Quarter Financial Highlights Net sales for the second quarter 2017 were $3.8 billion, increasing about 1 percent versus the prior year. Aggregate year-over-year net sales volumes were flat, with results differing by region and business unit. Selling prices improved slightly versus the prior year and in comparison to recent sequential quarters, reflecting initial efforts to offset raw material cost inflation. Additional sales price initiatives are underway for the second half of Acquisition-related sales contributed 2 percent to the year-over-year net sales growth, while unfavorable foreign currency translation reduced sales by less than 2 percent. More in-depth sales comparisons for the total company and each reportable business segment are included in the subsequent presentation materials. Adjusted earnings per diluted share from continuing operations of $1.83 increased by 6 percent versus the prior year. This growth was achieved despite notable raw material cost inflation and continued unfavorable foreign currency translation. These headwinds were offset by aggressive manufacturing and overhead cost management, including further benefits from the Company s restructuring program announced in late The Company remains on pace to achieve targeted full year 2017 restructuring savings of $40 -to- $50 million. Acquisitions completed within the past 12 months, along with corresponding synergy achievement, also contributed to the year-over-year EPS growth. The Company has maintained a strong balance sheet with cash and short-term investments at period end of approximately $1.6 billion. The Company announced today that it now expects its cash deployment for years 2017 and 2018 combined, to be a minimum of $3.5 billion. The Company indicated it is resuming its share repurchase program in the third quarter All periods presented have been recast to present sales and the results of operations of PPG s former Glass segment as discontinued operations.


2 PPG Second Quarter Net Sales Second quarter net sales were $3.8 billion, up about 1 percent versus the prior year, including unfavorable foreign currency translation of about $65 million, or nearly 2 percent. Sales volumes were flat year-over-year, while selling prices improved slightly. The increase in selling prices reflect efforts to offset significant raw material cost inflation, and the Company s year-over-year selling price trend has improved for two consecutive quarters. Additional pricing initiatives are underway for the second half of Sales volumes were flat year-over-year, but results differed by region and business unit, as will be detailed later in the presentation materials. In 2017, the Easter holiday shifted into the second quarter, resulting in fewer selling days and adversely impacting second quarter year-over-year volume growth. The Company benefitted from additional selling days in the first quarter due to this shift. The fewer selling days primarily impacted coating end-use markets that are heavily retail or distribution dependent, with modest to no impact on industrial or original equipment manufacturer end-use markets. In the quarter, sales from acquisitions added more than 2 percent to net sales year-overyear. The MetoKote acquisition reached its one year anniversary at the end of the second quarter; therefore, sales for this business will no longer be classified as acquisition-related beginning in the third quarter. Foreign currency translation remained a significant headwind stemming from year-over-year weakness in several currencies versus the U.S. dollar. Most notably, and accounting for a majority of the unfavorable impact, were the Mexican peso, British pound, Chinese Yuan and the euro. These headwinds are expected to moderate in the third quarter based on current exchange rates. Second Quarter Coatings Net Sales Volumes In aggregate, year-over-year sales volumes were flat. In the U.S. and Canada, PPG s sales volumes were down slightly versus the prior year, including the effects from the macro regional impacts of lower auto industry production along with fewer selling days due to the timing of the Easter holiday. In contrast to PPG s 2

3 estimates of projected coatings industry end-use market demand, the Company s regional volume performance was mixed. Strong above market outperformance continued in general industrial coatings due to customer adoption of key PPG technologies, coupled with above regional market growth in aerospace and automotive refinish. PPG sales volumes were below market in automotive original equipment manufacturer (OEM) coatings, although the Company outperformed the industry rates, on a global basis. PPG sales volumes were also below market in architectural coatings, including the unfavorable effects from the Company s channel mix where the national accounts (DIY) and independent dealer channels currently are not achieving the same growth trajectory as the professional/trade channel. Overall sales volumes were flat in the Europe, Middle East and Africa (EMEA) region versus the prior year primarily due to the unfavorable impact of the Easter holiday shift. Automotive OEM, Aerospace and architectural coatings all delivered volumes above projected market demand in the region. Packaging coatings volumes were at market, including the effect of a difficult prior year comparison, when the business grew volumes by a high single-digit percentage based on customer adoption of new technologies. In Asia-Pacific, sales volumes expanded by a mid-single-digit percentage year-over-year led by continued strong performance in automotive OEM and general industrial coatings along with solid growth in architectural coatings, partly offset by industry-related declines in marine coatings demand. From a country and sub-region perspective, and similar to the prior quarter, sales volumes grew in India, China and Southeast Asia versus the prior year. Korea remained in decline year-over-year primarily due to continued weakness in shipbuilding. Latin America sales volumes expanded by a low-single-digit percentage versus the prior year primarily due to above-market year-over-year growth in automotive OEM and general industrial coatings, partly offset by declines in automotive refinish. PPG Adjusted Earnings Per Diluted Share Second quarter adjusted earnings per diluted share from continuing operations of $1.83 increased by 6 percent versus the prior year. Financial results from each reportable business segment are provided in subsequent slides and other presentation materials. The key factors impacting earnings per diluted share growth were: 3 Initial selling price increases were implemented in various businesses but didn t fully address raw material cost inflation. Further selling price actions are underway.

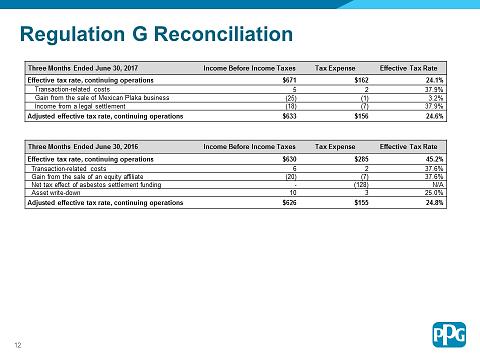
4 4 The Company has continued to aggressively manage manufacturing and overhead costs, including benefits from restructuring Despite recent U.S. dollar weakness, foreign currency translation continued to unfavorably impact financial results Cash deployment continued to aid adjusted earnings-per-diluted-share growth, including income stemming from recent acquisitions. In addition, the average number of shares outstanding decreased approximately 4 percent year-over-year as a result of share repurchases. As a reminder, all periods presented have been recast to present sales and the results of operations of PPG s former Glass segment as discontinued operations. The second quarter adjusted effective tax rate was 24.6%, decreasing modestly from 24.8% in the prior year. Including the effect of the recast of the Glass segment results, the company anticipates its full year effective tax rate on ongoing earnings from continuing operations will be between 24.5 percent and 25.0 percent. Performance Coatings Second quarter Performance Coatings segment net sales were $2.3 billion, down $37 million versus prior year, or about 2 percent, primarily due to the unfavorable impact from foreign currency translation of about $40 million, or 2 percent. Sales from the DEUTEK and Univer acquisitions added approximately $20 million, and segment selling prices increased to reflect partial recovery of raw material cost inflation. Sales volumes were down 2 percent compared to the prior year. Segment income of $413 million declined by $15 million year-over year, or about 4 percent, primarily due to significant raw material cost inflation and lower volumes, partly offset by disciplined cost management actions, including further benefits from the Company s 2016 restructuring program. Unfavorable foreign currency translation reduced segment income by approximately $10 million versus the prior year primarily due to the Mexican peso, British pound and euro. From a business unit perspective, automotive refinish coatings organic sales growth continued year-over-year, led by above-market performance in the U.S. and Canada and solid performance in the EMEA regions. We expect these general trends to continue in the third quarter. Aerospace sales volumes grew by a low single-digit percentage in the quarter. This growth is due to higher customer use of key PPG technologies and the absence of customer

5 5 inventory management, which negatively impacted several previous sequential quarters. We anticipate similar industry demand patterns in the third quarter. Architectural EMEA sales volumes declined by a low-single-digit percentage year-over-year primarily due to fewer selling days versus the prior year quarter. Average daily sales per available selling day improved by a low-single-digit percentage in the second quarter versus last year. In addition, selling prices improved based on various pricing initiatives implemented during the quarter. Looking ahead, we expect continued modest demand growth in Western Europe and a slight improvement in Eastern Europe, but lower sales sequentially due to normal business seasonality. Architectural coatings Americas and Asia-Pacific sales volumes declined by a low singledigit percentage in the second quarter versus the prior year, including effects from fewer selling days in the quarter versus the prior year. In the U.S. and Canada we implemented initial selling price actions, and we plan further selling price initiatives in the third quarter. Sales volumes increased by a mid-single digit percentage in U.S. company-owned stores driven by higher professional/trade painting demand and marking the 6 th consecutive quarterly improvement versus prior year. These gains were offset by sales volume declines in the U.S. and Canada independent dealer network and mixed results in national retail (DIY) accounts. Organic sales improved in Latin America and Asia-Pacific. We expect overall demand to remain generally consistent in each region in the third quarter, with lower sales seasonally in North America. During the second quarter, sales volumes declined in protective and marine coatings versus the prior year, with low double-digit percentage declines in marine coatings partly offset by modest protective coatings sales volume expansion. Looking ahead, we anticipate a moderating unfavorable impact from the marine coatings sub-segment as we begin to reach the anniversary of the bottoming of industry demand in the marine new-build end-use market. Modestly positive protective coatings demand is expected to remain in the third quarter, with differences by region. Selling price actions are planned in protective coatings in the second half of In the third quarter, acquisitions are expected to add $20 million to $25 million to segment sales and, based on current exchange rates, including recent U.S. dollar weakness, we expect that foreign currency translation will not have a significant impact on segment sales or income. Industrial Coatings Second quarter net sales for the Industrial Coatings segment were $1.5 billion, up $61 million, or 4 percent, versus the prior year. Segment sales
6 6 volumes increased by about 3 percent, and acquisition-related sales contributed an additional 4 percent, or about $65 million. Unfavorable foreign currency translation impacted net sales by approximately 2 percent, or about $25 million. Aggregate selling prices were lower for the segment in the second quarter, thus unfavorably impacting net sales. Segment income in the second quarter of $264 million was down $28 million, or about 10 percent year-over-year, including a $5 million unfavorable impact from foreign currency translation. Segment income was affected by raw material cost inflation and lower selling prices, partly offset by the favorable effects of higher sales volumes and lower manufacturing and overhead costs, including benefits from business restructuring. Additionally, segment income benefitted from acquisitions, including the realization of targeted synergies. By business unit, sales volumes increased by a low single-digit percentage in automotive OEM coatings versus the prior year, despite global auto industry production declining by about 1 percent in the quarter. PPG s above-market performance was aided by customer pull of key technologies and our geographic mix of sales as we remain well positioned in higher growth regions. Industry production is anticipated to return to growth of about 1 percent globally in the third quarter, with declines in the U.S. and Canada and growth in other major regions. In aggregate, industrial coatings and specialty coatings and materials sales volumes increased a mid-single-digit percentage year-over-year. These PPG gains were led by emerging region growth, but solid at -or- above industry growth also occurred in developed regions. Within the businesses, sales volumes grew across many sub-segments, including year-over-year increases in electronics materials, heavy duty equipment and organic light emitting diode (OLED) materials. Looking ahead, we expect continued moderate industrial end-use market demand growth trends, with ongoing variability by geography and subsector. We also expect PPG s market outperformance to continue. Packaging coatings sales volumes were flat year-over-year, reflecting a comparison to strong high single-digit percentage growth in the prior year period. Prior to this quarter, PPG has delivered above-market growth in this business for 10 consecutive quarters, based on customer adoption of PPG s new can coatings technologies. Going forward, we expect incremental, above-market volume growth from further customer adoption of our technologies. Acquisition-related sales from MetoKote added approximately $65 million in the second quarter. Going forward, these sales will no longer be classified as acquisition-related as the acquisition reached its one-year anniversary in July Also, based on current exchange rates, including recent U.S. dollar weakness, we expect that foreign currency translation is expected to only have a minor effect to segment sales and income.

7 7 Balance Sheet and Cash PPG ended the second quarter with $1.6 billion in cash and short term investments. Approximate cash uses in the second quarter and year-to-date are as follows: Capital expenditures totaled about $75 million for the second quarter and about $135 million year-to-date. The Company anticipates capital spending to be about 3.0 percent of sales for the full-year. Dividends paid were $102 million in the second quarter and $205 million year-to-date. Acquisition-related cash deployment was $100 million for the quarter and about $165 million year-to-date. No shares were repurchased in the second quarter, with year-to-date repurchases of about $165 million, or about 1.6 million shares. As of June 30, 2017, the Company had about $1.7 billion remaining under its current share repurchase authorization. The Company is resuming repurchases in the third quarter. The Company provided an initial cash deployment target for years 2017 and 2018 combined in the range of $2.5 -to- $3.5 billion for acquisitions and share repurchases. The Company now anticipates spending a minimum of $3.5 billion over that same time frame.
8 8
9 9 Forward Looking Statements The Private Securities Litigation Reform Act of 1995 provides a safe harbor for forwardlooking statements made by or on behalf of the Company. This presentation contains forward-looking statements that reflect the Company s current views with respect to future events and financial performance. You can identify forward-looking statements by the fact that they do not relate strictly to current or historic facts. Forward-looking statements are identified by the use of the words aim, believe, expect, anticipate, intend, estimate, project, outlook, forecast and other expressions that indicate future events and trends. Any forward-looking statement speaks only as of the date on which such statement is made, and the Company undertakes no obligation to update any forward looking statement, whether as a result of new information, future events or otherwise. You are advised, however, to consult any further disclosures we make on related subjects in our reports to the Securities and Exchange Commission. Also, note the following cautionary statements: Many factors could cause actual results to differ materially from the Company s forwardlooking statements. Such factors include global economic conditions, increasing price and product competition by foreign and domestic competitors, fluctuations in cost and availability of raw materials, the ability to maintain favorable supplier relationships and arrangements, the timing of and the realization of anticipated cost savings from restructuring initiatives, difficulties in integrating acquired businesses and achieving expected synergies therefrom, economic and political conditions in international markets, the ability to penetrate existing, developing and emerging foreign and domestic markets, foreign exchange rates and fluctuations in such rates, fluctuations in tax rates, the impact of future legislation, the impact of environmental regulations, unexpected business disruptions and the unpredictability of existing and possible future litigation. However, it is not possible to predict or identify all such factors. Consequently, while the list of factors presented here and under Item 1A of PPG s 2016 Form 10-K is considered representative, no such list should be considered to be a complete statement of all potential risks and uncertainties. Unlisted factors may present significant additional obstacles to the realization of forward-looking statements. Consequences of material differences in the results compared with those anticipated in the forward-looking statements could include, among other things, lower sales or earnings, business disruption, operational problems, financial loss, legal liability to third parties, other factors set forth in Item 1A of PPG s 2016 Form 10-K and similar risks, any of which could have a material adverse effect on the Company s consolidated financial condition, results of operations or liquidity. All of this information speaks only as of July 20, 2017, and any distribution of this release after that date is not intended and will not be construed as updating or confirming such information. PPG undertakes no obligation to update any forward-looking statement, except as otherwise required by applicable law.
PPG Industries, Inc. Fourth 2017 Financial Results Earnings Brief January 18, 2018
 PPG Industries, Inc. Fourth 2017 Financial Results Earnings Brief January 18, 2018 Fourth Quarter Financial Highlights PPG fourth quarter net sales from continuing operations were approximately $3.7 billion,
PPG Industries, Inc. Fourth 2016 Financial Results Earnings Brief January 19, 2017
 PPG Industries, Inc. Fourth 2016 Financial Results Earnings Brief January 19, 2017 Fourth Quarter Financial Highlights PPG fourth quarter net sales from continuing operations of $3.5 billion were down
PPG Industries, Inc. Third 2016 Financial Results Earnings Brief October 20, 2016
 PPG Industries, Inc. Third 2016 Financial Results Earnings Brief October 20, 2016 Third Quarter 2016 Financial Highlights PPG net sales for the third quarter 2016 were $3.8 billion, up almost 2 percent
PPG Industries, Inc. First 2018 Financial Results Earnings Brief April 19, 2018
 PPG Industries, Inc. First 2018 Financial Results Earnings Brief April 19, 2018 First Quarter Financial Highlights PPG first quarter net sales from continuing operations were approximately $3.8 billion,
PPG Industries, Inc. First Quarter 2019 Financial Results Earnings Brief April 18, 2019
 PPG Industries, Inc. First Quarter 2019 Financial Results Earnings Brief April 18, 2019 First Quarter Financial Highlights PPG first quarter net sales from continuing operations were approximately $3.6
PPG Industries, Inc. Second 2016 Financial Results Earnings Brief July 21, 2016
 PPG Industries, Inc. Second 2016 Financial Results Earnings Brief July 21, 2016 Second Quarter 2016 Financial Highlights PPG net sales for the second quarter 2016 were $4.1 billion, down less than one
PPG Industries, Inc. Second Quarter 2018 Financial Results Earnings Brief July 19, 2018
 PPG Industries, Inc. Second Quarter 2018 Financial Results Earnings Brief July 19, 2018 Second Quarter Financial Highlights PPG second quarter net sales from continuing operations were approximately $4.1
First Quarter 2019 Financial Results
 First Quarter 2019 Financial Results Michael H. McGarry, Chairman and Chief Executive Officer Vincent J. Morales, Senior Vice President and Chief Financial Officer John Bruno, Director, Investor Relations
PPG Industries, Inc. Fourth Quarter 2018 Financial Results Earnings Brief January 17, 2019
 PPG Industries, Inc. Fourth Quarter 2018 Financial Results Earnings Brief January 17, 2019 Fourth Quarter Financial Highlights PPG fourth quarter net sales from continuing operations were approximately
PPG Industries, Inc. Second Quarter 2015 Financial Results Earnings Brief July 16, 2015
 PPG Industries, Inc. Second Quarter 2015 Financial Results Earnings Brief July 16, 2015 Second Quarter Financial Highlights PPG net sales for the second quarter 2015 increased to $4.10 billion versus the
PPG Industries, Inc. Second Quarter 2014 Financial Results Earnings Brief July 17, 2014
 PPG Industries, Inc. Second Quarter 2014 Financial Results Earnings Brief July 17, 2014 Second Quarter Financial Summary PPG net sales from continuing operations for the second quarter increased to $4.1
PPG Third Quarter 2017 Financial Results
 PPG Third Quarter 2017 Financial Results Michael H. McGarry, Chairman and Chief Executive Officer Vincent J. Morales, Senior Vice President and Chief Financial Officer John Bruno, Director Investor Relations
PPG Industries, Inc. Third Quarter 2015 Financial Results Earnings Brief October 15, 2015
 PPG Industries, Inc. Third Quarter 2015 Financial Results Earnings Brief October 15, 2015 Third Quarter Financial Highlights PPG net sales for the third quarter of 2015 were $3.87 billion versus the prior
PPG Fourth Quarter and Full Year 2017 Financial Results
 PPG Fourth Quarter and Full Year 2017 Financial Results Michael H. McGarry, Chairman and Chief Executive Officer Vincent J. Morales, Senior Vice President and Chief Financial Officer John Bruno, Director,
Fourth Quarter 2018 Financial Results
 Fourth Quarter 2018 Financial Results Michael H. McGarry, Chairman and Chief Executive Officer Vincent J. Morales, Senior Vice President and Chief Financial Officer John Bruno, Director, Investor Relations
Third Quarter 2018 Financial Results
 Third Quarter 2018 Financial Results Michael H. McGarry, Chairman and Chief Executive Officer Vincent J. Morales, Senior Vice President and Chief Financial Officer John Bruno, Director, Investor Relations
News. PPG reports second quarter 2016 financial results
 News PPG Media Contact: Mark Silvey Corporate Communications +1-412-434-3046 silvey@ppg.com PPG Investor Contact: Scott Minder Investor Relations +1-412-434-3466 sminder@ppg.com www.ppg.com/investor PPG
News. PPG reports fourth quarter and full-year 2018 financial results
 News PPG Media Contact: Mark Silvey Corporate Communications +1-412-434-3046 silvey@ppg.com PPG Investor Contact: John Bruno Investor Relations +1-412-434-3466 jbruno@ppg.com investor.ppg.com PPG reports
PPG. Protecting and. Michael Beautifying H. McGarry the World Chairman and Chief Executive Officer. New York Nov. 28, 2017
 PPG Protecting and Michael Beautifying H. McGarry the World Chairman and Chief Executive Officer Citi Michael Basic Materials H. McGarry Conference New York Nov. 28, 2017 Forward Looking Statements The
PPG Frank S. Sklarsky Executive Vice President and Chief Financial Officer
 PPG Frank S. Sklarsky Executive Vice President and Chief Financial Officer Bank of America s 2016 Agriculture & Chemicals Conference Fort Lauderdale, FL Information current as of March 1, 2016 Forward
Third Quarter 2017 Conference Call. October 27, 2017
 Third Quarter 2017 Conference Call October 27, 2017 Forward-Looking Statements Certain information contained in this presentation constitutes forward-looking statements for purposes of the safe harbor
David Navikas Vice President and Controller
 David Navikas Vice President and Controller PPG Industries, Inc. New York City May 18, 2007 Forward-Looking Statement Statements contained herein relating to matters that are not historical facts are forward-looking
Q4 & Full Year 2017 Financial Results
 Exhibit 99.2 Q4 & Full Year 2017 Financial Results February 6, 2018 Legal Notices Forward-Looking Statements This presentation and the oral remarks made in connection herewith may contain forward-looking
A X A L T A C O A T I N G S Y S T E M S. Q4 & FULL YEAR 2016 FINANCIAL RESULTS February 8 th, 2017
 A X A L T A C O A T I N G S Y S T E M S Q4 & FULL YEAR 2016 FINANCIAL RESULTS February 8 th, 2017 Legal Notices Forward-Looking Statements This presentation and the oral remarks made in connection herewith
Q Earnings. April 20, 2016
 Q2 2016 Earnings April 20, 2016 Forward-Looking Statements and Non-GAAP Measures Forward-Looking Statements This presentation contains certain forward-looking statements within the meaning of the U.S.
1 st Quarter 2018 Earnings Conference Call. April 26, 2018
 1 st Quarter 2018 Earnings Conference Call April 26, 2018 Safe Harbor Today s presentation includes forward-looking statements that reflect management s current expectations about the Company s future
First Quarter 2018 Conference Call. April 25, 2018
 First Quarter 2018 Conference Call April 25, 2018 Forward-Looking Statements Certain information contained in this presentation constitutes forward-looking statements for purposes of the safe harbor provisions
Q Earnings. October 31, 2018
 Q4 2018 Earnings October 31, 2018 Forward-Looking Statements and Non-GAAP Financial Measures Forward-Looking Statements This presentation contains certain forward-looking statements within the meaning
Our results at a glance
 Report for the first quarter 2014 AkzoNobel I Report for the first quarter 2014 2 AkzoNobel around the world Revenue by destination (44 percent in high growth markets) A North America B Emerging Europe
Q Earnings Call. April 24, 2013
 Q2 2013 Earnings Call April 24, 2013 Forward-Looking Statements and Non-GAAP Measures Forward-Looking Statements -- This presentation contains certain forward-looking statements within the meaning of the
Q Earnings. July 26, 2017
 Q3 2017 Earnings July 26, 2017 Forward-Looking Statements and Non-GAAP Measures Forward-Looking Statements This presentation contains certain forward-looking statements within the meaning of the U.S. Private
2Q 2017 Highlights and Operating Results
 2Q 2017 Highlights and Operating Results July 25, 2017 1 2Q 2017 Highlights and Operating Results Table of Contents Page(s) 1 Sales Overview and Highlights 4-5 2 NSS Overview 6-7 3 EES Overview 8-9 4 UPS
Axalta Coating Systems Ltd.
 Q1 2015 Conference Call May 6, 2015 Notice Regarding Forward Looking Statements, Non-GAAP Financial Measures and Defined Terms Forward-Looking Statements This presentation and the oral remarks made in
Q Earnings. October 28, 2015
 Q4 2015 Earnings October 28, 2015 Forward-Looking Statements and Non-GAAP Measures Forward-Looking Statements This presentation contains certain forward-looking statements within the meaning of the U.S.
Q Earnings. July 20, 2016
 Q3 2016 Earnings July 20, 2016 Forward-Looking Statements and Non-GAAP Measures Forward-Looking Statements This presentation contains certain forward-looking statements within the meaning of the U.S. Private
4Q 2018 Highlights and Operating Results. Products. Technology. Services. Delivered Globally.
 4Q 2018 Highlights and Operating Results Products. Technology. Services. Delivered Globally. Table of Contents Page 3 Safe Harbor Statement and Non-GAAP Financial Measures 4 Sales Overview 9 Overview of
FRANKLIN ELECTRIC REPORTS 2010 EARNINGS PER SHARE INCREASED 48 PERCENT FROM 2009
 For Immediate Release For Further Information Refer to: John J. Haines 260-824-2900 FRANKLIN ELECTRIC REPORTS 2010 EARNINGS PER SHARE INCREASED 48 PERCENT FROM 2009 Bluffton, Indiana February 28, 2011
Forward-Looking Statements
 First Quarter 2016 Conference Call April 27, 2016 Forward-Looking Statements Certain information contained in this presentation constitutes forward-looking statements for purposes of the safe harbor provisions
Mondelēz International Q Results. July 27, 2016
 Mondelēz International Q2 2016 Results July 27, 2016 1 Forward-Looking Statements This presentation contains a number of forward-looking statements. Words, and variations of words, such as will, expect,
OWENS-ILLINOIS. Credit Suisse 2018 Basic Materials Conference
 OWENS-ILLINOIS Credit Suisse 2018 Basic Materials Conference ANDRES LOPEZ, CEO JAN BERTSCH, CFO SEPTEMBER 12, 2018 Safe harbor comments Forward-Looking Statements This document contains "forward-looking"
Q Earnings. January 23, 2019
 Q1 2019 Earnings January 23, 2019 Forward-Looking Statements and Non-GAAP Financial Measures Forward-Looking Statements This presentation contains certain forward-looking statements within the meaning
productivity results support our confidence in raising the full-year earnings outlook.
 April 21, 2011 Media Contact: Anthony Farina WILMINGTON, Del. 302-773-4418 anthony.r.farina@usa.dupont.com Investor Contact: 302-774-4994 DuPont Reports 1Q 2011 Earnings of $1.52 per Share, Raises 2011
Financial Information
 Financial Information H1 revenues reached 12.8bn up 9.8%, flat org. in Q2 Adj. EBITA reached 1.6bn, up 6.4%, Adj. EBITA margin flat excl. Invensys in a challenging environment 2015 targets: Around flat
THIRD QUARTER REPORT Period Ended September 30, Management s Discussion and Analysis and Unaudited Consolidated Financial Statements
 THIRD QUARTER REPORT Period Ended 2010 Management s Discussion and Analysis and Unaudited Consolidated Financial Statements MANAGEMENT S DISCUSSION AND ANALYSIS This management s discussion and analysis
XYLEM INC. Q EARNINGS RELEASE JULY 31, 2018
 XYLEM INC. Q2 2018 EARNINGS RELEASE JULY 31, 2018 Q2 2018 EARNINGS RELEASE FORWARD-LOOKING STATEMENTS This presentation contains information that may constitute forward-looking statements. within the meaning
Earnings/News Release
 Earnings/News Release Avon Reports Fourth-Quarter and 2008 Results Fourth-Quarter Earnings Per Share Up 80% to $.54 Fourth-Quarter Total Revenue of $2.8 Billion 9% Lower; Up 2% on Local-Currency Basis
Thank you, good morning everyone and welcome to our fourth quarter 2014 business review.
 Q4 2014 Earnings Call Transcript Inge Thulin & Nicholas Gangestad January 27, 2015 Slide 1, Opening Matt Ginter, Vice President, Investor Relations Thank you, good morning everyone and welcome to our fourth
2017 Third Quarter Business Review
 2017 Third Quarter Business Review (Unaudited) October 24, 2017 1 Earnings Conference Calls Q4: January 25, 2018 2018 Outlook Meeting December 12, 2017 8:00 a.m. - 12:00 p.m. EST 2 Forward looking statement
First Quarter 2015 Earnings Conference Call
 Earnings Conference Call February 3, 2015 Safe Harbor Statement Our commentary and responses to your questions may contain forward-looking statements, including our outlook for the remainder of the year,
ITW Conference Call First Quarter 2013
 ITW Conference Call First Quarter 2013 April 23, 2013 SOLID GROWTH. STRONG RETURNS. BEST-IN-CLASS OPERATOR. Forward-Looking Statements Safe Harbor Statement This conference call contains forward-looking
Q Earnings. April 26, 2017
 Q2 2017 Earnings April 26, 2017 Forward-Looking Statements and Non-GAAP Measures Forward-Looking Statements This presentation contains certain forward-looking statements within the meaning of the U.S.
Q Earnings February 17, 2016
 Q4 2015 Earnings February 17, 2016 Safe Harbor Statement These materials include projections and other forward-looking statements. These statements are based on the current expectations of Garmin Ltd.
Net income to common stockholders improved $1.4 billion Y-O-Y to a Q3 record of $2.8 billion.
 1 2 3 Q3 global deliveries up 0.1 million units Y-O-Y, a 4% increase. Volume gains primarily in China, offset by reductions in other International Operations. Q3 market share is down 40 bps Y-O-Y, driven
2016 Financial Update and 2017 Outlook. Webcast Presentation December 13, 2016
 2016 Financial Update and 2017 Outlook Webcast Presentation December 13, 2016 Safe Harbor Statement Note: All statements made herein that are not historical facts should be considered as forwardlooking
4 th Quarter 2017 Earnings Conference Call. January 30, 2018
 4 th Quarter 2017 Earnings Conference Call January 30, 2018 Safe Harbor Today s presentation includes forward-looking statements that reflect management s current expectations about the Company s future
PPG Industries, Inc. (PPG) Analyst: Dung Nguyen. Recommendation: HOLD Estimated Fair Value: $95 - $120 * 1. Reasons for the Recommendation
 Analyst: Dung Nguyen. Recommendation: HOLD Estimated Fair Value: $95 - $120 * 1. Reasons for the Recommendation") Recommendation: HOLD Estimated Fair Value: $95 - $120 * 1. Reasons for the Recommendation As the global economy starts to recover, it is estimated that the demand for diversified chemicals will be stronger.
Recommendation: HOLD Estimated Fair Value: $95 - $120 * 1. Reasons for the Recommendation As the global economy starts to recover, it is estimated that the demand for diversified chemicals will be stronger.
4 th Quarter 2018 Earnings Conference Call. January 29, 2019
 4 th Quarter 2018 Earnings Conference Call January 29, 2019 Safe Harbor Today s presentation includes forward-looking statements that reflect management s current expectations about the Company s future
Webcast. Fourth Quarter Fiscal Year 2016 Results. Quarter ended February 26, 2016
 Webcast Fourth Quarter Fiscal Year Results Quarter ended February 26, Forward-looking statements From time to time, in written and oral statements, the company discusses its expectations regarding future
Fiscal Year 2016 Fourth Quarter Conference Call
 Fiscal Year 2016 Fourth Quarter Conference Call November 7, 2016 2 Safe Harbor Statement This presentation includes statements related to the expected future results of the company and are therefore forward-looking
XYLEM INC. Q EARNINGS RELEASE OCTOBER 30, 2018
 XYLEM INC. Q3 2018 EARNINGS RELEASE OCTOBER 30, 2018 Q3 2018 EARNINGS RELEASE FORWARD-LOOKING STATEMENTS This presentation contains information that may constitute forward-looking statements. within the
Draft Q1 Report Report
 1 170410 Draft Q1 Report 2017 Report 17 AkzoNobel I Report for the first quarter 2017 2 Our results at a glance Record Q1 profitability (EBIT, ROS and ROI) for AkzoNobel Revenue up in all Business Areas
Masco Corporation Third Quarter 2018 Earnings Presentation. October 30, 2018
 Masco Corporation Third Quarter 2018 Earnings Presentation October 30, 2018 Safe Harbor Statement This presentation contains statements that reflect our views about our future performance and constitute
Diluted EPS $0.46 $0.46 0% $1.16 $1.26 (8)%
%") Donaldson Reports Third Quarter Results Donaldson Company, Inc. (NYSE: DCI) announced its financial results for its fiscal 2013 third quarter. Summarized financial results are as follows (dollars in millions,
Donaldson Reports Third Quarter Results Donaldson Company, Inc. (NYSE: DCI) announced its financial results for its fiscal 2013 third quarter. Summarized financial results are as follows (dollars in millions,
3 rd Quarter 2018 Earnings Conference Call. October 25, 2018
 3 rd Quarter 2018 Earnings Conference Call October 25, 2018 Safe Harbor Today s presentation includes forward-looking statements that reflect management s current expectations about the Company s future
Full-Year 2018 Investor Call
 Full-Year 2018 Investor Call Achieved 2018 core sales and 2018 EPS growth of 11% with continued growth expected in 2019 and beyond. We remain on track to fully achieve our Strategy and Capital Allocation
2015 First Quarter Business Review (unaudited) April 23, 2015
 April 23, 2015") 2015 First Quarter Business Review (unaudited) April 23, 2015 1 Forward Looking Statement This presentation contains forward-looking information about 3M's financial results and estimates and business
2015 First Quarter Business Review (unaudited) April 23, 2015 1 Forward Looking Statement This presentation contains forward-looking information about 3M's financial results and estimates and business
Mondelēz International 2013 Results. February 12, 2014
 Mondelēz International 2013 Results February 12, 2014 1 Forward-looking statements This slide presentation contains a number of forward-looking statements. Words, and variations of words, such as will,
Second Quarter 2014 Conference Call
 Second Quarter 2014 Conference Call E. Scott Santi, President & CEO Michael M. Larsen, Senior Vice President & CFO John Brooklier, Vice President Investor Relations July 29, 2014 FORWARD LOOKING STATEMENTS
3Q 2018 Highlights and Operating Results. Products. Technology. Services. Delivered Globally.
 3Q 2018 Highlights and Operating Results Products. Technology. Services. Delivered Globally. Table of Contents Page 3 Safe Harbor Statement and Non-GAAP Financial Measures 4 Sales Overview 9 Overview of
Fourth Quarter 2017 Conference Call. February 8, 2018
 Fourth Quarter 2017 Conference Call February 8, 2018 Forward-Looking Statements Certain information contained in this presentation constitutes forward-looking statements for purposes of the safe harbor
Report. Report for the full-year and fourth quarter 2016
 4 Report Report for the full-year and fourth quarter 2016 16 AkzoNobel I Report for the full-year and the fourth quarter 2016 2 Our results at a glance Full-year: Record ROS, ROI, EBIT, adjusted EPS and
A X A L T A C O A T I N G S Y S T E M S Q4 & FULL YEAR 2015 FINANCIAL RESULTS FEBRUARY 10, 2016
 A X A L T A C O A T I N G S Y S T E M S Q4 & FULL YEAR 2015 FINANCIAL RESULTS FEBRUARY 10, 2016 Legal Notices Forward-Looking Statements This presentation and the oral remarks made in connection herewith
FRANKLIN ELECTRIC REPORTS FOURTH QUARTER AND FULL YEAR 2017 SALES AND EARNINGS
 FOR IMMEDIATE RELEASE Contact: John J. Haines Franklin Electric Co., Inc. 260-824-2900 FRANKLIN ELECTRIC REPORTS FOURTH QUARTER AND FULL YEAR 2017 SALES AND EARNINGS Fort Wayne, IN February 20, 2018 -
ITT Inc. Q Earnings Call & 2018 Guidance
 ITT Inc. Q4 2017 Earnings Call & 2018 Guidance February 16, 2018 Safe Harbor This presentation contains forward-looking statements intended to qualify for the safe harbor from liability established by
GENERAL MILLS REPORTS FISCAL 2019 FIRST-QUARTER RESULTS
 News/Information Investor Relations P. O. Box 1113 Minneapolis, MN 55440 FOR IMMEDIATE RELEASE September 18, 2018 Contact: (analysts) Jeff Siemon: 763-764-2301 (media) Kelsey Roemhildt: 763-764-6364 GENERAL
14375 NW Science Park Drive Portland, OR April 29, 2014
 14375 NW Science Park Drive Portland, OR 97229 April 29, 2014 CFO Commentary on First Quarter 2014 Financial Results, Upward-Revised 2014 Pre-Acquisition Financial Outlook, and Agreement to Purchase prana
Q Earnings Conference Call
 Q3 2016 Earnings Conference Call SAFE HARBOR FORWARD-LOOKING STATEMENTS All presentations contain certain forward-looking information within the meaning of the Private Securities Litigation Reform Act
Fiscal 2018 Second Quarter
 Fiscal 2018 Second Quarter If you can read this Click on the icon to choose a Results picture or Reset the slide. To Reset: Right click on the slide thumbnail and select reset slide or choose the Reset
A X A L T A C O A T I N G S Y S T E M S. Q FINANCIAL RESULTS October 27, 2016
 A X A L T A C O A T I N G S Y S T E M S Q3 2016 FINANCIAL RESULTS October 27, 2016 Legal Notices Forward-Looking Statements This presentation and the oral remarks made in connection herewith may contain
DuPont Segment Commentary
 This data should be read in conjunction with the Company s third quarter earnings news release dated October 22, and DuPont s 3Q Earnings Conference Call presentation materials posted on the Investor Center
Third Quarter 2014 Conference Call
 Third Quarter 2014 Conference Call E. Scott Santi, President & CEO Michael M. Larsen, Senior Vice President & CFO John Brooklier, Vice President, Investor Relations Aaron Hoffman, Vice President, Investor
July 28, 2016 Conference Call Slide Presentation HARLEY-DAVIDSON, INC SECOND QUARTER UPDATE
 HARLEY-DAVIDSON, INC. 2016 SECOND QUARTER UPDATE JULY 28, 2016 2016 SECOND QUARTER UPDATE THIS PRESENTATION SUPPORTS THE AUDIO CONFERENCE CALL CONFERENCE CALL PARTICIPANTS Introduction Business Perspectives
Second Quarter Review. 25 / April / 2014
 Second Quarter Review 25 / April / 2014 Forward-Looking Statements / Safe Harbor This presentation contains a number of forward-looking statements. In many cases forward-looking statements are identified
McCormick & Company, Inc. 3rd Quarter 2017 Financial Results and Outlook September 28, 2017
 McCormick & Company, Inc. 3rd Quarter 2017 Financial Results and Outlook September 28, 2017 1 The following slides accompany a September 28, 2017 earnings release conference call. This information should
October 22, 2013 Media Contact: Patty Seif WILMINGTON, Del Investor Contact:
 October 22, 2013 Media Contact: Patty Seif WILMINGTON, Del. 302-774-4482 patricia.r.seif@dupont.com Investor Contact: 302-774-4994 DuPont Delivers 3Q 2013 Operating Earnings of $.45 per Share Sales Increase
Financial Information
 Accelerating & profit in H1: Revenue up +4% reported, Adj. EBITA +8%, Net Income +18%, FCF +15% H1 revenue of 12.2bn, +2.7% organic, +4.1% outside Infrastructure H1 adj. EBITA margin up 60bps 1 org., to
4Q 2017 Highlights and Operating Results
 4Q 2017 Highlights and Operating Results January 30, 2018 1 4Q 2017 Highlights and Operating Results Table of Contents Page(s) 1 Sales Overview 4-8 2 Financial Performance Trends 9-16 3 Leverage Metrics
1Q 2018 Highlights and Operating Results
 1Q 2018 Highlights and Operating Results April 26, 2018 1 Table of Contents Page(s) 4 Announced Agreements to Acquire Australia and New Zealand Security Businesses 5-9 Sales Overview 10-17 Financial Performance
Q Earnings. November 2, 2016
 Q4 2016 Earnings November 2, 2016 Forward-Looking Statements and Non-GAAP Measures Forward-Looking Statements This presentation contains certain forward-looking statements within the meaning of the U.S.
Q Financial Results. October 25, 2018
 Q3 2018 Financial Results October 25, 2018 Legal Notices Forward-Looking Statements This presentation and the oral remarks made in connection herewith may contain forward-looking statements within the
Fourth Quarter 2016 Earnings Release February 2, 2017
 Fourth Quarter 2016 Earnings Release February 2, 2017 Craig Arnold Forward-looking Statements and Non-GAAP Financial Information This presentation or the comments we make on our call today contain forward-looking
McCormick & Company, Inc. 4 th Quarter 2015 Financial Results and Business Outlook January 28, 2016
 McCormick & Company, Inc 4 th Quarter 2015 Financial Results and Business Outlook January 28, 2016 The following slides accompany a January 28, 2016 presentation to investment analysts This information
McCormick & Company, Inc. 4th Quarter 2016 Financial Results and Outlook January 25, 2017
 McCormick & Company, Inc. 4th Quarter 2016 Financial Results and Outlook January 25, 2017 The following slides accompany a January 25, 2017 presentation to investment analysts. This information should
ITT reports 2017 fourth-quarter and full-year results, 2018 guidance
 ITT Inc. 1133 Westchester Ave. White Plains, NY 10604 tel 914 641 2000 Press Release ITT reports 2017 fourth-quarter and full-year results, 2018 guidance 2017 Full-Year Results: Revenue up 8% to $2.6 billion,
Second Quarter 2015 Conference Call
 Second Quarter 2015 Conference Call July 28, 2015 1 Forward Looking and Cautionary Statements Certain statements in this presentation constitute forward looking statements within the meaning of the US
KeyBanc Industrial, Automotive & Transportation Conference May 29, 2014
 KeyBanc Industrial, Automotive & Transportation Conference May 29, 2014 Forward-Looking Statements Certain information contained in this presentation constitutes forward-looking statements for purposes
Fiscal 2012 First Quarter Earnings Call
 Fiscal 2012 First Quarter Earnings Call December 21, 2011 Bob Arzbaecher, Chairman and CEO Mark Goldstein, COO Andy Lampereur, CFO Karen Bauer, Investor Relations Safe Harbor Statements in this presentation
Q Earnings Call. November 5, 2012
 Q4 2012 Earnings Call November 5, 2012 Forward-Looking Statements and Non-GAAP Measures Forward-Looking Statements -- This presentation contains certain forward-looking statements within the meaning of
Carpenter Technology Corporation. 1 st Quarter Fiscal Year 2019 Earnings Call October 24, 2018
 Carpenter Technology Corporation 1 st Quarter Fiscal Year 2019 Earnings Call October 24, 2018 Cautionary Statement Forward-Looking Statements This presentation contains forward-looking statements within
Our results at a glance
 3Report 16 AkzoNobel I Report for the third quarter 2016 2 Our results at a glance Profitability increased in an environment of mixed volume growth Q3: Volume growth in Decorative Paints and Specialty