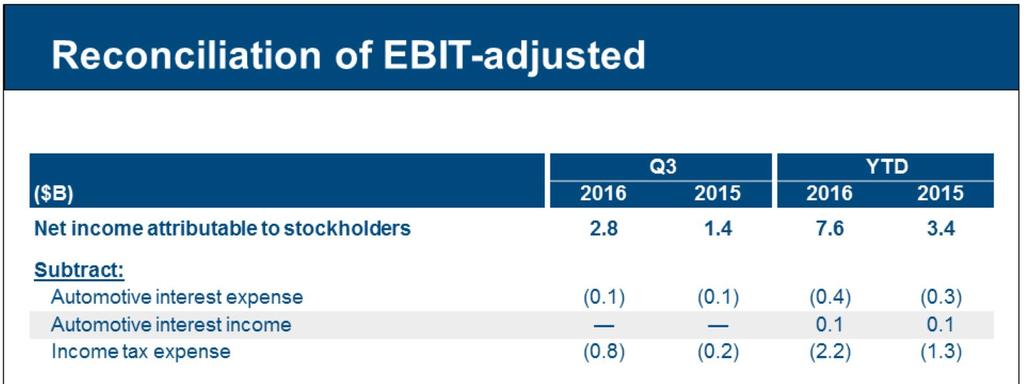
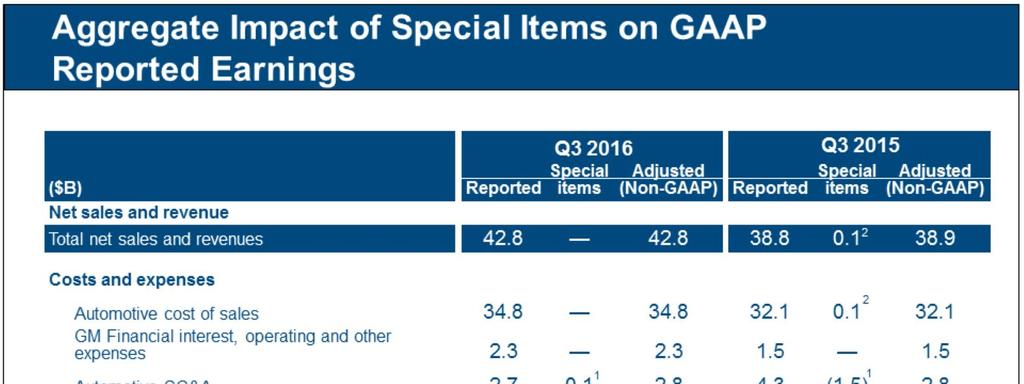
Net income to common stockholders improved $1.4 billion Y-O-Y to a Q3 record of $2.8 billion.
|
|
|
- Dina Booker
- 6 years ago
- Views:
Transcription


1 1
2 2
3 3


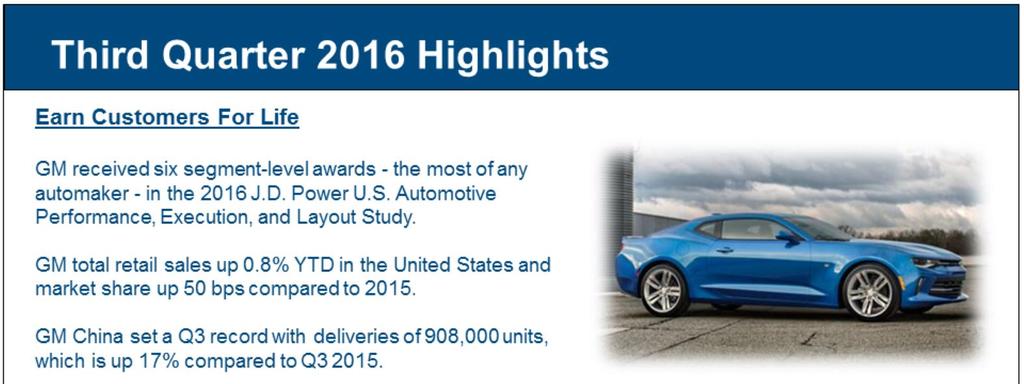
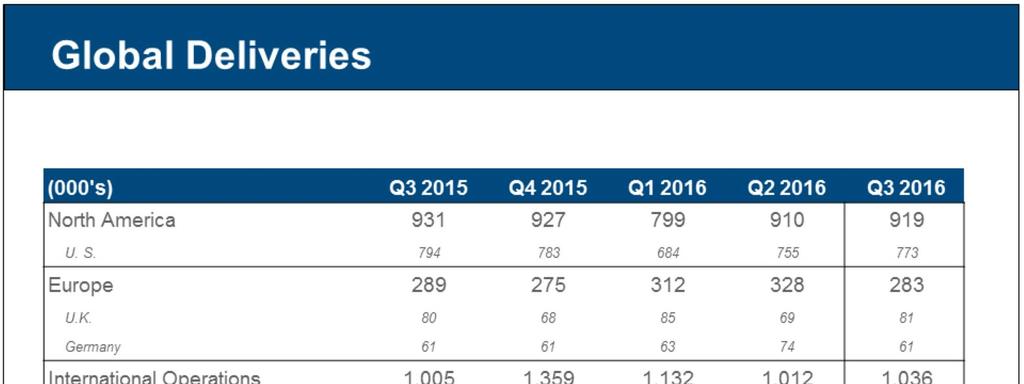
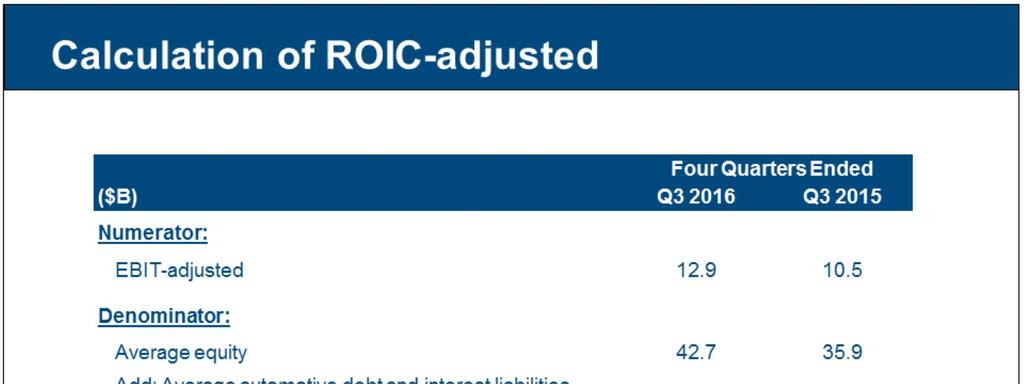
4 Q3 global deliveries up 0.1 million units Y-O-Y, a 4% increase. Volume gains primarily in China, offset by reductions in other International Operations. Q3 market share is down 40 bps Y-O-Y, driven primarily by our strategy to reduce daily rental volumes in the United States and market growth outpacing strong sales momentum in China. Q3 net revenue was a record $42.8 billion, up $4.0 billion Y-O-Y, driven primarily by increased volumes and strong pricing in North America as well as growth at GM Financial, partially offset by FX headwinds. Net income to common stockholders improved $1.4 billion Y-O-Y to a Q3 record of $2.8 billion. Q3 record EPS-diluted of $1.76 per share and Q3 record EPS-diluted-adjusted of $1.72 per share, Y-O-Y increases of $0.92 and $0.22, respectively. Record Q3 EBIT-adjusted of $3.5 billion, up 14 percent and Q3 record EBIT-adjusted margin of 8.3%, up 30 bps Y-O-Y. Adjusted Automotive Free Cash Flow increased $2.7 billion Y-O-Y to $3.5 billion in Q Record return on invested capital-adjusted (ROIC-adjusted) of 30.6%, up 460 bps Y-O-Y. 4
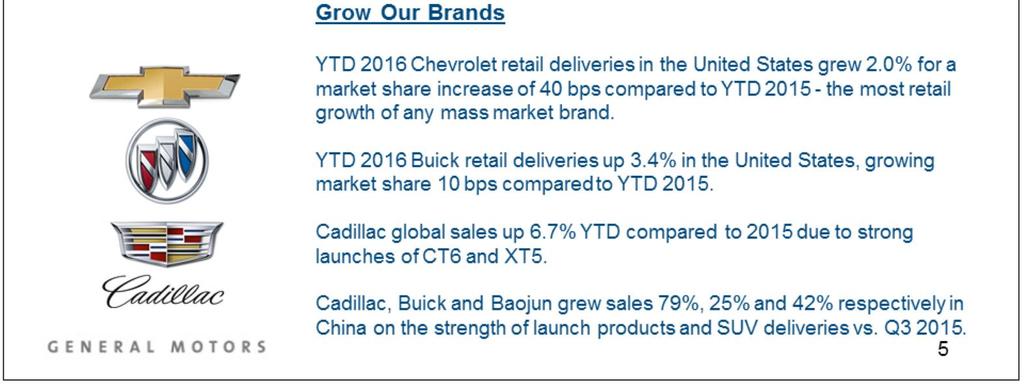
5 5
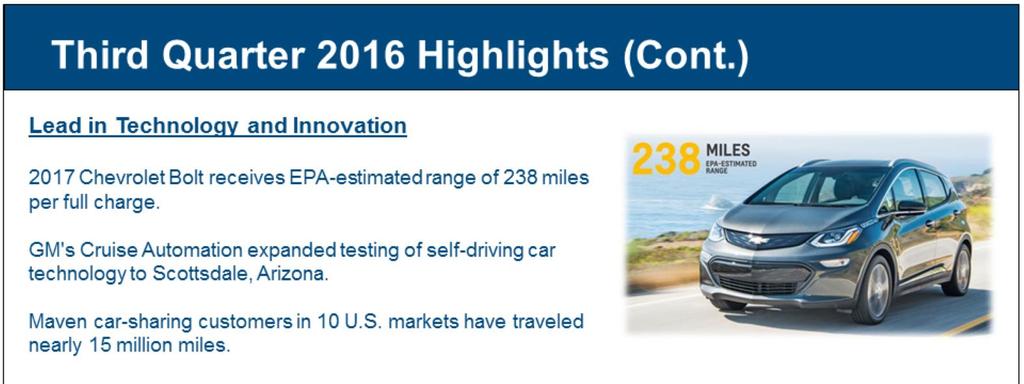
6 6
, partially offset by decreased wholesales in International Operations.")
7 Consolidated net revenue increased $4.0 billion. Key drivers include: Volume - $2.2 billion favorable due to increased wholesales in North America (92,000 units), partially offset by decreased wholesales in International Operations. North American wholesales were driven by strong retail demand for full-size trucks and new launch products such as the Chevrolet Malibu and Cruze. Mix favorable primarily in North America due to full-size trucks, Cadillac CT6, and a decrease in off-lease rental car sales. Price favorable pricing primarily in North America due to strong launch products including the Chevrolet Camaro, Malibu, and Cruze and Cadillac XT5 and strong demand for full-size trucks. GM Financial continued top line growth as GMF expands its portfolio and executes the transition to a full-captive finance company. FX decrease related to foreign currency translation, primarily associated with the British Pound, Mexican Peso and Argentinian Peso. 7


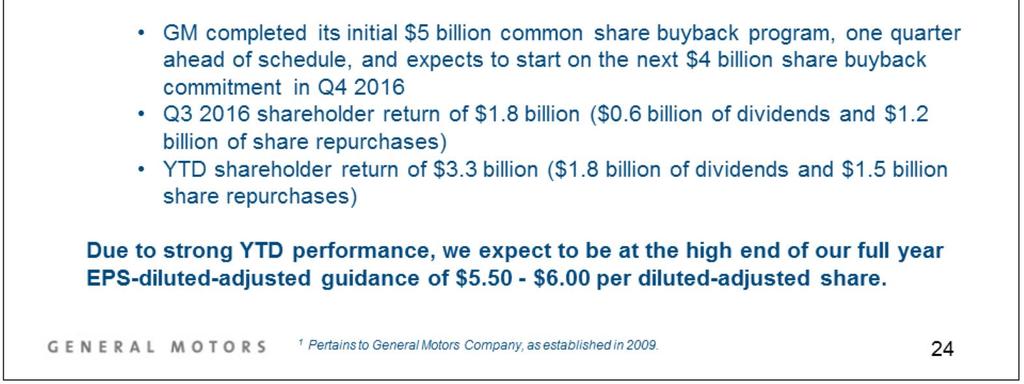
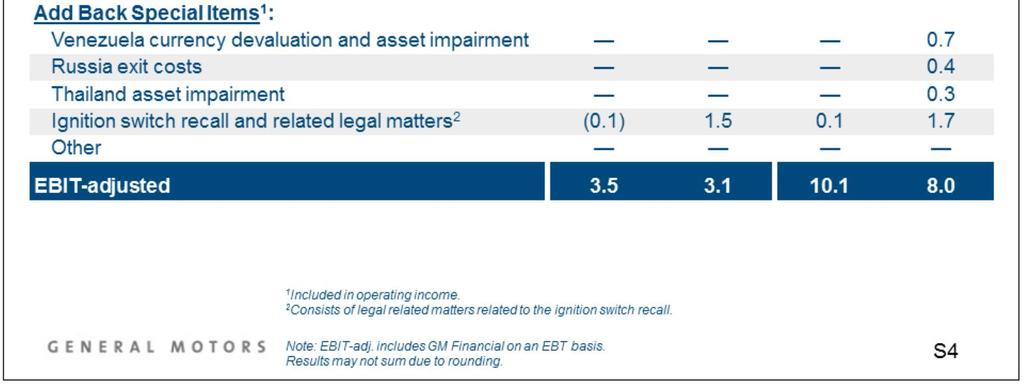
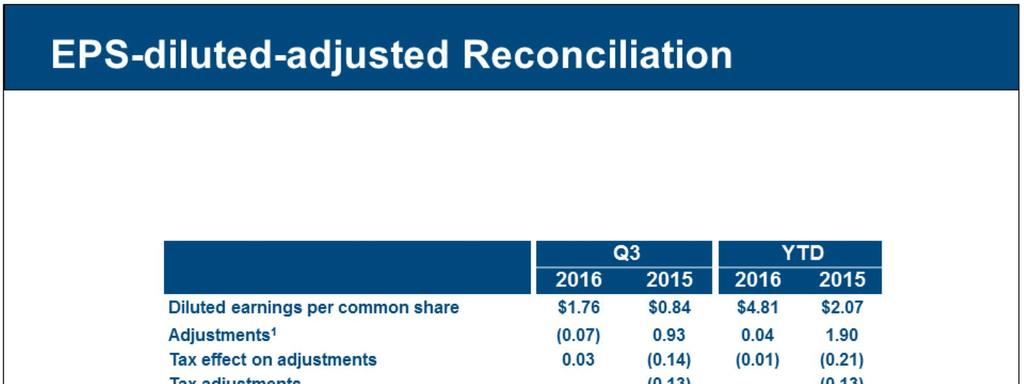
8 EPS-diluted was a Q3 record of $1.76 per share. Special items consisted of a net benefit for legal related matters related to the ignition switch recall had a net after-tax favorable impact on reported Net Income to common stockholders of $0.1 billion or $0.04 per share during Q3. EPS-diluted-adjusted was a Q3 record of $1.72 per share, up 15% Y-O-Y. Q diluted weighted-average share count was 1.57 billion shares down nearly 44 million shares Y-O-Y, reflecting GM s commitment to return capital to shareholders as the company completed the initial $5 billion in share repurchases one quarter ahead of schedule. 8


9 Consolidated EBIT-adjusted improved to a Q3 record $3.5 billion, up $0.4 billion Y-O-Y. Consolidated EBIT-adjusted margin improved to a Q3 record 8.3%, up 30 bps Y-O-Y. Five consecutive record EBIT-adjusted quarters going back to Q Consolidated wholesales for Q3 increased 78,000 units, primarily driven by strong demand in North America, partially offset by International Operations. 9

10 Consolidated EBIT-adjusted increased approximately $0.4 billion Y-O-Y. Key drivers included: Volume favorable impact from increased wholesales in North America driven by strong retail demand for full-size trucks and launch vehicles in passenger car segments. Mix unfavorable primarily in North America due to recently launched passenger cars, partially offset by a decrease in off-lease rental car sales. Price favorable price performance primarily in North and South America. North America price favorable due to successful launch vehicles such as Chevrolet Malibu, Cruze and Camaro and Cadillac XT5 partially offset by normal carryover price decay. Cost unfavorable cost due to material majors of $0.6 billion and incremental fixed costs of $0.2 billion partially offset by carryover material and logistics performance of $0.6 billion. YTD cost is nearly $1 billion favorable excluding material majors. Other unfavorable due primarily to FX associated with key currencies including the British Pound, Mexican Peso and Argentinian Peso. 10

11 Record consolidated Q3 EBIT-adjusted of $3.5 billion with broad-based Y-O-Y improvement, strong results and Q3 record EBIT-adjusted margin of 8.3%. All regions posted flat or improved Y-O-Y EBIT-adjusted performance. GMNA achieved Q3 record EBIT-adjusted of $3.5 billion and has improved YTD EBITadjusted by $1.2 billion Y-O-Y. GME improved Q3 results including the impact of Brexit and is breakeven YTD, an improvement of $0.5 billion Y-O-Y. GMIO performance is flat with difficult macro-economic conditions throughout the region (ex. China). GMSA improved performance by $0.1 billion and has improved its YTD EBIT-adjusted by $0.3 billion Y-O-Y. GMF continues to contribute solid earnings as it expands its asset base. 11

 and significantly below that of domestic competitors. Incentive spending as a % of ATP is expected to moderate in Q4 2016, relative to Q3 2016.")
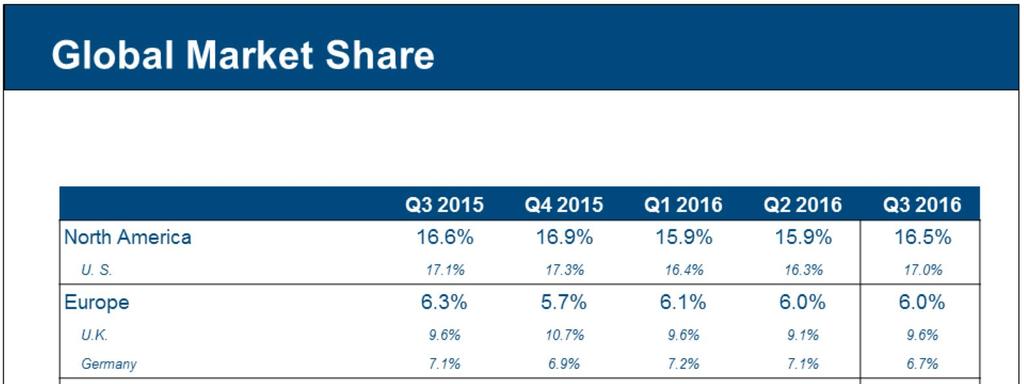
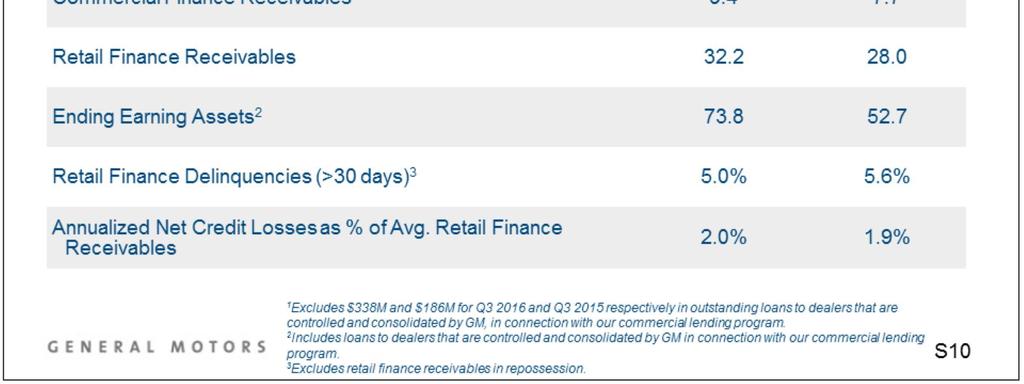
12 Market share in the U.S. was 17.0% during Q3, essentially flat Y-O-Y. Retail market share increased 40 bps in Q based primarily on the successful launches of the Chevrolet Malibu and Cruze. GM s incentive spending as a % of ATP (GM% / Industry%) was near the industry average for Q3 (1.04) and YTD (1.02) and significantly below that of domestic competitors. Incentive spending as a % of ATP is expected to moderate in Q4 2016, relative to Q Q3 average transaction prices across all models and brands are up nearly $1,500 per unit Y-O-Y including the impact of increased incentive spending. 12


13 North America Q3 record EBIT-adjusted grew to $3.5 billion for the quarter, up $0.2 billion Y-O-Y, and EBIT-adjusted margins remained strong at 11.2%, well positioned to meet GM s full-year 2016 target of 10%+ margins. GMNA has averaged EBIT-adjusted margins of 10.6% for the last four quarters and delivered EBIT-adjusted of $12.2 billion during that period. U.S. dealer inventory has increased 111,000 units, improving the availability of recently launched products. GM is well positioned at 79 days supply to meet seasonally strong Q4 demand and expect days supply to fluctuate before moderating at year-end. Wholesales increased 92,000 units, primarily due to strong retail demand for full-size trucks as well as successful new launch vehicles like the Chevrolet Cruze and Malibu. Total market share for North America was essentially flat at 16.5%. However, retail share is up 40 bps for the quarter and 50 bps YTD. This reflects GM s continued focus on retail sales. Daily rental sales in the U.S. are down 95,000 units YTD, in line with plan. 13

14 Drivers of North America EBIT-adjusted improvement include: Volume favorable due to 92,000 unit increase in wholesales. The primary drivers are strong retail demand for full-size trucks and successful launch vehicles such as the Chevrolet Cruze and Malibu. Mix unfavorable primarily due to increased volumes of recently launched vehicles into less profitable passenger car segments, partially offset by a decrease in off-lease rental car sales. Price favorable price due to the all new Chevrolet Malibu, Camaro, and Cruze and Cadillac XT5. Strong price performance on majors expected to continue due to the strong 2016 launch cadence. Carryover price performance is unfavorable, as expected. Cost unfavorable due to incremental material majors cost of $0.4 billion on launch products, as well as fixed costs of $0.6 billion related to incremental engineering, marketing, and depreciation and amortization which include launch costs, partially offset by favorable carryover material and logistics performance of $0.5 billion. Other unfavorable FX primarily due to the weakening of the Mexican Peso. 14
15 GME EBIT-adjusted improved $0.1B Y-O-Y, improving results to breakeven YTD. Top-line revenue is down Y-O-Y primarily due to the impacts of Brexit. Wholesale volume and market share are approximately flat on a Y-O-Y basis, including the impact of GM s exit from the Russian market. GM Europe have made substantial progress towards its plan to break-even by taking advantage of a recovering industry, cost optimization and the benefits of our Astra and Corsa launches resulting in breakeven EBIT-adjusted YTD. However, in June 2016, the U.K. completed its referendum on continued membership in the European Union voting to leave. Despite the referendum, GM Europe was on track to break-even for the year, as evidenced by our performance through the first nine months. The result of the referendum has adversely impacted the British Pound and the uncertainty has put strain on the U.K. automotive industry. If current post-referendum market conditions are sustained through the remainder of 2016, we believe there could be an impact of up to $0.4 billion to the second half of 2016, of which approximately $0.1 billion was reflected in GM s third quarter results. 15
16 Drivers of GME s EBIT-adjusted improvement: Volume total volume is flat while products such as the Opel Astra continue to be very well received in their local markets. Price Flat as favorable pricing on launches was offset by unfavorable carryover pricing. Cost favorable Y-O-Y due to carryover material performance and fixed cost improvement, partially offset by incremental material majors. Other unfavorable due to weakening of the British Pound. 16


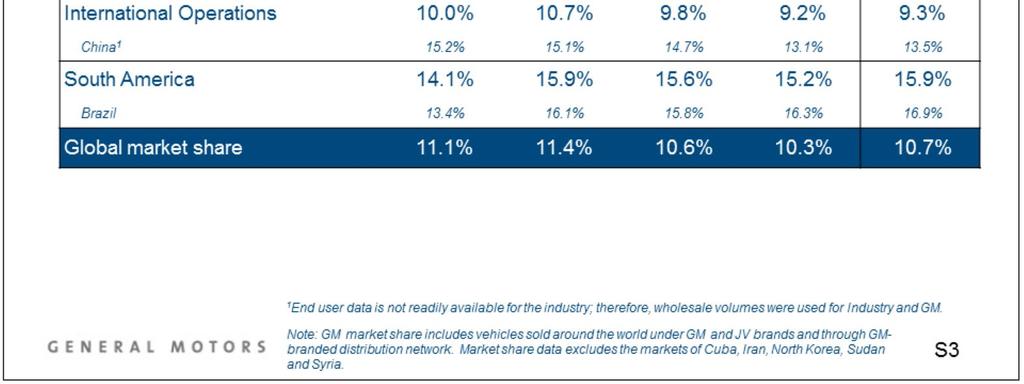
17 GMIO EBIT-adjusted is flat Y-O-Y. China equity income is flat Y-O-Y at $0.5 billion: Retail sales are up 134,000 units due to a strong market and the strength of the Baojun, Buick and Cadillac brands. SUVs and luxury vehicles continue to be strong, offset by weakness in demand for small passenger and mini-commercial vehicles. We expect significant carryover pricing pressure of approximately 5% for the year, partially offset by improved mix due to the launch of the Cadillac CT6 and XT5 and Baojun 560 as well as the continued success of the Buick Envision. These pricing pressures will continue to put pressure on margins. Consolidated international operations results were flat Y-O-Y: Macro-economic difficulties in GM s Middle East Operations continue as a result of low global oil prices. Wholesales volumes were flat Y-O-Y. Economic conditions in GM s Consolidated International Operations are expected to remain difficult. 17

18 Drivers of GMIO s EBIT-adjusted performance: Mix - unfavorable due to selling fewer full-size trucks and SUVs in the Middle East. Cost favorable cost due primarily to material and freight performance as well as continued focus on cost management actions. Other favorable FX due to the Australian Dollar and Korean Won. 18
19 South America remains challenged from macro-economic and political standpoints. EBIT-adjusted improved $0.1 billion due to improved pricing and continued focus on cost. Wholesales were flat Y-O-Y, however, there was growth in the major markets of Brazil and Argentina. Chevrolet was the market share leader in Brazil for the 12 th consecutive month, the first time in Chevrolet s history this has been accomplished. Market share remains strong at 15.9% due to the strength of the Chevrolet brand in South America. This is a 180 bps gain over Q and is primarily due to growing share by 350 bps in Brazil. The aggressive actions taken early in 2015 are paying dividends by moderating losses in a challenging region. YTD EBIT-adjusted has improved $0.3 billion and EBIT-adjusted margin has improved 350 bps. 19
20 Drivers of GMSA s EBIT-adjusted performance: Price favorable impact driven by price increases in Argentina and Brazil. Cost total cost was flat, as unfavorability in majors and material cost performance of $0.1 billion was offset by continued focus on cost management of $0.1 billion. Other unfavorable FX continues to be a headwind for the region while Q impact driven primarily by ARS. 20

21 GMF grew top-line revenue to a record $2.5 billion as it continues to execute on its full captive strategy. EBT-adjusted was relatively flat, in-line with expectations. Credit losses and retail delinquencies remain stable in both the North American and International portfolios. 21


22 Q3 adjusted automotive free cash flow was $3.5 billion, up $2.7 billion Y-O-Y driven by higher earnings, favorable working capital, and lower recall-related cash payments. This improvement is net of $0.5 billion of higher capital expenditures. GM remains on track to deliver approximately $6 billion in adjusted automotive free cash flow for the year. 22
.")
 Adjusted Automotive FCF 5.2 Discretionary Pension Contribution (2.0) Issuance of Debt 2.")
23 Quarter-end available liquidity remains strong at $35.5 billion, up $3 billion from year-end The cash balance of $21.5 billion is in line with our committed average cash balance of approximately $20 billion (YTD average $20.0 billion). GM expects to continue to follow its capital allocation plan, returning available free cash flow to shareholders, through additional share repurchases during Q The change in automotive liquidity compared to year-end 2015 relates to the following: ($B) Adjusted Automotive FCF 5.2 Discretionary Pension Contribution (2.0) Issuance of Debt 2.0 Increase in credit facilities 1.8 Dividends paid (1.8) Share repurchases (1.5) Investment in Lyft (0.5) Cruise Acquisition (0.3) Other Non-Operating 0.1 Y-O-Y Total 3.0 Pension plan funded status as of September 30, 2016 of $17.8 billion does not reflect the headwinds from year-to-date decline in discount rates; the impact of changes in discount rates will not be reflected into the pension plan funded status until the December 31, 2016 annual re-measurement. 23
24 24
25 25


26 26
27 27
28 28
29 29
30 30
31 31
32 32
33 33
34 34
35 35
36 36
37 37
38 38
Q2 operating income of $2.6 billion, down $0.4 billion Y-O-Y. H1 operating income of $5.5 billion, up $0.5 billion Y-O-Y.
 1 2 3 Q2 global deliveries were flat Y-O-Y, driven primarily by the strategic reduction of less profitable daily rental sales in North America offset by increased volumes in GMSA due to the strength of
Strong return on invested capital-adjusted (ROIC-adjusted) of 27.6%, down 430 bps Y-O-Y, but well above our 2017 target of greater than 25%.
 of 27.6%, down 430 bps Y-O-Y, but well above our 2017 target of greater than 25%.") 1 2 3 Q3 global deliveries of 2.2 million units, up 0.1 million Y-O-Y, driven primarily by growth in China and a modest recovery of the market in South America. Q3 global market share is up 20 bps Y-O-Y,
1 2 3 Q3 global deliveries of 2.2 million units, up 0.1 million Y-O-Y, driven primarily by growth in China and a modest recovery of the market in South America. Q3 global market share is up 20 bps Y-O-Y,
Q Results February 6, Chevrolet Silverado
 Q4 2017 Results February 6, 2018 2019 Chevrolet Silverado 1 Important Information Cautionary Note on Forward-Looking Statements: This presentation and related comments by management may include forward-looking
GM Reports Q Net Income of $1.1 Billion Q4 EBIT-adjusted of $2.4 billion, up from $1.9 billion in 2013
 For Release: Wednesday, Feb. 4, 2015, 7:30 a.m. EST GM Reports Q4 2014 Net Income of $1.1 Billion Q4 EBIT-adjusted of $2.4 billion, up from $1.9 billion in 2013 Q4 EPS of $0.66 including net loss from
General Motors Company Q Results
 General Motors Company 2012 Results May 3, 2012 Forward Looking Statements In this presentation and in related comments by our management, our use of the words expect, anticipate, possible, potential,
2017 Cadillac XT5. South America delivered 160,000 vehicles in the quarter, up 18 percent, compared to industry growth of 13 percent.
 SECOND-QUARTER 2017 EARNINGS FROM CONTINUING OPERATIONS GM Reports Net Revenue of $37 Billion and Income of $2.4 Billion from Continuing Operations EPS-diluted of $1.60, down 8 percent; EPS dilutedadjusted
challenging driving environment of San Francisco, and deploying them to transport employees who use a ridehailing app called Cruise Anywhere.
 THIRD-QUARTER 2017 EARNINGS FROM CONTINUING OPERATIONS GM Reports Income of $0.1 Billion and EBITadjusted of $2.5 Billion from Continuing Operations Income from continuing operations impacted by $2.3 billion
PPG Industries, Inc. Fourth Quarter 2018 Financial Results Earnings Brief January 17, 2019
 PPG Industries, Inc. Fourth Quarter 2018 Financial Results Earnings Brief January 17, 2019 Fourth Quarter Financial Highlights PPG fourth quarter net sales from continuing operations were approximately
GM Reports Income of $1.1 Billion and EBIT-adjusted of $2.6 Billion
 FIRST-QUARTER 2018 EARNINGS GM Reports Income of $1.1 Billion and EBIT-adjusted of $2.6 Billion Income from continuing operations impacted by $0.9 billion pre-tax charge related to Korea restructuring.
GM Reports 2017 EPS Diluted of $0.22 and Record EPS Dilutedadjusted
 GM Reports 2017 EPS Diluted of $0.22 and Record EPS Dilutedadjusted of $6.62 FULL-YEAR 2017 RESULTS OVERVIEW EARNINGS FROM CONTINUING OPERATIONS Full-year income of $0.3 billion; EBIT-adj. of $12.8 billion,
PPG Industries, Inc. Second Quarter 2017 Financial Results Earnings Brief July 20, 2017
 PPG Industries, Inc. Second Quarter 2017 Financial Results Earnings Brief July 20, 2017 Second Quarter Financial Highlights Net sales for the second quarter 2017 were $3.8 billion, increasing about 1 percent
PPG Industries, Inc. Fourth 2016 Financial Results Earnings Brief January 19, 2017
 PPG Industries, Inc. Fourth 2016 Financial Results Earnings Brief January 19, 2017 Fourth Quarter Financial Highlights PPG fourth quarter net sales from continuing operations of $3.5 billion were down
Exhibit 1. General Motors Company and Subsidiaries Supplemental Material (Unaudited)
") Exhibit 1 General Motors Company and Subsidiaries The accompanying tables and charts include earnings before interest and taxes adjusted for special items, presented net of noncontrolling interests (EBIT-adjusted),
Exhibit 1 General Motors Company and Subsidiaries The accompanying tables and charts include earnings before interest and taxes adjusted for special items, presented net of noncontrolling interests (EBIT-adjusted),
GM Reports Income of $2.4 Billion and EBIT-adjusted of $3.2 Billion
 SECOND-QUARTER 2018 EARNINGS Reports Income of $2.4 Billion and EBIT-adjusted of $3.2 Billion Profitable in all core operating segments Second consecutive quarter of records for China equity income of
MARY BARRA. Deutsche Bank Global Auto Industry Conference. Chairman and CEO. January 16, 2018
 MARY BARRA Chairman and CEO Deutsche Bank Global Auto Industry Conference January 16, 2018 OUR TRANSFORMATION JOURNEY 2009 2010 2011 2012 2013 2014 2015 2016 2017 2018 2019 2020 2021 2022 2023 Restructuring
PPG Industries, Inc. First 2018 Financial Results Earnings Brief April 19, 2018
 PPG Industries, Inc. First 2018 Financial Results Earnings Brief April 19, 2018 First Quarter Financial Highlights PPG first quarter net sales from continuing operations were approximately $3.8 billion,
PPG Industries, Inc. Third 2016 Financial Results Earnings Brief October 20, 2016
 PPG Industries, Inc. Third 2016 Financial Results Earnings Brief October 20, 2016 Third Quarter 2016 Financial Highlights PPG net sales for the third quarter 2016 were $3.8 billion, up almost 2 percent
PPG Industries, Inc. First Quarter 2019 Financial Results Earnings Brief April 18, 2019
 PPG Industries, Inc. First Quarter 2019 Financial Results Earnings Brief April 18, 2019 First Quarter Financial Highlights PPG first quarter net sales from continuing operations were approximately $3.6
GENERAL MOTORS STRATEGIC AND OPERATIONAL OVERVIEW September 21, 2016
 GENERAL MOTORS STRATEGIC AND OPERATIONAL OVERVIEW September 21, 2016 Forward-Looking Statements In this presentation and in related comments by management, we use words like anticipate, appears, approximately,
GENERAL MOTORS STRATEGIC AND OPERATIONAL OVERVIEW October 28, Cadillac Escala Concept
 GENERAL MOTORS STRATEGIC AND OPERATIONAL OVERVIEW October 28, 2016 Cadillac Escala Concept Forward-Looking Statements In this presentation and in related comments by management, we use words and phrases
PPG Industries, Inc. Second Quarter 2018 Financial Results Earnings Brief July 19, 2018
 PPG Industries, Inc. Second Quarter 2018 Financial Results Earnings Brief July 19, 2018 Second Quarter Financial Highlights PPG second quarter net sales from continuing operations were approximately $4.1
Ford Delivers Third Quarter $1.0B Net Income; $1.7B Adj. EBIT; On Track to Achieve Full-Year Adjusted EPS Guidance in the Range of $1.30 to $1.
 Ford Delivers Third Quarter $1.0B Net Income; $1.7B Adj. EBIT; On Track to Achieve Full-Year Adjusted EPS Guidance in the Range of $1.30 to $1.50 Company revenue up 3 percent in the quarter, driven by
Mondelēz International Q Results. July 27, 2016
 Mondelēz International Q2 2016 Results July 27, 2016 1 Forward-Looking Statements This presentation contains a number of forward-looking statements. Words, and variations of words, such as will, expect,
PPG Industries, Inc. Third Quarter 2015 Financial Results Earnings Brief October 15, 2015
 PPG Industries, Inc. Third Quarter 2015 Financial Results Earnings Brief October 15, 2015 Third Quarter Financial Highlights PPG net sales for the third quarter of 2015 were $3.87 billion versus the prior
GM Reports Another Strong Year of Earnings
 2018 YEAR-END EARNINGS Reports Another Strong Year of Earnings Full-year EPS-diluted of $5.58; EPS-diluted-adj. of $6.54 Income of $8.1 billion includes $2.5 billion in costs primarily related to restructuring
Mattel, Inc. Earnings Conference Call Third Quarter 2016 (Unaudited Results)
") Mattel, Inc. Earnings Conference Call Third Quarter 2016 (Unaudited Results) O C T O B E R 1 9, 2016 C H R I S T O P H E R S I N C L A I R C H I E F E X E C U T I V E O F F I C E R R I C H A R D D I C
Mattel, Inc. Earnings Conference Call Third Quarter 2016 (Unaudited Results) O C T O B E R 1 9, 2016 C H R I S T O P H E R S I N C L A I R C H I E F E X E C U T I V E O F F I C E R R I C H A R D D I C
Q Results. October 29, 2018
 Q3 2018 Results October 29, 2018 Forwardlooking Statements This presentation contains a number of forwardlooking statements. Words, and variations of words, such as will, expect, may, should, believe,
Q Earnings. October 31, 2018
 Q4 2018 Earnings October 31, 2018 Forward-Looking Statements and Non-GAAP Financial Measures Forward-Looking Statements This presentation contains certain forward-looking statements within the meaning
Wholesales (000) 1,545 1,493 (52) 4,720 4, Revenue (Bils.) $ 35.8 $ 34.9 $ (0.9) $ $ $ (1.1)
 1,545 1,493 (52) 4,720 4, Revenue (Bils.) $ 35.8 $ 34.9 $ (0.9) $ $ $ (1.1)") Ford Posts Third Quarter 2014 Pre-Tax Profit of $1.2 Billion*; Net Income of $835 Million; Global Product Launches on Track, Including F-150 Third quarter pre-tax profit of $1.2 billion, a decrease of
Ford Posts Third Quarter 2014 Pre-Tax Profit of $1.2 Billion*; Net Income of $835 Million; Global Product Launches on Track, Including F-150 Third quarter pre-tax profit of $1.2 billion, a decrease of
Q Earnings. July 20, 2016
 Q3 2016 Earnings July 20, 2016 Forward-Looking Statements and Non-GAAP Measures Forward-Looking Statements This presentation contains certain forward-looking statements within the meaning of the U.S. Private
Lincoln Electric Holdings, Inc. 1Q 2013 Financial Results Conference Call April 23, 2013
 Lincoln Electric Holdings, Inc. 1Q 2013 Financial Results Conference Call April 23, 2013 1 Safe Harbor & Reg-G Forward-Looking Statements: Statements made during this presentation which are not historical
Exhibit 1. General Motors Company and Subsidiaries Supplemental Material (Unaudited)
") Exhibit 1 The accompanying tables and charts include earnings before interest and taxes adjusted for special items, presented net of noncontrolling interests (EBIT-adjusted) and adjusted free cash flow.
Exhibit 1 The accompanying tables and charts include earnings before interest and taxes adjusted for special items, presented net of noncontrolling interests (EBIT-adjusted) and adjusted free cash flow.
Fourth Quarter 2018 Financial Results
 Fourth Quarter 2018 Financial Results Michael H. McGarry, Chairman and Chief Executive Officer Vincent J. Morales, Senior Vice President and Chief Financial Officer John Bruno, Director, Investor Relations
PPG Industries, Inc. Second 2016 Financial Results Earnings Brief July 21, 2016
 PPG Industries, Inc. Second 2016 Financial Results Earnings Brief July 21, 2016 Second Quarter 2016 Financial Highlights PPG net sales for the second quarter 2016 were $4.1 billion, down less than one
PPG Industries, Inc. Fourth 2017 Financial Results Earnings Brief January 18, 2018
 PPG Industries, Inc. Fourth 2017 Financial Results Earnings Brief January 18, 2018 Fourth Quarter Financial Highlights PPG fourth quarter net sales from continuing operations were approximately $3.7 billion,
Q Earnings. July 26, 2017
 Q3 2017 Earnings July 26, 2017 Forward-Looking Statements and Non-GAAP Measures Forward-Looking Statements This presentation contains certain forward-looking statements within the meaning of the U.S. Private
PPG Industries, Inc. Second Quarter 2015 Financial Results Earnings Brief July 16, 2015
 PPG Industries, Inc. Second Quarter 2015 Financial Results Earnings Brief July 16, 2015 Second Quarter Financial Highlights PPG net sales for the second quarter 2015 increased to $4.10 billion versus the
XYLEM INC. Q EARNINGS RELEASE OCTOBER 30, 2018
 XYLEM INC. Q3 2018 EARNINGS RELEASE OCTOBER 30, 2018 Q3 2018 EARNINGS RELEASE FORWARD-LOOKING STATEMENTS This presentation contains information that may constitute forward-looking statements. within the
Third Quarter 2017 Earnings Results
 POLARIS INDUSTRIES INC. Third Quarter 2017 Earnings Results October 24, 2017 SAFE HARBOR & NON-GAAP MEASURES Except for historical information contained herein, the matters set forth in this presentation,
Q Earnings. October 28, 2015
 Q4 2015 Earnings October 28, 2015 Forward-Looking Statements and Non-GAAP Measures Forward-Looking Statements This presentation contains certain forward-looking statements within the meaning of the U.S.
1 st Quarter 2016 Earnings Presentation. April 21, 2016
 1 st Quarter 2016 Earnings Presentation April 21, 2016 Safe Harbor Statement This presentation contains several forward-looking statements. Forward-looking statements are those that use words such as believe,
Mattel, Inc. Earnings Conference Call Fourth Quarter 2016 (Unaudited Results)
") Mattel, Inc. Earnings Conference Call Fourth Quarter 2016 (Unaudited Results) J A N U A R Y 2 5, 2 0 1 7 C H R I S T O P H E R S I N C L A I R C H I E F E X E C U T I V E O F F I C E R R I C H A R D D
Mattel, Inc. Earnings Conference Call Fourth Quarter 2016 (Unaudited Results) J A N U A R Y 2 5, 2 0 1 7 C H R I S T O P H E R S I N C L A I R C H I E F E X E C U T I V E O F F I C E R R I C H A R D D
Third Quarter Earnings Conference Call
 Third Quarter Earnings Conference Call October 26, 2018 NYSE: TEN 1 Safe Harbor Forward-Looking Statements This communication contains forward-looking statements. These forward-looking statements include,
Q Earnings. April 20, 2016
 Q2 2016 Earnings April 20, 2016 Forward-Looking Statements and Non-GAAP Measures Forward-Looking Statements This presentation contains certain forward-looking statements within the meaning of the U.S.
Fourth Quarter 2017 Earnings Call. February 16, 2018
 Fourth Quarter 2017 Earnings Call February 16, 2018 Forward-Looking Statements This supplemental information contains forward-looking statements within the meaning of the Private Securities Litigation
FIRST QUARTER Earnings Conference Call April 26, 2016
 FIRST QUARTER 2016 Earnings Conference Call April 26, 2016 Agenda Highlights and Strategic Overview Segment Results Financial Overview Outlook Gregg Sherrill Chairman & CEO Brian Kesseler Chief Operating
ITT reports 2017 fourth-quarter and full-year results, 2018 guidance
 ITT Inc. 1133 Westchester Ave. White Plains, NY 10604 tel 914 641 2000 Press Release ITT reports 2017 fourth-quarter and full-year results, 2018 guidance 2017 Full-Year Results: Revenue up 8% to $2.6 billion,
Nine months to September 30
 FCA third-quarter revenues up 14% to 23.6 billion and EBIT up 7% at 0.9 billion. Net industrial debt at 11.4 billion reflecting seasonality and liquidity stable at 21.7 billion. Full-year guidance confirmed.
Superior Industries International
 NYSE: SUP Year End 2013 Earnings Conference Call March 7 th, 2014 Superior Industries International Forward-Looking Statements Any forward-looking statements made in this webcast or contained in this presentation
July 28, 2016 Conference Call Slide Presentation HARLEY-DAVIDSON, INC SECOND QUARTER UPDATE
 HARLEY-DAVIDSON, INC. 2016 SECOND QUARTER UPDATE JULY 28, 2016 2016 SECOND QUARTER UPDATE THIS PRESENTATION SUPPORTS THE AUDIO CONFERENCE CALL CONFERENCE CALL PARTICIPANTS Introduction Business Perspectives
Q Earnings. November 2, 2016
 Q4 2016 Earnings November 2, 2016 Forward-Looking Statements and Non-GAAP Measures Forward-Looking Statements This presentation contains certain forward-looking statements within the meaning of the U.S.
Q Results presentation
 Results presentation Summary Good sales development across all business areas Lower seasonal operating loss Improvements for Americas and Europe & Asia/Pacific Stable for Construction Continued improvement
Ally Financial Reports First Quarter 2015 Financial Results
 Ally Financial Reports First Quarter 2015 Financial Results First quarter net income of $576 million, compared to $227 million in the first quarter of 2014 First quarter earnings per diluted common share
Q Earnings. April 26, 2017
 Q2 2017 Earnings April 26, 2017 Forward-Looking Statements and Non-GAAP Measures Forward-Looking Statements This presentation contains certain forward-looking statements within the meaning of the U.S.
Second-Quarter 2009 Earnings Presentation
 Second-Quarter 2009 Earnings Presentation Ursula Burns Chief Executive Officer Larry Zimmerman Vice Chairman & CFO July 23, 2009 Forward-Looking Statements This presentation contains "forward-looking statements"
Third Quarter 2018 Results October 30, 2018
 Third Quarter 2018 Results October 30, 2018 This document, and in particular the section entitled 2018 guidance, contains forward-looking statements. In particular, these forward-looking statements include
First Quarter 2015 Earnings Review
 Citi Investor Relations First Quarter 2015 Earnings Review April 16, 2015 Overview First quarter results provide a solid start to 2015 Modest revenue growth and positive operating leverage in Citicorp
Agenda Challenging Year, Great Learnings A Glimpse into 2009 Global Auto Industry GM -- What s s Next
 Agenda 2008 -- Challenging Year, Great Learnings A Glimpse into 2009 Global Auto Industry GM -- What s s Next U.S. Housing Statistics Source: Census Bureau / Haver Analytics Source: National Association
Second Quarter 2016 Earnings Results
 POLARIS INDUSTRIES INC. Second Quarter 2016 Earnings Results July 20, 2016 SAFE HARBOR Except for historical information contained herein, the matters set forth in this document, including but not limited
ACTUANT REPORTS THIRD QUARTER RESULTS; UPDATES FISCAL 2018 GUIDANCE
 For Immediate Release N86 W12500 Westbrook Crossing Menomonee Falls, WI 53051 Contact: Karen Bauer Communications & Investor Relations Leader 262-293-1562 ACTUANT REPORTS THIRD QUARTER RESULTS; UPDATES
First Quarter 2016 Business Update. April 28, 2016
 First Quarter 2016 Business Update April 28, 2016 First Quarter 2016 Highlights Net Sales $ in millions, except EPS Adjusted Operating Income* (Adjusted Operating Margin) Adjusted EPS* +6% +8% +8% $684.8
Mondelēz International 2013 Results. February 12, 2014
 Mondelēz International 2013 Results February 12, 2014 1 Forward-looking statements This slide presentation contains a number of forward-looking statements. Words, and variations of words, such as will,
Watts Water Technologies 3Q 2017 Earnings Conference Call November 2, 2017
 Watts Water Technologies 3Q 2017 Earnings Conference Call November 2, 2017 2017 Watts Water Technologies, Inc. Forward Looking Statements Certain statements in this presentation constitute forward-looking
Q Earnings Call. April 24, 2013
 Q2 2013 Earnings Call April 24, 2013 Forward-Looking Statements and Non-GAAP Measures Forward-Looking Statements -- This presentation contains certain forward-looking statements within the meaning of the
GLOBAL OVERVIEW. Marc Bitzer. President and Chief Executive Officer
 Third-Quarter Second-Quarter 2018 2018 Earnings Review GLOBAL OVERVIEW Marc Bitzer President and Chief Executive Officer 2 2018 THIRD-QUARTER HIGHLIGHTS All-time record ongoing EPS of $4.55 and EBIT margin
2016 THIRD-QUARTER EARNINGS REVIEW October 25, 2016
 2016 THIRD-QUARTER EARNINGS REVIEW October 25, 2016 0 THIRD-QUARTER EARNINGS PRESENTATION WHIRLPOOL CORPORATION ADDITIONAL INFORMATION This presentation contains forward-looking statements about Whirlpool
Fourth Quarter 2017 Earnings & 2018 Forecast Conference Call
 Fourth Quarter 2017 Earnings & 2018 Forecast Conference Call February 16, 2018 2015 Ryder System, Inc. Safe Harbor and Non-GAAP Financial Measures Note Regarding Forward Looking Statements: Certain statements
Third Quarter 2018 Earnings Call
 Third Quarter 2018 Earnings Call October 25, 2018 Nick Zarcone President & Chief Executive Officer Varun Laroyia Executive Vice President & Chief Financial Officer Joe Boutross Vice President, Investor
First Quarter 2018 Earnings Results
 POLARIS INDUSTRIES INC. First Quarter 2018 Earnings Results April 24, 2018 SAFE HARBOR & NON-GAAP MEASURES Except for historical information contained herein, the matters set forth in this presentation,
4Q 2018 And Full Year Earnings Review And 2019 Outlook. January 23, 2019 (Preliminary Results)
") 4Q 2018 And Full Year Earnings Review And 2019 Outlook January 23, 2019 (Preliminary Results) Creating Tomorrow, Together Our Belief Our Aspiration Our Plan for Value Creation Winning Portfolio Freedom
4Q 2018 And Full Year Earnings Review And 2019 Outlook January 23, 2019 (Preliminary Results) Creating Tomorrow, Together Our Belief Our Aspiration Our Plan for Value Creation Winning Portfolio Freedom
Q Earnings. January 24, 2018
 Q1 2018 Earnings January 24, 2018 Forward-Looking Statements and Non-GAAP Measures Forward-Looking Statements This presentation contains certain forward-looking statements within the meaning of the U.S.
2 nd Quarter 2017 Earnings Presentation. July 25, 2017
 2 nd Quarter 2017 Earnings Presentation July 25, 2017 Safe Harbor Statement This presentation contains several forward-looking statements. Forward-looking statements are those that use words such as believe,
Q Earnings. November 1, 2017
 Q4 2017 Earnings November 1, 2017 Forward-Looking Statements and Non-GAAP Measures Forward-Looking Statements This presentation contains certain forward-looking statements within the meaning of the U.S.
MAGNA INTERNATIONAL INC. Management's Discussion and Analysis of Results of Operations and Financial Position
 MAGNA INTERNATIONAL INC. Management's Discussion and Analysis of Results of Operations and Financial Position Unless otherwise noted, all amounts in this Management's Discussion and Analysis of Results
Q Earnings. April 25, 2018
 Q2 2018 Earnings April 25, 2018 Forward-Looking Statements and Non-GAAP Measures Forward-Looking Statements This presentation contains certain forward-looking statements within the meaning of the U.S.
Third Quarter 2017 Results. October 24, 2017
 Third Quarter 2017 Results October 24, 2017 This document, and in particular the section entitled 2017 guidance confirmed, contains forward-looking statements. These statements may include terms such as
Fourth Quarter 2017 Conference Call. February 8, 2018
 Fourth Quarter 2017 Conference Call February 8, 2018 Forward-Looking Statements Certain information contained in this presentation constitutes forward-looking statements for purposes of the safe harbor
FY 2017 Third Quarter Earnings Call
 FY 2017 Third Quarter Earnings Call July 27, 2017 Improving the experience of a world in motion Forward Looking Statement Adient has made statements in this document that are forward-looking and, therefore,
A X A L T A C O A T I N G S Y S T E M S. Q FINANCIAL RESULTS October 27, 2016
 A X A L T A C O A T I N G S Y S T E M S Q3 2016 FINANCIAL RESULTS October 27, 2016 Legal Notices Forward-Looking Statements This presentation and the oral remarks made in connection herewith may contain
FOURTH QUARTER AND FULL YEAR Earnings Conference Call February 9, 2016
 FOURTH QUARTER AND FULL YEAR 2015 Earnings Conference Call February 9, 2016 Agenda Highlights and Strategic Overview Segment Results Financial Overview Outlook Gregg Sherrill Chairman & CEO Brian Kesseler
BORGWARNER REPORTS SECOND QUARTER 2017 U.S. GAAP NET EARNINGS OF $1.00 PER DILUTED SHARE, OR $0.96 PER DILUTED SHARE EXCLUDING NON-COMPARABLE ITEMS
 Immediate Release Contact: Patrick Nolan 248.754.0884 BORGWARNER REPORTS SECOND QUARTER 2017 U.S. GAAP NET EARNINGS OF $1.00 PER DILUTED SHARE, OR $0.96 PER DILUTED SHARE EXCLUDING NON-COMPARABLE ITEMS
Ford Motor Company Reports Fourth Quarter and Full Year 2018 Results
 Ford Motor Company Reports Fourth Quarter and Full Year 2018 Results Revenue up in the fourth quarter and full year; net income, adjusted EBIT and margin lower North America EBIT margin of 7.6% in the
News. PPG reports fourth quarter and full-year 2018 financial results
 News PPG Media Contact: Mark Silvey Corporate Communications +1-412-434-3046 silvey@ppg.com PPG Investor Contact: John Bruno Investor Relations +1-412-434-3466 jbruno@ppg.com investor.ppg.com PPG reports
First Quarter 2019 Financial Results
 First Quarter 2019 Financial Results Michael H. McGarry, Chairman and Chief Executive Officer Vincent J. Morales, Senior Vice President and Chief Financial Officer John Bruno, Director, Investor Relations
4Q 2016 Earnings Call February 28, :30am ET
 2016 Earnings Call February 28, 2017 8:30am ET 1 Safe Harbor Statement Certain statements made within this presentation contain forward-looking statements, within the meaning of the Private Securities
Exhibit 1. General Motors Company and Subsidiaries Supplemental Material. (Unaudited)
") Exhibit 1 General Motors Company and Subsidiaries The accompanying tables and charts for securities analysts include earnings before interest and taxes (EBIT), adjusted EBIT and free cash flow which are
Exhibit 1 General Motors Company and Subsidiaries The accompanying tables and charts for securities analysts include earnings before interest and taxes (EBIT), adjusted EBIT and free cash flow which are
Watts Water Technologies 1Q 2016 Earnings Conference Call May 5, 2016
 Watts Water Technologies 1Q 2016 Earnings Conference Call May 5, 2016 2016 Watts Water Technologies Forward Looking Statements Certain statements in this presentation constitute forward-looking statements
Watts Water Technologies 2Q 2018 Earnings Conference Call August 2, 2018
 Watts Water Technologies 2Q 2018 Earnings Conference Call August 2, 2018 2018 Watts Water Technologies, Inc. Forward Looking Statements Certain statements in this presentation constitute forward-looking
Brunswick Earnings Conference Call Q3, 2018
 Brunswick Earnings Conference Call Q3, 2018 Forward-Looking Statements Certain statements in this presentation are forward-looking as defined in the Private Securities Litigation Reform Act of 1995. Forward-looking
Financial Analysis Report GENERAL MOTORS
 Financial Analysis Report GENERAL MOTORS This study was conducted by Shant ATAMIAN Hani OBEID (ESCP/ESA EMBA-20) Fahmi Ben Abdelkader Financial Statement Analysis Outline Strategic and Economic Assesement
FIAT CHRYSLER AUTOMOBILES - Financial Results Three months ended March 31
 FCA posts record First Quarter Results with Adjusted EBIT nearly doubled to 1.4 billion, and all segments profitable. Adjusted Net Profit reached 0.5 billion. Full year guidance is confirmed. Worldwide
Stock Symbol: TSX CCL.A and CCL.B. CCL Industries Reports a 25% Increase in Third Quarter 2012 Net Earnings and Declares Dividend Results Summary
 CCL Industries Inc. 105 Gordon Baker Road, Suite 500, Toronto, Ontario M2H 3P8 Telephone: (416) 756-8500 Fax: (416) 756-8555 News Release Stock Symbol: TSX CCL.A and CCL.B For Immediate Release Tuesday,
Third Quarter 2014 Earnings Review
 Citi Investor Relations On October 30, 2014, Citi announced that it was adjusting downward its third quarter 2014 financial results, from those reported on October 14, 2014, due to a $600 million (pretax
Q Results October 25, 2016
 Q3 2016 Results October 25, 2016 Safe Harbor Statement This document, and in particular the section entitled 2016 guidance revised upwards, contains forward-looking statements. These statements may include
Q Earnings. January 23, 2019
 Q1 2019 Earnings January 23, 2019 Forward-Looking Statements and Non-GAAP Financial Measures Forward-Looking Statements This presentation contains certain forward-looking statements within the meaning
First Quarter 2016 Earnings. April 18, 2016
 First Quarter 2016 Earnings April 18, 2016 Safe Harbor FORWARD-LOOKING STATEMENTS: This presentation contains forward-looking statements concerning management's expectations, goals, objectives and similar
Fourth-Quarter 2018 Results. January 30, 2019
 Fourth-Quarter 2018 Results January 30, 2019 Safe Harbor This presentation includes forward-looking statements which are statements that are not historical facts, including statements that relate to the
2017 First Quarter Business Review
 2017 First Quarter Business Review (Unaudited) April 25, 2017 1 Earnings Conference Calls Q2: July 25, 2017 Q3: October 24, 2017 2018 Outlook Meeting December 12, 2017 2 Upcoming 2017 investor events European
market share gains in key categories, according to Nielsen and The NPD Group. equipped with the tools to serve customers
 Walmart U.S. Q3 comp sales grew 3.4% and Walmart U.S. ecommerce sales grew 43%, Q3 GAAP EPS of 0.58; Adjusted EPS2 of.08, Walmart now expects FY'9 GAAP EPS of 2.26 to 2.36, Walmart raises guidance for
HUGO BOSS First Nine Months Results 2011
 HUGO BOSS First Nine Months Results 2011 Mark Langer (CFO) November 2, 2011 Conference Call, First Nine Months Results 2011 HUGO BOSS November 2, 2011 2 / 30 AGENDA OPERATIONAL HIGHLIGHTS FIRST NINE MONTHS