Q2 operating income of $2.6 billion, down $0.4 billion Y-O-Y. H1 operating income of $5.5 billion, up $0.5 billion Y-O-Y.
|
|
|
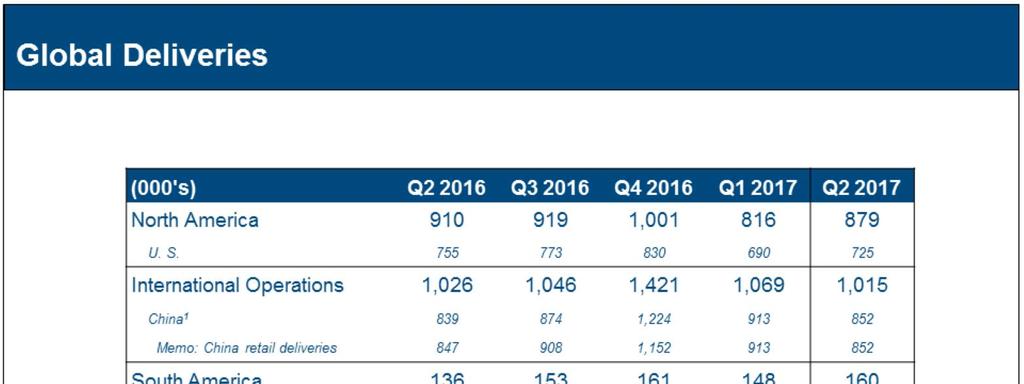
- Gordon Marsh
- 6 years ago
- Views:
Transcription

1 1
2 2
3 3


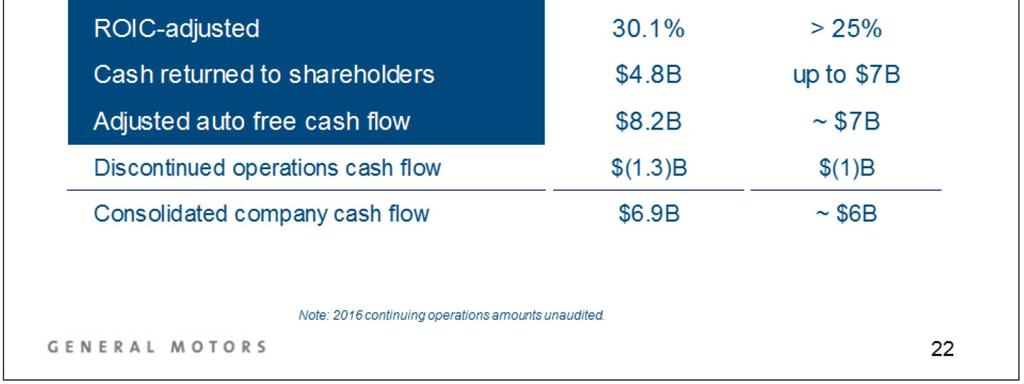
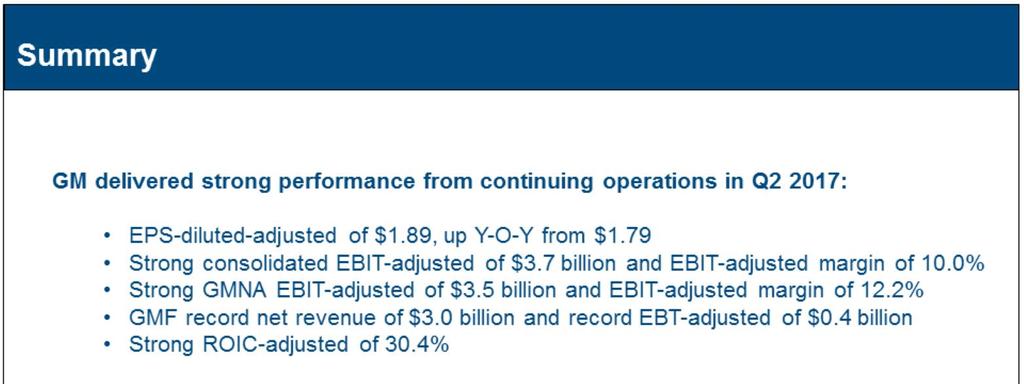
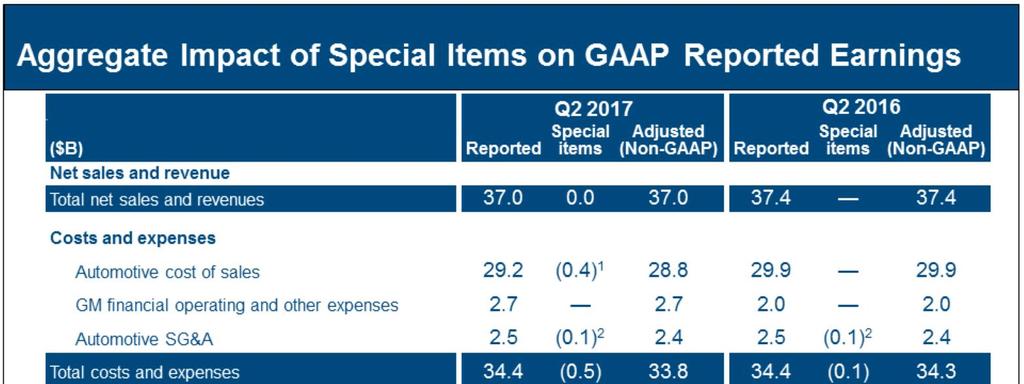
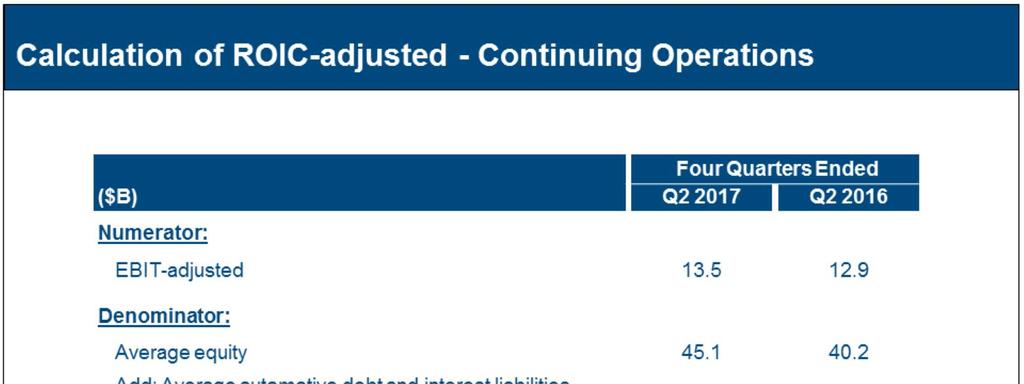
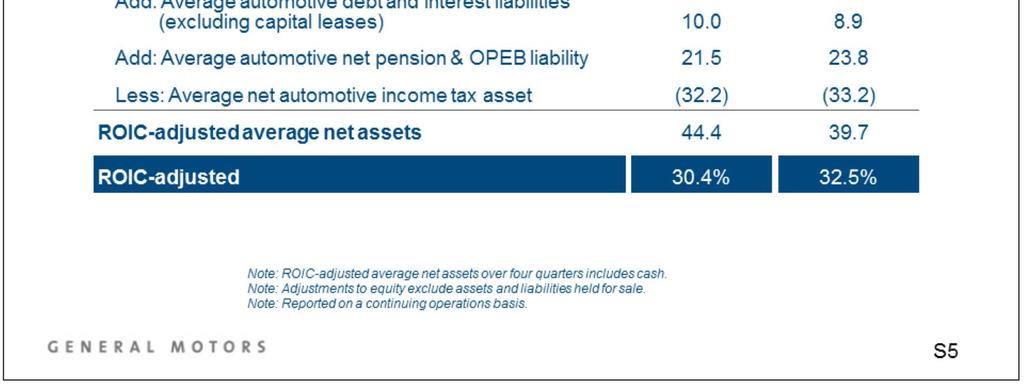
4 Q2 global deliveries were flat Y-O-Y, driven primarily by the strategic reduction of less profitable daily rental sales in North America offset by increased volumes in GMSA due to the strength of the Chevrolet brand. Q2 market share is flat Y-O-Y, driven primarily by our strategy to reduce volumes into the daily-rental channel in GMNA offset by increased share in GMSA. Q2 net revenue was $37.0 billion, down $0.4 billion Y-O-Y, driven primarily by decreased wholesale volumes in North America partially offset by strong mix and continued growth of GM Financial. H1 net revenue of $74.3 billion, up $3.9 Y-O-Y billion due primarily to strong mix, and growth at GM Financial, partially offset by reduced wholesale volumes. Q2 operating income of $2.6 billion, down $0.4 billion Y-O-Y. H1 operating income of $5.5 billion, up $0.5 billion Y-O-Y. Q2 EPS-diluted of $1.60 per share, down $0.14 and EPS-diluted-adjusted of $1.89 per share, up $0.10. H1 EPS-diluted of $3.35 per share, up $0.37 Y-O-Y and EPS-diluted-adjusted of $3.64 per share, up $0.59 Y-O-Y. Strong Q2 EBIT-adjusted of $3.7 billion, down $0.2 billion primarily due to lower volumes in North America, partially offset by strong mix and improved cost. Record H1 EBIT-adjusted of $7.2 billion, up $0.6 billion Y-O-Y, due primarily to strong pricing and cost performance in North America. Q2 adjusted automotive free cash flow of $2.6 billion down $0.7 billion primarily due to higher capital expenditures of $0.4 billion and a decrease of $0.3 billion in automotive net income. H1 adjusted automotive free cash flow of $2.0 billion up $0.3 billion Y-O-Y primarily due to an increase of $0.4 billion automotive net income. Return on invested capital-adjusted (ROIC-adjusted) of 30.4%, down 210 bps Y-O-Y, well above our 2017 target of 25%. 4
5 5
6 6
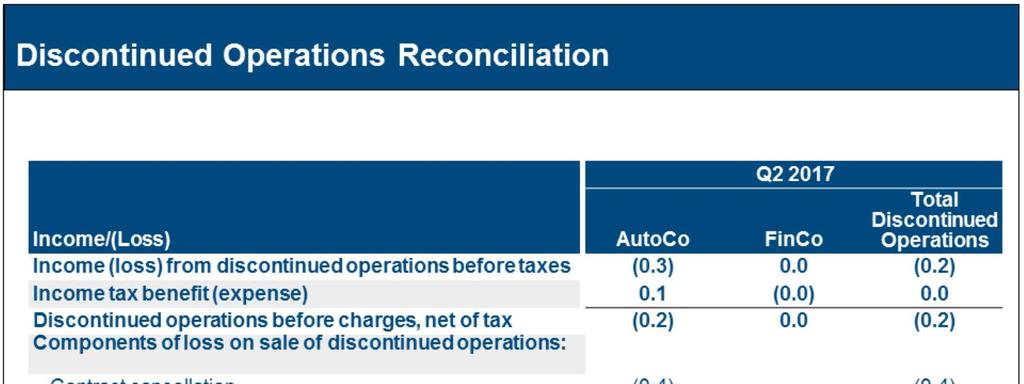
 related to the strategic decision to rationalized our core operations by exiting or significantly reducing our presence in various international markets to focus our resources")

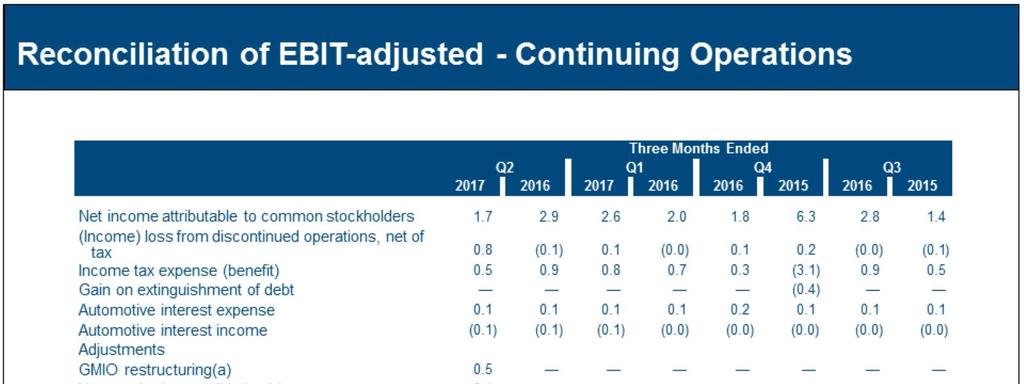
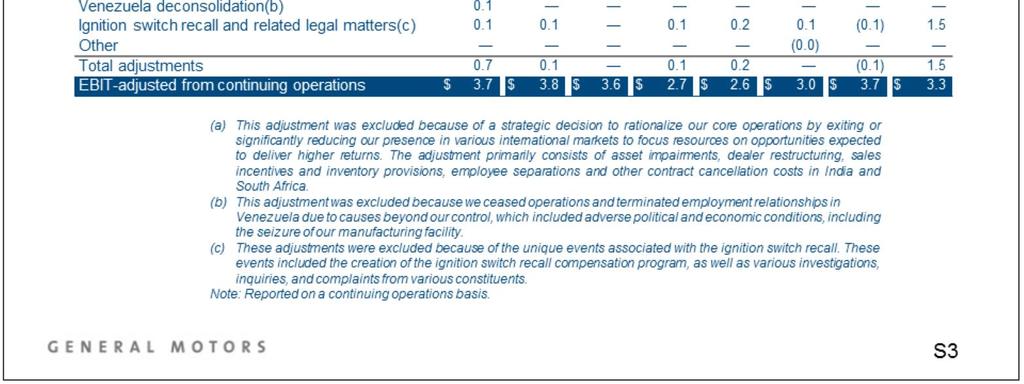
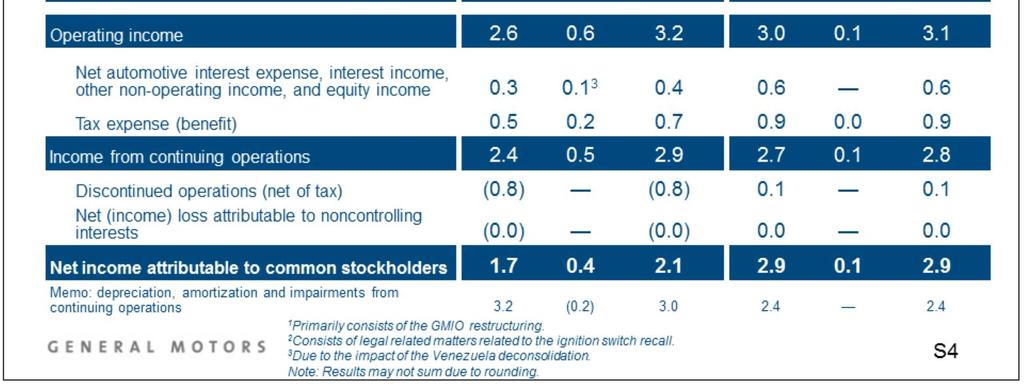
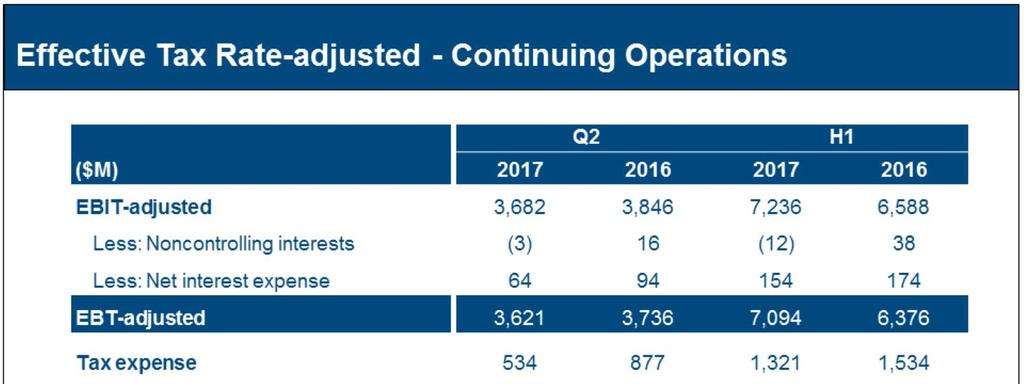
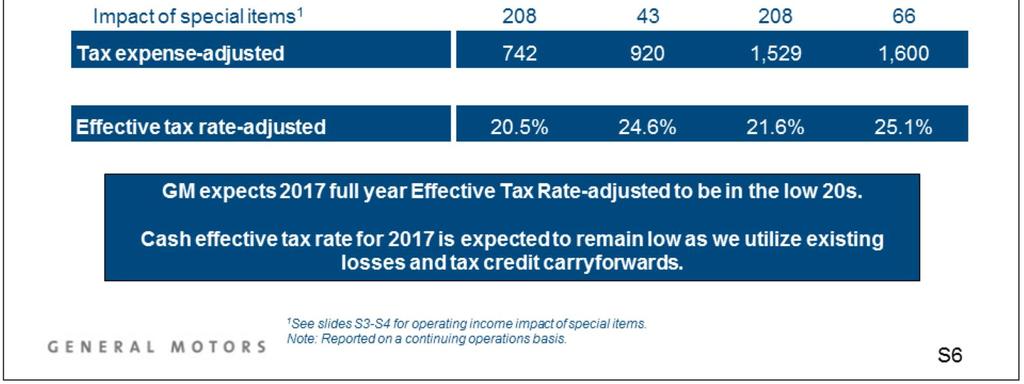
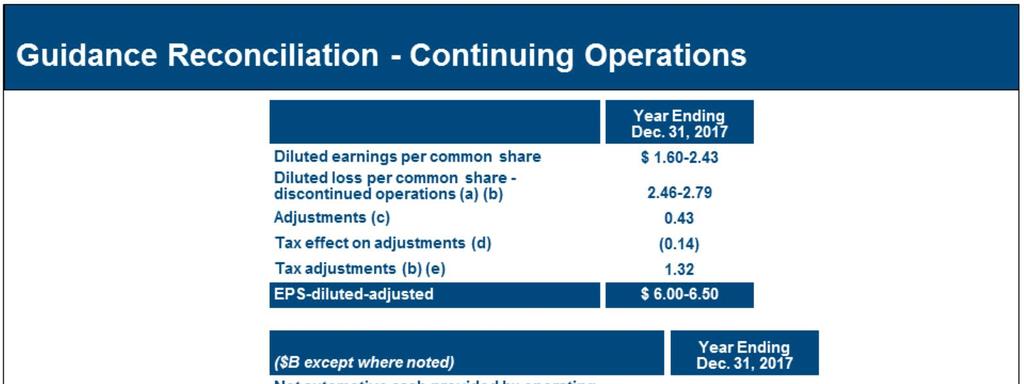
7 Q EPS-diluted was $1.60 per share, down $0.14 per share Y-O-Y. Results include three special items for Q2 and H1 of GMIO restructuring of $0.4 billion (after tax) related to the strategic decision to rationalized our core operations by exiting or significantly reducing our presence in various international markets to focus our resources on opportunities expected to deliver higher returns. The adjustment primarily consists of asset impairments, dealer restructuring, sales incentives, inventory provisions, dealer restructuring, employee separations and other contract cancelation costs in India and South Africa. Ignition switch recall related legal matters of $0.1 billion (after tax). Venezuela deconsolidation of less than $0.1 billion (after tax) due to ceasing operations and terminating employment relationships in Venezuela. EPS-diluted-adjusted was $1.89 per share, up $0.10 Y-O-Y due to improved adjusted income and lower share count. Q weighted average share count was 1.52 billion shares down more than 60 million shares Y-O-Y reflecting the impact of the share repurchase program. 7

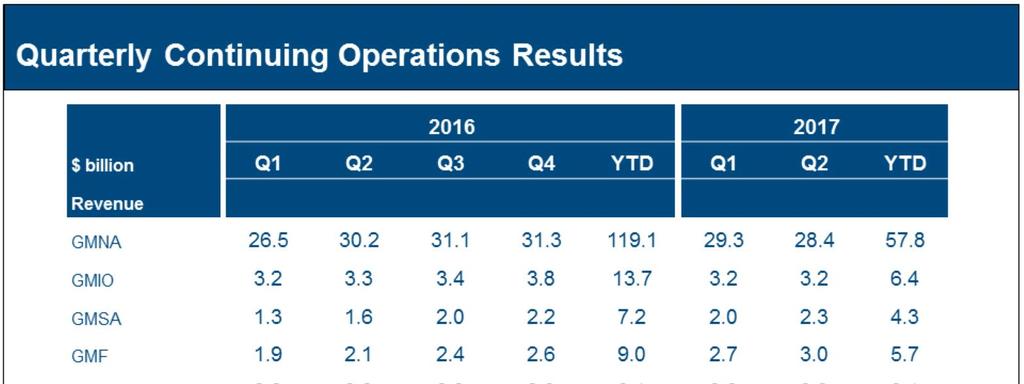
8 Q2 consolidated net revenue decreased $0.4 billion. Key drivers included: Volume $3.0 billion unfavorable due to decreased wholesales primarily in North America (110,000 units). North American wholesales decreased primarily due to decreased net off-lease rental car sales, and wholesales of the Chevrolet Malibu and Cruze, partially offset by increased wholesales of the Chevrolet Equinox, GMC Acadia and full-size trucks. Mix favorable primarily in North America due to decreases in in off-lease rental car activities and sales of the Chevrolet Malibu and Cruze, partially offset by the Chevrolet Equinox. GM Financial continued top line growth as GMF expands its portfolio and executes the transition to a full-captive finance company. Other due primarily to favorable FX in South America. 8

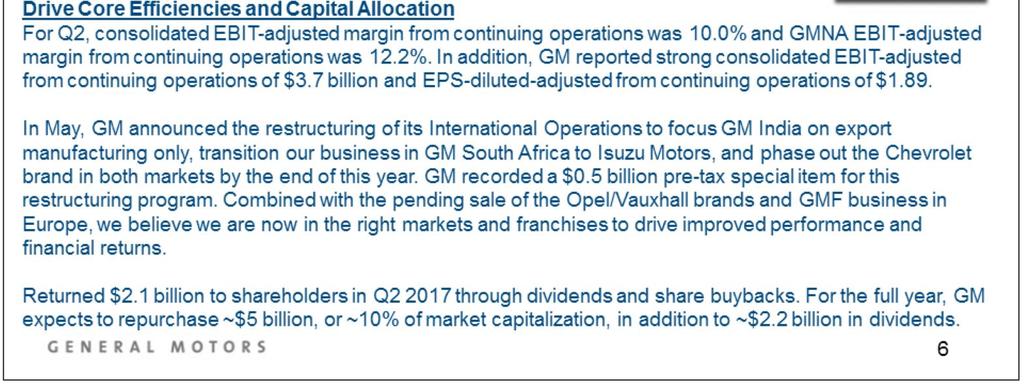
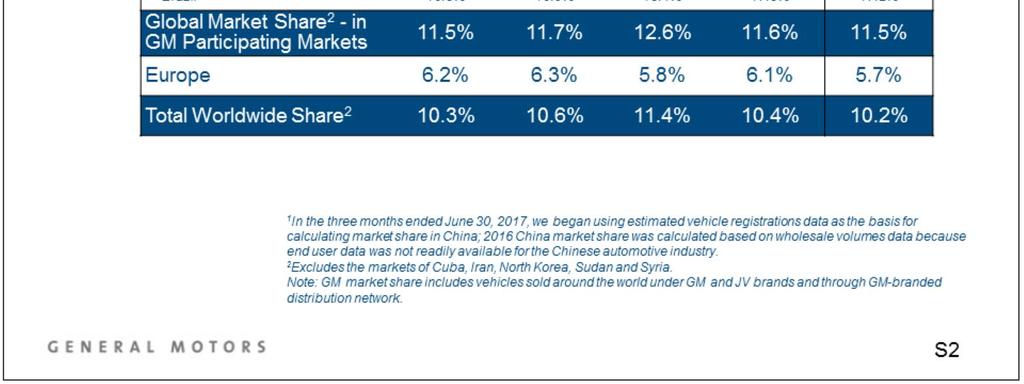
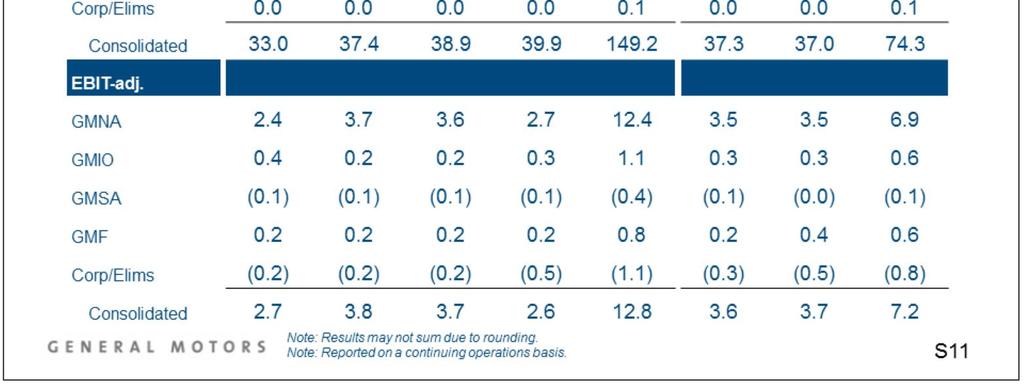
9 Consolidated EBIT-adjusted of $3.7 billion, down $0.2 billion Y-O-Y primarily due to reduced wholesale volume in North America. Consolidated EBIT-adjusted margin remained strong at 10.0%, down 30 bps Y-O-Y. Trailing four-quarter consolidated EBIT-adjusted margin of nearly 9%. Consolidated wholesales for Q2 decreased 99,000 units, primarily driven by decreased wholesales in North America related to the strategic reduction in daily rental car sales. Global market share remained flat Y-O-Y. 9

10 Drivers of the change in Consolidated EBIT-adjusted include: Volume unfavorable due to 99,000 unit decrease in wholesales, primarily driven by lower wholesales in North America related to the strategic reduction in daily rental car sales. Mix favorable primarily in GMNA due to a decrease in off-lease rental car activity. Price favorable price for majors in GMNA and favorable price due to FX in GMIO and GMSA, partially offset by unfavorable price on carryover products in GMNA. Cost cost performance of $0.8 billion partially offset by raw material headwinds of $0.2 billion and unfavorable material majors of $0.3 billion. H1 cost performance was favorable by $1.4 billion partially offset by $0.5 billion in unfavorable material majors and $0.4 billion in raw material headwinds. Other unfavorable primarily due to weakening of the Mexican Peso and Canadian dollar. 10

11 Strong consolidated EBIT-adjusted of $3.7 billion: GMNA generated EBIT-adjusted of $3.5 billion, down $0.3 billion Y-O-Y, with wholesales down 110,000 units. GMIO results improved $0.2 billion Y-O-Y to $0.3 billion with increased equity income and improved results from consolidated international operations. GMSA generated breakeven results, an improvement of $0.1 billion Y-O-Y, while continuing to operate in a challenging macroeconomic environment. GMF Q2 EBT-adjusted was a record $0.4 billion, an improvement of $0.1 billion Y-O-Y. Corporate/Eliminations Q2 EBIT-adjusted was $(0.5) billion, down $0.3 billion Y-O-Y due to increased spending on autonomous and other future of mobility initiatives. 11


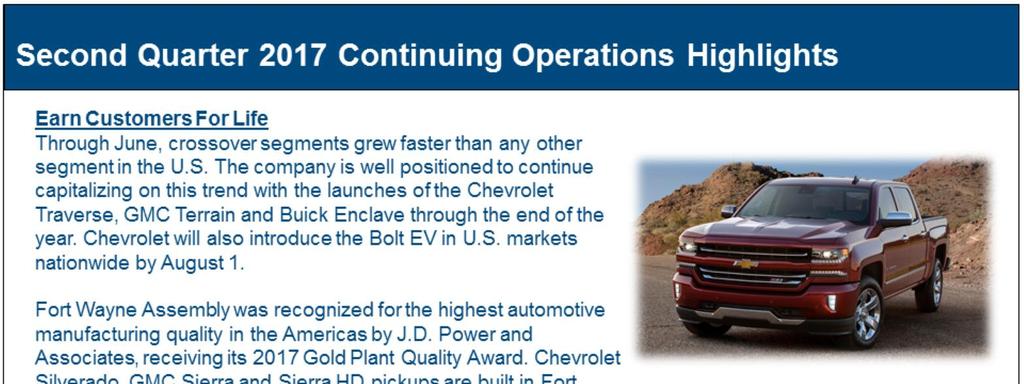
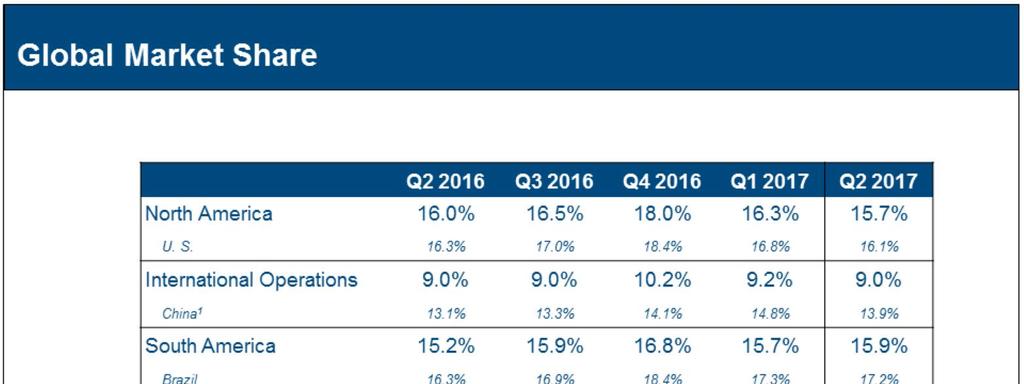
12 Total market share in the U.S. was 16.4% during H1, up 10 bps Y-O-Y. Retail market share was flat during H1 at 16.5%. GM launched the high volume Chevrolet Equinox in Q2 2017, and will launch the Chevrolet Traverse, GMC Terrain and Buick Enclave in the second half of GM demonstrated its discipline on incentive spending as incentives as a percentage of ATP was near industry average at 1.01 during Q Average transaction prices exceeded $35,000/vehicle and exceeded industry average by more than $3,400/vehicle during Q


13 North America generated very strong EBIT-adjusted of $3.5 billion with 12.2% EBIT-adjusted margin, while wholesales were down 110,000 units (11%) and net revenue was down $1.8 billion (5.9%). GMNA has an average EBIT-adjusted margin of 11.0% for the last four quarters. U.S. dealer inventory increased 273,000 units from the prior year due to production supporting GM s high volume crossover launches, and the build of full-size pickup inventory in advance of the previously announced plant shutdown for re-tooling for the next generation pickup. We expect year-end 2017 day s supply to be well positioned at ~70 days with an improved mix of trucks and crossovers and less passengers cars than year-end Wholesales decreased 110,000 units, primarily due to decreased net wholesale volumes associated with a decrease in off-lease rental car sales (69,000 units), and reduced volume of the Chevrolet Malibu and Cruze, partially offset by strong sales of the new Chevrolet Equinox and GMC Acadia, as well as full-size trucks. Market share for North America was 15.7%, down 30 bps Y-O-Y, primarily due to the net impact of the planned reduction of sales into the daily-rental channel. 13
, and reduced volume of the Chevrolet Malibu and Cruze, partially offset")
14 Drivers of the change in GMNA EBIT-adjusted include: Volume unfavorable due to 110,000 unit decrease in wholesales. The primary drivers are decreased net wholesale volumes associated with a decrease in off-lease rental car sales (69,000 units), and reduced volume of the Chevrolet Malibu and Cruze, partially offset by strong sales of the new Chevrolet Equinox and GMC Acadia, as well as full-size trucks. Mix favorable primarily due to a decrease in off-lease rental car activity. Cost favorable cost performance of $1.0 billion, partially offset by raw material headwinds of $0.2 billion and unfavorable material majors of $0.2 billion due to the launch of the Chevrolet Equinox. H1 cost performance of $1.8 billion partially offset by $0.5 billion in unfavorable material majors and $0.3 billion in raw material headwinds. Net majors (price and cost) expected to be favorable in the H as we launch our high volume Chevrolet Equinox and Traverse. Other unfavorable primarily due to weakening of the Mexican Peso and Canadian dollar. 14


15 GMIO EBIT-adjusted performance improved $0.2 billion Y-O-Y to $0.3 billion. China equity income was flat Y-O-Y at $0.5 billion: Wholesales were up 26,000 units due to the strength of the Cadillac and Baojun brands as well as SUVs and luxury vehicles, offset by weakness in demand for small passenger and mini-commercial vehicles. We expect at least 5% carryover pricing pressure for the year, partially offset by the growth of Cadillac and key products including the Malibu XL, Buick LaCrosse and GL8 as well as an intense focus on cost efficiencies. Consolidated international operations results were $0.1 billion favorable Y-O-Y: Improved performance in pricing and FX more than offset lower wholesale volume and macro-economic difficulties in our Middle East Operations as a result of low global oil prices. We expect the India and South Africa restructuring announcements to generate $0.1 billion of run rate EBIT-adjusted improvements on an annual basis. 15
16 Drivers of GMIO s EBIT-adjusted performance: Volume Wholesale volume down 20,000 units (11%) primarily due to decreased wholesale volumes in the Middle East. Price and Other favorable primarily due to FX. 16

17 GMSA achieved breakeven EBIT-adjusted results in Q2 2017, in a macroeconomic environment that continues to be challenging. Wholesales increased 23% Y-O-Y, increasing net revenues by $0.7 billion. The South American industry grew 13% to over 1.0 million units and GMSA gained 70 bps of market share to 15.9% based on the strength of the Chevrolet brand. We believe the current industry level of Brazilian SAAR of 2.2 million units represents a new breakeven point for our GMSA business, which is approximately 40% lower than We expect our H2 results to improve Y-O-Y driven by a modest industry recovery and the strength of our portfolio and brand. 17
18 Drivers of GMSA s EBIT-adjusted performance: Volume stronger industry and share growth in the key Brazilian and Argentine markets led to increased volume. Mix favorable mix driven by shift in sales from legacy to new portfolio. 18

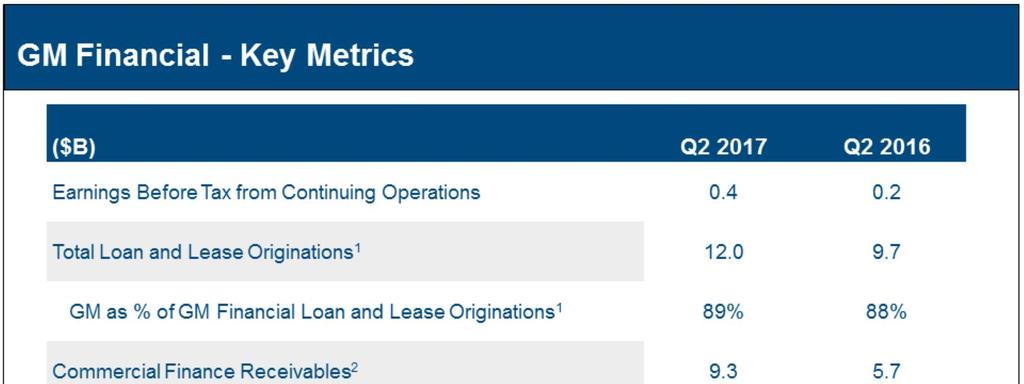
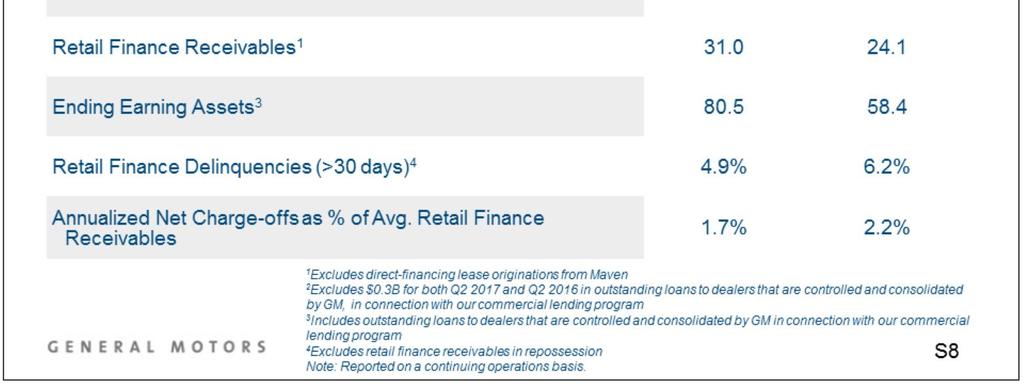
19 Record net revenue of $3.0 billion, up $0.9 billion and record EBT-adjusted of $0.4 billion, up $0.1 billion in Q2 2017, as GM Financial continues to execute on its full captive strategy. Earning assets grew from more than $22 billion to $80.5 billion from Q GM Financial continued to expand its captive presence with GM customers and dealers and increased its penetration of GM s retail sales by approximately 800 basis points Y-O-Y. Credit losses and retail delinquencies remain stable in both North American and International portfolios. 19


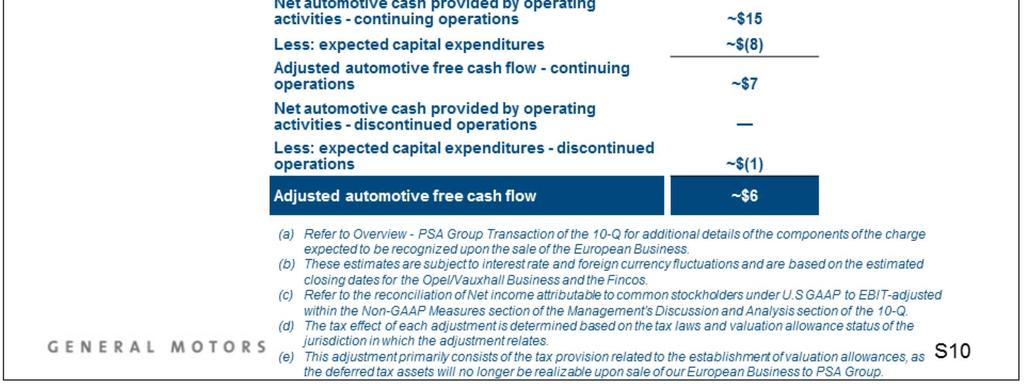
20 Q2 adjusted automotive free cash flow was $2.6 billion, down $0.7 billion Y-O-Y primarily due to $0.4 billion of additional capital expenditures and $0.3 billion of lower automotive net income. H1 adjusted automotive free cash flow was $2.0 billion, up $0.3 billion Y-O-Y primarily due to $0.4 billion of higher automotive net income offset by $0.1 billion of higher capital expenditures. We expect that post European transaction run rate capital expenditures will be approximately $8 billion. 20


21 Quarter-end available liquidity remains strong at $34.6 billion, down $1.2 billion from yearend The cash balance of $20.5 billion is in line with GM s average cash balance commitment of approximately $20 billion for the calendar year. Following the close of the Opel/Vauxhall transaction, we expect to reduce our average cash balance target to $18 billion. GM expects to continue to execute its capital allocation framework: Reinvesting in the business to drive 20% ROIC-adjusted, maintaining a strong investment grade balance sheet, and returning all available cash to shareholders. The change in automotive liquidity compared to year-end 2016 relates to the following: $ billions Operating cash flow 6.2 Capital expenditures (4.1) Dividends paid (1.1) Share repurchases (1.5) Other non-operating (0.7) YTD Change (1.2) 21
22 22
23 23
24 24


25 25
26 26
27 27
28 28
29 29
30 30
31 31
32 32
33 33

34 34
35 35
36 36
37 37
38 38
Strong return on invested capital-adjusted (ROIC-adjusted) of 27.6%, down 430 bps Y-O-Y, but well above our 2017 target of greater than 25%.
 of 27.6%, down 430 bps Y-O-Y, but well above our 2017 target of greater than 25%.") 1 2 3 Q3 global deliveries of 2.2 million units, up 0.1 million Y-O-Y, driven primarily by growth in China and a modest recovery of the market in South America. Q3 global market share is up 20 bps Y-O-Y,
1 2 3 Q3 global deliveries of 2.2 million units, up 0.1 million Y-O-Y, driven primarily by growth in China and a modest recovery of the market in South America. Q3 global market share is up 20 bps Y-O-Y,
Net income to common stockholders improved $1.4 billion Y-O-Y to a Q3 record of $2.8 billion.
 1 2 3 Q3 global deliveries up 0.1 million units Y-O-Y, a 4% increase. Volume gains primarily in China, offset by reductions in other International Operations. Q3 market share is down 40 bps Y-O-Y, driven
Q Results February 6, Chevrolet Silverado
 Q4 2017 Results February 6, 2018 2019 Chevrolet Silverado 1 Important Information Cautionary Note on Forward-Looking Statements: This presentation and related comments by management may include forward-looking
2017 Cadillac XT5. South America delivered 160,000 vehicles in the quarter, up 18 percent, compared to industry growth of 13 percent.
 SECOND-QUARTER 2017 EARNINGS FROM CONTINUING OPERATIONS GM Reports Net Revenue of $37 Billion and Income of $2.4 Billion from Continuing Operations EPS-diluted of $1.60, down 8 percent; EPS dilutedadjusted
GM Reports 2017 EPS Diluted of $0.22 and Record EPS Dilutedadjusted
 GM Reports 2017 EPS Diluted of $0.22 and Record EPS Dilutedadjusted of $6.62 FULL-YEAR 2017 RESULTS OVERVIEW EARNINGS FROM CONTINUING OPERATIONS Full-year income of $0.3 billion; EBIT-adj. of $12.8 billion,
GM Reports Income of $1.1 Billion and EBIT-adjusted of $2.6 Billion
 FIRST-QUARTER 2018 EARNINGS GM Reports Income of $1.1 Billion and EBIT-adjusted of $2.6 Billion Income from continuing operations impacted by $0.9 billion pre-tax charge related to Korea restructuring.
General Motors Company Q Results
 General Motors Company 2012 Results May 3, 2012 Forward Looking Statements In this presentation and in related comments by our management, our use of the words expect, anticipate, possible, potential,
GM Reports Income of $2.4 Billion and EBIT-adjusted of $3.2 Billion
 SECOND-QUARTER 2018 EARNINGS Reports Income of $2.4 Billion and EBIT-adjusted of $3.2 Billion Profitable in all core operating segments Second consecutive quarter of records for China equity income of
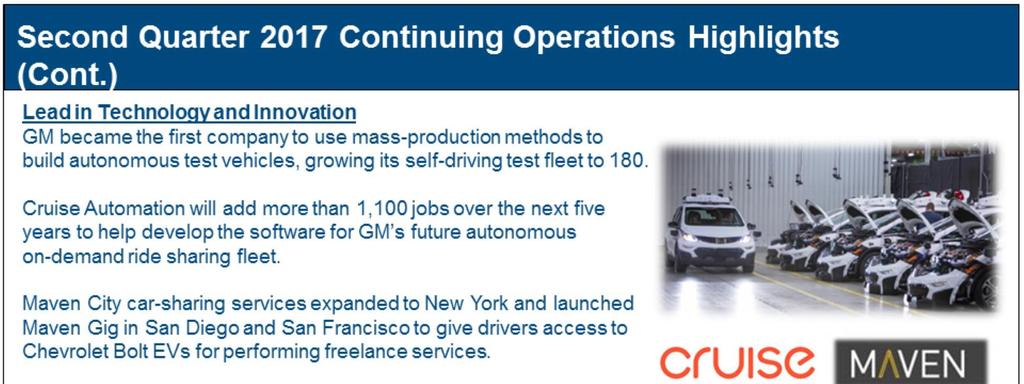
challenging driving environment of San Francisco, and deploying them to transport employees who use a ridehailing app called Cruise Anywhere.
 THIRD-QUARTER 2017 EARNINGS FROM CONTINUING OPERATIONS GM Reports Income of $0.1 Billion and EBITadjusted of $2.5 Billion from Continuing Operations Income from continuing operations impacted by $2.3 billion
Agenda Challenging Year, Great Learnings A Glimpse into 2009 Global Auto Industry GM -- What s s Next
 Agenda 2008 -- Challenging Year, Great Learnings A Glimpse into 2009 Global Auto Industry GM -- What s s Next U.S. Housing Statistics Source: Census Bureau / Haver Analytics Source: National Association
MARY BARRA. Deutsche Bank Global Auto Industry Conference. Chairman and CEO. January 16, 2018
 MARY BARRA Chairman and CEO Deutsche Bank Global Auto Industry Conference January 16, 2018 OUR TRANSFORMATION JOURNEY 2009 2010 2011 2012 2013 2014 2015 2016 2017 2018 2019 2020 2021 2022 2023 Restructuring
GM Reports Q Net Income of $1.1 Billion Q4 EBIT-adjusted of $2.4 billion, up from $1.9 billion in 2013
 For Release: Wednesday, Feb. 4, 2015, 7:30 a.m. EST GM Reports Q4 2014 Net Income of $1.1 Billion Q4 EBIT-adjusted of $2.4 billion, up from $1.9 billion in 2013 Q4 EPS of $0.66 including net loss from
Exhibit 1. General Motors Company and Subsidiaries Supplemental Material (Unaudited)
") Exhibit 1 General Motors Company and Subsidiaries The accompanying tables and charts include earnings before interest and taxes adjusted for special items, presented net of noncontrolling interests (EBIT-adjusted),
Exhibit 1 General Motors Company and Subsidiaries The accompanying tables and charts include earnings before interest and taxes adjusted for special items, presented net of noncontrolling interests (EBIT-adjusted),
GM Reports Another Strong Year of Earnings
 2018 YEAR-END EARNINGS Reports Another Strong Year of Earnings Full-year EPS-diluted of $5.58; EPS-diluted-adj. of $6.54 Income of $8.1 billion includes $2.5 billion in costs primarily related to restructuring
GENERAL MOTORS STRATEGIC AND OPERATIONAL OVERVIEW October 28, Cadillac Escala Concept
 GENERAL MOTORS STRATEGIC AND OPERATIONAL OVERVIEW October 28, 2016 Cadillac Escala Concept Forward-Looking Statements In this presentation and in related comments by management, we use words and phrases
GENERAL MOTORS STRATEGIC AND OPERATIONAL OVERVIEW September 21, 2016
 GENERAL MOTORS STRATEGIC AND OPERATIONAL OVERVIEW September 21, 2016 Forward-Looking Statements In this presentation and in related comments by management, we use words like anticipate, appears, approximately,
MAGNA INTERNATIONAL INC. Management's Discussion and Analysis of Results of Operations and Financial Position
 MAGNA INTERNATIONAL INC. Management's Discussion and Analysis of Results of Operations and Financial Position Unless otherwise noted, all amounts in this Management's Discussion and Analysis of Results
Exhibit 1. General Motors Company and Subsidiaries Supplemental Material (Unaudited)
") Exhibit 1 The accompanying tables and charts include earnings before interest and taxes adjusted for special items, presented net of noncontrolling interests (EBIT-adjusted) and adjusted free cash flow.
Exhibit 1 The accompanying tables and charts include earnings before interest and taxes adjusted for special items, presented net of noncontrolling interests (EBIT-adjusted) and adjusted free cash flow.
Mondelēz International Q Results. July 27, 2016
 Mondelēz International Q2 2016 Results July 27, 2016 1 Forward-Looking Statements This presentation contains a number of forward-looking statements. Words, and variations of words, such as will, expect,
Fourth Quarter 2017 Earnings Call. February 16, 2018
 Fourth Quarter 2017 Earnings Call February 16, 2018 Forward-Looking Statements This supplemental information contains forward-looking statements within the meaning of the Private Securities Litigation
Ford Delivers Third Quarter $1.0B Net Income; $1.7B Adj. EBIT; On Track to Achieve Full-Year Adjusted EPS Guidance in the Range of $1.30 to $1.
 Ford Delivers Third Quarter $1.0B Net Income; $1.7B Adj. EBIT; On Track to Achieve Full-Year Adjusted EPS Guidance in the Range of $1.30 to $1.50 Company revenue up 3 percent in the quarter, driven by
PPG Industries, Inc. Second Quarter 2017 Financial Results Earnings Brief July 20, 2017
 PPG Industries, Inc. Second Quarter 2017 Financial Results Earnings Brief July 20, 2017 Second Quarter Financial Highlights Net sales for the second quarter 2017 were $3.8 billion, increasing about 1 percent
GLOBAL OVERVIEW. Marc Bitzer. President and Chief Executive Officer
 Third-Quarter Second-Quarter 2018 2018 Earnings Review GLOBAL OVERVIEW Marc Bitzer President and Chief Executive Officer 2 2018 THIRD-QUARTER HIGHLIGHTS All-time record ongoing EPS of $4.55 and EBIT margin
Third Quarter 2018 Results October 30, 2018
 Third Quarter 2018 Results October 30, 2018 This document, and in particular the section entitled 2018 guidance, contains forward-looking statements. In particular, these forward-looking statements include
U.S. LOAN, LEASE & FLOORPLAN SECURITIZATION PLATFORMS. May 2018
 U.S. LOAN, LEASE & FLOORPLAN SECURITIZATION PLATFORMS May 2018 SAFE HARBOR STATEMENT This presentation contains several forward-looking statements. Forward-looking statements are those that use words such
PPG Industries, Inc. Third 2016 Financial Results Earnings Brief October 20, 2016
 PPG Industries, Inc. Third 2016 Financial Results Earnings Brief October 20, 2016 Third Quarter 2016 Financial Highlights PPG net sales for the third quarter 2016 were $3.8 billion, up almost 2 percent
Wholesales (000) 1,545 1,493 (52) 4,720 4, Revenue (Bils.) $ 35.8 $ 34.9 $ (0.9) $ $ $ (1.1)
 1,545 1,493 (52) 4,720 4, Revenue (Bils.) $ 35.8 $ 34.9 $ (0.9) $ $ $ (1.1)") Ford Posts Third Quarter 2014 Pre-Tax Profit of $1.2 Billion*; Net Income of $835 Million; Global Product Launches on Track, Including F-150 Third quarter pre-tax profit of $1.2 billion, a decrease of
Ford Posts Third Quarter 2014 Pre-Tax Profit of $1.2 Billion*; Net Income of $835 Million; Global Product Launches on Track, Including F-150 Third quarter pre-tax profit of $1.2 billion, a decrease of
Deutsche Bank Global Auto Industry Conference. January 13, 2015
 Deutsche Bank Global Auto Industry Conference January 13, 2015 Rodney O Neal Chief Executive Officer and President Forward-looking statements This presentation, as well as other statements made by Delphi
Mondelēz International 2013 Results. February 12, 2014
 Mondelēz International 2013 Results February 12, 2014 1 Forward-looking statements This slide presentation contains a number of forward-looking statements. Words, and variations of words, such as will,
Fourth Quarter 2018 Financial Results
 Fourth Quarter 2018 Financial Results Michael H. McGarry, Chairman and Chief Executive Officer Vincent J. Morales, Senior Vice President and Chief Financial Officer John Bruno, Director, Investor Relations
Superior Industries International
 NYSE: SUP Year End 2013 Earnings Conference Call March 7 th, 2014 Superior Industries International Forward-Looking Statements Any forward-looking statements made in this webcast or contained in this presentation
Second-Quarter Earnings Review
 Second-Quarter 2018 Earnings Review GLOBAL OVERVIEW Marc Bitzer President and Chief Executive Officer 2 2018 SECOND-QUARTER HIGHLIGHTS Ongoing EBIT margin expansion despite challenging cost environment
PPG Industries, Inc. Second Quarter 2015 Financial Results Earnings Brief July 16, 2015
 PPG Industries, Inc. Second Quarter 2015 Financial Results Earnings Brief July 16, 2015 Second Quarter Financial Highlights PPG net sales for the second quarter 2015 increased to $4.10 billion versus the
PPG Industries, Inc. Fourth 2016 Financial Results Earnings Brief January 19, 2017
 PPG Industries, Inc. Fourth 2016 Financial Results Earnings Brief January 19, 2017 Fourth Quarter Financial Highlights PPG fourth quarter net sales from continuing operations of $3.5 billion were down
Exhibit 1. General Motors Company and Subsidiaries Supplemental Material. (Unaudited)
") Exhibit 1 General Motors Company and Subsidiaries The accompanying tables and charts for securities analysts include earnings before interest and taxes (EBIT), adjusted EBIT and free cash flow which are
Exhibit 1 General Motors Company and Subsidiaries The accompanying tables and charts for securities analysts include earnings before interest and taxes (EBIT), adjusted EBIT and free cash flow which are
Ally Financial Reports First Quarter 2015 Financial Results
 Ally Financial Reports First Quarter 2015 Financial Results First quarter net income of $576 million, compared to $227 million in the first quarter of 2014 First quarter earnings per diluted common share
Sanford C. Bernstein Strategic Decisions Conference
 Sanford C. Bernstein Strategic Decisions Conference May 31, 2012 Essentials for a Better Life A Long and Successful History Celebrating 140 th anniversary in 2012 Company founded before the telephone,
4Q 2018 And Full Year Earnings Review And 2019 Outlook. January 23, 2019 (Preliminary Results)
") 4Q 2018 And Full Year Earnings Review And 2019 Outlook January 23, 2019 (Preliminary Results) Creating Tomorrow, Together Our Belief Our Aspiration Our Plan for Value Creation Winning Portfolio Freedom
4Q 2018 And Full Year Earnings Review And 2019 Outlook January 23, 2019 (Preliminary Results) Creating Tomorrow, Together Our Belief Our Aspiration Our Plan for Value Creation Winning Portfolio Freedom
PPG Industries, Inc. Second 2016 Financial Results Earnings Brief July 21, 2016
 PPG Industries, Inc. Second 2016 Financial Results Earnings Brief July 21, 2016 Second Quarter 2016 Financial Highlights PPG net sales for the second quarter 2016 were $4.1 billion, down less than one
2016 THIRD-QUARTER EARNINGS REVIEW October 25, 2016
 2016 THIRD-QUARTER EARNINGS REVIEW October 25, 2016 0 THIRD-QUARTER EARNINGS PRESENTATION WHIRLPOOL CORPORATION ADDITIONAL INFORMATION This presentation contains forward-looking statements about Whirlpool
PPG Industries, Inc. Third Quarter 2015 Financial Results Earnings Brief October 15, 2015
 PPG Industries, Inc. Third Quarter 2015 Financial Results Earnings Brief October 15, 2015 Third Quarter Financial Highlights PPG net sales for the third quarter of 2015 were $3.87 billion versus the prior
First Quarter 2018 Conference Call. April 25, 2018
 First Quarter 2018 Conference Call April 25, 2018 Forward-Looking Statements Certain information contained in this presentation constitutes forward-looking statements for purposes of the safe harbor provisions
FOURTH-QUARTER 2017 EARNINGS REVIEW January 25, 2018
 FOURTH-QUARTER 2017 EARNINGS REVIEW January 25, 2018 GLOBAL OVERVIEW INSERT PHOTO HERE Marc Bitzer Chief Executive Officer 2 2017 FOURTH-QUARTER HIGHLIGHTS Ongoing EPS of $4.10 in Q4 and $13.74 for the
Q Earnings Call Presentation
 Q2 2014 Earnings Call Presentation July 31, 2014 Forward-looking Statements Statements in this presentation that are not historical in nature constitute forward-looking statements. These forward-looking
The Welding Experts. Lincoln Electric Holdings, Inc. Q Earnings Conference Call April 19, 2016
 The Welding Experts Lincoln Electric Holdings, Inc. Q1 2016 Earnings Conference Call April 19, 2016 Christopher L. Mapes Chairman, President & Chief Executive Officer Vincent K. Petrella Executive Vice
Third Quarter 2017 Results. October 24, 2017
 Third Quarter 2017 Results October 24, 2017 This document, and in particular the section entitled 2017 guidance confirmed, contains forward-looking statements. These statements may include terms such as
Lincoln Electric Holdings, Inc. 1Q 2013 Financial Results Conference Call April 23, 2013
 Lincoln Electric Holdings, Inc. 1Q 2013 Financial Results Conference Call April 23, 2013 1 Safe Harbor & Reg-G Forward-Looking Statements: Statements made during this presentation which are not historical
FY 2017 Third Quarter Earnings Call
 FY 2017 Third Quarter Earnings Call July 27, 2017 Improving the experience of a world in motion Forward Looking Statement Adient has made statements in this document that are forward-looking and, therefore,
Third Quarter 2016 Conference Call. October 28, 2016
 Third Quarter 2016 Conference Call October 28, 2016 Forward-Looking Statements Certain information contained in this presentation constitutes forward-looking statements for purposes of the safe harbor
Q Results July 27, 2016
 Q2 2016 Results July 27, 2016 Q2 2016 Results July 27, 2016 Safe Harbor Statement This document, and in particular the section entitled 2016 guidance revised upwards, contains forward-looking statements.
First Quarter 2016 Business Update. April 28, 2016
 First Quarter 2016 Business Update April 28, 2016 First Quarter 2016 Highlights Net Sales $ in millions, except EPS Adjusted Operating Income* (Adjusted Operating Margin) Adjusted EPS* +6% +8% +8% $684.8
GENERAL MOTORS COMPANY (Exact Name of Registrant as Specified in its Charter)
") UNITED STATES SECURITIES AND EXCHANGE COMMISSION Washington, DC 20549-1004 Form 10-Q QUARTERLY REPORT PURSUANT TO SECTION 13 OR 15(d) OF THE SECURITIES EXCHANGE ACT OF 1934 For the quarterly period ended
UNITED STATES SECURITIES AND EXCHANGE COMMISSION Washington, DC 20549-1004 Form 10-Q QUARTERLY REPORT PURSUANT TO SECTION 13 OR 15(d) OF THE SECURITIES EXCHANGE ACT OF 1934 For the quarterly period ended
BAN K OF A MERICA. April 12, Executive Vice President, Global Product Development, Purchasing and Supply Chain
 2017 BAN K OF A MERICA MERRILL LYNCH AUTO SUMMIT April 12, 2017 M ARK REUSS Executive Vice President, Global Product Development, Purchasing and Supply Chain FORWARD LO OKI NG STATEMENTS In this presentation
THREE MONTHS ENDED SEPTEMBER 30, All results are reported in millions of U.S. dollars, except per share figures, which are in U.S. dollars.
 PRESS RELEASE MAGNA ANNOUNCES THIRD QUARTER RESULTS Third quarter record sales, up 7% to $9.50 billion Third quarter diluted earnings per share of $1.36, increased 5% Returned $521 million to shareholders
PPG Industries, Inc. Second Quarter 2018 Financial Results Earnings Brief July 19, 2018
 PPG Industries, Inc. Second Quarter 2018 Financial Results Earnings Brief July 19, 2018 Second Quarter Financial Highlights PPG second quarter net sales from continuing operations were approximately $4.1
FIAT CHRYSLER AUTOMOBILES - Financial Results Three months ended March 31
 FCA posts record First Quarter Results with Adjusted EBIT nearly doubled to 1.4 billion, and all segments profitable. Adjusted Net Profit reached 0.5 billion. Full year guidance is confirmed. Worldwide
Deutsche Bank Global Automotive Conference. Ford Motor Company January 16, 2019
 Deutsche Bank Global Automotive Conference Ford Motor Company January 16, 2019 Important Notice Regarding This Presentation This presentation includes our preliminary view of 2018 results. Our actual results
24MAR Magna International Inc. First Quarter Report
 24MAR200901113112 Magna International Inc. First Quarter Report 2009 MAGNA INTERNATIONAL INC. Management's Discussion and Analysis of Results of Operations and Financial Position All amounts in this Management's
Fourth Quarter 2017 Conference Call. February 8, 2018
 Fourth Quarter 2017 Conference Call February 8, 2018 Forward-Looking Statements Certain information contained in this presentation constitutes forward-looking statements for purposes of the safe harbor
The Manitowoc Company
 The Manitowoc Company STIFEL CONFERENCE, NEW YORK: JUNE 13, 2016 Safe Harbor Statement Any statements contained in this presentation that are not historical facts are forwardlooking statements. These statements
PPG Industries, Inc. First Quarter 2019 Financial Results Earnings Brief April 18, 2019
 PPG Industries, Inc. First Quarter 2019 Financial Results Earnings Brief April 18, 2019 First Quarter Financial Highlights PPG first quarter net sales from continuing operations were approximately $3.6
PPG Industries, Inc. Fourth Quarter 2018 Financial Results Earnings Brief January 17, 2019
 PPG Industries, Inc. Fourth Quarter 2018 Financial Results Earnings Brief January 17, 2019 Fourth Quarter Financial Highlights PPG fourth quarter net sales from continuing operations were approximately
Forward-Looking Statements
 Second Quarter 2016 Conference Call July 27, 2016 Forward-Looking Statements Certain information contained in this presentation constitutes forward-looking statements for purposes of the safe harbor provisions
Q Investor Highlights. August 8, 2018
 Q2 2018 Investor Highlights August 8, 2018 Forward Looking Statements This document contains forward-looking statements, that is, information related to future, not past, events. Such statements generally
Fourth-Quarter 2017 Results. January 31, 2018
 Fourth-Quarter 2017 Results January 31, 2018 Safe Harbor This presentation includes forward-looking statements which are statements that are not historical facts, including statements that relate to the
Lincoln Electric Holdings, Inc.
 Lincoln Electric Holdings, Inc. 2015 Earnings Conference Call October 30, 2015 Christopher L. Mapes Chairman, President & Chief Executive Officer Vincent K. Petrella Executive Vice President & Chief Financial
Forward-Looking Statements
 First Quarter 2016 Conference Call April 27, 2016 Forward-Looking Statements Certain information contained in this presentation constitutes forward-looking statements for purposes of the safe harbor provisions
FIRST QUARTER Earnings Conference Call April 26, 2016
 FIRST QUARTER 2016 Earnings Conference Call April 26, 2016 Agenda Highlights and Strategic Overview Segment Results Financial Overview Outlook Gregg Sherrill Chairman & CEO Brian Kesseler Chief Operating
2017 THIRD-QUARTER EARNINGS REVIEW October 24, 2017
 2017 THIRD-QUARTER EARNINGS REVIEW October 24, 2017 CAUTIONARY STATEMENT This presentation contains forward-looking statements about Whirlpool Corporation and its consolidated subsidiaries ( Whirlpool
Q EARNINGS CALL FEBRUARY 20, 2018
 Q4 2017 EARNINGS CALL FEBRUARY 20, 2018 1 IMPORTANT INFORMATION Forward Looking Statements These slides contain (and the accompanying oral discussion will contain) forward looking statements. All statements
February 21, Fourth Quarter 2018 Results
 February 21, 2019 Fourth Quarter 2018 Results Forward-looking statements This presentation, as well as other statements made by Delphi Technologies PLC (the Company ), contains forward-looking statements
Ford Motor Company Reports Fourth Quarter and Full Year 2018 Results
 Ford Motor Company Reports Fourth Quarter and Full Year 2018 Results Revenue up in the fourth quarter and full year; net income, adjusted EBIT and margin lower North America EBIT margin of 7.6% in the
Financial Analysis Report GENERAL MOTORS
 Financial Analysis Report GENERAL MOTORS This study was conducted by Shant ATAMIAN Hani OBEID (ESCP/ESA EMBA-20) Fahmi Ben Abdelkader Financial Statement Analysis Outline Strategic and Economic Assesement
Fiscal 2018 Fourth Quarter
 Fiscal 2018 Fourth Quarter If you can read this Click on the icon to choose a Results picture or Reset the slide. To Reset: Right click on the slide thumbnail and select reset slide or choose the Reset
Q4 & FY 2018 Results. January 30, 2019
 Q4 & FY 2018 Results January 30, 2019 This presentation contains a number of forwardlooking statements. Words, and variations of words, such as will, expect, may, believe, estimate, deliver, potential,
News. PPG reports fourth quarter and full-year 2018 financial results
 News PPG Media Contact: Mark Silvey Corporate Communications +1-412-434-3046 silvey@ppg.com PPG Investor Contact: John Bruno Investor Relations +1-412-434-3466 jbruno@ppg.com investor.ppg.com PPG reports
ITW Conference Call Fourth Quarter 2012
 ITW Conference Call Fourth Quarter 2012 January 29, 2013 SOLID GROWTH. STRONG RETURNS. BEST-IN-CLASS OPERATOR. 100 YEARS STRONG Safe Harbor Statement Forward-Looking Statements This conference call contains
First Quarter 2017 Results
 First Quarter 2017 Results April 26, 2017 Q1 Q2 2017 Results April, 26, 2017 2017 # 1 Safe Harbor Statement This document, and in particular the section entitled 2017 guidance confirmed, contains forward-looking
FINANCIAL RESULTS (1) (including Magneti Marelli) Years ended December Change ( million, except as otherwise noted) Change
 (including Magneti Marelli) Years ended December Change ( million, except as otherwise noted) Change") FCA reports record full year results, including Magneti Marelli: Adjusted EBIT at 7.3 billion, with NAFTA margin up 70 bps to 8.6%; Adjusted Net Profit up 34% to 5.0 billion; Net Profit up 3% to 3.6 billion.
FCA reports record full year results, including Magneti Marelli: Adjusted EBIT at 7.3 billion, with NAFTA margin up 70 bps to 8.6%; Adjusted Net Profit up 34% to 5.0 billion; Net Profit up 3% to 3.6 billion.
Third Quarter 2018 Earnings Teleconference. October 30, 2018
 Third Quarter 2018 Earnings Teleconference October 30, 2018 CONTENTS Q3 2018 Summary 2018 Guidance Q3 2018 Supplemental Information Appendix 2 Disclosure Regarding Forward-Looking Statements Information
Allegion Second-Quarter 2016 Results. July 28, 2016
 Allegion Second-Quarter 2016 Results July 28, 2016 Safe Harbor This presentation contains "forward-looking statements" within the meaning of the Private Securities Litigation Reform Act of 1995, including
Retain. Joe Hinrichs 2014 FIRST QUARTER EARNINGS REVIEW. Executive Vice President, Ford Motor Company President, The Americas APRIL 25, 2014
 Retain LANE-KEEPING AID Joe Hinrichs 2014 FIRST QUARTER EARNINGS REVIEW Executive Vice President, Ford Motor Company President, The Americas APRIL 25, 2014 Deutsche Bank Conference (PRELIMINARY June 4,
Forward-Looking Statements
 Goldman Sachs Industrials Conference November 12, 2014 Forward-Looking Statements Certain information contained in this presentation constitutes forward-looking statements for purposes of the safe harbor
Q Results October 25, 2016
 Q3 2016 Results October 25, 2016 Safe Harbor Statement This document, and in particular the section entitled 2016 guidance revised upwards, contains forward-looking statements. These statements may include
Q Results. October 29, 2018
 Q3 2018 Results October 29, 2018 Forwardlooking Statements This presentation contains a number of forwardlooking statements. Words, and variations of words, such as will, expect, may, should, believe,
1st Quarter 2018 Earnings Conference Call. April 24, 2018
 1st Quarter 2018 Earnings Conference Call April 24, 2018 Forward-looking statements During this presentation, we make certain forward-looking statements concerning plans and expectations for Carlisle Companies
Third-Quarter 2014 Results. October 22, 2014
 Third-Quarter 2014 Results October 22, 2014 Safe Harbor This presentation includes forward-looking statements, which are statements that are not historical facts, including statements that relate to the
Ford Posts Third Quarter 2014 Pre-Tax Profit of $1.2 Billion*; Net Income of $835 Million; Global Product Launches on Track, Including F-150
 FORD MEDIA CENTER Ford Posts Third Quarter 2014 Pre-Tax Profit of $1.2 Billion*; Net Income of $835 Million; Global Product Launches on Track, Including F-150 Third quarter pre-tax profit of $1.2 billion,
BUSINESS PLAN FINANCIAL OVERVIEW RICHARD PALMER CHIEF FINANCIAL OFFICER
 2018 2022 BUSINESS PLAN FINANCIAL OVERVIEW RICHARD PALMER CHIEF FINANCIAL OFFICER SAFE HARBOR STATEMENT This document and the related presentation contain forward-looking statements. In particular, these
Investor Presentation. February 2018
 Investor Presentation February 2018 1 Forward Looking Statements Important Information About Littelfuse, Inc. This presentation does not constitute or form part of, and should not be construed as, an offer
FY 2016 Results January 26, 2017
 FY 2016 Results January 26, 2017 Safe Harbor Statement This document, and in particular the section entitled Industry Outlook and Guidance, contains forward-looking statements. These statements may include
AUTOCANADA REPORTS 2018 FIRST QUARTER RESULTS
 AUTOCANADA REPORTS 2018 FIRST QUARTER RESULTS Edmonton, Alberta, May 3, 2018 - AutoCanada Inc. ( AutoCanada or the Company ) (TSX:ACQ), a leading North American multi-location automobile dealership group,
4Q 2016 Earnings Call February 28, :30am ET
 2016 Earnings Call February 28, 2017 8:30am ET 1 Safe Harbor Statement Certain statements made within this presentation contain forward-looking statements, within the meaning of the Private Securities
Third Quarter Earnings Conference Call
 Third Quarter Earnings Conference Call October 26, 2018 NYSE: TEN 1 Safe Harbor Forward-Looking Statements This communication contains forward-looking statements. These forward-looking statements include,
Fourth Quarter & Year End 2008 Conference Call
 1 Fourth Quarter & Year End 2008 Conference Call February 24, 2009 2 Agenda 2008 & Current Environment Q4 2008 Financial Highlights Q&A Don Walker Vince Galifi Don Walker Vince Galifi Louis Tonelli ALL
Lincoln Electric Holdings, Inc.
 Lincoln Electric Holdings, Inc. and Full Year 2015 Earnings Conference Call February 23, 2016 Christopher L. Mapes Chairman, President & Chief Executive Officer Vincent K. Petrella Executive Vice President
Allegion Second-Quarter 2015 Results. July 30, 2015
 Allegion Second-Quarter 2015 Results July 30, 2015 Safe Harbor This presentation contains "forward-looking statements" within the meaning of the Private Securities Litigation Reform Act of 1995, including
Lincoln Electric Holdings, Inc. Q Earnings Conference Call October 25, 2018
 Lincoln Electric Holdings, Inc. Q3 2018 Earnings Conference Call October 25, 2018 Christopher L. Mapes Chairman, President & Chief Executive Officer Vincent K. Petrella Executive Vice President & Chief
Forward-Looking Statements
 Third Quarter 2014 Conference Call October 29, 2014 Forward-Looking Statements Certain information contained in this presentation constitutes forward-looking statements for purposes of the safe harbor
Second Quarter 2017 Earnings Conference Call
 Second Quarter 2017 Earnings Conference Call July 28, 2017 NYSE: TEN Agenda Second Quarter Highlights Segment Results and Financial Overview Outlook and Strategic Priorities Brian Kesseler Chief Executive