PPG Industries, Inc. Fourth 2017 Financial Results Earnings Brief January 18, 2018
|
|
|
- Edward Lynch
- 6 years ago
- Views:
Transcription


1 PPG Industries, Inc. Fourth 2017 Financial Results Earnings Brief January 18, 2018 Fourth Quarter Financial Highlights PPG fourth quarter net sales from continuing operations were approximately $3.7 billion, increasing nearly 8 percent versus the prior year. Net sales in local currencies grew by more than 4 percent year-over-year, aided by 3 percent higher sales volumes. Higher year-overyear sales volumes were realized across all major regions and in both reporting segments. Aggregate selling prices improved sequentially in the fourth quarter, reflecting improving pricing momentum for the third consecutive quarter. Additional selling price initiatives were announced during the fourth quarter that will be implemented in early Acquisition-related sales added less than 1 percent, or about $27 million. Favorable foreign currency translation added over 3 percent to sales. More detailed sales comparisons for the company and individual reporting segments are included on subsequent presentation slides. Reported earnings per diluted share from continuing operations was $0.72 and adjusted earnings per diluted share from continuing operations was $1.19, an increase of about 3 percent versus the prior year. The natural disasters that occurred in the third quarter impacted fourth quarter earnings per share by 5 cents. The company s profit contribution margin declined 160 basis points year-over-year, or approximately 120 basis points excluding the impact of the natural disasters, marking a modest improvement in contribution margin compression from the third quarter. This improvement in the margin was aided by strong cost management, including restructuring savings at the top end of our targeted range, and lower selling, general, and administrative expenses which declined as a percentage of sales by more than 80 basis points year to date. The year-over-year increase in adjusted earnings per diluted share was achieved despite continuing raw material inflation, which intensified in the fourth quarter mainly due to the lingering effects of the hurricanes that occurred in the third quarter in the U.S., coupled with heightened environmental enforcement-related production curtailments in China. These factors have driven tight supply conditions resulting in the inflation of several key raw materials. Earnings accretive cash deployment continued in the fourth quarter including $400 million of shares repurchases, which represented nearly 3.5 million shares. Separately, on January 2, 2018, the company announced the acquisition of ProCoatings, a leading architectural paint and coatings wholesaler located in The Netherlands. The company plans to continue its share repurchase program in the first quarter 2018 and is committed to deploying a minimum of $2.4 billion during 2018 on share repurchases and acquisitions as part of our previously communicated target to deploy $3.5 billion in 2017 and 2018 combined. The company s acquisition pipeline remains active. The company continues to have excellent financial flexibility with cash and short-term investments of about $1.5 billion at year-end.


2 2 PPG Fourth Quarter Net Sales PPG fourth quarter net sales of $3.7 billion increased by nearly eight percent, or $265 million year-over-year, including favorable foreign currency translation of approximately $115 million. Local currency sales increased by more than four percent. Sales volumes grew 3 percent year-over-year, the highest growth rate since in more than two years. The volume growth was balanced across all major geographies with strong growth continuing in emerging regions and sequential improvement in Europe. Additional details on the volume results by region and business unit are included later in the presentation materials. Aggregate selling prices improved year-overyear and sequentially led by higher pricing in several businesses. In the fourth quarter, the company had approximately $27 million of acquisitionrelated sales primarily from The Crown Group acquisition that was completed in October. Favorable foreign currency translation increased sales by about 3 percent year-over-year, as a few key currencies for the company strengthened against the U.S dollar, most notably, the euro, Mexican peso, and Chinese yuan. These trends are expected to continue into the first-quarter based on current exchange rates. Fourth Quarter Net Sales Volume Aggregate global sales volumes grew by 3 percent in the fourth quarter of In the U.S. and Canada region, volumes increased by a low-single-digit percentage versus the prior year. Most business units had volume growth in the fourth-quarter, led by highsingle-digit percentage growth in the packaging coatings and specialty coatings businesses and solid mid-single-digit percentage growth in the aerospace and general industrial coatings businesses. In architectural coatings, same store sales in company-owned stores continued to grow volumes at a mid-single-digit percentage rate, excluding the benefit of price, while volumes in the independent dealer network and national retail accounts (DIY) channels were flat yearover-year, but in-line with the market. Sales volumes returned to broad-based, low-single-digit percentage growth in the Europe, Middle East, and Africa (EMEA) region following flat third quarter 2017 results. Fourth quarter results were led by demand for PPG s products in automotive OEM, general industrial, packaging and automotive refinish coatings. Sales volumes in architectural coatings and protective and marine coatings were flat with prior year and in-line with market. Sales volumes in Asia-Pacific grew by a low-to-mid-single digit percentage year-over-year. Volumes in the Asia-Pacific region had grown at a high-single-digit percentage in the fourth-quarter 2016, providing


3 for a difficult comparison period for the current quarter. Volume gains were led by above-market growth in general industrial, aerospace, and architectural coatings. From a country and sub-region perspective, volumes grew in China, India, and Southeast Asia versus the prior year, but decreased in Korea due to continuing soft but moderating marine shipbuilding activity. In Latin America, sales volumes advanced by a mid-single-digit percentage versus the prior year primarily due to double-digit percentage volume growth in the Industrial Coatings segment businesses. Volumes in the Performance Coating segment businesses were level with the prior year, including some lingering impact from the third quarter Mexican earthquakes. Within the region, volumes continued to expand in Mexico and Central America, along with a shift to modest growth in South America. 3 PPG Full Year Net Sales contributions to the overall volume gains. PPG s full-year net sales totaled approximately $14.8 billion, up more than 3 percent compared to the prior year. Acquisition-related sales benefited net sales by more than 1 percent partly due to the partial-year sales from businesses acquired during 2016, including MetoKote and Univer as well as the 2017 acquisitions of DEUTEK, Futian, and The Crown Group. Year-over-year sales volumes, excluding acquisition-related sales, grew over 1 percent, led by growth in emerging regions and Europe. From a business unit perspective, general industrial, automotive OEM, packaging, specialty coatings and materials, and automotive refinish coatings provided the largest Foreign currency translation was modestly favorable to net sales year-over-year. Favorable foreign currency translation experienced in the second half of 2017 slightly offset unfavorable impacts during the first half of the year. In 2017, overall selling prices for the company increased a modest two-tenths of one percent versus the prior year, with pricing momentum growing during the second half of The company s 2017 regional sales mix was largely consistent with the prior-year. Sales in the U.S. and Canada were about 43 percent, with sales in the U.S. now slightly less than 40 percent of total company sales reflecting continued geographic broadening of the company. Also, PPG s business mix shifted from approximately 97 percent coatings, coatings services, and specialty materials in 2016, as originally reported, to 100 percent at the end of This change reflects the completion of PPG s business portfolio transformation following the divestiture of the North American Fiber Glass business during PPG Adjusted Earnings Per Diluted Share Fourth quarter 2017 adjusted earnings per diluted share from continuing operations of $1.19 increased 3 cents, or nearly 3 percent versus the prior year. This improvement driven by sales

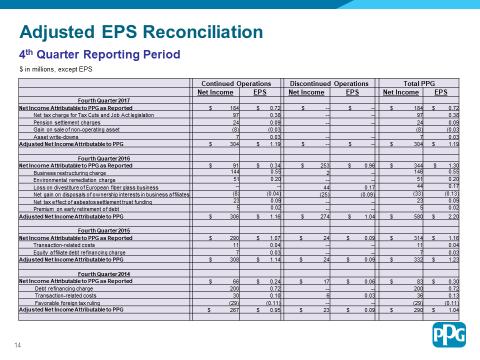
4 volume growth of 3 percent, strong cost management including the benefits of business restructuring actions, higher selling prices, and favorable currency translation. These improvements were partly offset by persistent raw material inflation which intensified to a mid-single-digit percentage inflation rate in the fourth quarter, including the effects from ongoing China environmental enforcement resulting in tight supply conditions. Selling price initiatives continued in quarter with further pricing secured for early Fourth quarter 2017 reported net income from continuing operations was $184 million, or 72 cents per diluted share, including the unfavorable impact of 5 cents per diluted share stemming from the natural disasters that occurred in the third quarter. Adjusted net income from continuing operations was $304 million, or $1.19 per diluted share. Adjusted net income excludes net after-tax charges totaling $120 million, or 47 cents per diluted share. These net after-tax charges include: $97 million net charge related to the new U.S. Tax Cuts and Jobs Act legislation; $24 million for pension settlement charges; and $7 million for asset write-downs, partially offset by an $8 million gain from the sale of a non-operating asset. The net tax charge reflects the company s current best estimate of the new U.S. tax legislation s impact. As new information becomes available, including issuance by regulatory bodies, the company may update this estimate. For the fourth quarter 2017, the effective tax rate was 49.7 percent and the adjusted effective tax rate was 24.3 percent. Fourth quarter 2016 reported net income from continuing operations was $91 million, or 34 cents per diluted share. Adjusted net income from continuing operations was $306 million, or $1.16 per diluted share. Adjusted net income excludes net after-tax charges totaling $215 million, or 82 cents per diluted share. These net after-tax charges include: $144 million for business restructuring; $51 million for increases to legacy environmental reserves; $23 million for higher tax expense related to asbestos settlement funding; and $5 million for a premium on the early retirement of debt, partially offset by an $8 million net gain on the disposals of ownership interests in business affiliates. For the fourth quarter 2016, the effective tax rate was 31.2 percent and the adjusted effective tax rate was 24.4 percent. A detailed reconciliation of the fourth quarter and full year adjusted earnings per diluted share figures for all periods presented is included in the presentation materials appendix. 4 Performance Coatings Performance Coatings segment net sales for the fourth quarter were $2.1 billion, up $144 million, or more than 7 percent, versus the prior year, and included favorable foreign currency translation of about $68 million, or more than 3 percent. Sales in local currencies were up nearly 4 percent year-over-year. Segment sales volumes increased 2 percent versus the prior year, with growth in all regions except Latin America, which was flat year-over-year. Fourth quarter segment income was $260 million, up $21 million, or about 9 percent, yearover-year including favorable impact from foreign currency translation of about $7 million. Segment income in local currencies increased by $15 million, or about 6 percent, primarily due to higher sales volumes, higher selling price, and strong cost management, including benefits from prior year business restructuring actions, partially offset by raw material inflation. From a business unit perspective, automotive refinish coatings organic sales grew by a mid-single-digit percentage, led by market outperformance in the U.S. and Europe as customers continued to adopt
5 5 PPG s industry leading technologies. Automotive refinish coatings organic sales also increased in emerging regions year-over-year, reflecting high end-use market demand. These general trends are expected to continue in the first quarter Aerospace coatings sales volumes grew by a mid-single-digit percentage with above-market growth in the U.S. and Asia. In the second half of 2017, industry demand growth improved and similar trends are anticipated in the first quarter Architectural coatings EMEA sales volumes were consistent with the prior year, as sales volume growth in Northern Europe offset lower customer demand in Southern and Eastern Europe. Sales volumes in the fourth-quarter improved sequentially from the third-quarter as customer demand improved, albeit in a lower quarter seasonally. The volume growth trend for architectural coatings EMEA is expected to improve modestly in the first quarter 2018, with results remaining uneven by country. Architectural coatings Americas and Asia-Pacific sales in local currencies increased by a low-to-midsingle-digit percentage versus the prior year with differences by channel and region. Organic sales improved in both the Latin America and Asia-Pacific regions. For the full year, the PPG-Comex architectural coatings business added over 200 additional concessionaries in Mexico. In the U.S. and Canada, same store sales volumes in company-owned architectural stores grew by a solid mid-single-digit percentage, while volumes in the independent dealer networks and national retail accounts (DIY) channels were flat versus the prior year marking an improvement versus prior quarters in The PPG Timeless product in the Home Depot continues to meet our targets and is being expanded to more locations during We expect a similar amount to be added in In the first quarter of 2018, we anticipate additional growth-related spending of up to $5 million to support the continued momentum in the region. Protective and marine coatings net sales were flat year-over-year. Sales volumes in Asia-Pacific were up a high-single-digit percentage driven by strong protective coatings sales growth in China offset by a highsingle-digit percentage, but moderating decrease in marine coatings. The business is expected to perform in-line with the market in the first quarter The positive trend of improved ship-building orders in Asia continued in the fourth quarter. Looking ahead, we expect raw material costs to remain elevated in the first-quarter 2018, at similar levels experienced in the fourth quarter. There will be no material benefit from acquisition-related sales in the segment, and, based on current exchange rates, foreign currency translation is expected to have a similar sequential favorable impact on segment sales and income in the first quarter Due to the timing of the Easter holiday, there is one fewer ship day in the first-quarter 2018 compared to first-quarter 2017, which is expected to unfavorably impact global architectural coatings sales volumes by about $20 to - $25 million in net sales. This unfavorable impact will reverse in the second quarter. Full-year segment net sales were approximately $8.7 billion, increasing by about 2 percent, or $152 million year-over-year, including favorable foreign currency translation of about $28 million, or less than 1 percent. Net sales in local currencies improved by more than 1 percent versus the prior year. Segment sales volumes were flat year-over-year and acquisition-related sales added about 1 percent, primarily from the Univer, DEUTEK, and Futian acquisitions. Segment income margins were flat at 15.2% year-over-year. The businesses in this segment experienced significant raw material inflation, which was countered with strong cost management and initial selling price initiatives. Looking ahead, further selling price increases in 2018 will be needed to offset more recent raw material inflation.

6 6 Industrial Coatings Industrial Coatings segment net sales for the fourth quarter were about $1.6 billion, up $121 million or more than 8 percent year-over-year, including favorable foreign currency translation of over 3 percent, or about $46 million. Segment sales volumes grew by more than 4 percent, and acquisition-related sales added approximately 2 percent, or about $27 million, primarily from The Crown Group. In the fourth quarter, year-overyear segment sales growth was positive in every major geographic region; however, aggregate selling prices were modestly lower, although some pricing traction was achieved versus the prior sequential quarter. Segment income of $212 million was down $24 million, or about 10 percent year-over-year, including favorable foreign currency translation of approximately $5 million primarily related to the Chinese yuan, the euro and the Mexican peso. Segment income benefited from higher sales volumes and lower manufacturing costs which were more than offset by elevating raw material costs and modestly lower selling prices. From a business unit perspective, sales volumes increased by a low-single-digit percentage in automotive OEM coatings versus the prior year, consistent with the overall global industry growth rate. PPG s growth outpaced regional industry growth rates in Mexico and South America and were in-line with the market in Europe and the Asia-Pacific region. Sales volumes declined in the U.S. and Canada, including the impact from weaker industry demand in the region. Global automotive industry growth is forecasted to be about 1 percent in the first quarter 2018 led by Europe and Mexico. In China, industry automotive production is expected to modestly decrease in the first quarter of 2018, reflecting the expiration of a small engine subsidy that had been in effect the past several years. PPG s general industrial and specialty coatings and materials businesses grew sales volumes by a midsingle-digit percentage year-over-year, marking eight consecutive quarters of above-market growth. Volumes grew in each major region, led by the U.S. and Canada, driven by strong end-market demand for heavy-duty equipment and electronics materials. Looking ahead, solid general industrial demand growth trends are expected to continue in aggregate, but remain mixed by geography and end-use market. PPG s market outperformance is expected to continue. Global packaging coatings sales volumes were up a high-single-digit percentage versus the prior year due to ongoing adoption of PPG s new can coating technologies. This above-market sales volume growth was balanced across all regions. We anticipate volume growth will continue due to the ongoing industry conversion to BPA non-intent interior can coatings, with PPG s year-over-year growth rates continuing at an above market level in Industrial coatings full year segment sales were $6 billion, up nearly 6 percent, including a modest favorable impact from foreign currency translation. Year-over-year sales volumes grew by 4 percent and acquisition-related sales added 4 percent, partially offset by lower selling prices. Segment income margins were lower by about $70 million, or 7 percent, versus the prior year, decreasing about 200 basis points versus Acquisition-related sales are expected to add approximately $30 million to first quarter 2018 segment sales and, based on current exchange rates, foreign currency translation is expected to have a similar sequential favorable impact on segment sales and income in the first quarter 2018.


7 7 Segment margin recovery continues to be a priority for Based on recent raw material inflation, segment margins recovery is expected to continue through the first half of All businesses in the segment have made progress with selling price initiatives and additional price increases have been announced for the early Also, efforts to reduce costs remain a key focus in Balance Sheet and Cash PPG ended the fourth quarter with about $1.5 billion in cash and short-term investments. Cash generated from continuing operations was more than $550 million in the fourth quarter, and totaled more than $1.5 billion for full-year. Approximate uses of cash for the fourth quarter and full-year were as follows: Capital expenditures were about $150 million in the quarter and approximately $350 million, or about 2.5 percent of sales, for the full year. We anticipate capital spending to be in the range of 2.5 -to- 3.0 percent of sales in Dividends paid were $113 million in the fourth quarter and about $435 million for the full-year. In July 2017, the company raised it is per share dividend by 13 percent. PPG has paid annual dividends for 118 consecutive years, including 46 consecutive years of increased annual payouts. Cash spending for 2017 acquisitions was about $325 million. This included the acquisitions of The Crown Group, DEUTEK, and Futian. PPG stock repurchases totaled approximately $400 million in the fourth quarter and about $815 million for the year. The company has about $3.6 billion remaining under its current share repurchase authorizations as of year-end. The company is committed to deploying a minimum of $2.4 billion in cash during 2018 for acquisitions and share repurchases Financial Assumptions For 2018, the company is providing the following financial assumptions based on information currently known that will affect 2018 financial results: Acquisitions made in 2017 and January 2018 are expected to add incremental 2018 sales of approximately $125 million, reflecting the flowthrough impact from acquisitions made in the 2017 calendar year. The acquisitions will contribute at or below their respective segment margins as they are fully integrated during Throughout 2017, a variety of major foreign currencies continued to strengthen versus the U.S. dollar, accelerating in the second half of the year. As a result, based on recent exchange

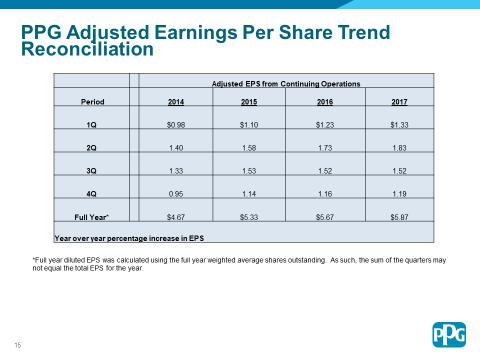
8 rates, the company expects that year-over-year foreign currency translation will favorably impact sales by $250 million -to- $300 million, and pre-tax income by about $25 million -to- $35 million, with greater favorable impacts in the first half 2018 due to the timing of the underlying 2017 currency increases. The company generally purchases raw materials, incurs manufacturing costs and sells finished products in the same currency, so it does not typically incur significant foreign currency-related transaction impacts. 8 The company initiated a business-restructuring program in December 2016 targeting $125 million in total run-rate annual savings once fully implemented. Execution against this program is expected to result in an additional $45 million -to- $50 million of cost savings in The company s 2018 effective tax rate on income from continuing operations is expected to be in the range of 23 -to- 24 percent. The comparable rate for 2017 was 24.4 percent. The decrease primarily relates to the new U.S. Tax Cuts and Jobs Act legislation enacted in December Other factors may affect the 2018 effective tax rate throughout the year, including changes to various tax regulations in the U.S. and abroad. Full Year Summary In summary for the full year, the company s adjusted earnings per diluted share from continuing operations was $5.87, an increase of about 4 percent versus the prior year including unfavorable foreign currency translation of $7 million. Full-year net sales increased by about 3 percent in local currencies, growing in each major geographic region of the world. Sales volumes increased over 1 percent versus the prior year, led by the Industrial Coatings segment. Acquisition-related sales added about 1 percent growth year-over-year. The company continued to perform well operationally with aggressive management of the overall cost structure, including benefits from the prior year restructuring program. Additionally, a 50 basis point improvement in year-over-year working capital was achieved. Working capital ratios have improved by a total of about 260 basis points during the past 3 years, despite numerous acquisitions which generally result in increases to working capital during integration. Strategically, business portfolio optimization continued including the acquisitions of The Crown Group and ProCoatings (January 2018). In addition, the company completed its multi-year strategic portfolio transformation with the sale of the North American Fiber Glass business. The company continues to have excellent financial flexibility with cash and short-term investments of about $1.5 billion at year-end. The company is committed to deploying a minimum of $2.4 billion of cash during 2018 on acquisitions and share repurchases as part of our previously communicated commitment to deploy $3.5 billion in 2017 and 2018 combined.
9 9
10 10 Forward-Looking Statements The Private Securities Litigation Reform Act of 1995 provides a safe harbor for forward-looking statements made by or on behalf of the Company. This presentation contains forward-looking statements that reflect the Company s current views with respect to future events and financial performance. You can identify forward-looking statements by the fact that they do not relate strictly to current or historic facts. Forward-looking statements are identified by the use of the words aim, believe, expect, anticipate, intend, estimate, project, outlook, forecast and other expressions that indicate future events and trends. Any forward-looking statement speaks only as of the date on which such statement is made, and the Company undertakes no obligation to update any forward looking statement, whether as a result of new information, future events or otherwise. You are advised, however, to consult any further disclosures we make on related subjects in our reports to the Securities and Exchange Commission. Also, note the following cautionary statements: Many factors could cause actual results to differ materially from the Company s forward-looking statements. Such factors include ongoing impacts of the natural disasters and their length and severity, any currently unanticipated future impacts from the natural disasters, global economic conditions, increasing price and product competition by foreign and domestic competitors, fluctuations in cost and availability of raw materials, the ability to achieve selling price increases, the ability to recover margins, the ability to maintain favorable supplier relationships and arrangements, the timing of and the realization of anticipated cost savings from restructuring initiatives, difficulties in integrating acquired businesses and achieving expected synergies therefrom, economic and political conditions in international markets, the ability to penetrate existing, developing and emerging foreign and domestic markets, foreign exchange rates and fluctuations in such rates, fluctuations in tax rates, the impact of future legislation, the impact of environmental regulations, unexpected business disruptions and the unpredictability of existing and possible future litigation. However, it is not possible to predict or identify all such factors. Consequently, while the list of factors presented here and under Item 1A of PPG s 2016 Form 10-K is considered representative, no such list should be considered to be a complete statement of all potential risks and uncertainties. Unlisted factors may present significant additional obstacles to the realization of forward-looking statements. Consequences of material differences in the results compared with those anticipated in the forward-looking statements could include, among other things, lower sales or earnings, business disruption, operational problems, financial loss, legal liability to third parties, other factors set forth in Item 1A of PPG s 2016 Form 10-K and similar risks, any of which could have a material adverse effect on the Company s consolidated financial condition, results of operations or liquidity. All of this information speaks only as of January 18, 2018, and any distribution of this presentation after that date is not intended and will not be construed as updating or confirming such information. PPG undertakes no obligation to update any forward-looking statement, except as otherwise required by applicable law.
PPG Industries, Inc. Fourth 2016 Financial Results Earnings Brief January 19, 2017
 PPG Industries, Inc. Fourth 2016 Financial Results Earnings Brief January 19, 2017 Fourth Quarter Financial Highlights PPG fourth quarter net sales from continuing operations of $3.5 billion were down
PPG Industries, Inc. Second Quarter 2017 Financial Results Earnings Brief July 20, 2017
 PPG Industries, Inc. Second Quarter 2017 Financial Results Earnings Brief July 20, 2017 Second Quarter Financial Highlights Net sales for the second quarter 2017 were $3.8 billion, increasing about 1 percent
PPG Industries, Inc. First 2018 Financial Results Earnings Brief April 19, 2018
 PPG Industries, Inc. First 2018 Financial Results Earnings Brief April 19, 2018 First Quarter Financial Highlights PPG first quarter net sales from continuing operations were approximately $3.8 billion,
PPG Industries, Inc. Second Quarter 2018 Financial Results Earnings Brief July 19, 2018
 PPG Industries, Inc. Second Quarter 2018 Financial Results Earnings Brief July 19, 2018 Second Quarter Financial Highlights PPG second quarter net sales from continuing operations were approximately $4.1
PPG Industries, Inc. Fourth Quarter 2018 Financial Results Earnings Brief January 17, 2019
 PPG Industries, Inc. Fourth Quarter 2018 Financial Results Earnings Brief January 17, 2019 Fourth Quarter Financial Highlights PPG fourth quarter net sales from continuing operations were approximately
PPG Fourth Quarter and Full Year 2017 Financial Results
 PPG Fourth Quarter and Full Year 2017 Financial Results Michael H. McGarry, Chairman and Chief Executive Officer Vincent J. Morales, Senior Vice President and Chief Financial Officer John Bruno, Director,
PPG Industries, Inc. Second 2016 Financial Results Earnings Brief July 21, 2016
 PPG Industries, Inc. Second 2016 Financial Results Earnings Brief July 21, 2016 Second Quarter 2016 Financial Highlights PPG net sales for the second quarter 2016 were $4.1 billion, down less than one
PPG Industries, Inc. Third 2016 Financial Results Earnings Brief October 20, 2016
 PPG Industries, Inc. Third 2016 Financial Results Earnings Brief October 20, 2016 Third Quarter 2016 Financial Highlights PPG net sales for the third quarter 2016 were $3.8 billion, up almost 2 percent
PPG Industries, Inc. First Quarter 2019 Financial Results Earnings Brief April 18, 2019
 PPG Industries, Inc. First Quarter 2019 Financial Results Earnings Brief April 18, 2019 First Quarter Financial Highlights PPG first quarter net sales from continuing operations were approximately $3.6
PPG Third Quarter 2017 Financial Results
 PPG Third Quarter 2017 Financial Results Michael H. McGarry, Chairman and Chief Executive Officer Vincent J. Morales, Senior Vice President and Chief Financial Officer John Bruno, Director Investor Relations
PPG Industries, Inc. Second Quarter 2015 Financial Results Earnings Brief July 16, 2015
 PPG Industries, Inc. Second Quarter 2015 Financial Results Earnings Brief July 16, 2015 Second Quarter Financial Highlights PPG net sales for the second quarter 2015 increased to $4.10 billion versus the
PPG Industries, Inc. Third Quarter 2015 Financial Results Earnings Brief October 15, 2015
 PPG Industries, Inc. Third Quarter 2015 Financial Results Earnings Brief October 15, 2015 Third Quarter Financial Highlights PPG net sales for the third quarter of 2015 were $3.87 billion versus the prior
First Quarter 2019 Financial Results
 First Quarter 2019 Financial Results Michael H. McGarry, Chairman and Chief Executive Officer Vincent J. Morales, Senior Vice President and Chief Financial Officer John Bruno, Director, Investor Relations
PPG Industries, Inc. Second Quarter 2014 Financial Results Earnings Brief July 17, 2014
 PPG Industries, Inc. Second Quarter 2014 Financial Results Earnings Brief July 17, 2014 Second Quarter Financial Summary PPG net sales from continuing operations for the second quarter increased to $4.1
Third Quarter 2018 Financial Results
 Third Quarter 2018 Financial Results Michael H. McGarry, Chairman and Chief Executive Officer Vincent J. Morales, Senior Vice President and Chief Financial Officer John Bruno, Director, Investor Relations
Fourth Quarter 2018 Financial Results
 Fourth Quarter 2018 Financial Results Michael H. McGarry, Chairman and Chief Executive Officer Vincent J. Morales, Senior Vice President and Chief Financial Officer John Bruno, Director, Investor Relations
News. PPG reports second quarter 2016 financial results
 News PPG Media Contact: Mark Silvey Corporate Communications +1-412-434-3046 silvey@ppg.com PPG Investor Contact: Scott Minder Investor Relations +1-412-434-3466 sminder@ppg.com www.ppg.com/investor PPG
News. PPG reports fourth quarter and full-year 2018 financial results
 News PPG Media Contact: Mark Silvey Corporate Communications +1-412-434-3046 silvey@ppg.com PPG Investor Contact: John Bruno Investor Relations +1-412-434-3466 jbruno@ppg.com investor.ppg.com PPG reports
PPG. Protecting and. Michael Beautifying H. McGarry the World Chairman and Chief Executive Officer. New York Nov. 28, 2017
 PPG Protecting and Michael Beautifying H. McGarry the World Chairman and Chief Executive Officer Citi Michael Basic Materials H. McGarry Conference New York Nov. 28, 2017 Forward Looking Statements The
PPG Frank S. Sklarsky Executive Vice President and Chief Financial Officer
 PPG Frank S. Sklarsky Executive Vice President and Chief Financial Officer Bank of America s 2016 Agriculture & Chemicals Conference Fort Lauderdale, FL Information current as of March 1, 2016 Forward
David Navikas Vice President and Controller
 David Navikas Vice President and Controller PPG Industries, Inc. New York City May 18, 2007 Forward-Looking Statement Statements contained herein relating to matters that are not historical facts are forward-looking
4Q 2018 Highlights and Operating Results. Products. Technology. Services. Delivered Globally.
 4Q 2018 Highlights and Operating Results Products. Technology. Services. Delivered Globally. Table of Contents Page 3 Safe Harbor Statement and Non-GAAP Financial Measures 4 Sales Overview 9 Overview of
FRANKLIN ELECTRIC REPORTS 2010 EARNINGS PER SHARE INCREASED 48 PERCENT FROM 2009
 For Immediate Release For Further Information Refer to: John J. Haines 260-824-2900 FRANKLIN ELECTRIC REPORTS 2010 EARNINGS PER SHARE INCREASED 48 PERCENT FROM 2009 Bluffton, Indiana February 28, 2011
2017 Third Quarter Business Review
 2017 Third Quarter Business Review (Unaudited) October 24, 2017 1 Earnings Conference Calls Q4: January 25, 2018 2018 Outlook Meeting December 12, 2017 8:00 a.m. - 12:00 p.m. EST 2 Forward looking statement
Q Earnings. July 26, 2017
 Q3 2017 Earnings July 26, 2017 Forward-Looking Statements and Non-GAAP Measures Forward-Looking Statements This presentation contains certain forward-looking statements within the meaning of the U.S. Private
Thank you and good morning everyone. Welcome to our third quarter 2017 business review.
 Q3 2017 Earnings Call Transcript Inge Thulin & Nicholas Gangestad October 24, 2017 Slide 1, Opening Bruce Jermeland, Director of Investor Relations Thank you and good morning everyone. Welcome to our third
Q Earnings. October 31, 2018
 Q4 2018 Earnings October 31, 2018 Forward-Looking Statements and Non-GAAP Financial Measures Forward-Looking Statements This presentation contains certain forward-looking statements within the meaning
Full-Year 2018 Investor Call
 Full-Year 2018 Investor Call Achieved 2018 core sales and 2018 EPS growth of 11% with continued growth expected in 2019 and beyond. We remain on track to fully achieve our Strategy and Capital Allocation
Q Earnings Call. April 24, 2013
 Q2 2013 Earnings Call April 24, 2013 Forward-Looking Statements and Non-GAAP Measures Forward-Looking Statements -- This presentation contains certain forward-looking statements within the meaning of the
CommScope Reports Fourth Quarter and Full Year 2018 Results
 CommScope Reports Fourth Quarter and Full Year 2018 Results February 21, 2019 Fourth Quarter 2018 Performance Sales of $1.06 billion GAAP operating income of $49 million Non-GAAP adjusted operating income
2017 First Quarter Business Review
 2017 First Quarter Business Review (Unaudited) April 25, 2017 1 Earnings Conference Calls Q2: July 25, 2017 Q3: October 24, 2017 2018 Outlook Meeting December 12, 2017 2 Upcoming 2017 investor events European
1Q 2018 Highlights and Operating Results
 1Q 2018 Highlights and Operating Results April 26, 2018 1 Table of Contents Page(s) 4 Announced Agreements to Acquire Australia and New Zealand Security Businesses 5-9 Sales Overview 10-17 Financial Performance
Our results at a glance
 Report for the first quarter 2014 AkzoNobel I Report for the first quarter 2014 2 AkzoNobel around the world Revenue by destination (44 percent in high growth markets) A North America B Emerging Europe
Webcast. Fourth Quarter Fiscal Year 2016 Results. Quarter ended February 26, 2016
 Webcast Fourth Quarter Fiscal Year Results Quarter ended February 26, Forward-looking statements From time to time, in written and oral statements, the company discusses its expectations regarding future
ITT reports 2017 fourth-quarter and full-year results, 2018 guidance
 ITT Inc. 1133 Westchester Ave. White Plains, NY 10604 tel 914 641 2000 Press Release ITT reports 2017 fourth-quarter and full-year results, 2018 guidance 2017 Full-Year Results: Revenue up 8% to $2.6 billion,
3Q 2018 Highlights and Operating Results. Products. Technology. Services. Delivered Globally.
 3Q 2018 Highlights and Operating Results Products. Technology. Services. Delivered Globally. Table of Contents Page 3 Safe Harbor Statement and Non-GAAP Financial Measures 4 Sales Overview 9 Overview of
Thank you, good morning everyone and welcome to our fourth quarter 2014 business review.
 Q4 2014 Earnings Call Transcript Inge Thulin & Nicholas Gangestad January 27, 2015 Slide 1, Opening Matt Ginter, Vice President, Investor Relations Thank you, good morning everyone and welcome to our fourth
Q Earnings. April 26, 2017
 Q2 2017 Earnings April 26, 2017 Forward-Looking Statements and Non-GAAP Measures Forward-Looking Statements This presentation contains certain forward-looking statements within the meaning of the U.S.
Q Investor Highlights. August 8, 2018
 Q2 2018 Investor Highlights August 8, 2018 Forward Looking Statements This document contains forward-looking statements, that is, information related to future, not past, events. Such statements generally
N O V E M B E R 2 0,
 N O V E M B E R 2 0, 2 0 1 8 This communication contains forward-looking statements as defined in the Securities Exchange Act of 1934 and is subject to the safe harbors created therein. These forward-looking
Second Quarter 2014 Earnings Call July 30, Ilene Gordon, Chairman and CEO Jack Fortnum, Chief Financial Officer
 Second Quarter 2014 Earnings Call July 30, 2014 Ilene Gordon, Chairman and CEO Jack Fortnum, Chief Financial Officer Forward-Looking Statements This presentation contains or may contain forward-looking
Fiscal Year 2016 Fourth Quarter Conference Call
 Fiscal Year 2016 Fourth Quarter Conference Call November 7, 2016 2 Safe Harbor Statement This presentation includes statements related to the expected future results of the company and are therefore forward-looking
Third Quarter Earnings November 8, 2018
 Third Quarter Earnings November 8, 2018 Forward Looking Statements & Disclosures Forward Looking Statement: With the exception of the historical information contained in this presentation, the matters
Axalta Coating Systems Ltd.
 Q1 2015 Conference Call May 6, 2015 Notice Regarding Forward Looking Statements, Non-GAAP Financial Measures and Defined Terms Forward-Looking Statements This presentation and the oral remarks made in
MTS REPORTS FISCAL YEAR 2017 FOURTH QUARTER AND FULL YEAR FINANCIAL RESULTS
 MTS Systems Corporation 14000 Technology Drive Eden Prairie, MN 55344-2290 Telephone 952-937-4000 Fax 952-937-4515 News Release FOR IMMEDIATE RELEASE November 27, 2017 MTS REPORTS FISCAL YEAR 2017 FOURTH
CommScope Reports Fourth Quarter 2017 Results
 CommScope Reports Fourth Quarter 2017 Results Fourth Quarter 2017 Performance o Sales of $1.12 billion, consistent with guidance o GAAP operating income of $92 million and non-gaap adjusted operating income
2016 THIRD-QUARTER EARNINGS REVIEW October 25, 2016
 2016 THIRD-QUARTER EARNINGS REVIEW October 25, 2016 0 THIRD-QUARTER EARNINGS PRESENTATION WHIRLPOOL CORPORATION ADDITIONAL INFORMATION This presentation contains forward-looking statements about Whirlpool
OWENS-ILLINOIS. Credit Suisse 2018 Basic Materials Conference
 OWENS-ILLINOIS Credit Suisse 2018 Basic Materials Conference ANDRES LOPEZ, CEO JAN BERTSCH, CFO SEPTEMBER 12, 2018 Safe harbor comments Forward-Looking Statements This document contains "forward-looking"
News Release. * See Non-GAAP Financial Information section of this release for further discussion
 News Release Ecolab Inc. 1 Ecolab Place, St. Paul, Minnesota 55102 FOR IMMEDIATE RELEASE Michael J. Monahan (651) 250-2809 Andrew C. Hedberg (651) 250-2185 ECOLAB THIRD QUARTER REPORTED DILUTED EPS $1.34
901 S. Central Expressway, Richardson, TX 75080
 901 S. Central Expressway, Richardson, TX 75080 FOSSIL GROUP REPORTS THIRD QUARTER RESULTS Net Sales Increase 18% to $810 Million Diluted EPS Increases 25% to $1.58 Maintains Full Year EPS Guidance and
Progress Software Corporation Second Quarter Fiscal 2010 Earnings Conference Call Prepared Remarks
 As previously announced, the conference call will be held Wednesday, June 23, 2010 at 9:00 am EDT and will include only brief comments followed by questions and answers. These prepared remarks will not
3M Reports Fourth-Quarter and Full-Year 2016 Results
 3M Reports Fourth-Quarter and Full-Year 2016 Results Fourth-Quarter Highlights: Sales of $7.3 billion, up 0.4 percent; organic local-currency increased 1.6 percent GAAP EPS of $1.88, up 13.3 percent year-on-year
CommScope Reports Fourth Quarter 2017 Results
 February 15, 2018 CommScope Reports Fourth Quarter 2017 Results Fourth Quarter 2017 Performance Sales of $1.12 billion, consistent with guidance GAAP operating income of $92 million and non-gaap adjusted
2Q 2017 Highlights and Operating Results
 2Q 2017 Highlights and Operating Results July 25, 2017 1 2Q 2017 Highlights and Operating Results Table of Contents Page(s) 1 Sales Overview and Highlights 4-5 2 NSS Overview 6-7 3 EES Overview 8-9 4 UPS
DuPont Segment Commentary
 This data should be read in conjunction with the Company s third quarter earnings news release dated October 22, and DuPont s 3Q Earnings Conference Call presentation materials posted on the Investor Center
Sanford Bernstein Conference Rockwell Automation
 Sanford Bernstein Conference Rockwell Automation Keith D. Nosbusch Chairman and CEO May 31, 2013 Rev 5058-CO900D Safe Harbor Statement This presentation contains statements (including certain projections
ACTUANT REPORTS THIRD QUARTER RESULTS; UPDATES FISCAL 2018 GUIDANCE
 For Immediate Release N86 W12500 Westbrook Crossing Menomonee Falls, WI 53051 Contact: Karen Bauer Communications & Investor Relations Leader 262-293-1562 ACTUANT REPORTS THIRD QUARTER RESULTS; UPDATES
Philip Morris International Inc Third-Quarter Results Conference Call October 19, 2017
 Philip Morris International Inc. 2017 Third-Quarter Results Conference Call October 19, 2017 NICK ROLLI (SLIDE 1.) Welcome. Thank you for joining us. Earlier today, we issued a press release containing
Earnings/News Release
 Earnings/News Release Avon Reports Fourth-Quarter and 2008 Results Fourth-Quarter Earnings Per Share Up 80% to $.54 Fourth-Quarter Total Revenue of $2.8 Billion 9% Lower; Up 2% on Local-Currency Basis
Fiscal 2018 Second Quarter
 Fiscal 2018 Second Quarter If you can read this Click on the icon to choose a Results picture or Reset the slide. To Reset: Right click on the slide thumbnail and select reset slide or choose the Reset
Third Quarter 2014 Earnings Release October 29, 2014
 Third Quarter 2014 Earnings Release October 29, 2014 Alexander M. Cutler Forward-looking Statements and Non-GAAP Financial Information This presentation or the comments we make on our call today may contain
Sealed Air Reports Fourth Quarter and Full Year 2018 Results
 Exhibit 99.1 Sealed Air Corporation 2415 Cascade Pointe Blvd. Charlotte, NC 28208 For release: February 7, 2019 Sealed Air Reports Fourth Quarter and Full Year 2018 Results Solid year-over-year sales and
4Q 2017 Highlights and Operating Results
 4Q 2017 Highlights and Operating Results January 30, 2018 1 4Q 2017 Highlights and Operating Results Table of Contents Page(s) 1 Sales Overview 4-8 2 Financial Performance Trends 9-16 3 Leverage Metrics
ECOLAB FOURTH QUARTER REPORTED DILUTED EPS $1.35 ADJUSTED DILUTED EPS $1.54, +12% 2019 ADJUSTED DILUTED EPS FORECAST $5.80 TO $6.
 News Release Ecolab Inc. 1 Ecolab Place, St. Paul, Minnesota 55102 FOR IMMEDIATE RELEASE Michael J. Monahan (651) 250-2809 Andrew C. Hedberg (651) 250-2185 ECOLAB FOURTH QUARTER REPORTED DILUTED EPS $1.35
Johnson Controls reports fiscal Q3 earnings with strong organic growth and underlying margin expansion
 FOR IMMEDIATE RELEASE CONTACT: Investors: Antonella Franzen (609) 720-4665 Ryan Edelman (609) 720-4545 Media: Fraser Engerman (414) 524-2733 Johnson Controls reports fiscal Q3 earnings with strong organic
2015 Shareholders Meeting
 2015 Shareholders Meeting PPG Industries, Inc. April 16, 2015 Key Topics Achievements in 2014 First Quarter 2015 Results Outlook and Focus 2 2 Improved 2014 Safety and Environmental Performance PPG Injury
Coty Inc. Reports Fiscal 2016 Fourth Quarter and Full Year Results
 Coty Inc. Reports Fiscal 2016 Fourth Quarter and Full Year Results Substantial Progress on P&G Beauty Brands Transaction and Brazil Acquisition Reported Operating, Net and EPS Impacted by Acquisition Costs
GENERAL MILLS REPORTS FISCAL 2019 FIRST-QUARTER RESULTS
 News/Information Investor Relations P. O. Box 1113 Minneapolis, MN 55440 FOR IMMEDIATE RELEASE September 18, 2018 Contact: (analysts) Jeff Siemon: 763-764-2301 (media) Kelsey Roemhildt: 763-764-6364 GENERAL
3rd Quarter 2018 Earnings Conference Call Transcript. October 31, 2018
 3rd Quarter 2018 Earnings Conference Call Transcript October 31, 2018 CORPORATE PARTICIPANTS John Stroup Belden, Inc. President, CEO, and Chairman Henk Derksen Belden, Inc. CFO, SVP Finance Kevin Maczka
Q Earnings Conference Call
 Q3 2016 Earnings Conference Call SAFE HARBOR FORWARD-LOOKING STATEMENTS All presentations contain certain forward-looking information within the meaning of the Private Securities Litigation Reform Act
ECOLAB FOURTH QUARTER 2018
 4Q 2018 Overview Sales: ECOLAB FOURTH QUARTER 2018 Reported sales +3%; fixed currency sales were +6%, with acquisition adjusted fixed currency sales +6%. Strong momentum continues as new business growth,
Financial Information
 Financial Information H1 revenues reached 12.8bn up 9.8%, flat org. in Q2 Adj. EBITA reached 1.6bn, up 6.4%, Adj. EBITA margin flat excl. Invensys in a challenging environment 2015 targets: Around flat
Diluted EPS $0.46 $0.46 0% $1.16 $1.26 (8)%
%") Donaldson Reports Third Quarter Results Donaldson Company, Inc. (NYSE: DCI) announced its financial results for its fiscal 2013 third quarter. Summarized financial results are as follows (dollars in millions,
Donaldson Reports Third Quarter Results Donaldson Company, Inc. (NYSE: DCI) announced its financial results for its fiscal 2013 third quarter. Summarized financial results are as follows (dollars in millions,
Second Quarter Review. 25 / April / 2014
 Second Quarter Review 25 / April / 2014 Forward-Looking Statements / Safe Harbor This presentation contains a number of forward-looking statements. In many cases forward-looking statements are identified
ECOLAB THIRD QUARTER 2018
 3Q 2018 Overview Sales: ECOLAB THIRD QUARTER 2018 Reported sales +5%; fixed currency sales were +6%, with acquisition adjusted fixed currency sales +7%. New business growth, share gains, pricing and new
ITT reports record 2018 second-quarter results Raises full-year EPS guidance
 ITT Inc. 1133 Westchester Ave. White Plains, NY 10604 tel 914 641 2000 Press Release ITT reports record 2018 second-quarter results Raises full-year EPS guidance 2018 Second-Quarter GAAP Results Record
XYLEM INC. Q EARNINGS RELEASE FEBRUARY 1, 2018
 XYLEM INC. Q4 2017 EARNINGS RELEASE FEBRUARY 1, 2018 Q4 2017 EARNINGS RELEASE FORWARD-LOOKING STATEMENTS This presentation contains information that may constitute forward-looking statements. Forward-looking
October 22, 2013 Media Contact: Patty Seif WILMINGTON, Del Investor Contact:
 October 22, 2013 Media Contact: Patty Seif WILMINGTON, Del. 302-774-4482 patricia.r.seif@dupont.com Investor Contact: 302-774-4994 DuPont Delivers 3Q 2013 Operating Earnings of $.45 per Share Sales Increase
3M Delivers Record Third-Quarter Sales and Earnings per Share; Company Increases Full-Year 2017 Outlook
 3M Delivers Record Third-Quarter Sales and Earnings per Share; Company Increases Full-Year 2017 Outlook Third-Quarter Highlights: Sales of $8.2 billion, up 6.0 percent year-on-year Organic local-currency
Mondelēz International Q Results. July 27, 2016
 Mondelēz International Q2 2016 Results July 27, 2016 1 Forward-Looking Statements This presentation contains a number of forward-looking statements. Words, and variations of words, such as will, expect,
A U G U S T 2 1,
 A U G U S T 2 1, 2 0 1 8 This communication contains forward-looking statements as defined in the Securities Exchange Act of 1934 and is subject to the safe harbors created therein. These forward-looking
McCormick & Company, Inc. 3rd Quarter 2017 Financial Results and Outlook September 28, 2017
 McCormick & Company, Inc. 3rd Quarter 2017 Financial Results and Outlook September 28, 2017 1 The following slides accompany a September 28, 2017 earnings release conference call. This information should
Second Quarter 2015 Conference Call
 Second Quarter 2015 Conference Call July 28, 2015 1 Forward Looking and Cautionary Statements Certain statements in this presentation constitute forward looking statements within the meaning of the US
Third Quarter 2017 Earnings Results
 POLARIS INDUSTRIES INC. Third Quarter 2017 Earnings Results October 24, 2017 SAFE HARBOR & NON-GAAP MEASURES Except for historical information contained herein, the matters set forth in this presentation,
14375 NW Science Park Drive Portland, OR April 29, 2014
 14375 NW Science Park Drive Portland, OR 97229 April 29, 2014 CFO Commentary on First Quarter 2014 Financial Results, Upward-Revised 2014 Pre-Acquisition Financial Outlook, and Agreement to Purchase prana
Fourth Quarter 2016 Earnings Release February 2, 2017
 Fourth Quarter 2016 Earnings Release February 2, 2017 Craig Arnold Forward-looking Statements and Non-GAAP Financial Information This presentation or the comments we make on our call today contain forward-looking
2015 First Quarter Business Review (unaudited) April 23, 2015
 April 23, 2015") 2015 First Quarter Business Review (unaudited) April 23, 2015 1 Forward Looking Statement This presentation contains forward-looking information about 3M's financial results and estimates and business
2015 First Quarter Business Review (unaudited) April 23, 2015 1 Forward Looking Statement This presentation contains forward-looking information about 3M's financial results and estimates and business
Q Earnings. April 20, 2016
 Q2 2016 Earnings April 20, 2016 Forward-Looking Statements and Non-GAAP Measures Forward-Looking Statements This presentation contains certain forward-looking statements within the meaning of the U.S.
3M Posts First-Quarter Sales of $7.4 Billion and GAAP EPS of $2.05
 3M Posts First-Quarter Sales of $7.4 Billion and GAAP EPS of $2.05 First-Quarter Highlights: Company adopts new FASB accounting standard, which added $0.10, net, to EPS Operating income margins up 1.3
W. R. Grace & Co. Fourth Quarter 2014 Business Update. Investor Presentation February 5, 2015
 W. R. Grace & Co. Fourth Quarter Business Update Investor Presentation February 5, 2015 Disclaimer Statement Regarding Safe Harbor For Forward-Looking Statements This presentation contains forward-looking
XYLEM INC. Q EARNINGS RELEASE OCTOBER 30, 2018
 XYLEM INC. Q3 2018 EARNINGS RELEASE OCTOBER 30, 2018 Q3 2018 EARNINGS RELEASE FORWARD-LOOKING STATEMENTS This presentation contains information that may constitute forward-looking statements. within the
Q Earnings. January 23, 2019
 Q1 2019 Earnings January 23, 2019 Forward-Looking Statements and Non-GAAP Financial Measures Forward-Looking Statements This presentation contains certain forward-looking statements within the meaning
THIRD QUARTER REPORT Period Ended September 30, Management s Discussion and Analysis and Unaudited Consolidated Financial Statements
 THIRD QUARTER REPORT Period Ended 2010 Management s Discussion and Analysis and Unaudited Consolidated Financial Statements MANAGEMENT S DISCUSSION AND ANALYSIS This management s discussion and analysis
Allegion Fourth-Quarter 2017 Results. February 20, 2018
 Allegion Fourth-Quarter 2017 Results February 20, 2018 Safe Harbor This presentation contains "forward-looking statements" within the meaning of the Private Securities Litigation Reform Act of 1995, including
Third Quarter Report Period Ended September 30, Management s Discussion and Analysis and Unaudited Consolidated Financial Statements
 Third Quarter Report Period Ended September 30, 2017 Management s Discussion and Analysis and Unaudited Consolidated Financial Statements Management s Discussion and Analysis This management s discussion
Third Quarter 2017 Conference Call. October 27, 2017
 Third Quarter 2017 Conference Call October 27, 2017 Forward-Looking Statements Certain information contained in this presentation constitutes forward-looking statements for purposes of the safe harbor
Fiscal 2012 First Quarter Earnings Call
 Fiscal 2012 First Quarter Earnings Call December 21, 2011 Bob Arzbaecher, Chairman and CEO Mark Goldstein, COO Andy Lampereur, CFO Karen Bauer, Investor Relations Safe Harbor Statements in this presentation
Q Earnings. July 20, 2016
 Q3 2016 Earnings July 20, 2016 Forward-Looking Statements and Non-GAAP Measures Forward-Looking Statements This presentation contains certain forward-looking statements within the meaning of the U.S. Private
3M Reports Third-Quarter 2018 Results
 3M Reports Third-Quarter 2018 Results Third-Quarter Highlights: Sales of $8.2 billion, down 0.2 percent year-on-year Organic local-currency sales growth of 1.3 percent GAAP EPS of $2.58 vs. $2.33 last
Q4 & Full Year 2017 Financial Results
 Exhibit 99.2 Q4 & Full Year 2017 Financial Results February 6, 2018 Legal Notices Forward-Looking Statements This presentation and the oral remarks made in connection herewith may contain forward-looking