PPG Industries, Inc. Fourth 2016 Financial Results Earnings Brief January 19, 2017
|
|
|
- Austin Mason
- 5 years ago
- Views:
Transcription


1 PPG Industries, Inc. Fourth 2016 Financial Results Earnings Brief January 19, 2017 Fourth Quarter Financial Highlights PPG fourth quarter net sales from continuing operations of $3.5 billion were down more than one percent versus the prior year. Net sales in local currencies grew by more than one percent year-over-year, aided by aggregate coatings sales volumes that were nearly 2 percent higher than the prior year. Sales volume improvement was driven by emerging regions growth, led by China and Latin America. Acquisition-related sales added more than one percent, or about $50 million, but were partially offset by the absence of sales from the divested European fiber glass business. These aggregate increases in net sales were more than offset by unfavorable foreign currency translation of about 3 percent, or about $100 million, primarily due to the Mexican peso, the Chinese yuan, the British pound and the euro. More detailed sales comparisons for the company and each reporting segment are included on subsequent presentation slides. Year-over-year adjusted earnings per diluted share from continuing operations were $1.19, an increase of about 3 percent versus the prior year, including the unfavorable impact of foreign currency translation. This increase, achieved despite modest and uneven global economic growth, was driven by higher Industrial Coatings segment sales volumes, lower overall costs, including the benefits from prior-year business restructuring, and acquisition-related income. The improvement in adjusted earnings per diluted share was also supplemented by continued cash deployment. In December 2016, the company initiated a nearly $200 million, geographically broad-based business restructuring program. Once fully implemented, this program is expected to generate approximately $125 million in annual savings, with $40 -to- $50 million targeted for In the fourth quarter, PPG deployed about $650 million on share repurchases, representing nearly 7 million shares repurchased. PPG continued its business portfolio optimization efforts with the acquisitions of Univer, an Italian architectural paint supplier, and Deutek, a leading Romanian architectural coatings supplier that closed in early January 2017, as well as completing the divestitures of several non-core glass businesses during the quarter. The divested businesses included flat glass, European fiber glass and ownership interests in two Asian fiber glass joint ventures. The company continues to have excellent financial flexibility with cash and short-term investments of about $1.9 billion at year-end, including the benefit from over $1 billion in gross cash proceeds from the non-core business divestitures divested in the quarter.


2 2 PPG Fourth Quarter Net Sales PPG fourth quarter net sales of $3.5 billion declined by more than one percent, or $55 million year-over-year, including unfavorable foreign currency translation of approximately $100 million. Local currency sales increased by more than one percent. Sales volumes increased 1.5 percent year-overyear, including a 1.7 percent increase from aggregate coatings segment volume growth partly offset by lower Glass segment volumes. This marks the second consecutive quarter with global growth approaching 2 percent, and was led by the Industrial Coatings segment. This volume growth occurred despite solid growth in the prior-year comparable period. Acquisition-related sales are primarily from the MetoKote and Univer acquisitions which were partially offset by the absence of sales from the divested European fiber glass business. These net changes related to our business portfolio optimization efforts contributed less than one percent to fourth quarter 2016 sales growth. Unfavorable foreign currency translation reduced sales by about 3 percent year-over-year, as the continued decline of many currencies versus the U.S. dollar accelerated after the U.S. presidential election in November The steepest decline occurred in the Mexican peso, which deteriorated by about 15 percent year-over-year in the three-month average rate. In addition, most other major foreign currencies generated unfavorable foreign currency translation impacts including the euro, the Chinese yuan and the British pound. Based on current exchange rates, the unfavorable year-over-year effect of foreign currency translation on first quarter 2017 is expected to be similar to the fourth quarter Net Sales Volume Trends - Coatings Segments Aggregate global coatings segment sales volumes grew by nearly 2 percent for the second straight quarter, adding to the growth achieved in the prior-year comparable period. In the U.S. and Canada region, sales volumes declined modestly versus the prior year. Results remained mixed by business unit with continued above-market regional growth in packaging coatings due to continued new PPG technology adoption by customers. Regional sales volumes in general industrial coatings grew modestly after declining in the prior sequential quarter due to demand improvements in various end-use markets. Sales volumes declined in automotive original equipment manufacturer (OEM) coatings year-over-year, partly due to lower regional industry builds. In architectural coatings, sales volume growth continued in the company-owned stores network but was offset by sales volume declines in the independent dealer channel and at certain national retail accounts.

3 Sales volumes returned to broad-based, low-single-digit percentage growth in the Europe, Middle East, and Africa (EMEA) region after being flat in the third quarter 2016, led by demand for PPG s products in automotive OEM, general industrial, and automotive refinish coatings. While sales volumes were flat in architectural coatings and down slightly in packaging coatings, both results were in line with industry demand patterns. Sales volumes in Asia-Pacific grew by a mid-to-high-single digit percentage year-over-year, consistent with the prior sequential quarter s growth rate. Sales volume gains were led by above-market growth in general industrial, automotive OEM, packaging coatings, and automotive refinish coatings. From a country and sub-region perspective, sales volumes grew in China, India, and Southeast Asia versus the prior year, but decreased in Korea due to declining marine shipbuilding activity. In Latin America, sales volumes advanced by a mid-single-digit percentage year-over-year with growth in most businesses led by above-market growth in architectural, automotive OEM, and general industrial coatings. Within the region, sales volumes continued to expand in Mexico and Central America, along with a shift to modest growth in Brazil. PPG Full Year Net Sales PPG s full-year net sales totaled approximately $14.8 billion, consistent with the prior year. Acquisition-related sales benefited net sales by 1.9 percent primarily due to the partial-year sales from businesses acquired during 2015, including Revocoat, IVC Industrial Coatings, Le Joint Français, and Cuming Microwave as well as the 2016 acquisitions of MetoKote and Univer. Year-over-year sales volumes, excluding acquisition-related sales, grew 1 percent, led by growth in Asia and Europe. From a business unit perspective, general industrial, automotive OEM, packaging, and automotive refinish coatings provided the largest contributions to the overall company sales volume gains. Foreign currency translation unfavorably impacted net sales by almost 3 percent due to the weakening of major currencies against the U.S. dollar, most notably the Mexican peso, the British pound and the Chinese yuan. This weakening accelerated in the second half of 2016 after the U.K. s vote to exit the European Union and the U.S. presidential election. In 2016, overall pricing for the company declined a very modest three-tenths of one percent versus the prior year. The company s 2016 regional sales mix was consistent with prior-year results after notable mix changes that occurred in These prior year changes included an increase in Latin America from 5 percent to 10 percent, primarily due to the addition of Comex, and a decline in EMEA below 30 percent mainly due to the impact of foreign currency translation. Lastly, PPG s business mix by segment shifted from approximately 93 percent coatings in 2015, as originally reported, to about 97 percent coatings at the end of This change reflects ongoing business portfolio optimization efforts, with the shift this year primarily due to the divestiture of the flat glass business. The Glass segment includes European fiber glass business sales for the first 9 months of 2016, as the business was divested on October 1,


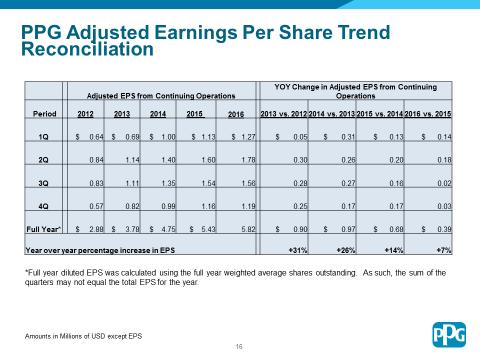
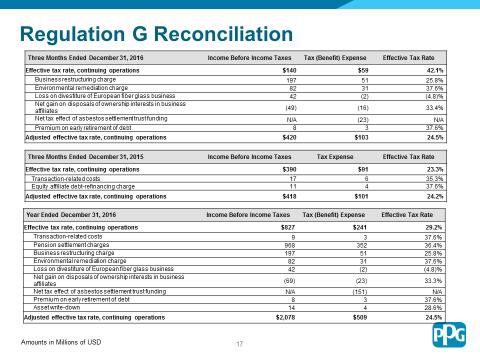
4 PPG Adjusted Earnings Per Diluted Share Fourth quarter 2016 adjusted earnings per diluted share from continuing operations of $1.19 increased 3 cents, or 3 percent, over the prior year. This earnings improvement was aided by coatings sales volume growth approaching 2 percent as well as by lower costs, including the benefits of business restructuring. These improvements were partially offset by unfavorable foreign currency translation. Fourth quarter adjusted earnings per diluted share from continuing operations excludes aftertax charges totaling $236 million, or $0.90 per diluted share. These after-tax charges include: $146 million for business restructuring; $51 million for increases to legacy environmental reserves; $23 million for tax true-ups related to the asbestos settlement funding; $5 million for a premium on the early retirement of debt; and $44 million for the loss on the sale of the European fiber glass business offset by a $33 million net gain on the disposals of ownership interests in business affiliates. The effective tax rate was 42.1 percent for the fourth quarter 2016 and the adjusted effective tax rate was 24.5 percent, up from 24.2 percent in the prior-year quarter, but consistent with prior company guidance. The increase in the adjusted effective tax is due to a shift in the mix of earnings toward higher tax rate jurisdictions. Full-year adjusted earnings per diluted share from continuing operations was $5.82, up 7 percent versus the prior year. The effective full-year tax rate was 29.1 percent and the adjusted effective full-year tax rate was 24.5 percent versus 24.1 percent in Adjusted earnings per diluted share growth continued despite operating in modest and uneven global economic conditions throughout the year and the significant unfavorable impact from foreign currency translation. This earnings per share growth reflects sales volume growth benefits, strong cost management, and the measurable impact from strategic cash deployment. A detailed reconciliation of the fourth quarter and full year adjusted earnings per diluted share figures for all periods presented is included in the presentation materials appendix. Performance Coatings Performance Coatings segment net sales for the fourth quarter were approximately $2.0 billion, down $80 million, or less than 4 percent, versus the prior year, and included unfavorable foreign currency translation of $70 million, or more than 3 percent. Sales in local currencies were down less than one percent year-overyear. Segment sales volumes declined less than one percent versus the prior year, with growth in Latin America more than offsetting a decline in Asia-Pacific primarily related to weakness in marine shipbuilding. Acquisitionrelated sales provided a modest $10 million benefit versus the prior year. Fourth quarter segment income was $239 million, down $11 million, or 4 percent, year-over-year, including unfavorable impact from foreign currency translation of about $15 million, primarily related to 4
5 5 the Mexican peso, the euro and the British pound. Segment income in local currency increased by $4 million, or about 2 percent, primarily due to continued cost management, including benefits from prior year business restructuring, which more than offset the unfavorable income impact from modestly lower sales volumes. From a business unit perspective, automotive refinish coatings continued to deliver organic volume growth, led by expanding end-use market demand in Europe which improved after a sluggish prior sequential quarter. Automotive refinish organic sales increased in most major regions year-over-year as customers continued to adopt PPG s industry-leading technologies. We expect this trend to continue in the first quarter Aerospace coatings sales volumes were in line with the prior year as industry demand growth was modest. We anticipate similar trends in first quarter 2017 as overall industry demand remains tepid despite solid commercial airliner industry build rates. Architectural coatings EMEA sales volumes were consistent with the prior year as growth in Europe, led by the U.K., Ireland, and the Benelux countries was offset by reduced demand levels in Africa, where economies are closely linked to depressed commodity prices. The overall sales volume growth trend is expected to improve modestly in the first quarter 2017, with results remaining uneven by country. Acquisition-related sales from Univer in Italy added about $10 million in the fourth quarter. Architectural coatings Americas and Asia-Pacific sales in local currency increased by a low-single-digit percentage versus prior year. Sales volumes were positive year-over-year in the U.S. and Canada company-owned store network, as well as in Mexico, Central America, China, Australia, and Brazil. These gains were partially offset by declines in the U.S. and Canada independent dealer channel and at certain national retail accounts. We anticipate that current trends will continue in the seasonally-low first quarter Protective and marine coatings net sales were down a low double-digit percentage year-over-year due to further weakness in marine shipbuilding, largely concentrated in Asia-Pacific. Protective coatings sales growth continued in the U.S. and Canada as well as in Mexico and Central America due to increased waterproofing product demand. The business is expected to continue to experience sales volume declines in aggregate for the first quarter 2017 as marine shipbuilding declines continue to more than offset protective coatings gains. Looking forward, acquisition-related sales are expected to add approximately $10 million to segment sales in first quarter Additionally, based on current exchange rates, we expect foreign currency translation on segment sales and income to be a similar headwind as experienced in the fourth quarter Full-year segment net sales were approximately $8.6 billion, declining by 2 percent, or $185 million yearover-year, including unfavorable foreign currency translation of about $260 million, or 3 percent. Net sales in local currencies improved by one percent versus the prior year. Segment sales volumes were flat year-over-year and acquisition-related sales added about one percent, primarily due to the aerospace-related Le Joint Français and Cuming Microwave acquisitions. Segment income margins expanded by 40 basis points as segment income grew to over $1.3 billion, up one percent, driven by lower overall costs, including the benefits from prior-year business restructuring, and despite unfavorable foreign currency translation.

6 6 Industrial Coatings Industrial Coatings segment net sales for the fourth quarter were more than $1.4 billion, up $66 million or about 5 percent year-over-year, including unfavorable foreign currency translation of 2 percent, or about $30 million. Segment sales volumes grew about 5 percent and acquisition-related sales added approximately 3 percent, or about $40 million. Year-over-year segment sales growth was positive in every major region. Fourth quarter segment income of $236 million was down $4 million, or less than 2 percent year-over-year, including unfavorable foreign currency translation of approximately $10 million, or about 4 percent, primarily related to the Chinese yuan, the euro and the Mexican peso. Segment income benefitted from higher sales volumes and lower manufacturing costs. Acquisition-related sales from MetoKote also added to segment income, but at an expected margin level that is currently below the segment s average margin. These increases to segment income were offset by higher transportation and logistics costs required to meet increasing customer demands in Asia-Pacific, and are expected to continue into the first quarter PPG s global automotive OEM business grew sales volumes at a mid-single-digit percentage in aggregate, consistent with the overall global industry growth rate. PPG s growth outpaced regional industry growth rates in Asia-Pacific, specifically China, Latin America and Europe. Volumes declined in the U.S. and Canada consistent with recent company trends and due in-part to modestly lower industry vehicle builds versus prior year. Global automotive industry growth is anticipated to be about 2 percent in the first quarter 2017 led by Europe and Mexico, with continued declines in the U.S. and Canada. PPG s general industrial and specialty coatings and materials businesses grew sales volumes by a midsingle-digit percentage year-over-year, marking 4 consecutive quarters of above-market growth. Volumes were positive in each major region, led by Asia-Pacific and Latin America from a geographic perspective, and were driven by strong end-market demand for automotive components, electronics materials, and coil and extrusion coatings products. Acquisition-related sales from MetoKote, acquired in July 2016, continued to provide a benefit, adding approximately $40 million in sales in the fourth quarter. Looking ahead, we expect moderate general industrial demand growth trends to continue in aggregate but remain mixed by geography and end-use market. Global packaging coatings sales volumes were up a mid-to-high-single digit percentage versus prior year due to ongoing adoption of PPG s new can coating technologies and were achieved despite strong growth in the prior-year comparable period. This above-market sales volume growth was led by U.S. and Canada and Asia-Pacific regions. We anticipate sales volume growth will continue due to the ongoing industry conversion to BPA non-intent interior can coatings with PPG s year-over-year growth rates moderating slightly due to our strong high-single-digit percentage growth in Looking ahead, we expect MetoKote acquisition-related sales to add approximately $50 million in the first quarter 2017 and the unfavorable impact from foreign currency translation to be similar to the levels experienced in fourth quarter Industrial coatings full year segment sales were approximately $5.7 billion, up 4 percent, including a 2 percent headwind from foreign currency translation. Sales volumes grew by 3 percent year-over-year,


7 7 and acquisition-related sales added 4 percent for the full-year. Segment income was more than $1.0 billion, up 6 percent, including unfavorable foreign currency translation of more than 2 percent. Contributing to the increased segment income were higher sales volumes and lower overall costs, including the benefits from prior-year business restructuring. Segment income margins continued to improve, increasing 30 basis points versus Glass Glass segment fourth quarter net sales were $80 million, down $41 million or 34 percent year-over-year primarily due to the divestiture of the European fiber glass business on October 1, Sales volumes for the North American fiber glass business declined about 3 percent versus prior year due to lower demand for PPG s wind-energy-related products as well as for other composite and industrial materials. Increased customer demand for constructionrelated products served as a partial offset. Foreign currency translation had little impact on the segment as the majority of the remaining fiber glass business is U.S.-based. In addition to the European fiber glass divestiture, in the fourth quarter of 2016 PPG completed the sale of its flat glass business and its ownership interests in 2 Asian-based fiber glass joint ventures. Segment income in the quarter was $12 million, up $1 million or 9 percent, with segment margins improving nearly 600 basis points year-over-year due to significant structural cost improvements. These improvements in segment income and margin were achieved despite the absence of results from the divested fiber glass business and joint ventures. Looking forward, we expect a similar industry demand environment and consistent PPG sales sequentially due to normal business seasonality. Year-over-year comparisons in 2017 will continue to reflect the absence of sales and income from the divested European fiber glass business and 2 fiber glass joint ventures until their one-year anniversaries in the fourth quarter We do not anticipate any significant impact from foreign currency translation. On a full-year basis, Glass segment sales were $481 million, down about 8 percent or $44 million. This decline was mainly due to the sale of the European fiber glass business in the fourth quarter Segment sales volumes were flat versus the prior year and unfavorable foreign currency translation impacted the segment by about one percent. Segment income was $53 million, up 39 percent or $15 million versus the prior year figure primarily due to strong cost-management efforts. Full-year margins expanded nearly 400 basis points year-over-year. Cash PPG ended the fourth quarter with about $1.9 billion in cash and short-term investments, including the benefit of over $1 billion of gross proceeds from the business divestitures closed in the quarter. Cash generated from continuing operations was almost $600 million in the fourth quarter, and totaled $1.2 billion for full-year

8 including a reduction of approximately $800 million pre-tax from fully funding of the Pittsburgh Corning asbestos trust in third quarter Excluding the trust funding impact, cash flow from continuing operations was higher than the prior year. Approximate uses of cash for the fourth quarter and full-year were as follows: Capital expenditures were about $145 million in the quarter and approximately $400 million, or about 2.7 percent of sales, for the full year. Capital expenditures were below initial full-year expectations of 3.0 -to- 3.5 percent of sales reflecting spending discipline due to low economic growth. We anticipate capital spending to be in the range of 3.0 -to- 3.5 percent of sales in Dividends paid were $105 million in the fourth quarter and about $415 million for the full-year. In April 2016, the company raised its per share dividend by 11 percent. PPG has paid annual dividends for 117 consecutive years, including 45 consecutive years of increased annual payouts. Cash spending for 2016 acquisitions was about $350 million. This included the acquisitions of MetoKote and Univer. PPG stock repurchases totaled approximately $650 million in the fourth quarter and $1.05 billion for the year. The company has about $1.9 billion remaining under its current share repurchase authorization as of year-end. The company deployed more than $2.5 billion on acquisitions and share repurchases, achieving the topend of its previously communicated earnings-accretive cash deployment range for 2015 and 2016 combined. The company announced a new cash deployment range of $2.5 billion -to- $3.5 billion for acquisitions and share repurchases for the 2-year period of 2017 and 2018 combined Financial Assumptions For 2017, the company is providing the following financial assumptions based on information currently known that will affect 2017 financial results: Acquisitions made in 2016 and January 2017 are expected to add incremental 2017 sales of approximately $180 million, reflecting the flowthrough impact from acquisitions made in the 2016 calendar year. The acquisitions will contribute at or below respective segment margins as they are fully integrated during The absence of about $140 million of sales divested with the European fiber glass business will serve as a partial offset. Throughout 2016, a variety of major foreign currencies continued to weaken versus the U.S. dollar, accelerating their declines in the second half of the year. As a result, based on recent exchange rates, the company expects that year-over-year foreign currency translation will unfavorably impact sales by $375 million -to- $425 million, and pre-tax income by about $70 million -to- $90 million, with higher negative impacts in the first half 2017 due to the timing of the underlying 2016 currency declines. The company generally purchases raw materials, incurs manufacturing costs and sells finished products in the same currency, so it does not typically incur significant foreign currency-related transaction impacts

9 9 The company initiated a business restructuring program in December 2016 targeting $125 million in total run-rate annual savings once fully implemented. We anticipate that this program will generate $40 -to- $50 million in savings in The company s pension and other post-employment benefits ( OPEB ) expenses are expected to decrease $15 -to- $20 million in 2017 versus the prior year. This decrease primarily stems from the carryover benefits related to a third quarter 2016 design change in the company s U.S. postretirement medical plan. The decreased expense will be recognized ratably across the first half of The company expects approximately $5 million of higher net interest expense for 2017 versus the prior year as slightly higher debt levels throughout the year will be partly offset by an improvement in the interest rate profile of the overall debt portfolio. The company s 2017 effective tax rate on income from continuing operations is expected to be in the range of to percent. The comparable rate for 2016 was 24.5 percent. The increase primarily relates to a shift in the mix of earnings to higher tax rate jurisdictions. Other factors may impact the 2017 effective tax rate throughout the year, including changes to various tax regulations in the U.S. and abroad. The company announced a new cash deployment range of $2.5 -to- $3.5 billion in years 2017 and 2018 combined, through a combination of acquisitions and share repurchases. Full Year Summary In summary for the full year, the company generated adjusted earnings per diluted share from continuing operations of $5.82, an increase of 7 percent versus the prior year including unfavorable foreign currency translation. Fullyear net sales increased by about 3 percent in local currencies, growing in both the Performance Coatings and Industrial Coatings segments and in each major region of the world. Sales volumes increased approximately one percent, led by the Industrial Coatings segment. Acquisition-related sales added about 2 percent growth year-over-year, with significant contributions from Revocoat, Le Joint Français, IVC Industrial Coatings, Cuming Microwave, and MetoKote. The company continued to perform well operationally, including aggressive management of the overall cost structure, including benefits from the prior year restructuring program. Additionally, a 120 basis point improvement in year-over-year working capital was achieved, aided by overall inventory reductions. Working capital ratios have improved by an annual average of more than 100 basis points over the past 4 years despite numerous acquisitions, which generally increases working capital during integration. The company initiated a new restructuring program in December This new cost reduction program targets $125 million in annual cost savings upon full implemented. Approximate expected savings for 2017 are $40 -to- $50 million from this program.
10 Strategically, business portfolio optimization continued including the acquisitions of MetoKote, Univer and Duetek (January 2017), as well as the divestitures of flat glass business, European fiber glass business, and its ownership interests in 2 Asian fiber glass joint ventures. Combined, these divestures generated gross cash proceeds of over $1 billion. Cash deployment for acquisitions and share repurchases accelerated in 2016 to $1.4 billion including $350 million on acquisitions and $1.05 billion on share repurchases. The 2016 cash deployment, combined with the approximately $1.1 billion deployed in 2015, brought the company s two-year total to more than $2.5 billion, which represented the top-end of the company s previously announced range for acquisitions and share repurchases. Full-year cash dividend payments totaled about $415 million. The company increased its quarterly dividend by 11 percent in April PPG has paid dividends for 117 consecutive years, and raised the annual dividend payout for 45 consecutive years. The company continues to have excellent financial flexibility with cash and short-term investments of about $1.9 billion at year-end which benefitted from proceeds from the business divestitures. The company established a new cash deployment target of $2.5 -to- $3.5 billion for years 2017 and 2018 combined, on acquisitions and share repurchases. 10

11 11
12 12 Forward-Looking Statements The Private Securities Litigation Reform Act of 1995 provides a safe harbor for forward-looking statements made by or on behalf of the Company. This presentation contains forward-looking statements that reflect the Company s current views with respect to future events and financial performance. You can identify forward-looking statements by the fact that they do not relate strictly to current or historic facts. Forward-looking statements are identified by the use of the words aim, believe, expect, anticipate, intend, estimate, project, outlook, forecast and other expressions that indicate future events and trends. Any forward-looking statement speaks only as of the date on which such statement is made, and the Company undertakes no obligation to update any forward looking statement, whether as a result of new information, future events or otherwise. You are advised, however, to consult any further disclosures we make on related subjects in our reports to the Securities and Exchange Commission. Also, note the following cautionary statements: Many factors could cause actual results to differ materially from the Company s forward-looking statements. Such factors include global economic conditions, increasing price and product competition by foreign and domestic competitors, fluctuations in cost and availability of raw materials, the ability to maintain favorable supplier relationships and arrangements, the timing of and the realization of anticipated cost savings from restructuring initiatives, difficulties in integrating acquired businesses and achieving expected synergies therefrom, economic and political conditions in international markets, the ability to penetrate existing, developing and emerging foreign and domestic markets, foreign exchange rates and fluctuations in such rates, fluctuations in tax rates, the impact of future legislation, the impact of environmental regulations, unexpected business disruptions and the unpredictability of existing and possible future litigation. However, it is not possible to predict or identify all such factors. Consequently, while the list of factors presented here and under Item 1A of PPG s 2015 Form 10-K is considered representative, no such list should be considered to be a complete statement of all potential risks and uncertainties. Unlisted factors may present significant additional obstacles to the realization of forwardlooking statements. Consequences of material differences in the results compared with those anticipated in the forward-looking statements could include, among other things, lower sales or earnings, business disruption, operational problems, financial loss, legal liability to third parties, other factors set forth in Item 1A of PPG s 2015 Form 10-K and similar risks, any of which could have a material adverse effect on the Company s consolidated financial condition, results of operations or liquidity. All of this information speaks only as of January 19, 2017, and any distribution of this release after that date is not intended and will not be construed as updating or confirming such information. PPG undertakes no obligation to update any forward-looking statement, except as otherwise required by applicable law.
PPG Industries, Inc. Fourth 2017 Financial Results Earnings Brief January 18, 2018
 PPG Industries, Inc. Fourth 2017 Financial Results Earnings Brief January 18, 2018 Fourth Quarter Financial Highlights PPG fourth quarter net sales from continuing operations were approximately $3.7 billion,
PPG Industries, Inc. Third 2016 Financial Results Earnings Brief October 20, 2016
 PPG Industries, Inc. Third 2016 Financial Results Earnings Brief October 20, 2016 Third Quarter 2016 Financial Highlights PPG net sales for the third quarter 2016 were $3.8 billion, up almost 2 percent
PPG Industries, Inc. Second 2016 Financial Results Earnings Brief July 21, 2016
 PPG Industries, Inc. Second 2016 Financial Results Earnings Brief July 21, 2016 Second Quarter 2016 Financial Highlights PPG net sales for the second quarter 2016 were $4.1 billion, down less than one
PPG Industries, Inc. Second Quarter 2017 Financial Results Earnings Brief July 20, 2017
 PPG Industries, Inc. Second Quarter 2017 Financial Results Earnings Brief July 20, 2017 Second Quarter Financial Highlights Net sales for the second quarter 2017 were $3.8 billion, increasing about 1 percent
PPG Industries, Inc. Second Quarter 2015 Financial Results Earnings Brief July 16, 2015
 PPG Industries, Inc. Second Quarter 2015 Financial Results Earnings Brief July 16, 2015 Second Quarter Financial Highlights PPG net sales for the second quarter 2015 increased to $4.10 billion versus the
PPG Industries, Inc. Fourth Quarter 2018 Financial Results Earnings Brief January 17, 2019
 PPG Industries, Inc. Fourth Quarter 2018 Financial Results Earnings Brief January 17, 2019 Fourth Quarter Financial Highlights PPG fourth quarter net sales from continuing operations were approximately
PPG Industries, Inc. Third Quarter 2015 Financial Results Earnings Brief October 15, 2015
 PPG Industries, Inc. Third Quarter 2015 Financial Results Earnings Brief October 15, 2015 Third Quarter Financial Highlights PPG net sales for the third quarter of 2015 were $3.87 billion versus the prior
PPG Industries, Inc. First 2018 Financial Results Earnings Brief April 19, 2018
 PPG Industries, Inc. First 2018 Financial Results Earnings Brief April 19, 2018 First Quarter Financial Highlights PPG first quarter net sales from continuing operations were approximately $3.8 billion,
PPG Industries, Inc. Second Quarter 2018 Financial Results Earnings Brief July 19, 2018
 PPG Industries, Inc. Second Quarter 2018 Financial Results Earnings Brief July 19, 2018 Second Quarter Financial Highlights PPG second quarter net sales from continuing operations were approximately $4.1
PPG Industries, Inc. First Quarter 2019 Financial Results Earnings Brief April 18, 2019
 PPG Industries, Inc. First Quarter 2019 Financial Results Earnings Brief April 18, 2019 First Quarter Financial Highlights PPG first quarter net sales from continuing operations were approximately $3.6
PPG Industries, Inc. Second Quarter 2014 Financial Results Earnings Brief July 17, 2014
 PPG Industries, Inc. Second Quarter 2014 Financial Results Earnings Brief July 17, 2014 Second Quarter Financial Summary PPG net sales from continuing operations for the second quarter increased to $4.1
PPG Fourth Quarter and Full Year 2017 Financial Results
 PPG Fourth Quarter and Full Year 2017 Financial Results Michael H. McGarry, Chairman and Chief Executive Officer Vincent J. Morales, Senior Vice President and Chief Financial Officer John Bruno, Director,
PPG Third Quarter 2017 Financial Results
 PPG Third Quarter 2017 Financial Results Michael H. McGarry, Chairman and Chief Executive Officer Vincent J. Morales, Senior Vice President and Chief Financial Officer John Bruno, Director Investor Relations
News. PPG reports second quarter 2016 financial results
 News PPG Media Contact: Mark Silvey Corporate Communications +1-412-434-3046 silvey@ppg.com PPG Investor Contact: Scott Minder Investor Relations +1-412-434-3466 sminder@ppg.com www.ppg.com/investor PPG
First Quarter 2019 Financial Results
 First Quarter 2019 Financial Results Michael H. McGarry, Chairman and Chief Executive Officer Vincent J. Morales, Senior Vice President and Chief Financial Officer John Bruno, Director, Investor Relations
Fourth Quarter 2018 Financial Results
 Fourth Quarter 2018 Financial Results Michael H. McGarry, Chairman and Chief Executive Officer Vincent J. Morales, Senior Vice President and Chief Financial Officer John Bruno, Director, Investor Relations
Third Quarter 2018 Financial Results
 Third Quarter 2018 Financial Results Michael H. McGarry, Chairman and Chief Executive Officer Vincent J. Morales, Senior Vice President and Chief Financial Officer John Bruno, Director, Investor Relations
News. PPG reports fourth quarter and full-year 2018 financial results
 News PPG Media Contact: Mark Silvey Corporate Communications +1-412-434-3046 silvey@ppg.com PPG Investor Contact: John Bruno Investor Relations +1-412-434-3466 jbruno@ppg.com investor.ppg.com PPG reports
PPG. Protecting and. Michael Beautifying H. McGarry the World Chairman and Chief Executive Officer. New York Nov. 28, 2017
 PPG Protecting and Michael Beautifying H. McGarry the World Chairman and Chief Executive Officer Citi Michael Basic Materials H. McGarry Conference New York Nov. 28, 2017 Forward Looking Statements The
PPG Frank S. Sklarsky Executive Vice President and Chief Financial Officer
 PPG Frank S. Sklarsky Executive Vice President and Chief Financial Officer Bank of America s 2016 Agriculture & Chemicals Conference Fort Lauderdale, FL Information current as of March 1, 2016 Forward
David Navikas Vice President and Controller
 David Navikas Vice President and Controller PPG Industries, Inc. New York City May 18, 2007 Forward-Looking Statement Statements contained herein relating to matters that are not historical facts are forward-looking
Our results at a glance
 Report for the first quarter 2014 AkzoNobel I Report for the first quarter 2014 2 AkzoNobel around the world Revenue by destination (44 percent in high growth markets) A North America B Emerging Europe
GENERAL MILLS REPORTS FISCAL 2019 FIRST-QUARTER RESULTS
 News/Information Investor Relations P. O. Box 1113 Minneapolis, MN 55440 FOR IMMEDIATE RELEASE September 18, 2018 Contact: (analysts) Jeff Siemon: 763-764-2301 (media) Kelsey Roemhildt: 763-764-6364 GENERAL
Webcast. Fourth Quarter Fiscal Year 2016 Results. Quarter ended February 26, 2016
 Webcast Fourth Quarter Fiscal Year Results Quarter ended February 26, Forward-looking statements From time to time, in written and oral statements, the company discusses its expectations regarding future
2015 Shareholders Meeting
 2015 Shareholders Meeting PPG Industries, Inc. April 16, 2015 Key Topics Achievements in 2014 First Quarter 2015 Results Outlook and Focus 2 2 Improved 2014 Safety and Environmental Performance PPG Injury
OWENS-ILLINOIS. Credit Suisse 2018 Basic Materials Conference
 OWENS-ILLINOIS Credit Suisse 2018 Basic Materials Conference ANDRES LOPEZ, CEO JAN BERTSCH, CFO SEPTEMBER 12, 2018 Safe harbor comments Forward-Looking Statements This document contains "forward-looking"
2017 Third Quarter Business Review
 2017 Third Quarter Business Review (Unaudited) October 24, 2017 1 Earnings Conference Calls Q4: January 25, 2018 2018 Outlook Meeting December 12, 2017 8:00 a.m. - 12:00 p.m. EST 2 Forward looking statement
A X A L T A C O A T I N G S Y S T E M S. Q4 & FULL YEAR 2016 FINANCIAL RESULTS February 8 th, 2017
 A X A L T A C O A T I N G S Y S T E M S Q4 & FULL YEAR 2016 FINANCIAL RESULTS February 8 th, 2017 Legal Notices Forward-Looking Statements This presentation and the oral remarks made in connection herewith
Thank you and good morning everyone. Welcome to our third quarter 2017 business review.
 Q3 2017 Earnings Call Transcript Inge Thulin & Nicholas Gangestad October 24, 2017 Slide 1, Opening Bruce Jermeland, Director of Investor Relations Thank you and good morning everyone. Welcome to our third
Q Earnings. October 31, 2018
 Q4 2018 Earnings October 31, 2018 Forward-Looking Statements and Non-GAAP Financial Measures Forward-Looking Statements This presentation contains certain forward-looking statements within the meaning
ITT reports 2017 fourth-quarter and full-year results, 2018 guidance
 ITT Inc. 1133 Westchester Ave. White Plains, NY 10604 tel 914 641 2000 Press Release ITT reports 2017 fourth-quarter and full-year results, 2018 guidance 2017 Full-Year Results: Revenue up 8% to $2.6 billion,
Third Quarter 2017 Conference Call. October 27, 2017
 Third Quarter 2017 Conference Call October 27, 2017 Forward-Looking Statements Certain information contained in this presentation constitutes forward-looking statements for purposes of the safe harbor
Watts Water Technologies 4Q and FY 2017 Earnings Conference Call
 Watts Water Technologies 4Q and FY 2017 Earnings Conference Call February 13, 2018 Forward Looking Statements Certain statements in this presentation constitute forward-looking statements within the meaning
W. R. Grace & Co. Fourth Quarter 2014 Business Update. Investor Presentation February 5, 2015
 W. R. Grace & Co. Fourth Quarter Business Update Investor Presentation February 5, 2015 Disclaimer Statement Regarding Safe Harbor For Forward-Looking Statements This presentation contains forward-looking
Q Earnings Call. April 24, 2013
 Q2 2013 Earnings Call April 24, 2013 Forward-Looking Statements and Non-GAAP Measures Forward-Looking Statements -- This presentation contains certain forward-looking statements within the meaning of the
Financial Information
 Financial Information H1 revenues reached 12.8bn up 9.8%, flat org. in Q2 Adj. EBITA reached 1.6bn, up 6.4%, Adj. EBITA margin flat excl. Invensys in a challenging environment 2015 targets: Around flat
2017 THIRD-QUARTER EARNINGS REVIEW October 24, 2017
 2017 THIRD-QUARTER EARNINGS REVIEW October 24, 2017 CAUTIONARY STATEMENT This presentation contains forward-looking statements about Whirlpool Corporation and its consolidated subsidiaries ( Whirlpool
Net income to common stockholders improved $1.4 billion Y-O-Y to a Q3 record of $2.8 billion.
 1 2 3 Q3 global deliveries up 0.1 million units Y-O-Y, a 4% increase. Volume gains primarily in China, offset by reductions in other International Operations. Q3 market share is down 40 bps Y-O-Y, driven
Q Investor Highlights. August 8, 2018
 Q2 2018 Investor Highlights August 8, 2018 Forward Looking Statements This document contains forward-looking statements, that is, information related to future, not past, events. Such statements generally
FRANKLIN ELECTRIC REPORTS 2010 EARNINGS PER SHARE INCREASED 48 PERCENT FROM 2009
 For Immediate Release For Further Information Refer to: John J. Haines 260-824-2900 FRANKLIN ELECTRIC REPORTS 2010 EARNINGS PER SHARE INCREASED 48 PERCENT FROM 2009 Bluffton, Indiana February 28, 2011
Full-Year 2018 Investor Call
 Full-Year 2018 Investor Call Achieved 2018 core sales and 2018 EPS growth of 11% with continued growth expected in 2019 and beyond. We remain on track to fully achieve our Strategy and Capital Allocation
Report. Report for the full-year and fourth quarter 2016
 4 Report Report for the full-year and fourth quarter 2016 16 AkzoNobel I Report for the full-year and the fourth quarter 2016 2 Our results at a glance Full-year: Record ROS, ROI, EBIT, adjusted EPS and
FOURTH-QUARTER 2017 EARNINGS REVIEW January 25, 2018
 FOURTH-QUARTER 2017 EARNINGS REVIEW January 25, 2018 GLOBAL OVERVIEW INSERT PHOTO HERE Marc Bitzer Chief Executive Officer 2 2017 FOURTH-QUARTER HIGHLIGHTS Ongoing EPS of $4.10 in Q4 and $13.74 for the
Mondelēz International Q Results. July 27, 2016
 Mondelēz International Q2 2016 Results July 27, 2016 1 Forward-Looking Statements This presentation contains a number of forward-looking statements. Words, and variations of words, such as will, expect,
Second Quarter 2015 Conference Call
 Second Quarter 2015 Conference Call July 28, 2015 1 Forward Looking and Cautionary Statements Certain statements in this presentation constitute forward looking statements within the meaning of the US
Q4 & FY 2018 Results. January 30, 2019
 Q4 & FY 2018 Results January 30, 2019 This presentation contains a number of forwardlooking statements. Words, and variations of words, such as will, expect, may, believe, estimate, deliver, potential,
CommScope Reports Fourth Quarter and Full Year 2018 Results
 CommScope Reports Fourth Quarter and Full Year 2018 Results February 21, 2019 Fourth Quarter 2018 Performance Sales of $1.06 billion GAAP operating income of $49 million Non-GAAP adjusted operating income
Kimberly-Clark Announces Year-End 2018 Results and 2019 Outlook and Introduces K-C Strategy 2022
 Kimberly-Clark Announces Year-End 2018 Results and 2019 Outlook and Introduces K-C Strategy 2022 January 23, 2019 DALLAS, Jan. 23, 2019 /PRNewswire/ -- Kimberly-Clark Corporation (NYSE: KMB) today reported
First Quarter 2018 Conference Call. April 25, 2018
 First Quarter 2018 Conference Call April 25, 2018 Forward-Looking Statements Certain information contained in this presentation constitutes forward-looking statements for purposes of the safe harbor provisions
2Q 2017 Highlights and Operating Results
 2Q 2017 Highlights and Operating Results July 25, 2017 1 2Q 2017 Highlights and Operating Results Table of Contents Page(s) 1 Sales Overview and Highlights 4-5 2 NSS Overview 6-7 3 EES Overview 8-9 4 UPS
Thank you, good morning everyone and welcome to our fourth quarter 2014 business review.
 Q4 2014 Earnings Call Transcript Inge Thulin & Nicholas Gangestad January 27, 2015 Slide 1, Opening Matt Ginter, Vice President, Investor Relations Thank you, good morning everyone and welcome to our fourth
Third Quarter 2014 Earnings Release October 29, 2014
 Third Quarter 2014 Earnings Release October 29, 2014 Alexander M. Cutler Forward-looking Statements and Non-GAAP Financial Information This presentation or the comments we make on our call today may contain
2017 First Quarter Business Review
 2017 First Quarter Business Review (Unaudited) April 25, 2017 1 Earnings Conference Calls Q2: July 25, 2017 Q3: October 24, 2017 2018 Outlook Meeting December 12, 2017 2 Upcoming 2017 investor events European
Johnson Controls reports fiscal Q3 earnings with strong organic growth and underlying margin expansion
 FOR IMMEDIATE RELEASE CONTACT: Investors: Antonella Franzen (609) 720-4665 Ryan Edelman (609) 720-4545 Media: Fraser Engerman (414) 524-2733 Johnson Controls reports fiscal Q3 earnings with strong organic
3Q 2018 Highlights and Operating Results. Products. Technology. Services. Delivered Globally.
 3Q 2018 Highlights and Operating Results Products. Technology. Services. Delivered Globally. Table of Contents Page 3 Safe Harbor Statement and Non-GAAP Financial Measures 4 Sales Overview 9 Overview of
Mondelēz International 2013 Results. February 12, 2014
 Mondelēz International 2013 Results February 12, 2014 1 Forward-looking statements This slide presentation contains a number of forward-looking statements. Words, and variations of words, such as will,
XYLEM INC. Q EARNINGS RELEASE FEBRUARY 1, 2018
 XYLEM INC. Q4 2017 EARNINGS RELEASE FEBRUARY 1, 2018 Q4 2017 EARNINGS RELEASE FORWARD-LOOKING STATEMENTS This presentation contains information that may constitute forward-looking statements. Forward-looking
Q Investor Highlights. May 8, 2018
 Q1 2018 Investor Highlights May 8, 2018 Forward Looking Statements This document contains, and our other public communications may contain, forward-looking statements, that is, information related to future,
Axalta Coating Systems Ltd.
 Q1 2015 Conference Call May 6, 2015 Notice Regarding Forward Looking Statements, Non-GAAP Financial Measures and Defined Terms Forward-Looking Statements This presentation and the oral remarks made in
Second-Quarter Earnings Review
 Second-Quarter 2018 Earnings Review GLOBAL OVERVIEW Marc Bitzer President and Chief Executive Officer 2 2018 SECOND-QUARTER HIGHLIGHTS Ongoing EBIT margin expansion despite challenging cost environment
3rd Quarter 2018 Earnings Conference Call Transcript. October 31, 2018
 3rd Quarter 2018 Earnings Conference Call Transcript October 31, 2018 CORPORATE PARTICIPANTS John Stroup Belden, Inc. President, CEO, and Chairman Henk Derksen Belden, Inc. CFO, SVP Finance Kevin Maczka
Q4 & Full Year 2017 Financial Results
 Exhibit 99.2 Q4 & Full Year 2017 Financial Results February 6, 2018 Legal Notices Forward-Looking Statements This presentation and the oral remarks made in connection herewith may contain forward-looking
Second Quarter 2014 Earnings Call July 30, Ilene Gordon, Chairman and CEO Jack Fortnum, Chief Financial Officer
 Second Quarter 2014 Earnings Call July 30, 2014 Ilene Gordon, Chairman and CEO Jack Fortnum, Chief Financial Officer Forward-Looking Statements This presentation contains or may contain forward-looking
ITT Inc. Q Earnings Call & 2018 Guidance
 ITT Inc. Q4 2017 Earnings Call & 2018 Guidance February 16, 2018 Safe Harbor This presentation contains forward-looking statements intended to qualify for the safe harbor from liability established by
4 th Quarter 2018 Earnings Conference Call. January 29, 2019
 4 th Quarter 2018 Earnings Conference Call January 29, 2019 Safe Harbor Today s presentation includes forward-looking statements that reflect management s current expectations about the Company s future
Fiscal 2018 Second Quarter
 Fiscal 2018 Second Quarter If you can read this Click on the icon to choose a Results picture or Reset the slide. To Reset: Right click on the slide thumbnail and select reset slide or choose the Reset
GLOBAL OVERVIEW. Marc Bitzer. President and Chief Executive Officer
 Third-Quarter Second-Quarter 2018 2018 Earnings Review GLOBAL OVERVIEW Marc Bitzer President and Chief Executive Officer 2 2018 THIRD-QUARTER HIGHLIGHTS All-time record ongoing EPS of $4.55 and EBIT margin
Q Earnings. July 26, 2017
 Q3 2017 Earnings July 26, 2017 Forward-Looking Statements and Non-GAAP Measures Forward-Looking Statements This presentation contains certain forward-looking statements within the meaning of the U.S. Private
Fourth Quarter 2017 Conference Call. February 8, 2018
 Fourth Quarter 2017 Conference Call February 8, 2018 Forward-Looking Statements Certain information contained in this presentation constitutes forward-looking statements for purposes of the safe harbor
3 rd Quarter 2018 Earnings Conference Call. October 25, 2018
 3 rd Quarter 2018 Earnings Conference Call October 25, 2018 Safe Harbor Today s presentation includes forward-looking statements that reflect management s current expectations about the Company s future
THIRD QUARTER REPORT Period Ended September 30, Management s Discussion and Analysis and Unaudited Consolidated Financial Statements
 THIRD QUARTER REPORT Period Ended 2010 Management s Discussion and Analysis and Unaudited Consolidated Financial Statements MANAGEMENT S DISCUSSION AND ANALYSIS This management s discussion and analysis
4Q 2018 Highlights and Operating Results. Products. Technology. Services. Delivered Globally.
 4Q 2018 Highlights and Operating Results Products. Technology. Services. Delivered Globally. Table of Contents Page 3 Safe Harbor Statement and Non-GAAP Financial Measures 4 Sales Overview 9 Overview of
Our results at a glance
 3Report 16 AkzoNobel I Report for the third quarter 2016 2 Our results at a glance Profitability increased in an environment of mixed volume growth Q3: Volume growth in Decorative Paints and Specialty
Second Quarter 2016 Earnings Conference Call. 20 May 2016
 Second Quarter 2016 Earnings Conference Call 20 May 2016 Safe Harbor Statement & Disclosures The earnings call and accompanying material include forward-looking comments and information concerning the
Third Quarter Report Period Ended September 30, Management s Discussion and Analysis and Unaudited Consolidated Financial Statements
 Third Quarter Report Period Ended September 30, 2017 Management s Discussion and Analysis and Unaudited Consolidated Financial Statements Management s Discussion and Analysis This management s discussion
DuPont Segment Commentary
 This data should be read in conjunction with the Company s third quarter earnings news release dated October 22, and DuPont s 3Q Earnings Conference Call presentation materials posted on the Investor Center
Forward-Looking Statements
 First Quarter 2016 Conference Call April 27, 2016 Forward-Looking Statements Certain information contained in this presentation constitutes forward-looking statements for purposes of the safe harbor provisions
2015 First Quarter Business Review (unaudited) April 23, 2015
 April 23, 2015") 2015 First Quarter Business Review (unaudited) April 23, 2015 1 Forward Looking Statement This presentation contains forward-looking information about 3M's financial results and estimates and business
2015 First Quarter Business Review (unaudited) April 23, 2015 1 Forward Looking Statement This presentation contains forward-looking information about 3M's financial results and estimates and business
Kimberly-Clark Announces Year-End 2014 Results And 2015 Outlook
 January 23, 2015 Kimberly-Clark Announces Year-End 2014 Results And 2015 Outlook DALLAS, Jan. 23, 2015 /PRNewswire/ -- Kimberly-Clark Corporation (NYSE: KMB) today reported year-end 2014 results and provided
GENERAL MILLS REPORTS STRONG FISCAL 2019 THIRD-QUARTER RESULTS AND UPDATES FULL-YEAR GUIDANCE
 News/Information FOR IMMEDIATE RELEASE Investor Relations P. O. Box 1113 Minneapolis, MN 55440 March 20, Contact: (analysts) Jeff Siemon: 763-764-2301 (media) Rob Litt: 763-764-6364 GENERAL MILLS REPORTS
Q Earnings. April 20, 2016
 Q2 2016 Earnings April 20, 2016 Forward-Looking Statements and Non-GAAP Measures Forward-Looking Statements This presentation contains certain forward-looking statements within the meaning of the U.S.
FOR IMMEDIATE RELEASE Michael J. Monahan (651)
") News Release Ecolab Inc. 370 Wabasha Street North St. Paul, Minnesota 55102 FOR IMMEDIATE RELEASE Michael J. Monahan (651) 250-2809 ECOLAB REPORTED AND ADJUSTED FIRST QUARTER DILUTED EPS $0.77; ADJUSTED
News Release Ecolab Inc. 370 Wabasha Street North St. Paul, Minnesota 55102 FOR IMMEDIATE RELEASE Michael J. Monahan (651) 250-2809 ECOLAB REPORTED AND ADJUSTED FIRST QUARTER DILUTED EPS $0.77; ADJUSTED
Corning Incorporated Investor Relations t CORNING One Riverfront Plaza Corning, NY 14831
 Corning Incorporated Investor Relations t 1-888-CORNING One Riverfront Plaza Corning, NY 14831 f 1-607-974-8091 irinfo@corning.com www.corning.com/investor_relations News Release FOR RELEASE JANUARY 29,
Thank you and good morning everyone. Welcome to our second quarter 2015 business review.
 Q2 2015 Earnings Call Transcript Inge Thulin & Nicholas Gangestad July 23, 2015 Slide 1, Opening Matt Ginter, Treasurer and Vice President, Investor Relations Thank you and good morning everyone. Welcome
GCP Applied Technologies
 GCP Applied Technologies Q3 2017 Investor Highlights November 2, 2017 Forward Looking Statements This document contains, and our other public communications may contain, forward-looking statements, that
Herman Miller, Inc. Second Quarter Fiscal 2017 Investor Conference Call December 22, 2016
 Herman Miller, Inc. Second Quarter Fiscal 2017 Investor Conference Call December 22, 2016 The following document is a replication of the notes used in Herman Miller, Inc. s Second Quarter Fiscal 2017 conference
Sealed Air Reports Fourth Quarter and Full Year 2018 Results
 Exhibit 99.1 Sealed Air Corporation 2415 Cascade Pointe Blvd. Charlotte, NC 28208 For release: February 7, 2019 Sealed Air Reports Fourth Quarter and Full Year 2018 Results Solid year-over-year sales and
ITW Conference Call First Quarter 2013
 ITW Conference Call First Quarter 2013 April 23, 2013 SOLID GROWTH. STRONG RETURNS. BEST-IN-CLASS OPERATOR. Forward-Looking Statements Safe Harbor Statement This conference call contains forward-looking
Grace Reports Third Quarter 2012 Adjusted EPS of $1.04 and Narrows 2012 Earnings Outlook
 Media Relations Mike Jones T +1 410.531.8228 mike.jones@grace.com Investor Relations Mark Sutherland T +1 410.531.4590 mark.sutherland@grace.com Grace Reports Third Quarter 2012 Adjusted EPS of $1.04 and
CommScope Reports Fourth Quarter 2017 Results
 CommScope Reports Fourth Quarter 2017 Results Fourth Quarter 2017 Performance o Sales of $1.12 billion, consistent with guidance o GAAP operating income of $92 million and non-gaap adjusted operating income
1Q 2018 Highlights and Operating Results
 1Q 2018 Highlights and Operating Results April 26, 2018 1 Table of Contents Page(s) 4 Announced Agreements to Acquire Australia and New Zealand Security Businesses 5-9 Sales Overview 10-17 Financial Performance
4Q 2017 Highlights and Operating Results
 4Q 2017 Highlights and Operating Results January 30, 2018 1 4Q 2017 Highlights and Operating Results Table of Contents Page(s) 1 Sales Overview 4-8 2 Financial Performance Trends 9-16 3 Leverage Metrics
Forward-Looking Statements
 Third Quarter 2014 Conference Call October 29, 2014 Forward-Looking Statements Certain information contained in this presentation constitutes forward-looking statements for purposes of the safe harbor
ITT reports record 2018 second-quarter results Raises full-year EPS guidance
 ITT Inc. 1133 Westchester Ave. White Plains, NY 10604 tel 914 641 2000 Press Release ITT reports record 2018 second-quarter results Raises full-year EPS guidance 2018 Second-Quarter GAAP Results Record
Third Quarter 2018 Earnings Release October 30, 2018
 Third Quarter 2018 Earnings Release October 30, 2018 Craig Arnold Forward-looking Statements and Non-GAAP Financial Information This presentation or the comments we make on our call today contain forward-looking
GENERAL MILLS FISCAL 2019 FIRST-QUARTER EARNINGS SEPTEMBER 18, 2018
 GENERAL MILLS FISCAL 2019 FIRST-QUARTER EARNINGS SEPTEMBER 18, 2018 A Reminder on Forward-looking Statements This presentation contains forward-looking statements within the meaning of the Private Securities
Q Earnings Conference Call
 Q3 2016 Earnings Conference Call SAFE HARBOR FORWARD-LOOKING STATEMENTS All presentations contain certain forward-looking information within the meaning of the Private Securities Litigation Reform Act
Second Quarter Review. 25 / April / 2014
 Second Quarter Review 25 / April / 2014 Forward-Looking Statements / Safe Harbor This presentation contains a number of forward-looking statements. In many cases forward-looking statements are identified
Q Earnings. July 20, 2016
 Q3 2016 Earnings July 20, 2016 Forward-Looking Statements and Non-GAAP Measures Forward-Looking Statements This presentation contains certain forward-looking statements within the meaning of the U.S. Private
CommScope Reports Fourth Quarter 2017 Results
 February 15, 2018 CommScope Reports Fourth Quarter 2017 Results Fourth Quarter 2017 Performance Sales of $1.12 billion, consistent with guidance GAAP operating income of $92 million and non-gaap adjusted