Virtue of Selfish Investing Mini-Conference and Trader s Dinner Marina del Rey, California March 18, 2017
|
|
|
- Miles Beasley
- 6 years ago
- Views:
Transcription

1 Virtue of Selfish Investing Mini-Conference and Trader s Dinner Marina del Rey, California March 18, 2017 DR. CHRIS KACHER & GIL MORALES MANAGING DIRECTORS, MOKA INVESTORS, LLC 2017 MOKA INVESTORS, LLC
2 DISCLAIMER The information contained herein is not, and should not be construed as an offer to sell or the solicitation of an offer to buy any securities. The information set forth has been obtained from sources which we believe to be reliable, however, these sources cannot be guaranteed as to their accuracy or completeness. The information and content expressed herein are subject to change without notice and Gil Morales & Company, LLC, Virtue of Selfish Investing, LLC and MoKa Investors, LLC and/or their employees may from time to time have long or short positions or may acquire direct or indirect beneficial interest in securities mentioned. Investing in stocks carries a high degree of risk and can result in significant losses. Investors should always operate with a concrete risk-management plan in place, including the use of strict stop-loss points in order to control to the greatest degree possible the inherent risk of investing in stocks. In other words, use the material in this presentation at your own discretion and at your own risk.


3

4


5 Japanese Edition Korean Edition

6 Chinese Edition
7 The market period over the past 2-3 years has been characterized by a highly rotational nature. Indexes and leading stocks move up and down within wide ranges, producing playable sub-trends within an overall non-trending environment.

8

9

10

11
12
13
14 Strong, coherent, and smooth trends in individual stocks are far and few between.
15
16 The problem for traders and investors to solve is how to gain an edge in an environment where the action tends to be choppy, and sub-trends dominate as individual stocks will tend towards short- to intermediate-term price moves before breaking down into corrective pullbacks and base-building phases.
17 Our work in recent years has focused on upgrading and expanding our original methods such as pocket pivots and buyable gap-ups in order to address and better exploit a rotational, more volatile, and mostly trendless market. In some cases this has involved pairing these methods with those discussed and practiced by traders and investors like Richard D. Wyckoff and Jesse Livermore over a century ago, but which are not part of the O Neil CAN SLIM orthodoxy and vernacular. This is the essential foundation of what we refer to as the broader OWL methodology (O Neil-Wyckoff-Livermore).
18 THE OWL METHODOLOGY William J. O Neil the basic CANSLIM system, cataloguing of various chart patterns, codification of primary characteristics of leading stocks. Richard J. Wyckoff - editor and founder of the Magazine of Wall Street, Wyckoffian Retest, the spring formation (what we refer to as an Undercut & Rally or U&R set-up), tests for supply, general market philosophy. Jesse Livermore pivotal (as opposed to pivot ) buy points, reversal patterns, the Century Mark Rule, shakeout-plusthree technique, general market philosophy.
19 VOODOO DAYS The term voodoo day originated with the concept of a volume dry-up. This was shortened to the acronym VDU, which, when combined with a modicum of creativity results in the investment slang term, voodoo. A voodoo day is generally defined by volume that is -35% or less below average. The lower the volume the better, such that -50% or more would be considered extreme voodoo action. Volume dry-ups should also be considered within the context of marketcap. Larger big-cap names can show volume declines of -20% to -25% or more that would qualify as voodoo within the context of the stock s prior price/volume activity.
20 VOODOO DAYS = TESTS FOR SUPPLY A low-volume pullback where volume dries up sharply as the pullback comes into a logical area of potential support is a constructive test for supply. In this case the selling pressure dissipates, creating a buyable pullback. Voodoo action, or extremely light volume as a stock is moving tightly sideways along a logical area of support, such as a key moving average. Is another type of test for supply. The stock price doesn t budge as sellers steadily evaporate.

21 Wyckoff s Spring = Shakeout-Plus-Three = Undercut & Rally But the U&R concept simplifies all of this into an easily identifiable and actionable set-up where risk can be kept to a minimum.
22 In our view, regardless of whether the markets remain in such a wide-ranging, trendless environment or whether we see a return to the more uniform, strongly-trending markets of the post-world War II and pre-qe era, these expanded and updated methods can only serve to extend the edge that traders and investors naturally strive for in any market environment.
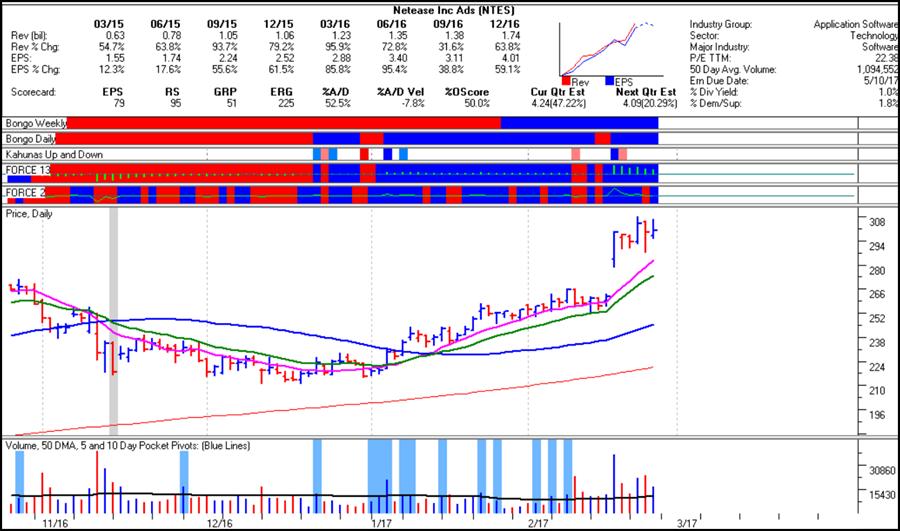
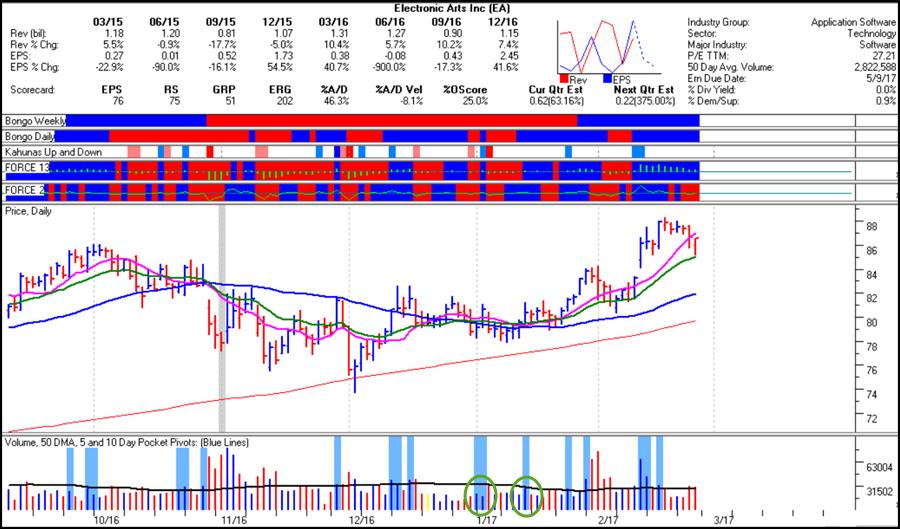
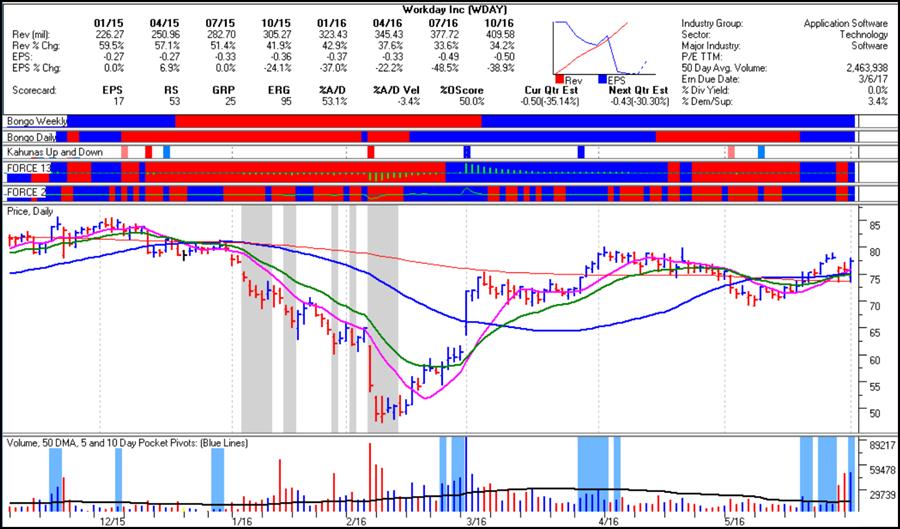
23 I. POCKET PIVOTS
24 POCKET PIVOT RULES 1. As with base breakouts, proper pocket pivots should emerge within or out of constructive basing patterns. 2. The stock's fundamentals should be strong, i.e., excellent earnings, sales, pretax margins, ROE, strong leader in its space, etc. 3. The day's volume should be larger than the highest down volume day over the prior 10 days. 4. If the pocket pivot occurs in an uptrend after the stock has broken out, it should act constructively around its 10-dma. It can undercut its 10-dma as long as it shows resilience by showing volume that is greater than the highest down volume day over the prior 10 days. 5. Pocket pivots sometimes coincide with base breakouts or with gap ups. This can be thought of as added upside power should this occur. 6. Do not buy pocket pivots if the overall chart formation is in a multi-month downtrend (5 months or longer).it is best to wait for the rounding part of the base to form before buying. 7. Do not buy pocket pivots if the stock is under a critical moving average such as the 50-dma or 200- dma. If it is well under its 50-dma, and getting support near the 200-dma, it can be bought provided the base is constructive. 8. Do not buy pocket pivots if the stock formed a 'V' where it sells off hard down through the 10- dma or 50-dma then shoots straight back up in a 'V' formation. Such formations are failure prone. 9. Avoid buying pocket pivots that occur after wedging patterns. 10. Some pocket pivots may occur after the stock is extended from the base. If the pivot occurs right near its 10-dma, it can be bought, otherwise it is extended and should be avoided. Give the 10-dma the chance to catch up to the stock, where the stock would consolidate for a few days, before buying such a pocket pivot.
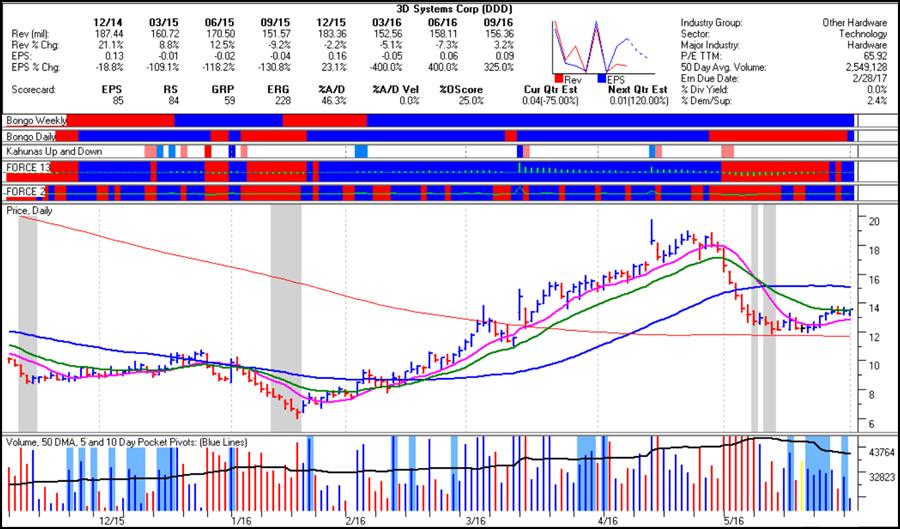
25 ROUNDABOUT & BOTTOM-FISHING POCKET PIVOTS (RAPP & BFPP)

26
27

28
29
30

31
32

33

34

35
36

37
38 FIVE-DAY POCKET PIVOTS
39 CHARACTERISTICS OF 5-DAY POCKETS Rule #3 of the Ten Rules for Pocket Pivots is changed to: The day's volume should be larger than the highest down volume day over the prior 5 trading days. Look for clusters of five-day pocket pivots in lieu of a single ten-day pocket pivot. Look for these to occur in areas of constructive technical action, particularly as a stock is rounding out the right side of a potential new base. Look to pair five-day pocket pivots with associated set-ups and indicators such as undercut & rally moves, Wyckoffian Retests, Bingo bar trios, and moves down to major support, etc.

40

41

42

43
44

45
46 II. BUYABLE GAP-UPS
47 BOTTOM-FISHING BUYABLE GAP-UPS
48 CHARACTERISTICS OF BGBGU S Occur near the lows of a potential, new base formation as a stock is attempting to round out a bottom. Are associated with proportionately monstrous volume increases. Can often occur in stocks that have very high short interest as a percentage of total float. This can lead to very sharp rallies as shorts get squeezed off the bottom. If they lead to a move above a major moving average then that moving average can serve as a tighter selling guide compared to the intraday low of the gap-up day.

49

50

51

52
53

54
55

56

57

58
59 III. SWING-TRADING

60

61

62

63

64
65 IV. MARKET-TIMING
66 MARKET DIRECTION MODEL (MDM)

67
68 CENTRAL BANK BALANCE SHEET (US$)
69 MDM S IMPROVING PERFORMANCE Mar 2016 Mar 2017 (as of this writing ) Using the following instruments: 1x NASDAQ Composite +8.8% 3x TECL +29.5% 3x TNA +30.2% I was able to reinstate some of MDM s former rules since the level of manipulation diminished in 2016, and continues to drop with QE on the wane.
70 VIX VOLATILITY MODEL (VVM)

71
72 Market Manipulation Spikes Lawrence G. McMillan wrote the following in a Sept. 15, 2016 MarketWatch article: "The VIX spiked higher last Friday [Sept 9] and continued to spike even higher on Sunday night, when stock prices were down in Europe overnight. Based on that Sunday high for the VIX, a spike peak buy signal occurred at Monday s close. This is a first time occurrence, for the VIX has only been pricing at night for a few months. Prior to that, for all the years that the VIX has existed, it was priced only during NYSE trading hours. Hence, it is unclear whether this is a valid signal or not. So far it has not worked out very well. Fortunately, the VIX Volatility Model (VVM) does not depend on when the VIX prices. But it goes to show that markets do change such as the introduction of QE in late The key is to see how such changes can be of benefit to a trading strategy while accounting for any changes in risk.
73 Evolutions The model has gone through a series of evolutions or "growing pains" similar to software that updates, making improvements and removing old bugs. Challenging markets are a gift as they uncover any weaknesses. Profits increased while reducing risk.
74 Results Table Prior to the buy signal, results shown do not reflect debugging which improved the algorithm's profit/loss. Drawdowns would thus be contained to -27.9% (worst drawdown in entire 7 year back-test) in 2016 and net profits for 2016 would still be +61.8%. Risk/reward was improved throughout the entire run starting Feb 2, 2009, the first day VXX started trading.
75 Improvements No signal override Profit-taking strategies on buy signals (implemented 2016) Fail-safes (implemented late 2015) VIX volatility spike buy signals (implemented 2016) Rebuy rule after going to cash on a sell signal-avoids being left behind should market continue to trend higher (implemented late 2016)
76 Caveats CAUTION: Expect sharp moves in your position at times. This can be enough to cause an investor to prematurely sell their position. Smaller positions may be warranted depending on your risk tolerance level (pain point). CAUTION: Expect a string of false (losing) signals at times. This can be enough to discourage an investor from taking the next change in signal. IMPORTANT: Keep in mind the current signal's profits of % using ETF XIV could easily be reversed. The market could have a couple of sharp down days in a row where volatile ETFs such as XIV could easily reverse their gains. A fail-safe would kick in to minimize any loss so at worst, the trade would be closed roughly near breakeven. Q: Why cant VVM just switch to cash ahead of such an event? A: Both real-time and backtests have shown the model maximizes its profits by NOT trying to pick tops or bottoms. VVM can at times switch to cash before such a drop as it has done at times, but that form of insurance comes at a cost. VVM walks the tightrope well as it often avoids getting pushed prematurely into cash while protecting the downside by switching out of its signal if necessary.
77 On track for a triple digit year? As of , VVM is up +39.3% in real-time. Dr. Kacher's backtested (and partial real-time) performance using the VIX Volatility Model: % % % % % % % % (Time-stamped, real-time trading started uninterrupted on ) % (as of )
78 V. SHORT-SELLING
79
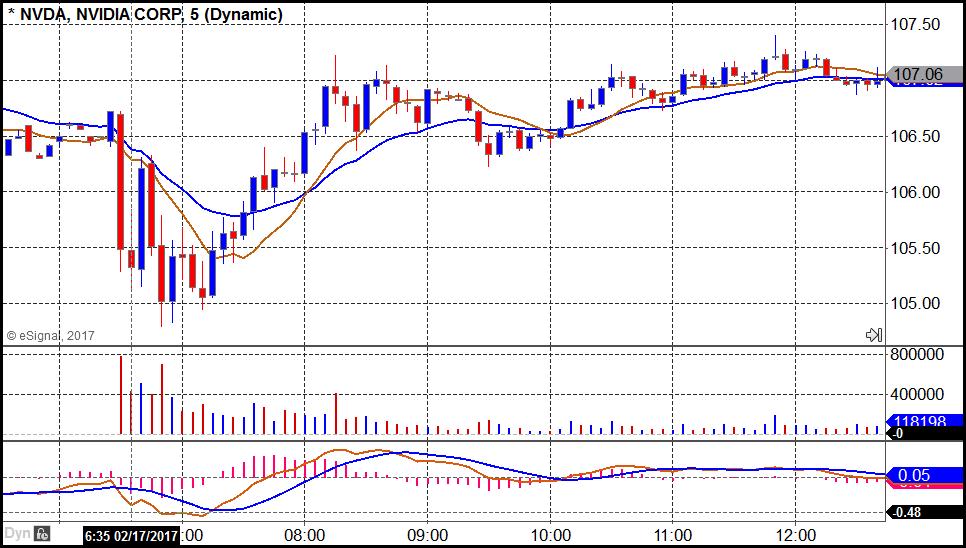
80 THE 620 FIVE-MINUTE INTRADAY CHART 6-period (6 x 5 minutes =30 minute) exponential moving average (orange) 20-period (20 x 5 minutes = 100 minute) exponential moving average. MACD lines and MACD histogram set to (6, 20, C, 9) where 6 = Fast Length, 20 = Slow Length, C = Close, and 9 = Signal Smoothing. You can also test your own settings extra points for originality! Buy signals occur when the 6-period e.m.a crosses above the 20-period e.m.a and the MACD Fast Length (6) crossed above the MACD Slow Also watch for a MACD Stretch or MACD Stretch & Cross within the context of what is simultaneously occurring on the real-time daily chart as potential indications of an impending inflection point.

81
82
83
84

85

86
87

88
89
90
91
92

93
94

95
96

97
98

99
100
101 And they all lived happily ever after. The End
Trader s Expo 2011 Marriott Marquis Hotel February 21, 2011
 Trader s Expo 2011 Marriott Marquis Hotel February 21, 2011 Chris Kacher & Gil Morales Managing Directors MoKa Investors, LLC www.mokainvestors.com www.selfishinvesting.com The Parabolic Nineties The Chop
The Strategies Working Best in Today s E-Mini Market
 The Strategies Working Best in Today s E-Mini Market Todd Mitchell Craig Hill Legal Disclaimer No claim is made by Trading Concepts, Inc. that the trading strategies shown here will result in profits and
The MONEYSHOW Caesar s Palace, Las Vegas, Nevada May 11, 2011
 The MONEYSHOW Caesar s Palace, Las Vegas, Nevada May 11, 2011 Chris Kacher & Gil Morales Managing Directors MoKa Investors, LLC www.mokainvestors.com www.selfishinvesting.com 2011 MoKa Investors, LLC Disclaimer
Inter-market Technical Analysis for April 22, Summary Chart TheoTrade LLC. All rights reserved.
 1 Weekly Inter-market Technical Report Summary Chart 1 2018 TheoTrade LLC. All rights reserved. 2 Intraday Intermarket Volatility is returning to the markets, particularly with the collapse/sell-swing
INTERMEDIATE EDUCATION GUIDE
 INTERMEDIATE EDUCATION GUIDE CONTENTS Key Chart Patterns That Every Trader Needs To Know Continution Patterns Reversal Patterns Statistical Indicators Support And Resistance Fibonacci Retracement Moving
Naked Trading - Double Top Chart Pattern Strategy
 Naked Trading - Double Top Chart Pattern Strategy If you really want to learn a profitable way to trade then look no further, the Double Top chart pattern strategy uses simple and sound trading principles
Naked Trading and Price Action
 presented by Thomas Wood MicroQuant SM Divergence Trading Workshop Day One Naked Trading and Price Action Risk Disclaimer Trading or investing carries a high level of risk, and is not suitable for all
JOURNAL INTRODUCING THE HPO ROBERT KRAUSZ'S. Volume 2, Issue 2. ear Trader,
 ROBERT KRAUSZ'S JOURNAL INTRODUCING THE HPO TM ear Trader, D First, I would like to introduce myself. My name is Thom Hartle (www.thomhartle.com) and I have put together this latest issue of the FT Journal.
Expert Trend Locator. The Need for XTL. The Theory Behind XTL
 Chapter 20 C H A P T E R 20 The Need for XTL esignal does an excellent job in identifying Elliott Wave counts. When combined with studies such as the Profit Taking Index, Wave Four Channels, Trend Channels
Nov 7 th, 2010 By: Chris Vermeulen. SPX s Running Correction, Gold Shines, Cup of Oil Breaks Out!
 Nov 7 th, 2010 By: Chris Vermeulen SPX s Running Correction, Gold Shines, Cup of Oil Breaks Out! The financial markets continue to climb the wall of worry on the back of more Fed Quantitative Easing. Those
Divergence and Momentum Trading
 presented by Thomas Wood MicroQuant SM Divergence Trading Workshop Day One Divergence and Momentum Trading Risk Disclaimer Trading or investing carries a high level of risk, and is not suitable for all
The Strategies Working Best in Today s E-Mini Market
 The Strategies Working Best in Today s E-Mini Market Todd Mitchell Craig Hill Legal Disclaimer No claim is made by Trading Concepts, Inc. that the trading strategies shown here will result in profits and
presented by Thomas Wood MicroQuant SM Divergence Trading Workshop Day One Black Gold
 presented by Thomas Wood MicroQuant SM Divergence Trading Workshop Day One Black Gold Risk Disclaimer Trading or investing carries a high level of risk, and is not suitable for all persons. Before deciding
The Master Trader Counter-Trend Trade Set-Ups
 The Master Trader Counter-Trend Trade Set-Ups Trading Concepts, Inc. The Master Trader Counter-Trend Trade Set-Ups By Todd Mitchell Copyright 2014 by Trading Concepts, Inc. All Rights Reserved This training
 Jack Schwager s Planned Trading Approach 1.Define your trading philosophy or system 2. Choose your markets to be traded 3. Specify your risk parameters A. Minimum risk per trade B. Stop loss strategy C.
ARMCHAIR INVESTOR (sm) MORNING MARKET NEWSLETTER A TREND-FOLLOWING STRATEGY. CURRENT MARKET DIRECTION: UPTREND under PRESSURE
 MORNING MARKET NEWSLETTER A TREND-FOLLOWING STRATEGY. CURRENT MARKET DIRECTION: UPTREND under PRESSURE") 11/14/2018 UPTREND/PRESSURE>> Market continues TUMBLING DOWN! CASH! Wednesday Volume 17 #218 ARMCHAIR INVESTOR (sm) MORNING MARKET NEWSLETTER A TREND-FOLLOWING STRATEGY To open the FULL ARMCHAIR INVESTOR
11/14/2018 UPTREND/PRESSURE>> Market continues TUMBLING DOWN! CASH! Wednesday Volume 17 #218 ARMCHAIR INVESTOR (sm) MORNING MARKET NEWSLETTER A TREND-FOLLOWING STRATEGY To open the FULL ARMCHAIR INVESTOR
 1 www.candlecharts.com 2 BONUS www. candlecharts.com/special/swing-trading-2/ 3 www. candlecharts.com/special/swing-trading-2/ 4 www. candlecharts.com/special/swing-trading-2/ 5 www. candlecharts.com/special/swing-trading-2/
Chapter 24 DIVERGENCE DECISIONS
 Chapter 24 DIVERGENCE DECISIONS The subject of divergence is one that we will approach with the utmost caution. We hope we have made ourselves clear in the other volumes of this course that we have little
SuperADX. Written on: October 11 th 2009
 SuperADX Written on: October 11 th 2009 Congratulations on your purchase. And I mean that! You are now in possession of a powerful trading tool. It is what I believe to be the most leading and most profitable
presented by Thomas Wood MicroQuant SM Divergence Trading Workshop Day One Naked Trading Part 2
 presented by Thomas Wood MicroQuant SM Divergence Trading Workshop Day One Naked Trading Part 2 Risk Disclaimer Trading or investing carries a high level of risk, and is not suitable for all persons. Before
Weekly outlook for April 30 May
 Weekly outlook for April 30 May 4 2018 Summary The S&P500 index is having trouble deciding if it will rally or decline. This indecision makes trading less profitable. Wait for a break-out direction to
Dynamic Trader Daily Report Comprehensive Analysis and Education For the Serious Trader and Investor
 Dynamic Trader Daily Report Comprehensive Analysis and Education For the Serious Trader and Investor Published By Monday, February 07, 2000 Dynamic Traders Group, Inc. DynamicTraders.com dt@dynamictraders.com
The law of Supply and Demand
 The law of Supply and Demand I have been trading for more than 25 years. What I have discovered in that time span is one of the best and most actuate tools in trading is the relationship between price
Index. long-term 200-day, 45 market cycle, myths, very long-term, weekly-based longer-term, 46-47
 Appel_Index2.qxd 2/22/05 11:07 AM Page 229 Index Symbols 10-day rate of change, NYSE Index advance-decline line, 133-134 18-month market cycles, 104 21-day rate of change, NYSE Index advance-decline line,
Trading Lessons from the Intraday Frame (study)
") 1 Daily "Idealized Trades" Report Trading Lessons from the Intraday Frame (study) 1 2018 TheoTrade LLC. All rights reserved. 2 Trading Lessons from the Intraday Frame (1-min) 2 2018 TheoTrade LLC. All
1 Daily "Idealized Trades" Report Trading Lessons from the Intraday Frame (study) 1 2018 TheoTrade LLC. All rights reserved. 2 Trading Lessons from the Intraday Frame (1-min) 2 2018 TheoTrade LLC. All
Practical Applications of the Wyckoff Method of Trading and Investing
 Practical Applications of the Wyckoff Method of Trading and Investing MoneyShow Presentation March 17, 2015 In this overview of the Wyckoff Method, Mr. Roman Bogomazov will present practical trading tools
Resistance to support
 1 2 2.3.3.1 Resistance to support In this example price is clearly consolidated and we can expect a breakout at some time in the future. This breakout could be short or it could be long. 3 2.3.3.1 Resistance
Compiled by Timon Rossolimos
 Compiled by Timon Rossolimos - 2 - The Seven Best Forex Indicators -All yours! Dear new Forex trader, Everything we do in life, we do for a reason. Why have you taken time out of your day to read this
Trading Lessons from the Intraday Frame (study)
") 1 Daily "Idealized Trades" Report Trading Lessons from the Intraday Frame (study) 1 2018 TheoTrade LLC. All rights reserved. 2 Trading Lessons from the Intraday Frame (1-mi) 2 2018 TheoTrade LLC. All rights
1 Daily "Idealized Trades" Report Trading Lessons from the Intraday Frame (study) 1 2018 TheoTrade LLC. All rights reserved. 2 Trading Lessons from the Intraday Frame (1-mi) 2 2018 TheoTrade LLC. All rights
2.0. Learning to Profit from Futures Trading with an Unfair Advantage! Income Generating Strategies Essential Trading Tips & Market Insights
 2.0 Learning to Profit from Futures Trading with an Unfair Advantage! Income Generating Strategies Essential Trading Tips & Market Insights Income Generating Strategies Essential Trading Tips & Market
NEWSLETTER SWING TRADING. 28 Feb Intelligent Analysis to point your decisions in the right direction
 NEWSLETTER 28 Feb 2018 Intelligent Analysis to point your decisions in the right direction SWING TRADING Newsletter contains index, stocks and sector recommendations along with market outlook. It also
BONUS. www. candlecharts.com/special/swing-trading-2/
 BONUS www. candlecharts.com/special/swing-trading-2/ 1 www. candlecharts.com/special/swing-trading-2/ www. candlecharts.com/special/swing-trading-2/ www. candlecharts.com/special/swing-trading-2/ 2 www.
Weekly Market Summary
 Weekly Market Summary June 6, 2018 by Urban Carmel of The Fat Pitch Summary: US equities are up two months in a row and positive for the year. They are outperforming the rest of the world, despite ongoing
Sell Rules Keep it Simple 4/2/2016
 Sell Rules Keep it Simple 4/2/2016 Disclaimer I am not an agent, broker, stockbroker, broker dealer or registered financial advisors I am not employed by IBD or any of its affiliates I do not recommend
ARMCHAIR INVESTOR (sm) MORNING MARKET NEWSLETTER A TREND-FOLLOWING STRATEGY
 MORNING MARKET NEWSLETTER A TREND-FOLLOWING STRATEGY") 01/10/2019 UPTREND day 5 Price UP, PLUS Wednesday adjusted to accumulation Thursday Volume 18 #7 ARMCHAIR INVESTOR (sm) MORNING MARKET NEWSLETTER A TREND-FOLLOWING STRATEGY To open the FULL ARMCHAIR INVESTOR
01/10/2019 UPTREND day 5 Price UP, PLUS Wednesday adjusted to accumulation Thursday Volume 18 #7 ARMCHAIR INVESTOR (sm) MORNING MARKET NEWSLETTER A TREND-FOLLOWING STRATEGY To open the FULL ARMCHAIR INVESTOR
ARMCHAIR INVESTOR (sm) MORNING MARKET NEWSLETTER A TREND-FOLLOWING STRATEGY
 MORNING MARKET NEWSLETTER A TREND-FOLLOWING STRATEGY") 01/08/2019 UPTREND day 3 Market galloping UP for third day in a row! Tuesday Volume 18 #5 ARMCHAIR INVESTOR (sm) MORNING MARKET NEWSLETTER A TREND-FOLLOWING STRATEGY To open the FULL ARMCHAIR INVESTOR
01/08/2019 UPTREND day 3 Market galloping UP for third day in a row! Tuesday Volume 18 #5 ARMCHAIR INVESTOR (sm) MORNING MARKET NEWSLETTER A TREND-FOLLOWING STRATEGY To open the FULL ARMCHAIR INVESTOR
Forex Range Trading With Price Action Forex Trading System By Laurentiu Damir
 Forex Range Trading With Price Action Forex Trading System By Laurentiu Damir Copyright 2012 by Laurentiu Damir All rights reserved. No part of this book may be reproduced or transmitted in any form or
Tips for Traders 6/1/ :13:00 AM How to Catch a Trade in a Vertically-Trending Market
 Tips for Traders 6/1/2009 10:13:00 AM How to Catch a Trade in a Vertically-Trending Market One of the most exhilarating rides we can take as traders is when a profitable position we have on goes vertical.
Weekly Market Summary
 Weekly Market Summary August 18, 2015 by Urban Carmel of The Fat Pitch US equities had two opportunities to kick off a rally this week. Neither had much follow through. On Monday, positive breadth was
Trading Lessons from the Intraday Frame (study)
") 1 Daily "Idealized Trades" Report Trading Lessons from the Intraday Frame (study) 1 2018 TheoTrade LLC. All rights reserved. 2 Trading Lessons from the Intraday Frame (1-mi) Major Companies Reporting Earnings
1 Daily "Idealized Trades" Report Trading Lessons from the Intraday Frame (study) 1 2018 TheoTrade LLC. All rights reserved. 2 Trading Lessons from the Intraday Frame (1-mi) Major Companies Reporting Earnings
Figure 3.6 Swing High
 Swing Highs and Lows A swing high is simply any turning point where rising price changes to falling price. I define a swing high (SH) as a price bar high, preceded by two lower highs (LH) and followed
1 December 2018 Volume 11, Issue 49. Summary for week of 3 December 2018
 1 December 2018 Volume 11, Issue 49 Summary for week of 3 December 2018 Stocks vulnerable to declines this week Dollar prone to downside pressure Crude oil could move significantly in both directions Gold
Trading Lessons from the Intraday Frame (study)
") 1 Daily "Idealized Trades" Report Trading Lessons from the Intraday Frame (study) 1 2018 TheoTrade LLC. All rights reserved. 2 Trading Lessons from the Intraday Frame (1-mi) 2 2018 TheoTrade LLC. All rights
1 Daily "Idealized Trades" Report Trading Lessons from the Intraday Frame (study) 1 2018 TheoTrade LLC. All rights reserved. 2 Trading Lessons from the Intraday Frame (1-mi) 2 2018 TheoTrade LLC. All rights
Advanced Trading Systems Collection MACD DIVERGENCE FOREX TRADING SYSTEM
 MACD DIVERGENCE FOREX TRADING SYSTEM 1 This system will cover the MACD divergence. With this forex trading system you can trade any currency pair (I suggest EUR/USD and GBD/USD when you start), and you
ARMCHAIR INVESTOR (sm) MORNING MARKET NEWSLETTER A TREND-FOLLOWING STRATEGY CURRENT MARKET DIRECTION: UPTREND
 MORNING MARKET NEWSLETTER A TREND-FOLLOWING STRATEGY CURRENT MARKET DIRECTION: UPTREND") 11/8/2018 UPTREND Market: minor pullback. Volume less. BUY STOCKS NOW!. Thursday Volume 17 #215 ARMCHAIR INVESTOR (sm) MORNING MARKET NEWSLETTER A TREND-FOLLOWING STRATEGY To open the FULL ARMCHAIR INVESTOR
11/8/2018 UPTREND Market: minor pullback. Volume less. BUY STOCKS NOW!. Thursday Volume 17 #215 ARMCHAIR INVESTOR (sm) MORNING MARKET NEWSLETTER A TREND-FOLLOWING STRATEGY To open the FULL ARMCHAIR INVESTOR
Subject: Daily report explanatory notes, page 2 Version: 0.9 Date: Dec 29, 2013 Author: Ken Long
 Subject: Daily report explanatory notes, page 2 Version: 0.9 Date: Dec 29, 2013 Author: Ken Long Description Example from Dec 23, 2013 1. Market Classification: o Shows market condition in one of 9 conditions,
presented by Thomas Wood MicroQuant SM Divergence Trading Workshop Day One Bond Trading Success
 presented by Thomas Wood MicroQuant SM Divergence Trading Workshop Day One Bond Trading Success Risk Disclaimer Trading or investing carries a high level of risk, and is not suitable for all persons. Before
Trading Lessons from the Intraday Frame (study)
") 1 Daily "Idealized Trades" Report Trading Lessons from the Intraday Frame (study) 1 2018 TheoTrade LLC. All rights reserved. 2 Trading Lessons from the Intraday Frame (1-mi) Major Companies Reporting Earnings
1 Daily "Idealized Trades" Report Trading Lessons from the Intraday Frame (study) 1 2018 TheoTrade LLC. All rights reserved. 2 Trading Lessons from the Intraday Frame (1-mi) Major Companies Reporting Earnings
Technical Analysis Workshop Series. Session Ten Semester 2 Week 4 Oscillators Part 1
 Technical Analysis Workshop Series Session Ten Semester 2 Week 4 Oscillators Part 1 DISCLOSURES & DISCLAIMERS This research material has been prepared by NUS Invest. NUS Invest specifically prohibits the
Weekly outlook for Nov. 27 Dec
 Weekly outlook for Nov. 27 Dec. 1 2017 Summary For the ES we expect a minor pullback in the early part of the week, followed by a rally into the weekly close. There are four option expirations this week
Market Turning Points By Andre Gratian
 Market Turning Points By Andre Gratian June 21, 2015 Precision timing for all time frames through a multi-dimensional approach to forecasting using technical analysis: Cycles - Breadth - P&F and Fibonacci
CHARTS. Bar Line Candlestick Charts are the basis of technical analysis They are a graphic display of price action. Notes:
 TECHNICAL ANALYSIS CHARTS Bar Line Candlestick Charts are the basis of technical analysis They are a graphic display of price action Candlestick charts have become the industry standard for technical traders.
How To Recognize Great Performing Stocks
 How To Recognize Great Performing Stocks Your guide to spot the cup-with-handle chart pattern. >> #1 in a Series of 5 How To Recognize Great Performing Stocks When you read this simple 16-page booklet,
Trading Lessons from the Intraday Frame (study)
") 1 Daily "Idealized Trades" Report Trading Lessons from the Intraday Frame (study) 1 2018 TheoTrade LLC. All rights reserved. 2 Trading Lessons from the Intraday Frame (1-min) 2 2018 TheoTrade LLC. All
1 Daily "Idealized Trades" Report Trading Lessons from the Intraday Frame (study) 1 2018 TheoTrade LLC. All rights reserved. 2 Trading Lessons from the Intraday Frame (1-min) 2 2018 TheoTrade LLC. All
Leavitt Brothers Weekly Sunday, February 28, 2016
 Leavitt Brothers Weekly Sunday, February 28, 2016 Join our email list and get reports just like this send directly to you. http://www.leavittbrothers.com/email-subscribe.cfm Overall the market did well
Weekly outlook for Jan 16 Jan
 Weekly outlook for Jan 16 Jan 20 2017 TREND DIRECTION S&P 500 Oil Gold Short Term Intermediate-Term Long Term weak strong strong weak Strong Less strong strong weak strong Conclusion: S&P500 indicator
MagicBreakout Forex Trading Strategy
 Tim Trush & Julie Lavrin introduce MagicBreakout Forex Trading Strategy Your guide to financial freedom. Tim Trush, Julie Lavrin, T&J Profit Club, 2007, All rights reserved www.magicbreakout.com Table
Trading Lessons from the Intraday Frame (study)
") 1 Daily "Idealized Trades" Report Trading Lessons from the Intraday Frame (study) 1 2018 TheoTrade LLC. All rights reserved. 2 Trading Lessons from the Intraday Frame (1-mi) 2 2018 TheoTrade LLC. All rights
1 Daily "Idealized Trades" Report Trading Lessons from the Intraday Frame (study) 1 2018 TheoTrade LLC. All rights reserved. 2 Trading Lessons from the Intraday Frame (1-mi) 2 2018 TheoTrade LLC. All rights
 ADDING THE MACD Forex Strategy Master Published by Old Tree Publishing CC Suite 509, Private Bag X503 Northway, 4065, KZN, ZA www.oldtreepublishing.com Copyright 2013 by Old Tree Publishing CC, KZN, ZA
Following Institutional Footprints
 Strategies Following Institutional Footprints Trading Expansions of Range and Volume Equity market cycles provide opportunity in every phase of liquidity. The greatest possibilities are evident when expansion-of-range-and-volume
Gold, and Mining Stocks Trader Monday, March 04, :57 AM Published by The Wall Street Examiner
 Monday, March 04, 2019 8:57 AM Published by The Wall Street Examiner Cycle Phase/PTT Projection 9-12 Month Top-Down/11-24 Weeks 1330 Done 13/17 Week Down/20? 6-7 Week Down/
Trading Lessons from the Intraday Frame (study)
") 1 Daily "Idealized Trades" Report Trading Lessons from the Intraday Frame (study) 1 2018 TheoTrade LLC. All rights reserved. 2 Trading Lessons from the Intraday Frame (1-min) 2 2018 TheoTrade LLC. All
1 Daily "Idealized Trades" Report Trading Lessons from the Intraday Frame (study) 1 2018 TheoTrade LLC. All rights reserved. 2 Trading Lessons from the Intraday Frame (1-min) 2 2018 TheoTrade LLC. All
Volatility/Vix Trading. Your Step-by- Step Guide to Stock Trading
 Volatility/Vix Trading Your Step-by- Step Guide to Stock Trading and Options Trading with Volatility Table Of Contents Introduction Chapter 1 What Is Volatility? Chapter 2 The Volatility Index Chapter
PLEASE SEE IMPORTANT LEGAL DISCLAIMER ON LAST PAGE
 Today's Overview The S&P 500 ground sideways overnight into Wednesday and turned higher after the start of the U.S. session, rising to 1160 over the lunch hour. The Nasdaq 100 underperformed in the morning
Trading Lessons from the Intraday Frame (study)
") 1 Daily "Idealized Trades" Report Trading Lessons from the Intraday Frame (study) 1 2018 TheoTrade LLC. All rights reserved. 2 Trading Lessons from the Intraday Frame (1-mi) 2 2018 TheoTrade LLC. All rights
1 Daily "Idealized Trades" Report Trading Lessons from the Intraday Frame (study) 1 2018 TheoTrade LLC. All rights reserved. 2 Trading Lessons from the Intraday Frame (1-mi) 2 2018 TheoTrade LLC. All rights
SCEPTRE TRADING A COURSE IN DAY AND SWING TRADING
 SCEPTRE TRADING A COURSE IN DAY AND SWING TRADING STOCK PRICE CHARACTERISTICS AND TRADING TECHNIQUES INTRODUCTION Overview of where we re going this week during the course Why use technical analysis to
Fast Track Stochastic:
 Fast Track Stochastic: For discussion, the nuts and bolts of trading the Stochastic Indicator in any market and any timeframe are presented herein at the request of Beth Shapiro, organizer of the Day Traders
Trading Lessons from the Intraday Frame (study)
") 1 Daily "Idealized Trades" Report Trading Lessons from the Intraday Frame (study) 1 2018 TheoTrade LLC. All rights reserved. 2 Trading Lessons from the Intraday Frame (1-mi) 2 2018 TheoTrade LLC. All rights
1 Daily "Idealized Trades" Report Trading Lessons from the Intraday Frame (study) 1 2018 TheoTrade LLC. All rights reserved. 2 Trading Lessons from the Intraday Frame (1-mi) 2 2018 TheoTrade LLC. All rights
The 30-Minute Breakout Strategy. Trading Concepts, Inc.
 The 30-Minute Breakout Strategy The 30-Minute (First Half-Hour) Breakout Strategy Once the Market moves in either direction off of the OPEN and penetrates UP through the HIGH or DOWN through LOW of the
Wedge Pattern Breakouts: Explosive Winning Trades
 Wedge Pattern Breakouts: Explosive Winning Trades Prices move in patterns! This is due to one basic investment truism. Human nature exhibits the same habits when it comes to managing investment funds which
1 P a g e. Executive Summary
 Executive Summary Last week we expected a bottom within 2-3 days, we were unfortunately wrong, as instead the market turned into a confused- frog blender swirling around our Fib-based, and the Bradley
Using Investor s Business Daily To Find Winning Stocks.
 WWW. Using Investor s Business Daily To Find Winning Stocks. This Quick-Start Guide is designed to show you how to get the most out of Investor s Business Daily s innovative features and help you become
BUY SELL PRO. Improve Profitability & Reduce Risk with BUY SELL Pro. Ultimate BUY SELL Indicator for All Time Frames
 BUY SELL PRO Improve Profitability & Reduce Risk with BUY SELL Pro Ultimate BUY SELL Indicator for All Time Frames Risk Disclosure DISCLAIMER: Crypto, futures, stocks and options trading involves substantial
Rotational Trading Systems
 Rotational Trading Systems A new and very different alternative? By: Bruce Wood Disclaimer: This presentation is for educational purposes ONLY. I am a Private Trader, and I DO NOT provide any personal
Jason Leavitt Sunday, October 9, 2016
 Weekly Jason Leavitt jason@leavittbrothers.com Sunday, October 9, 2016 ------------------------------------------------------------------------------------------------------ Join our email list and get
Quantitative Trading System For The E-mini S&P
 AURORA PRO Aurora Pro Automated Trading System Aurora Pro v1.11 For TradeStation 9.1 August 2015 Quantitative Trading System For The E-mini S&P By Capital Evolution LLC Aurora Pro is a quantitative trading
OSCILLATORS. TradeSmart Education Center
 OSCILLATORS TradeSmart Education Center TABLE OF CONTENTS Oscillators Bollinger Bands... Commodity Channel Index.. Fast Stochastic... KST (Short term, Intermediate term, Long term) MACD... Momentum Relative
Trading Success Principles Floor Trader Pivots
 Trading Success Principles Floor Trader Pivots Trading Concepts, Inc. Trading Success Principles Floor Trader Pivots By Todd Mitchell Copyright 2014 by Trading Concepts, Inc. All Rights Reserved This training
Williams Percent Range
 Williams Percent Range (Williams %R or %R) By Marcille Grapa www.surefiretradingchallenge.com RISK DISCLOSURE STATEMENT / DISCLAIMER AGREEMENT Trading any financial market involves risk. This report and
Using Investor s Business Daily To Find Winning Stocks.
 W W W. I N V E S T O R S. C O M YOUR QUICK-START GUIDE Using Investor s Business Daily To Find Winning Stocks. This Quick-Start Guide is designed to show you how to get the most out of Investor s Business
1 P a g e. Executive Summary
 Executive Summary Based on this week s deduction of observable facts, we continue to favor the major a at SPX 1867, major b at SPX 2021 and major c down to SPX 1830-1850ies around October 9-12. How exactly
Different Classes Of Divergence
 Russ Horn Presents Different Classes Of Divergence RISK DISCLOSURE STATEMENT / DISCLAIMER AGREEMENT Trading any financial market involves risk. This report and all and any of its contents are neither a
TRADING STRATEGY SERIES LEARN HOW TO SPOT OPPORTUNITIES IN VOLATILE MARKETS fpmarkets.com.au
 1 TRADING STRATEGY SERIES LEARN HOW TO SPOT OPPORTUNITIES IN VOLATILE MARKETS This educational material does not constitute financial product advice and does not take into account your investment objectives,
13 April US Equity Indices: the land of the bearish rising wedge. Walter Zimmermann United ICAP. US Equity Indices 13 Apr
 - 1-13 April 2015 : the land of the bearish rising wedge Walter Zimmermann United ICAP The market commentary contained in this document represents the opinions of the author. Such opinions are subject
Technicals & Time Frame
 Advanced Charting Neither Better Trades or any of its personnel are registered broker-dealers or investment advisers. I will mention that I consider certain securities or positions to be good candidates
Trading Lessons from the Intraday Frame (study)
") 1 Daily "Idealized Trades" Report Trading Lessons from the Intraday Frame (study) 1 2018 TheoTrade LLC. All rights reserved. 2 Trading Lessons from the Intraday Frame (1-min) 2 2018 TheoTrade LLC. All
1 Daily "Idealized Trades" Report Trading Lessons from the Intraday Frame (study) 1 2018 TheoTrade LLC. All rights reserved. 2 Trading Lessons from the Intraday Frame (1-min) 2 2018 TheoTrade LLC. All
Trading EveryDay reserves the right to change this privacy statement at any time. Be sure to check this page periodically for updates.
 This content is provided by The Trading EveryDay Group, LLC. This site, including its contents, is provided "as educational content only" without warranty or guarantee of any kind, either expressed or
FOREX INDICATORS. THEIR PRIORITY and USE
 FOREX INDICATORS THEIR PRIORITY and USE by G. C. Smith U.S. Government Required Disclaimer Trading foreign exchange markets on margin carries a high level of risk, and may not be suitable for all investors.
ARMCHAIR INVESTOR MORNING MARKET NEWSLETTER A TREND-FOLLOWING STRATEGY*
 9/27/17 UPTREND: Market has Major Accumulation day but stops near prior highs Wednesday Volume 16 Day 186 ARMCHAIR INVESTOR MORNING MARKET NEWSLETTER A TREND-FOLLOWING STRATEGY* INVESTORS.COM FREE for
Trading Lessons from the Intraday Frame (study)
") 1 Daily "Idealized Trades" Report Trading Lessons from the Intraday Frame (study) 1 2018 TheoTrade LLC. All rights reserved. 2 Trading Lessons from the Intraday Frame (1-mi) 2 2018 TheoTrade LLC. All rights
1 Daily "Idealized Trades" Report Trading Lessons from the Intraday Frame (study) 1 2018 TheoTrade LLC. All rights reserved. 2 Trading Lessons from the Intraday Frame (1-mi) 2 2018 TheoTrade LLC. All rights
END OF DAY DATA CORPORATION. Scanning the Market. using Stock Filter. Randal Harisch 2/27/2011
 END OF DAY DATA CORPORATION Scanning the Market using Stock Filter Randal Harisch 2/27/2011 EOD's Stock Filter tool quickly searches your database, identifying stocks meeting your criteria. The results
Class 7: Moving Averages & Indicators. Quick Review
 Today s Class Moving Averages Class 7: Moving Averages & Indicators 3 Key Ways to use Moving Averages Intro To Indicators 2 Indicators Strength of Lines Quick Review Great for establishing point of Support
Technical Analysis Workshop Series. Session 11 Semester 2 Week 5 Oscillators Part 2
 Technical Analysis Workshop Series Session 11 Semester 2 Week 5 Oscillators Part 2 DISCLOSURES & DISCLAIMERS This research material has been prepared by NUS Invest. NUS Invest specifically prohibits the
DAILY DAY TRADING PLAN
 DAILY DAY TRADING PLAN Gatherplace will be used to place all of your trades. You will be using the 5 minute chart for the trade setup and the 1 minute chart for your entry, stop and trailing stop.you will
How to Build your Trading Watchlist Table of Contents
 Table of Contents Risk Warning... 1 We ve All Been There... 2 Why Do you Need a watchlist?... 2 Starting Where you Have an Edge!... 2 Find the Dominant Psychology in a Pair... 3 Understanding Directional
Four Pillars Finance Newsletter
 Four Pillars Finance Newsletter Issue #103 (5 November 2009) The Nasdaq market failed to break significantly higher and then fall back, as we predicted last month. November could produce yet another attempt
ARMCHAIR INVESTOR (sm) MORNING MARKET NEWSLETTER A TREND-FOLLOWING STRATEGY
 MORNING MARKET NEWSLETTER A TREND-FOLLOWING STRATEGY") 01/15/2019 UPTREND day 7 Indexes drop. Only S&P500 has distribution day. Tuesday Volume 18 #10 ARMCHAIR INVESTOR (sm) MORNING MARKET NEWSLETTER A TREND-FOLLOWING STRATEGY To open the FULL ARMCHAIR INVESTOR
01/15/2019 UPTREND day 7 Indexes drop. Only S&P500 has distribution day. Tuesday Volume 18 #10 ARMCHAIR INVESTOR (sm) MORNING MARKET NEWSLETTER A TREND-FOLLOWING STRATEGY To open the FULL ARMCHAIR INVESTOR
Market Update April 20, 2015
 SeattleTA provides investment managers with technical analysis of the equity, fixed-income, commodity, and The forecast for a high on April 15 was spot-on (there s no kill switch on awesome!). The monthly
Penny Stock Guide. Copyright 2017 StocksUnder1.org, All Rights Reserved.
 Penny Stock Guide Disclaimer The information provided is not to be considered as a recommendation to buy certain stocks and is provided solely as an information resource to help traders make their own
Copyright by Profits Run, Inc. Published by: Profits Run, Inc Beck Rd Unit F1. Wixom, MI
 DISCLAIMER: Stock, forex, futures, and options trading is not appropriate for everyone. There is a substantial risk of loss associated with trading these markets. Losses can and will occur. No system or