Santa Clara County School Districts Statistical Report Fiscal Year
|
|
|
- Moris Shon Riley
- 5 years ago
- Views:
Transcription

1 Statistical Report Fiscal Year
2 Produced by District Business & Advisory Services Questions or comments can be directed to Nimrat Johal Director, DBAS Phone: Or Cathy McKim Manager, DBAS Phone:
3 Comprehensive Annual Financial Report For the Period Ending June 30, 2011 Table of Contents Preface... 9 Facts about Santa Clara County Public Schools Teachers by Race/Ethnicity Demographic and Economic Statistics Census Statistics Census Statistics Percentage of Change District Business and Advisory Services District Boundary Map Section I: K 12 School Districts School Districts Historical COLAs and Deficits Historical COLAs and Deficits Five Year Comparison of P2 ADA by District Type Five Year Comparison of P2 ADA by District Type Five Year Comparison of P2 ADA by District Three Year Revenue Limit Data Three Year Revenue Limit Data Historical Information: Interest Rates Summary of General Fund Revenues and Expenditures by District
4 Summary of General Fund Revenues and Expenditures Summary of General Fund Revenues and Expenditures by District General Fund Revenue Data General Fund Revenue Data General Fund Expenditures Salaries & Benefits by District Type Chart General Fund Expenditures Salaries & Benefits by District Type General Fund Expenditures by District Type Chart General Fund Expense Data Chart General Fund Expense Data Teacher s Salary Santa Clara County vs. California Chart Teacher s Salary Santa Clara County vs. California Teacher s Salary by District Student Ethnicity by District Section III: Voted and Bonded Indebtedness Voted and Bonded Indebtedness Overview Ratio of General Bonded Debt Outstanding Direct and Overlapping Bonded Debt Direct and Overlapping Bonded Debt Legal Debt Margin Information Section IV: Tax Revenue Chart Five Year Historical Property Taxes Five Year Historical Property Taxes by District Property Taxes by District General Governmental Tax Revenue by Source
5 Taxable Assessed Value of Property Property Tax Rate Direct and Overlapping Governments Principal Property Taxpayers Property Tax Levies and Collections Section IV: Rank Order K 12 Size by Revenue Limit ADA by Type of District Chart K 12 Size by Revenue Limit ADA by Type of District Chart K 12 Base Revenue Limit by Type of District K 12 Rank by Average Teachers Salary By District Type Section VI: General Information Revenue Limit Definitions Adult Revenue Limit COLA Increase Deficit and Deficit Reduction Longer Day/Year Add ons Prior Year Base Revenue Limit per ADA Regional Occupational Program Revenue SB 727 (Chapter 855, Statutes 1997 and Actual Attendance) Supplemental Instructional Programs Funding Adjustment Total Adjusted Revenue Limit Total Base Revenue Limit Glossary of School Finance Terms Adult Education Apportionments
6 Assessed Value Average Class Size Average Daily Attendance (ADA) Bonded Indebtedness Budget Act Cal Works Capital Outlay Categorical Aid CBEDS Certificated Employees Charter School Classified Employees Collective Bargaining SB 160 (1975) Cost of Living Adjustment (COLA) Declining Enrollment Adjustment Deferred Maintenance Deficit Factor Developer Fees Economic Impact Aid (EIA) Education Code Employee Benefits Encroachment Equalization Gann Spending Limit
7 Incentives Indirect Costs Indirect Cost Rate Joint Power Authority (JPA) LEA (Local Educational Agency) Legislation Mandated Costs Master Plan for Special Education California Migrant Education Necessary Small Schools PERB PL Proposition Proposition Proposition Redevelopment Agency Reserves Revenue Limit ROC/P School Improvement Program (SIP) Special Education Standardized Account Code Structure (SACS) State School Fund STRS/PERS
8 Supplemental Grants Program Temporary Assistance to Needy Families (TANF) School District Voted Indebtedness Year Round Schools
9 Preface The Santa Clara County Office of Education (County Office) serves as a coordinating and regional service agency for local K 12 and community college school districts. An important function of the County Office is to provide decision makers with accurate information and analysis about public education. This publication, the Annual Financial Report, brings together information compiled from various state and county fiscal reports. We hope that this information will be helpful to parents, policymakers, school administrators, teachers, researchers, legislators, and anyone who wants to be informed about financial resources available to public education and how those resources are being utilized. Santa Clara County contains 32 school districts grades K 12; with 6 unified districts, 5 high school and 20 elementary districts. Other local educational agencies include: 1 regional occupational centers/program (ROC/P), 2 joint powers agreements (JPAs), 4 community college districts, and the Santa Clara County Office of Education. We believe that this document is a valuable resource for financial and statistical information about school districts in Santa Clara County. By studying the Financial Statistical Reports from year to year, it is possible to determine trends in financial activities that have developed over a period of time, and to project future trends. The comparative financial data provided in this report should be considered within the context of the individual districts from which the data is derived. It is also important to avoid broad generalizations, since California school finance is a complex and extremely technical field, and the operating environment in each district is unique. We hope that you will continue to find this report valuable, and we invite you to offer comments and suggestions as to how we might better serve the public in the years ahead. 9
10 Facts about Santa Clara County Public Schools 10 County Statistics Population (U.S. Census Bureau, 2010 Census) Land State Statistics 1,781,642 1,291 square miles Population (U.S. Census Bureau, 2010 Census) 37,253,956 Counties 58 School Districts 1,047 Schools 11,217 Public School Students 6,217,113 Santa Clara County Teachers Number of full-time teachers 11, CA Total Number of full-time teachers 268, Average SCC teacher's salary $73,584 Average CA teacher's salary $67,932 Student to Teacher Ratio/Class Size SCC student-to-teacher ratio California ratio SCC average class size 25.9 California average class size 24.2 Student to Teacher Ratio/Class Size By District Type Elementary High Unified County Office of Education Total FTE Administrators FTE Pupil Services Classified Staff SCC ,020 10,321 CA 21, , ,594 Santa Clara County K 12 Public School Enrollment , , , , , , , , , , , ,256 School Districts Elementary 19 Unified 6 High School 5 County Office of Education 1 Total 32 Public School Sites * Elementary 241 Middle 54 Junior High 5 High School 50 Unified 2 Total 352 * Excludes: Continuation, Community Day, Alternative, Special Ed, Juvenile Hall, and County Community Schools and Charter Schools Sources: CDE Data and California School Directory
11 Teachers by Race/Ethnicity County State Number of Teachers Percent of Total Percent of Total American Indian or Alaska Native % 0.60% Asian 1, % 4.90% Native Hawaiian or Pacific Islander % 0.30% Filipino % 1.40% Hispanic or Latino 1, % 17.30% Black or African American % 4.00% White 8, % 67.20% Two or More Races % 1.20% None Reported % 3.20% Total 12, % 100% Source: California Department of Education, Educational Demographics Office (CBEDS 12/15/11) 0.00% 20.00% 40.00% 60.00% 80.00% %120.00% American Indian or Alaska Native Asian Native Hawaiian or Pacific Islander Filipino Hispanic or Latino Black or African American County Percent of Total State Percent of Total White Two or More Races None Reported Total 11
12 Demographic and Economic Statistics COUNTY OF SANTA CLARA Last Ten Years (Unaudited) Fiscal Year County Population (1) Personal Income (in thousands) (2) Per Capita Personal Income (2) Median Age (3) School Enrollment (4) Unemployment Rate (5) 2011 n/a n/a n/a n/a 266, % ,888, n/a n/a , % ,857, $ 101,495, $ 55, , % ,837, $ 103,992, $ 59, , % ,808, $ 104,102, $ 60, , % ,773, $ 95,911, $ , % ,759, $ 87,154, $ 51, , % ,731, $ 82,638, $ 49, , % ,729, $ 78,165, $ 46, , % ,719, $ 78,016, $ 46, , % ,697, $ 83,838, $ 49, n/a 254, % Sources: Calendar Year Data; exception is School Enrollment 1 State of California Department of Finance 2 U.S. Department of Commerce Bureau of Economic Analysis 3 Association of Bay Area Census 4 State of California Department of Education and Santa Clara County Office of Education 5 State of California Employment Development Department July Enrollment by Fiscal Year Total 12
13 Census Statistics Total Population: 2000 and 2010 State/County/City Incorporated Cities in Santa Clara County Total Population Change April 1, 2000 (2) April 1, 2010 Number Percent California 33,871, ,253, ,382, % Santa Clara County 1,682, ,781, , % Campbell city 38, , , % Cupertino city 50, , , % Gilroy city 41, , , % Los Altos city 27, , , % Los Altos Hills town 7, , % Los Gatos town 28, , % Milpitas city 62, , , % Monte Sereno city 3, , (142.00) 4.1% Morgan Hill city 33, , , % Mountain View city 70, , , % Palo Alto city 58, , , % San Jose city 894, , , % Santa Clara city 102, , , % Saratoga city 29, , % Sunnyvale city 131, , , % Source: California Department of Finance Census 2010 Generated on 3/08/ Census 2000 counts include changes from the Count Question Resolution program. Data may not match data published in Census 2000 reports 13
14 Census Statistics Percentage of Change % 5.00% 0.00% 5.00% 10.00% 15.00% 20.00% California Campbell city Cupertino city Gilroy city Los Altos city Los Altos Hills town Los Gatos town Milpitas city Monte Sereno city Morgan Hill city Mountain View city Palo Alto city San Jose city Santa Clara city Santa Clara County Saratoga city Sunnyvale city (blank) Total 14
15 District Business and Advisory Services District Business and Advisory Services (DBAS) provides a full range of business services to all school districts and related educational entities in the county. We provide services in the areas of payroll, finance, attendance accounting, record retention, legislation, training, and the data processing systems associated with those areas. SERVICES Advisory Services Attendance Regulation Financial Audit Payroll Audit Resources ADVISORY SERVICES DBAS calculates district revenue limits; distributes district apportionments; maintains district property tax revenues; reports on deferred maintenance and advises districts on accounting and financial reporting; acts as business manager for small service districts (less than 900 ADA); reviews district budgets, interim reports and audits. ATTENDANCE REGULATION DBAS publishes school district calendars; advises and trains districts on attendance rules; collects and recommends certification of monthly attendance reports. BUSINESS SERVICES DBAS maintains district cash balances; collects cash receipts; reconciles bank and county controller accounts; maintains master chart of accounts; provides new Fiscal Manager Orientations and ongoing business training and workshops on District best practices. PAYROLL AUDIT DBAS audits payroll input; processes wage garnishments; monitors retirement reporting and wage and tax reporting; disseminates information on payroll regulations; and audits W2 reporting. 15

16 Financial Statistical Report District Boundary Map Sources: Santa Clara County Office of Education 16
17 Section I: K 12 School Districts K 12 School Districts Section I: 17
18 School Districts Name Superintendent Address Alum Rock Union School District Phone: Berryessa Union School District Phone: Cambrian School District Phone: Campbell Union High School District Phone: Campbell Union School District Phone: Cupertino Union School District Phone: East Side Union High School District Phone: Evergreen School District Phone: Franklin-McKinley School District Phone: Fremont Union High School District Phone: Gilroy Unified School District Phone: Lakeside Joint School District Phone: Loma Prieta Joint Union School District Phone: Los Altos School District Phone: Los Gatos Union School District Phone: Los Gatos-Saratoga Joint Union H.S. District Phone: Luther Burbank School District Phone: Metropolitan Education District Phone: José L. Manzo Will Ector Deborah L. Blow Rhonda E. Farber Eric Andrew Phil J. Quon Dan Moser Kathy Gomez John Porter Polly M. Bove Deborah Flores Elizabeth Bozzo Patricia Lamson (Interim) Jeffrey Baier Diana Abbati 2930 Gay Avenue San Jose, CA Piedmont Road San Jose, CA Jacksol Drive San Jose, CA Union Avenue San Jose, CA N.Third Street Campbell, CA Vista Drive Cupertino, CA N. Capitol Avenue San Jose, CA Quimby Road San Jose, CA Wool Creek Drive San Jose, CA W. Fremont Avenue Sunnyvale, CA Arroyo Circle Gilroy, CA Black Road Los Gatos, CA Summit Road Los Gatos, CA Covington Road Los Altos, CA Roberts Road Los Gatos, CA Bob Mistele Farley Road W. Los Gatos, CA Jan Kaay Paul Hay 4 Wabash Avenue San Jose, CA Hillsdale Avenue San Jose, CA
19 Milpitas Unified School District Phone: Moreland School District Phone: Morgan Hill Unified School District Phone: Mount Pleasant School District Phone: Mountain View Whisman School District Phone: Mountain View-Los Altos Union HS Dist. Phone: Oak Grove School District Phone: Orchard School District Phone: Palo Alto Unified School District Phone: San Jose Unified School District Phone: Santa Clara Unified School District Phone: Saratoga Union School District Phone: Sunnyvale School District Phone: Union Elementary School District Phone: School Districts Name Superintendent Address Cary Matsuoka Mark Barmore Wesley Smith Mariann Engle Craig A. Goldman Barry Groves Chris Jew (Interim) Joseph A. Amelio Kevin Skelly Vincent Matthews Bobbie Plough Lane Weiss Benjamin Picard Jacqueline Horejs 1331 East Calaveras Boulevard Milpitas, CA Campbell Avenue San Jose, CA Concord Circle Morgan Hill, CA Marten Avenue San Jose, CA A San Pierre Way Mountain View, CA Bryant Avenue Mountain View, CA Santa Teresa Boulevard San Jose, CA Fox Lane San Jose, CA Churchill Avenue Palo Alto, CA Lenzen Avenue San Jose, CA Lawrence Road Santa Clara, CA Forrest Hills Drive Saratoga, CA West Iowa Avenue Sunnyvale, CA Union Avenue San Jose, CA
20 20 Fiscal Year Historical COLAs and Deficits COLA Funded COLA for Average District (1) K 12 DEFICIT % 0% 17.96% % 7.64% 18.36% % 2.63% 7.88% % 4.53% 0.00% % 6.87% 0.00% % 5.56% 0.89% % 3.32% 2.14% % 1.12% 3.00% % 2.00% 0.00% % 3.87% 0.00% % 10.90% 0.00% % 2.43% 7.00% % 3.95% 8.80% % 2.65% 8.80% % 3.39% 8.80% % 3.76% 10.12% % 0.00% 11.01% % 0.56% 8.14% % 1.96% 5.86% % 0.50% 5.14% % 3.52% 1.18% % 4.64% 0.00% % 4.10% 0.00% % 2.54% 0.00% % 5.49% 0.00% % 6.19% 0.00% % 6.02% 0.00% % 8.00% 0.00% $11.90 Per ADA $11.90 Per ADA 0.00% % 7.90% 0.00% % 8.50% 0.00% % 8.60% 0.00% (1) The funded COLA is the statutory COLA increased or decreased by the effect of the change in the deficit from the prior year, or may be greater than the statutory COLA if the Budget Act for that fiscal year provided a greater than statutory COLA.

21 Historical COLAs and Deficits Source: School Services Revised 07/26/11 21
22 Five Year Comparison of P2 ADA by District Type Type District Name Elem High Unified Alum Rock 12, , , , , Berryessa 8, , , , , Cambrian Campbell 6, , , Cupertino 16, , , , , Evergreen 12, , , , , Franklin McKinley 9, , , , , Lakeside Joint** Loma Prieta Los Altos 4, , , , , Los Gatos 2, , , , , Luther Burbank Moreland 3, , , , , Mount Pleasant 2, , , , , Mountain View Whisman 4, , , , , Oak Grove 11, , , , , Orchard Saratoga 2, , , , , Sunnyvale 5, , , , , Union 4, , , , , Campbell 7, , , , , East Side 23, , , , , Fremont 9, , , , , Los Gatos Saratoga 3, , , , , Mountain View Los Altos 3, , , , , Gilroy 9, , , , , Milpitas 9, , , , , Morgan Hill 8, , , , , Palo Alto** 10, , , , , San Jose 29, , , , , Santa Clara 13, , , , , TOTAL 237, , , , , ADA Data is based on certified attendance reports. The ADA excludes Adult Ed and ROC/P and Includes Conversion Charters 22
23 Five Year Comparison of P2 ADA by District Type Sum of Sum of Sum of Sum of Sum of Elem High Unified 23
24 This Page Left Blank Intentionally 24
25 Five Year Comparison of P2 ADA by District Sum of Sum of Sum of Sum of Sum of Alum Rock Berryessa Cambrian Campbell Cupertino Evergreen Franklin McKinley Lakeside Joint** Loma Prieta Los Altos Los Gatos Luther Burbank Moreland Mount Pleasant Mountain View Whisman Oak Grove Orchard Saratoga Sunnyvale Union Campbell East Side Fremont Los Gatos Saratoga Mountain View Los Altos Gilroy Milpitas Morgan Hill Palo Alto** San Jose Santa Clara Elem High Unified 25
26 Three Year Revenue Limit Data Unified High Elem Type District FY FY Base RL RL ADA Total RL Deficited RL Base RL RL ADA Total RL Deficited RL Alum Rock $ 5, $ 75,995, $ 70,581, $ 6, $ 78,884, $ 64,912, Berryessa $ 5, $ 47,608, $ 44,027, $ 6, $ 49,707, $ 40,725, Cambrian $ 5, $ 4,137, $ 3,809, $ 6, $ 4,491, $ 3,679, Campbell Elem $ 5, $ 41,751, $ 38,476, $ 6, $ 43,603, $ 35,600, Cupertino Union $ 5, $ 100,723, $ 93,461, $ 6, $ 107,324, $ 88,277, Evergreen $ 5, $ 76,754, $ 70,830, $ 6, $ 80,015, $ 65,417, Franklin McKinley $ 5, $ 56,435, $ 52,188, $ 6, $ 59,047, $ 48,376, Lakeside Joint $ 6, $ 559, $ 516, $ 6, $ 549, $ 449, Loma Prieta $ 5, $ 2,293, $ 2,132, $ 6, $ 2,382, $ 1,964, Los Altos $ 5, $ 24,290, $ 22,463, $ 6, $ 25,578, $ 20,956, Los Gatos Union $ 5, $ 16,147, $ 14,931, $ 6, $ 17,342, $ 14,207, Luther Burbank $ 5, $ 3,254, $ 3,003, $ 6, $ 3,378, $ 2,762, Moreland $ 5, $ 22,859, $ 21,138, $ 6, $ 24,292, $ 19,901, Mt. Pleasant $ 5, $ 16,851, $ 15,583, $ 6, $ 17,575, $ 14,397, Mtn. View Whisman $ 5, $ 25,491, $ 24,266, $ 6, $ 27,680, $ 23,458, Oak Grove $ 5, $ 67,543, $ 62,507, $ 6, $ 69,808, $ 57,239, Orchard $ 6, $ 5,198, $ 4,823, $ 6, $ 5,456, $ 4,485, Saratoga Union $ 5, $ 13,491, $ 12,475, $ 6, $ 13,713, $ 11,234, Sunnyvale $ 5, $ 35,081, $ 32,620, $ 6, $ 37,590, $ 31,124, Union $ 5, $ 26,026, $ 24,068, $ 6, $ 28,004, $ 22,942, Campbell Union Hig $ 7, $ 51,993, $ 48,280, $ 7, $ 54,186, $ 44,615, East Side Union High $ 7, $ 168,889, $ 156,106, $ 7, $ 176,264, $ 144,339, Fremont Union High $ 7, $ 70,732, $ 65,388, $ 7, $ 73,700, $ 60,366, Los Gatos Saratoga $ 7, $ 21,625, $ 19,952, $ 7, $ 22,563, $ 18,443, Mtn. View Los Altos $ 7, $ 24,886, $ 22,960, $ 7, $ 26,024, $ 21,271, Palo Alto Unified $ 6, $ 70,790, $ 65,316, $ 6, $ 74,853, $ 61,187, San Jose Unified $ 6, $ 185,093, $ 171,145, $ 6, $ 195,278, $ 159,965, Gilroy Unified $ 6, $ 61,635, $ 56,986, $ 6, $ 66,622, $ 54,570, Morgan Hill Unified $ 6, $ 53,859, $ 49,795, $ 6, $ 56,228, $ 46,059, Milpitas Unified $ 6, $ 57,926, $ 53,746, $ 6, $ 60,970, $ 50,027, Santa Clara Unified $ 6, $ 85,843, $ 79,979, $ 6, $ 91,020, $ 75,171,
27 Three Year Revenue Limit Data FY District Base RL RL ADA Total RL Deficited RL $ 6, , $ 76,441,164 $ 62,710,038 Alum Rock $ 6, , $ 49,580,227 $ 40,674,131 Berryessa $ 6, $ 4,340,534 $ 3,560,844 Cambrian $ 6, , $ 44,752,897 $ 36,713,934 Campbell Elem $ 6, , $ 110,203,234 $ 90,407,427 Cupertino Union $ 6, , $ 80,243,770 $ 65,829,582 Evergreen $ 6, , $ 55,010,657 $ 45,129,093 Franklin McKinley $ 6, $ 549,649 $ 450,915 Lakeside Joint $ 6, $ 2,465,139 $ 2,022,326 Loma Prieta $ 6, , $ 26,191,235 $ 21,486,503 Los Altos $ 6, , $ 18,065,751 $ 14,820,600 Los Gatos Union $ 6, $ 3,369,869 $ 2,764,539 Luther Burbank $ 6, , $ 24,948,565 $ 20,467,054 Moreland $ 6, , $ 14,545,417 $ 11,932,624 Mt. Pleasant $ 6, , $ 29,496,686 $ 24,198,197 Mtn. View Whisman $ 6, , $ 68,751,316 $ 56,401,517 Oak Grove $ 6, $ 5,615,112 $ 4,606,470 Orchard $ 6, , $ 13,575,953 $ 11,137,305 Saratoga Union $ 6, , $ 38,942,153 $ 31,946,974 Sunnyvale $ 6, , $ 28,456,236 $ 23,344,642 Union $ 7, , $ 53,047,442 $ 43,518,530 Campbell Union High $ 7, , $ 175,496,498 $ 143,972,062 East Side Union High $ 7, , $ 74,168,716 $ 60,845,790 Fremont Union High $ 7, , $ 22,157,113 $ 18,177,031 Los Gatos Saratoga $ 7, , $ 25,980,027 $ 21,313,235 Mtn. View Los Altos $ 6, , $ 78,464,944 $ 64,370,286 Palo Alto Unified $ 6, , $ 199,690,343 $ 163,819,967 San Jose Unified $ 6, , $ 67,331,567 $ 55,236,798 Gilroy Unified $ 6, , $ 55,724,724 $ 45,714,892 Morgan Hill Unified $ 6, , $ 61,998,693 $ 50,861,868 Milpitas Unified $ 6, , $ 93,709,688 $ 76,876,617 Santa Clara Unified Unified High Elem Type Source: State RL Software Annual Data 27
28 Historical Information: Interest Rates Year QTR 1 QTR2 QTR3 QTR QTR 1 QTR 2 QTR 3 QTR Note: Negative interest rates are applied to funds with negative average daily cash balances Negative interest rate is the sum of interest rate before admin charges plus admin charge rate. 28
29 Summary of General Fund Revenues and Expenditures by District 29
30 Summary of General Fund Revenues and Expenditures Type District Name TOTAL REVENUES TOTAL EXPENDITURES Elem High Unified Alum Rock $ 106,529, $ 108,912, Berryessa $ 59,497, $ 56,697, Cambrian $ 24,877, $ 23,049, Campbell $ 65,472, $ 58,726, Cupertino $ 141,305, $ 132,625, Evergreen $ 91,939, $ 91,671, Franklin McKinley $ 77,975, $ 75,267, Lakeside Joint** $ 1,550, $ 1,376, Loma Prieta $ 4,451, $ 4,355, Los Altos $ 43,097, $ 42,743, Los Gatos $ 26,809, $ 25,801, Luther Burbank $ 4,143, $ 4,269, Moreland $ 35,756, $ 35,908, Mount Pleasant $ 85,054, $ 84,927, Mountain View Whisman $ 43,760, $ 40,635, Oak Grove $ 88,999, $ 87,995, Orchard $ 6,517, $ 5,712, Saratoga $ 22,018, $ 23,744, Sunnyvale $ 57,052, $ 59,224, Union $ 34,563, $ 37,954, Campbell $ 68,397, $ 66,844, East Side $ 204,374, $ 194,686, Fremont $ 90,541, $ 94,820, Los Gatos Saratoga $ 35,611, $ 35,362, Mountain View Los Altos $ 52,713, $ 47,158, Gilroy $ 85,747, $ 84,814, Milpitas $ 77,524, $ 74,082, Morgan Hill $ 66,852, $ 65,774, Palo Alto** $ 162,603, $ 155,639, San Jose $ 284,427, $ 282,260, Santa Clara $ 119,796, $ 130,658, TOTAL $ 2,269,965, $ 2,233,702,
31 Summary of General Fund Revenues and Expenditures by District Millions Alum Rock Berryessa Cambrian Campbell Cupertino Evergreen Franklin McKinley Lakeside Joint** Loma Prieta Elem High Unified Los Altos Los Gatos Luther Burbank Moreland Mount Pleasant Mountain View Whisman Oak Grove Orchard Saratoga Sunnyvale Union Campbell East Side Fremont Los Gatos Saratoga Mountain View Los Altos Gilroy Milpitas Morgan Hill Palo Alto** San Jose Santa Clara TOTAL REVENUES TOTAL EXPENDITURES Sources: Unaudited Actual Reports 31
32 General Fund Revenue Data Type District Name Revenue Limit Sources Federal Revenue State Revenue Local Revenue TOTAL REVENUES Elem High Unified Alum Rock $ 62,851, $ 11,426, $ 25,214, $ 7,036, $ 106,529, Berryessa $ 40,872, $ 4,043, $ 9,374, $ 5,206, $ 59,497, Cambrian $ 16,901, $ 1,356, $ 4,024, $ 2,595, $ 24,877, Campbell $ 39,357, $ 4,230, $ 15,232, $ 6,652, $ 65,472, Cupertino $ 92,836, $ 9,899, $ 18,061, $ 20,507, $ 141,305, Evergreen $ 65,800, $ 5,145, $ 14,411, $ 6,583, $ 91,939, Franklin McKinley $ 48,136, $ 8,275, $ 16,319, $ 5,244, $ 77,975, Lakeside Joint** $ 967, $ 74, $ 122, $ 386, $ 1,550, Loma Prieta $ 2,807, $ 237, $ 392, $ 1,013, $ 4,451, Los Altos $ 25,458, $ 1,783, $ 2,115, $ 13,740, $ 43,097, Los Gatos $ 17,696, $ 1,043, $ 1,237, $ 6,832, $ 26,809, Luther Burbank $ 2,757, $ 311, $ 867, $ 206, $ 4,143, Moreland $ 20,400, $ 2,175, $ 4,917, $ 8,262, $ 35,756, Mount Pleasant $ 13,777, $ 33,527, $ 36,274, $ 1,474, $ 85,054, Mountain View Whisman $ 25,672, $ 2,678, $ 5,017, $ 10,391, $ 43,760, Oak Grove $ 59,255, $ 5,835, $ 16,857, $ 7,049, $ 88,999, Orchard $ 4,599, $ 519, $ 875, $ 523, $ 6,517, Saratoga $ 18,421, $ 651, $ 1,162, $ 1,783, $ 22,018, Sunnyvale $ 38,432, $ 3,586, $ 6,491, $ 8,542, $ 57,052, Union $ 24,695, $ 2,138, $ 4,479, $ 3,250, $ 34,563, Campbell $ 52,588, $ 3,364, $ 5,039, $ 7,404, $ 68,397, East Side $ 143,152, $ 19,751, $ 30,959, $ 10,511, $ 204,374, Fremont $ 78,170, $ 2,506, $ (2,248,254.99) $ 12,113, $ 90,541, Los Gatos Saratoga $ 30,884, $ 1,157, $ 1,421, $ 2,148, $ 35,611, Mountain View Los Altos $ 41,166, $ 1,534, $ 4,921, $ 5,090, $ 52,713, Gilroy $ 57,672, $ 8,825, $ 13,508, $ 5,742, $ 85,747, Milpitas $ 51,017, $ 6,615, $ 11,576, $ 8,314, $ 77,524, Morgan Hill $ 44,881, $ 5,517, $ 10,169, $ 6,283, $ 66,852, Palo Alto $ 115,006, $ 5,236, $ 8,172, $ 34,188, $ 162,603, San Jose $ 168,214, $ 24,822, $ 75,286, $ 16,103, $ 284,427, Santa Clara $ 90,030, $ 6,982, $ 12,223, $ 10,559, $ 119,796,


33 General Fund Revenue Data Other State Revenue % Other Local Revenue % Federal Revenue % Revenue Limit % 33
34 General Fund Expenditures Salaries & Benefits by District Type Type District Name Certificated Salaries Classified Salaries Employee Benefits Elem High Unified Alum Rock $ 55,083, $ 14,355, $ 21,158, Berryessa $ 29,418, $ 7,039, $ 12,879, Cambrian $ 12,610, $ 3,183, $ 4,128, Campbell $ 31,455, $ 8,768, $ 9,818, Cupertino $ 68,609, $ 24,825, $ 23,444, Evergreen $ 52,495, $ 9,131, $ 21,899, Franklin McKinley $ 38,973, $ 9,351, $ 13,564, Lakeside Joint** $ 513, $ 197, $ 139, Loma Prieta $ 1,923, $ 959, $ 699, Los Altos $ 19,854, $ 6,622, $ 9,269, Los Gatos $ 13,654, $ 3,578, $ 4,668, Luther Burbank $ 2,061, $ 581, $ 699, Moreland $ 18,249, $ 5,310, $ 6,987, Mount Pleasant $ 11,625, $ 3,611, $ 4,563, Mountain View Whisman $ 17,918, $ 6,251, $ 8,583, Oak Grove $ 42,856, $ 13,005, $ 18,380, Orchard $ 2,863, $ 779, $ 1,166, Saratoga $ 12,099, $ 3,779, $ 4,892, Sunnyvale $ 28,273, $ 9,271, $ 11,091, Union $ 19,433, $ 4,536, $ 6,233, Campbell $ 31,581, $ 8,768, $ 14,004, East Side $ 98,952, $ 24,354, $ 48,371, Fremont $ 45,963, $ 15,862, $ 18,591, Los Gatos Saratoga $ 17,377, $ 5,898, $ 6,412, Mountain View Los Altos $ 22,969, $ 8,116, $ 9,759, Gilroy $ 42,026, $ 12,690, $ 15,524, Milpitas $ 39,528, $ 10,593, $ 13,092, Morgan Hill $ 31,366, $ 8,974, $ 11,692, Palo Alto** $ 75,155, $ 27,022, $ 31,785, San Jose $ 132,192, $ 39,053, $ 59,336, Santa Clara $ 68,046, $ 20,455, $ 22,416,
35 Chart General Fund Expenditures Salaries & Benefits by District Type x $1, $1, $ $ Alum Rock Berryessa Cambrian Campbell Cupertino Evergreen Franklin McKinley Lakeside Joint** Loma Prieta Los Altos Los Gatos Luther Burbank Moreland Mount Pleasant Mountain View Whisman Oak Grove Orchard Saratoga Sunnyvale Union Campbell East Side Fremont Los Gatos Saratoga Mountain View Los Altos Gilroy Milpitas Morgan Hill Palo Alto** San Jose Santa Clara Elem High Unified Certificated Salaries Classified Salaries Employee Benefits
36 General Fund Expenditures by District Type Type District Name Books & Supplies Services Operating Exp Capital Outlay Other Outgo Other Outgo Trns of Indirect Costs Elem High Unified Alum Rock $ 4,197, $ 13,871, $ 75, $ 449, $ (277,737.92) Berryessa $ 1,271, $ 5,752, $ 24, $ 376, $ (63,994.48) Cambrian $ 671, $ 2,452, $ $ 2, $ Campbell $ 3,276, $ 5,223, $ 167, $ 238, $ (220,919.79) Cupertino $ 5,577, $ 10,111, $ 185, $ 72, $ (201,111.91) Evergreen $ 2,423, $ 5,649, $ 41, $ 114, $ (84,482.82) Franklin McKinley $ 2,750, $ 9,967, $ 36, $ 834, $ (211,256.32) Lakeside Joint** $ 23, $ 448, $ $ 54, $ Loma Prieta $ 192, $ 576, $ 5, $ $ Los Altos $ 1,626, $ 4,820, $ 213, $ 336, $ Los Gatos $ 764, $ 2,714, $ 38, $ 383, $ Luther Burbank $ 170, $ 792, $ $ $ (35,528.75) Moreland $ 1,258, $ 4,214, $ (56,913.40) $ 6, $ (62,275.26) Mount Pleasant $ 1,020, $ 2,463, $ 32, $ 61,660, $ (49,956.51) Mountain View Whisman $ 1,708, $ 6,113, $ 76, $ 6, $ (23,659.03) Oak Grove $ 1,963, $ 8,241, $ 224, $ 3,497, $ (172,591.30) Orchard $ 217, $ 577, $ $ 112, $ (5,142.00) Saratoga $ 708, $ 2,210, $ 68, $ $ (15,000.00) Sunnyvale $ 2,155, $ 8,483, $ $ 66, $ (117,096.43) Union $ 1,566, $ 3,970, $ 536, $ 1,676, $ Campbell $ 1,771, $ 8,332, $ 248, $ 2,136, $ East Side $ 3,626, $ 16,630, $ 27, $ 3,185, $ (462,448.54) Fremont $ 3,787, $ 10,688, $ 22, $ 84, $ (180,750.82) Los Gatos Saratoga $ 1,108, $ 4,557, $ 47, $ 4, $ Mountain View Los Altos $ 1,398, $ 4,918, $ 8, $ 117, $ (129,678.61) Gilroy $ 3,416, $ 9,374, $ 96, $ 1,924, $ (240,550.79) Milpitas $ 2,778, $ 5,255, $ 370, $ 2,811, $ (348,263.62) Morgan Hill $ 2,782, $ 7,778, $ 81, $ 3,240, $ (141,455.78) Palo Alto** $ 6,051, $ 15,020, $ 700, $ $ (96,289.09) San Jose $ 11,385, $ 38,709, $ 870, $ 1,172, $ (459,466.02) Santa Clara $ 4,746, $ 15,107, $ 81, $ 217, $ (410,824.74) 36


37 Chart General Fund Expense Data $(20.00) $ $20.00 $40.00 $60.00 $80.00 Alum Rock Millions Cambrian Cupertino Franklin McKinley Elem Loma Prieta Los Gatos Moreland Mountain View Whisman Orchard Sunnyvale Campbell Books & Supplies Services Operating Exp Capital Outlay Other Outgo Other Outgo Trns of Indirect Costs High Fremont Mountain View Los Altos Unified Milpitas Palo Alto** Santa Clara 37
38 This Page Left Blank Intentionally 38


39 Chart General Fund Expense Data Capital Outlay Services & Operating 1% Expenses % Other Outgo % Trans of Indirect Costs % Books & Supplies % Certificated Salaries % Employee Benefits % Classified Salaries % 39


40 Santa Clara County Type of LEA Teacher s Salary Santa Clara County vs. California # of LEA Total Salary Schedule FTE Total Salary Schedule Cost Average Salary Paid Highest Entry Level Sal Schedule Step Mid Point Salary Offered Lowest Schedule Salary Offered County Office $ 25,859, $ 74, $ 87, $ 66, $ 45, Elementary 19 5, $ 412,441, $ 69, $ 97, $ 69, $ 42, High 5 2, $ 189,417, $ 78, $ 117, $ 79, $ 41, Unified 6 4, $ 327,375, $ 71, $ 103, $ 71, $ 39, County Totals 31 13, $ 955,094, California State County Office 41 4, $ 300,653, $ 67, $ 102, $ 67, $ 31, Elementary , $ 3,639,101, $ 67, $ 115, $ 70, $ 24, High 75 23, $ 1,705,871, $ 71, $ 119, $ 76, $ 33, Unified , $ 13,551,990, $ 67, $ 118, $ 72, $ 26, Common Admin 6 3, $ 276,127, $ 71, $ 95, $ 65, $ 35, Overall Totals , $ 19,473,745, Total Statewide Averages $ 67, $ 78, $ 59, $ 40, $80, $70, $60, $50, $40, $30, $20, $10, $0.00 Average Salary Paid Mid Point Salary Offered Lowest Schedule Salary Offered SCCOE County Averages Total Statewide Averages Source: Selected certificated salaries and related statistics a compilation of selected salary statistics from " salary and benefits schedule for the certificated bargaining unit (form j 90." updated as of January 25,


41 Chart Teacher s Salary Santa Clara County vs. California $120, $100, $80, $60, $40, County Office CA County Office SCCOE Elementary CA Elementary SCCOE High CA High SCCOE Unified CA Unified SCCOE $20, $0.00 Average Salary Paid Highest Entry Level Sal Schedule Step Mid Point Salary Offered Lowest Schedule Salary Offered 41
42 Teacher s Salary by District Type Unified High Elementary District Total Salary Schedule FTE Lowest Salary Schedule Offered Lowest Salary Heading Offered Average Salary Paid Highest Salary Schedule Sal At BA+10 No Of Service Days Required Alum Rock Union $46, BA $65, $84, $72, Berryessa Cambrian $53, BA+30 $72, $92, $74, Campbell Union $47, NC $67, $85, $70, Cupertino Union $50, EC $69, $96, $74, Evergreen $49, BA NC $74, $92, $71, Franklin McKinley $43, BA $74, $87, $74, Lakeside Joint Loma Prieta Joint 21 $45, NC $70, $83, $62, Los Altos $44, BA+30 $74, $86, $69, Los Gatos Union $47, NC $74, $91, $73, Luther Burbank Moreland $49, BA+30 $69, $92, $69, Mountain View Whisman $44, BA+30 $61, $82, $64, Mt. Pleasant $47, BA+30 $66, $91, $65, Oak Grove $43, BA $65, $83, $68, Orchard 40.2 $42, BA+30 $66, $85, $72, Saratoga Union $50, EC/I $78, $97, $76, Sunnyvale $48, BA<45 $67, $91, $70, Union $42, BA<30 $69, $85, $67, Campbell Union $41, BA<30 $66, $87, $69, East Side Union 1, $48, BA $79, $98, $79, Fremont Union $50, BA $74, $93, $78, Los Gatos Saratoga Joint 165 $57, BA $92, $114, $88, Mountain View Los Altos $62, BA $99, $117, $98, Gilroy Unified $43, BA+PR $64, $81, $64, Milpitas Unified $49, BA $72, $91, $77, Morgan Hill $42, BA $63, $82, $65, Palo Alto Unified $51, BA $85, $103, $81, San Jose Unified 1, $43, BA NC $67, $87, $71, Santa Clara $39, BA $73, $89, $75,
43 Student Ethnicity by District Un ified High Elem Type District Name African American not Hispanic American Indian or Alaska Native Asian Filipino Hispanic or Latino Alum Rock Union 283 (2.1%) 46 (0.3%) 1,405 (10.5%) 768 (5.7%) 10,411 (77.9%) Berryessa Union 1 (0.0%) 25 (0.3%) 4,062 (48.8%) 956 (11.5%) 2,048 (24.6%) Cambrian 129 (4.0%) 31 (1.0%) 481 (14.9%) 90 (2.8%) 781 (24.3%) Campbell Union 359 (4.8%) 56 (0.7%) 859 (11.4%) 212 (2.8%) 80 (1.1%) Cupertino Union 212 (1.2%) 44 (0.2%) 12,675 (70.4%) 195 (1.1%) 909 (5.0%) Evergreen 396 (3.0%) 29 (0.2%) 6,348 (47.6%) 1,134 (8.5%) 4,117 (30.9%) Franklin McKinley 154 (1.5%) 27 (0.3%) 3,064 (30.0%) 384 (3.8%) 6,202 (60.8%) Lakeside Joint 0 (0.0%) 0 (0.0%) 3 (3.6%) 0 (0.0%) 2 (2.4%) Loma Prieta Joint Union 1 (0.2%) 4 (1.0%) 17 (4.1%) 1 (0.2%) 37 (9.0%) Los Altos 14 (0.3%) 0 (0.0%) 1,153 (26.9%) 25 (0.6%) 314 (7.3%) Los Gatos Saratoga 8 (0.3%) 7 (0.2%) 876 (27.6%) 14 (0.4%) 191 (6.0%) Luther Burbank 12 (2.1%) 0 (0.0%) 4 (0.7%) 5 (0.9%) 506 (88.9%) Moreland 117 (2.8%) 13 (0.3%) 949 (23.0%) 82 (2.0%) 1,318 (31.9%) Mountain View Whisman 165 (3.5%) 22 (0.5%) 590 (12.6%) 218 (4.7%) 2,014 (43.0%) Mt. Pleasant 68 (2.5%) 4 (0.1%) 228 (8.3%) 112 (4.1%) 1,096 (39.8%) Oak Grove 652 (5.6%) 74 (0.6%) 2,261 (19.4%) 352 (3.0%) 5,343 (45.9%) Orchard 61 (7.3%) 3 (0.4%) 365 (43.7%) 77 (9.2%) 256 (30.6%) Saratoga Union 3 (0.1%) 4 (0.2%) 1,139 (50.8%) 17 (0.8%) 85 (3.8%) Sunnyvale 189 (3.0%) 27 (0.4%) 1,542 (24.5%) 502 (8.0%) 2,712 (43.0%) Union 105 (2.2%) 8 (0.2%) 654 (13.8%) 72 (1.5%) 838 (17.7%) Campbell Union High 268 (3.4%) 25 (0.3%) 853 (10.9%) 110 (1.4%) 2,403 (30.8%) East Side Union High 1,062 (3.9%) 94 (0.3%) 7,501 (27.9%) 2,311 (8.6%) 12,966 (48.2%) Fremont Union High 174 (1.7%) 38 (0.4%) 5,424 (52.7%) 333 (3.2%) 1,449 (14.1%) Los Gatos Union 14 (0.5%) 6 (0.2%) 319 (10.9%) 17 (0.6%) 169 (5.8%) Mountain View Los Altos 108 (2.9%) 10 (0.3%) 655 (17.8%) 128 (3.5%) 854 (23.3%) Gilroy 147 (1.3%) 54 (0.5%) 316 (2.8%) 177 (1.6%) 7,832 (70.5%) Milpitas 357 (3.6%) 29 (0.3%) 3,974 (40.5%) 2,002 (20.4%) 2,194 (22.4%) Morgan Hill 213 (2.2%) 43 (0.4%) 679 (7.1%) 162 (1.7%) 4,451 (46.3%) Palo Alto 310 (2.6%) 13 (0.1%) 3,445 (29.4%) 23 (0.2%) 1,298 (11.1%) San Jose 1,091 (3.4%) 248 (0.8%) 4,222 (13.0%) 612 (1.9%) 16,706 (51.5%) Santa Clara 625 (4.2%) 69 (0.5%) 3,408 (22.8%) 1,132 (7.6%) 5,253 (35.2%) State Totals: 424,327 (6.9%) 44,915 (0.7%) 526,866 (8.5%) 156,433 (2.5%) 3,118,404 (50.4%) Source Data Quest 43
44 Student Ethnicity by District (continued) Type District Name Pacific Islander White not Hispanic Two or More Races None Reported (Ethnicity) Elementary High Unified Alum Rock Union 106 (0.8%) 344 (2.6%) 9 (0.1%) 0 (0.0%) Berryessa Union 337 (4.0%) 514 (6.2%) 383 (4.6%) 1 (0.0%) Cambrian 41 (1.3%) 1,629 (50.6%) 23 (0.7%) 13 (0.4%) Campbell Union 56 (0.7%) 60 (0.8%) 27 (0.4%) 5,819 (77.3%) Cupertino Union 51 (0.3%) 3,862 (21.4%) 59 (0.3%) 3 (0.0%) Evergreen 111 (0.8%) 1,161 (8.7%) 17 (0.1%) 10 (0.1%) Franklin Mckinley 61 (0.6%) 225 (2.2%) 45 (0.4%) 40 (0.4%) Lakeside Joint 0 (0.0%) 78 (92.9%) 1 (1.2%) 0 (0.0%) Loma Prieta Joint Union 0 (0.0%) 327 (79.8%) 23 (5.6%) 0 (0.0%) Los Altos 11 (0.3%) 2,252 (52.5%) 412 (9.6%) 112 (2.6%) Los Gatos Saratoga 7 (0.2%) 1,849 (58.3%) 146 (4.6%) 71 (2.2%) Luther Burbank 2 (0.4%) 25 (4.4%) 0 (0.0%) 15 (2.6%) Moreland 21 (0.5%) 1,306 (31.6%) 322 (7.8%) 7 (0.2%) Mountain View Whisman 56 (1.2%) 1,488 (31.7%) 0 (0.0%) 135 (2.9%) Mt. Pleasant 10 (0.4%) 90 (3.3%) 8 (0.3%) 1,137 (41.3%) Oak Grove 115 (1.0%) 2,405 (20.7%) 46 (0.4%) 385 (3.3%) Orchard 1 (0.1%) 63 (7.5%) 0 (0.0%) 10 (1.2%) Saratoga Union 1 (0.0%) 848 (37.9%) 142 (6.3%) 1 (0.0%) Sunnyvale 65 (1.0%) 1,235 (19.6%) 20 (0.3%) 13 (0.2%) Union 36 (0.8%) 2,802 (59.2%) 115 (2.4%) 107 (2.3%) Campbell Union High 51 (0.7%) 3,575 (45.9%) 482 (6.2%) 24 (0.3%) East Side Union High 250 (0.9%) 2,555 (9.5%) 80 (0.3%) 96 (0.4%) Fremont Union High 55 (0.5%) 2,811 (27.3%) 1 (0.0%) 0 (0.0%) Los Gatos Union 5 (0.2%) 2,147 (73.3%) 177 (6.0%) 76 (2.6%) Mountain View Los Altos 31 (0.8%) 1,844 (50.2%) 43 (1.2%) 0 (0.0%) Gilroy 31 (0.3%) 2,075 (18.7%) 139 (1.3%) 345 (3.1%) Milpitas 110 (1.1%) 890 (9.1%) 237 (2.4%) 9 (0.1%) Morgan Hill 48 (0.5%) 3,606 (37.5%) 302 (3.1%) 116 (1.2%) Palo Alto 57 (0.5%) 5,511 (47.1%) 978 (8.4%) 69 (0.6%) San Jose 176 (0.5%) 8,658 (26.7%) 0 (0.0%) 710 (2.2%) Santa Clara 159 (1.1%) 3,690 (24.7%) 461 (3.1%) 142 (1.0%) State Totals: 37,012 (0.6%) 1,673,278 (27.0%) 96,785 (1.6%) 112,405 (1.8%) 44
45 SECTION III: VOTED AND BONDED INDEBTEDNESS Voted and Bonded Indebtedness Section III: 45
46 Voted and Bonded Indebtedness Overview Current law allows both K 12 school districts and community college districts to incur voter approved debt. The most commonly used method is through the issuance of a general obligation bond. Traditionally, a bond issuance must be approved by twothirds of the registered voters within the district and is then repaid through a property tax levy. Proposition 39, approved by state voters in November 2000, and AB 701 (Chapter 44/Statutes 2000), provided for a 55 percent voter approval, if certain conditions are met. These conditions include restricting the use of the funds for salaries and operating expenses, limiting the presentation of the bond measure to only general elections, and a maximum tax rate of $60 per $100,000 assessed valuation for districts and $30 for any secondary districts for each election. Districts still have the option of seeking approval of bonds by two thirds of registered voters if they do not want to comply with the additional restrictions of Proposition 39 and AB
47 Ratio of General Bonded Debt Outstanding Source: Santa Clara County CAFR 47
48 Direct and Overlapping Bonded Debt Source: Santa Clara County CAFR 48
49 Direct and Overlapping Bonded Debt Source: Santa Clara County CAFR 49
50 Legal Debt Margin Information Source: Santa Clara County CAFR 50
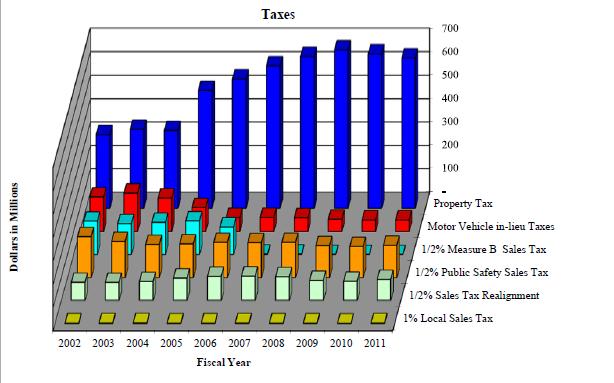
51 SECTION IV: TAX REVENUE Section IV: Tax Revenue 51
52 Chart Five Year Historical Property Taxes Millions 1, , , Property Tax Summary By District Type Elementary High School Unified Total Millions Property Taxes by District Alum Rock Elem Berryessa Elem Cambrian Elem Campbell Elem Cupertino Elem Evergreen Elem Franklin Mckinley Lakeside Elem Loma Prieta Elem Los Altos Elem Los Gatos Elem Luther Burbank Elem Montebello Elem Moreland Elem Mt View Whisman Elem Mt Pleasant Elem Oak Grove Elem Orchard Elem Saratoga Elem Sunnyvale Elem Union Elem Campbell High East Side High Fremont High Los Gatos High Mt. View Los Altos High Gilroy Unified Milpitas Unified Morgan Hill Unified Palo Alto Unified San Jose Unified Santa Clara Unified
53 Five Year Historical Property Taxes by District Type District Alum Rock Elem 24,756, ,811, ,041, ,046, ,074, Berryessa Elem 24,239, ,208, ,587, ,801, ,659, Cambrian Elem 10,493, ,290, ,624, ,378, ,036, Campbell Elem 33,727, ,016, ,399, ,112, ,932, Cupertino Elem 62,596, ,015, ,304, ,659, ,627, Evergreen Elem 40,385, ,871, ,720, ,877, ,940, Franklin Mckinley 21,910, ,326, ,390, ,990, ,392, Lakeside Elem 894, , , , , Loma Prieta Elem 2,712, , ,828, ,736, ,726, Los Altos Elem 22,317, ,404, ,318, ,875, ,340, Los Gatos Elem 15,264, ,289, ,426, ,702, ,760, Luther Burbank Elem 927, ,035, ,072, ,192, , Montebello Elem 279, , , Moreland Elem 16,495, ,514, ,349, ,692, ,849, Mt View Whisman 21,549, ,932, ,425, ,946, ,500, Mt Pleasant Elem 6,596, ,132, ,124, ,174, ,700, Oak Grove Elem 22,285, ,145, ,123, ,423, ,999, Orchard Elem 2,881, ,024, ,218, ,803, ,250, Saratoga Elem 16,269, ,147, ,272, ,512, ,138, Sunnyvale Elem 31,527, ,719, ,534, ,924, ,683, Union Elem 19,592, ,885, ,821, ,972, ,541, Campbell High 48,258, ,925, ,836, ,892, ,796, East Side High 83,700, ,238, ,646, ,233, ,657, Fremont High 65,154, ,550, ,596, ,271, ,740, Los Gatos High 26,940, ,628, ,415, ,656, ,591, Mt. View Los Altos 33,941, ,507, ,736, ,478, ,702, Gilroy Unified 38,993, ,718, ,012, ,877, ,138, Milpitas Unified 35,123, ,718, ,118, ,432, ,393, Morgan Hill Unified 38,085, ,896, ,592, ,999, ,016, Palo Alto Unified 89,122, ,484, ,194, ,289, ,126, San Jose Unified 144,556, ,163, ,825, ,142, ,810, Santa Clara Unified 79,904, ,289, ,022, ,688, ,710, ,081,484, ,162,020, ,234,875, ,128,751, ,188,735, Elem High Unified Source: J29 53

54 Property Taxes by District Source: J29 Annual Income Tax Including Santa Cruz 54
")
55 Property Taxes by District (continued) 55
56 General Governmental Tax Revenue by Source Source: Santa Clara County Controllers Office CAFR 56 Chart General Governmental Tax Revenue by Source
57 57


58 Taxable Assessed Value of Property 58

59 Property Tax Rate Direct and Overlapping Governments 59
60 Principal Property Taxpayers Sources: Santa Clara County CAFR 60

61 Property Tax Levies and Collections 61
Evergreen School District
 Evergreen School District Budget Advisory Committee October 16, 2014 1 What We ll Cover The budget process and how the budget is developed General Fund Revenue Sources Where Evergreen dollars are spent
District Business & Advisory Services Judy Lee Kershaw, Director - DBAS: Bulletin:
 For Santa Clara County Districts Date: September 27, 2017 District Business & Advisory Services Judy Lee Kershaw, Director - DBAS: 408-453-6599 Bulletin: 18-006 To: District Chief Business Officers District
ALAMEDA COUNTY OFFICE OF EDUCATION SHEILA JORDAN, SUPERINTENDENT 313 WEST WINTON AVE. HAYWARD, CA
 ALAMEDA COUNTY OFFICE OF EDUCATION SHEILA JORDAN, SUPERINTENDENT 313 WEST WINTON AVE. HAYWARD, CA 94544-1136 www.acoe.org Alameda County School Districts FINANCIAL STATISTICAL REPORT Financial Statistical
FINANCIAL STATISTICAL REPORT
 ALAMEDA COUNTY OFFICE OF EDUCATION SHEILA JORDAN, SUPERINTENDENT 313 WEST WINTON AVE. HAYWARD, CA 94544-1136 www.acoe.org A lameda Count y School Districts FINANCIAL STATISTICAL REPORT Financial Statistical
SANTA CLARA COUNTY CIVIL GRAND JURY REPORT SHOW ME THE MONEY: SCHOOL PARCEL TAX EXEMPTIONS FOR SENIORS AND HOMEOWNERS WITH DISABILITIES
 Summary SHOW ME THE MONEY: SCHOOL PARCEL TAX EXEMPTIONS FOR SENIORS AND HOMEOWNERS WITH DISABILITIES A senior homeowner complained to the Santa Clara County Civil Grand Jury (Grand Jury) that his elementary
SANTA CLARA COUNTY CIVIL GRAND JURY INQUIRY INTO THE MISUSE OF DISTRICT-ISSUED CREDIT CARDS IN THE EAST SIDE UNION HIGH SCHOOL DISTRICT
 2003-2004 SANTA CLARA COUNTY CIVIL GRAND JURY INQUIRY INTO THE MISUSE OF DISTRICT-ISSUED CREDIT CARDS IN THE EAST SIDE UNION HIGH SCHOOL DISTRICT Summary In past years, a number of administrators and staff
Fiscal Year. Controller Treasurer Department. Property Tax Highlights
 Fiscal Year v 2016 17 Controller Treasurer Department Property Tax Highlights MESSAGE FROM THE CONTROLLER To the Residents of Santa Clara County Fiscal Year 2016 17 is the sixth consecutive year in which
COUNTY OF SANTA CLARA Finance Agency Basic Aid School Districts Meeting November 7, 2018 AGENDA
 COUNTY OF SANTA CLARA Basic Aid s Meeting November 7, 2018 AGENDA I. Introduction II. Assessment: Assessor A. FY2018/19 Assessed Valuation Update B. FY2019/20 Assessment Roll Trend C. Questions III. Apportionment
$15 Minimum Wage. November 15, 2016 Item 3.4. City of San José
 $15 Minimum Wage November 15, 2016 Item 3.4 City of San José Context March 2013 Local minimum wage raised from $8 to $10 (Measure D) Adopted by San Jose voters on November 6, 2012 Will increase to $10.40
COUNTY OF SANTA CLARA Finance Agency Basic Aid School Districts Meeting November 1, 2013 AGENDA
 COUNTY OF SANTA CLARA Basic Aid s Meeting November 1, 2013 AGENDA I. Introductions II. Assessor: A. FY2013/14 Assessment Roll Update B. FY2014/15 Assessment Roll Trend C. Questions III. Tax Collector:
SANTA CLARA COUNTY SCHOOLS' INSURANCE GROUP. FINANCIAL STATEMENTS June 30, 2016 and 2015
 SANTA CLARA COUNTY SCHOOLS' INSURANCE GROUP FINANCIAL STATEMENTS June 30, 2016 and 2015 FINANCIAL STATEMENTS June 30, 2016 and 2015 CONTENTS INDEPENDENT AUDITOR S REPORT... 1 MANAGEMENT'S DISCUSSION AND
WHO REALLY BENEFITS FROM EDUCATION DOLLARS? (Hint: It s Not the Students)
") 2008-2009 SANTA CLARA COUNTY CIVIL GRAND JURY REPORT Issues WHO REALLY BENEFITS FROM EDUCATION DOLLARS? (Hint: It s Not the Students) Are the school Boards of Trustees in Santa Clara County good stewards
2008-2009 SANTA CLARA COUNTY CIVIL GRAND JURY REPORT Issues WHO REALLY BENEFITS FROM EDUCATION DOLLARS? (Hint: It s Not the Students) Are the school Boards of Trustees in Santa Clara County good stewards
SANTA CLARA COUNTY SCHOOLS' INSURANCE GROUP. FINANCIAL STATEMENTS June 30, 2017 and 2016
 SANTA CLARA COUNTY SCHOOLS' INSURANCE GROUP FINANCIAL STATEMENTS June 30, 2017 and 2016 FINANCIAL STATEMENTS June 30, 2017 and 2016 CONTENTS INDEPENDENT AUDITOR S REPORT... 1 MANAGEMENT'S DISCUSSION AND
CAMPBELL UNION SCHOOL DISTRICT ANNUAL FINANCIAL REPORT FOR THE YEAR ENDED JUNE 30, 2016
 CAMPBELL UNION SCHOOL DISTRICT ANNUAL FINANCIAL REPORT FOR THE YEAR ENDED TABLE OF CONTENTS FINANCIAL SECTION Independent Auditor s Report 2 Management's Discussion and Analysis 5 Basic Financial Statements
Santa Clara County Finance Agency City Meeting May 17, 2017 AGENDA
 Santa Clara County City Meeting May 17, 2017 AGENDA I. Introductions II. Assessor: A. FY2016/17 Assessed Valuation Update B. FY2017/18 Assessment Roll Trend C. Questions III. Roll Corrections Status IV.
Yeah, the new tax bill will not be friendly to homeowners in the Bay Area, and we haven t even added in sales tax paid.
 2017 Annual Real Estate Report Santa Clara County Pam Blackman Santa Clara County Home Sales Up Slightly, Jump in 2017 for single-family homes and condos/townhomes reached new highs in 2017. The median
SANTA CLARA VALLEY TRANSPORTATION AUTHORITY CONGESTION MANAGEMENT PROGRAM. June 30, 2008
 SANTA CLARA VALLEY TRANSPORTATION AUTHORITY INDEPENDENT AUDITOR S REPORT, FINANCIAL STATEMENTS AND SUPPLEMENTARY INFORMATION June 30, 2008 FOR THE YEAR ENDED JUNE 30, 2008 Table of Contents Executive Summary...i
SANTA CLARA COUNTY CIVIL GRAND JURY REVIEW OF AUDITS AND FINANCIAL REPORTS
 2004-2005 SANTA CLARA COUNTY CIVIL GRAND JURY REVIEW OF AUDITS AND FINANCIAL REPORTS The 2004-2005 Santa Clara County Civil Grand Jury (Grand Jury) examined documents received from local government entities
MOUNT PLEASANT ELEMENTARY SCHOOL DISTRICT San Jose, California. FINANCIAL STATEMENTS June 30, 2011
 MOUNT PLEASANT ELEMENTARY SCHOOL DISTRICT San Jose, California FINANCIAL STATEMENTS June 30, 2011 FINANCIAL STATEMENTS WITH SUPPLEMENTARY INFORMATION For the Year Ended June 30, 2011 TABLE OF CONTENTS
Glossary of Accounting Terminology San Jose/Evergreen CCD February 26, 2002
 Glossary of Accounting Terminology San Jose/Evergreen CCD February 26, 2002 50 Percent Law Section 84362 of the Education Code, commonly known as the Fifty Percent Law, requires that a minimum of 50% of
Appendix E Glossary of Common School Finance Terms
 ADA Average daily attendance. There are several kinds of attendance, and these are counted in different ways. For regular attendance, ADA is equal to the average number of pupils actually attending classes
GLOSSARY OF COMMON SCHOOL FINANCE TERMS.
 GLOSSARY OF COMMON SCHOOL FINANCE TERMS http://www.sscal.com/glossary.htm 17.1 May 2017 Glossary of Common Schooll Finance Terms ADA AB 12000 Accural Basis Accounting Ad valorem Taxes Apportionment Average
MEDIA RELEASE. Worse than anticipated, says Assessor Larry Stone Assessment Roll Goes Negative: First time since Great Depression
 County of Santa Clara Office of the County Assessor County Government Center, East Wing 70 West Hedding Street San Jose, California 95110-1770 1-408-299-5500 FAX 1-408-297-9526 E-Mail: david.ginsborg@asr.sccgov.org
LOS GATOS-SARATOGA JOINT UNION HIGH SCHOOL DISTRICT ANNUAL FINANCIAL REPORT FOR THE YEAR ENDED JUNE 30, 2016
 LOS GATOS-SARATOGA JOINT UNION HIGH SCHOOL DISTRICT ANNUAL FINANCIAL REPORT FOR THE YEAR ENDED Recieved 12/09/2016 TABLE OF CONTENTS FINANCIAL SECTION Independent Auditor s Report 2 Management's Discussion
Neelima Palacherla, Executive Officer SUBJECT: PROPOSED LAFCO BUDGET FOR FISCAL YEAR 2018
 LAFCO MEETING: April 12, 2017 TO: LAFCO FROM: Neelima Palacherla, Executive Officer SUBJECT: PROPOSED LAFCO BUDGET FOR FISCAL YEAR 2018 FINANCE COMMITTEE / STAFF RECOMMENDATION 1. Adopt the Proposed Budget
Los Gatos Union School District Proposed Budget and Multi-year Projection. Narrative
 Los Gatos Union School District Proposed Budget and Multi-year Projection Public Hearing June 11, 2018 Adoption June 13, 2018 Revised Narrative to Proposed Budget (revisions in italics) Narrative 2018-2019
San Francisco's Experience With Business Tax Reform. Ted Egan, Ph.D. Chief Economist City and County of San Francisco
 San Francisco's Experience With Business Tax Reform Ted Egan, Ph.D. Chief Economist City and County of San Francisco A Bit of History 1970s San Francisco institutes a hybrid, Gross Receipts/Payroll tax
SUNNYVALE SCHOOL DISTRICT ANNUAL FINANCIAL REPORT FOR THE YEAR ENDED JUNE 30, 2017
 ANNUAL FINANCIAL REPORT FOR THE YEAR ENDED This page left blank intentionally. TABLE OF CONTENTS FINANCIAL SECTION Independent Auditor s Report 2 Management's Discussion and Analysis 5 Basic Financial
SANTA CLARA COUNTY CIVIL GRAND JURY EXAMINATION OF AUDITS AND FINANCIAL REPORTS
 2001-2002 SANTA CLARA COUNTY CIVIL GRAND JURY EXAMINATION OF AUDITS AND FINANCIAL REPORTS INTRODUCTION California Penal Code Sections 925 and 925(a) specifically authorize the Civil Grand Jury to examine
SUNNYVALE SCHOOL DISTRICT ANNUAL FINANCIAL REPORT FOR THE YEAR ENDED JUNE 30, 2016
 ANNUAL FINANCIAL REPORT FOR THE YEAR ENDED TABLE OF CONTENTS FINANCIAL SECTION Independent Auditor s Report 2 Management's Discussion and Analysis 5 Basic Financial Statements Government-Wide Financial
Commission District 4 Census Data Aggregation
 Commission District 4 Census Data Aggregation 2011-2015 American Community Survey Data, U.S. Census Bureau Table 1 (page 2) Table 2 (page 2) Table 3 (page 3) Table 4 (page 4) Table 5 (page 4) Table 6 (page
Santa Clara County Hazardous Waste Recycling & Disposal Program. Participation Report - Fiscal Year Los Gatos Milpitas
 Santa Clara County Hazardous Waste Recycling & Disposal Program Participation Report - Fiscal Year 2005 PERMANENT Location Date Campbell Cupertino Gilroy Los Altos Los Altos Hills Los Gatos Milpitas Monte
Northwest Census Data Aggregation
 Northwest Census Data Aggregation 2011-2015 American Community Survey Data, U.S. Census Bureau Table 1 (page 2) Table 2 (page 2) Table 3 (page 3) Table 4 (page 4) Table 5 (page 4) Table 6 (page 5) Table
Riverview Census Data Aggregation
 Riverview Census Data Aggregation 2011-2015 American Community Survey Data, U.S. Census Bureau Table 1 (page 2) Table 2 (page 2) Table 3 (page 3) Table 4 (page 4) Table 5 (page 4) Table 6 (page 5) Table
Zipe Code Census Data Aggregation
 Zipe Code 66101 Census Data Aggregation 2011-2015 American Community Survey Data, U.S. Census Bureau Table 1 (page 2) Table 2 (page 2) Table 3 (page 3) Table 4 (page 4) Table 5 (page 4) Table 6 (page 5)
Zipe Code Census Data Aggregation
 Zipe Code 66103 Census Data Aggregation 2011-2015 American Community Survey Data, U.S. Census Bureau Table 1 (page 2) Table 2 (page 2) Table 3 (page 3) Table 4 (page 4) Table 5 (page 4) Table 6 (page 5)
SCHOOLS OF SONOMA COUNTY
 2015-2016 SCHOOLS OF SONOMA COUNTY Sonoma County Office of Education Steve Herrington, Ph.D., Superintendent of Schools 5340 Skylane Boulevard Santa Rosa, CA 95403 (707) 524-2600 www.scoe.org 2015-2016
Budget Advisory Committee Meeting MARCUS BATTLE ASSOCIATE SUPERINTENDENT, BUSINESS AND OPERATIONS & KAREN POON, DIRECTOR OF FINANCE MAY 13, 2014
 1 Budget Advisory Committee Meeting MARCUS BATTLE ASSOCIATE SUPERINTENDENT, BUSINESS AND OPERATIONS & KAREN POON, DIRECTOR OF FINANCE MAY 13, 2014 Presentation Summary Key Impacts of Governor s FY 2014-15
Monthly School Board Standing Committee Meetings
 Monthly School Board Standing Committee Meetings October 10, 2017 5:30 P.M. Audit/Budget/Finance 5:40 P.M. Joint Audit/Budget/Finance & Personnel/Policy 5:55 P.M. Personnel/Policy Please Note: Committee
Garvey School District
 Garvey School District 2014/15 Annual Budget June 25, 2014 TABLE OF CONTENTS DISTRICT ADMINISTRATION... 3 SUPERINTENDENT S MESSAGE... 4 DISTRICT OVERVIEW... 6 DISTRICT DEMOGRAPHICS... 7 GOVERNOR S PROPOSED
SAN JOSE CAPITAL OF SILICON VALLEY
 COUNCIL AGENDA: 6/9/15 ITEM: CITY OF SAN JOSE CAPITAL OF SILICON VALLEY Memorandum TO: HONORABLE MAYOR AND CITY COUNCIL FROM: Kerrie Romanow SUBJECT: SEE BELOW DATE: Approved Date s'mis SUBJECT: ADOPTION
Fiscal Year: Budget Overview & SACS Format
 PROPOSED BUDGET Fiscal Year: 2009-2010 Budget Overview & SACS Format Presented: June 23, 2009 NEW HAVEN UNIFIED SCHOOL DISTRICT 34200 Alvarado Niles Road Union City, CA 94587 BOARD OF EDUCATION President
EAST SIDE UNION HIGH SCHOOL DISTRICT 2002 MEASURE G GENERAL OBLIGATION BONDS PERFORMANCE AUDIT JUNE 30, 2011
 2002 MEASURE G GENERAL OBLIGATION BONDS PERFORMANCE AUDIT 2002 MEASURE G GENERAL OBLIGATION BOND FUND TABLE OF CONTENTS Independent Auditor s Report 1 Authority for Issuance 2 Purpose of Issuance 2 Authority
ACTIONS RELATED TO THE RECYCLE PLUS RATES FOR SINGLE-FAMILY AND MULTI-FAMILY SERVICES
 COUNCIL AGENDA: 06/06/17 ITEM: 7.2. CITY OF SAN JOSE CAPITAL OF SILICON VALLEY TO: HONORABLE MAYOR AND CITY COUNCIL Memorandum FROM: Kerrie Romanow SUBJECT: SEE BELOW DATE: Approved Date 1 SUBJECT: ACTIONS
POWAY UNIFIED SCHOOL DISTRICT COUNTY OF SAN DIEGO POWAY, CALIFORNIA AUDIT REPORT JUNE 30, 2010
 COUNTY OF SAN DIEGO POWAY, CALIFORNIA AUDIT REPORT JUNE 30, 2010 WILKINSON HADLEY KING & CO. LLP CPA's and Advisors 218 W Douglas Ave. El Cajon, CA 92020 Introductory Section Poway Unified School District
Natomas Unified School District
 Natomas Unified School District : Item Inspector Natomas Unified School District Jun 25, 2014 : Regular Board Meeting : XIV. ACTION ITEMS c. Approve the District's 2014-15 Proposed Budget [Status: Completed]
CERES UNIFIED SCHOOL DISTRICT ANNUAL FINANCIAL REPORT JUNE 30, 2014
 Vavrinek, Trine, Day & Co., LLP Certified Public Accountants VALUE THE DIFFERENCE December 14, 2014 State Controller's Office Division of Audits Financial Audits Bureau - Education Oversight Unit Via PDF
Budget Forum
 FREMONT UNIFIED SCHOOL DISTRICT Educate Challenge Inspire Budget Forum 2013 2014 Presented to: Irvington High School PTSA Division of Business Services April 11, 2013 Outline About FUSD Funding for Education
CITY AND COUNTY OF SAN FRANCISCO STATISTICAL SECTION
 Statistical Section STATISTICAL SECTION This section of the City s comprehensive annual financial report presents detailed information as a context for understanding what the information in the financial
Minimum Wage Regional Recommendation June 9, 2016
 AGENDA ITEM #10.D Minimum Wage Regional Recommendation June 9, 2016 Minimum Wage Subcommittee Greg Scharff Rod Sinks History Cities Association priority in 2015 & 2016 June 2015 Cities Association position:
PALO ALTO UNIFIED SCHOOL DISTRICT ANNUAL FINANCIAL REPORT FOR THE YEAR ENDED JUNE 30, 2016
 PALO ALTO UNIFIED SCHOOL DISTRICT ANNUAL FINANCIAL REPORT FOR THE YEAR ENDED TABLE OF CONTENTS FINANCIAL SECTION Independent Auditor's Report 2 Management s Discussion and Analysis 5 Basic Financial Statements
2018:IIIQ Nevada Unemployment Rate Demographics Report*
 2018:IIIQ Nevada Unemployment Rate Demographics Report* Department of Employment, Training & Rehabilitation Research and Analysis Bureau Dr. Tiffany Tyler-Garner, Director Dennis Perea, Deputy Director
Special Education Fiscal Review
 Palo Alto Unified School District Special Education Fiscal Review August 20, 2010 Prepared By: Michele Huntoon, CPA Associate Vice President Jannelle Kubinec Associate Vice President Palo Alto Unified
Millbrae Elementary School District First Interim for Fiscal Year Board of Trustees
 Millbrae Elementary School District First Interim for Fiscal Year 2016-2017 Board of Trustees Frank Barbaro Denis Fama Lynne Ferrario Maggie Musa D. Don Revelo Administration Vahn Phayprasert, Superintendent
SANTA CLARA COUNTY OFFICE OF EDUCATION Personnel Commission
 SANTA CLARA COUNTY OFFICE OF EDUCATION Personnel Commission CLASS TITLE: DISTRICT BUSINESS ADVISOR BASIC FUNCTION: Under the direction of the Director III-District Business Services or the Senior - District
1898-W Rule No. 15 Main Extensions (Continued) 993-W 1899-W Table of Contents (Continued) 1780-W 1900-W Table of Contents 1897-W
 993-W 1899-W Table of Contents (Continued) 1780-W 1900-W Table of Contents 1897-W") San Jose Water Company 110 W. Taylor Street San Jose, CA 95110-2131 March 23, 2018 California Public Utilities Commission 505 Van Ness Avenue San Francisco, CA 94102 Advice Letter No. 519 San Jose Water
San Jose Water Company 110 W. Taylor Street San Jose, CA 95110-2131 March 23, 2018 California Public Utilities Commission 505 Van Ness Avenue San Francisco, CA 94102 Advice Letter No. 519 San Jose Water
EAST SIDE UNION HIGH SCHOOL DISTRICT ANNUAL FINANCIAL REPORT FOR THE YEAR ENDED JUNE 30, 2014
 EAST SIDE UNION HIGH SCHOOL DISTRICT ANNUAL FINANCIAL REPORT FOR THE YEAR ENDED TABLE OF CONTENTS FINANCIAL SECTION Independent Auditor s Report 2 Management's Discussion and Analysis 6 Basic Financial
FREMONT UNION HIGH SCHOOL DISTRICT ANNUAL FINANCIAL REPORT FOR THE YEAR ENDED JUNE 30, 2016
 FREMONT UNION HIGH SCHOOL DISTRICT ANNUAL FINANCIAL REPORT FOR THE YEAR ENDED TABLE OF CONTENTS FINANCIAL SECTION Independent Auditor s Report 2 Management's Discussion and Analysis 5 Basic Financial
SANTA BARBARA UNIFIED SCHOOL DISTRICT ANNUAL FINANCIAL REPORT JUNE 30, 2013
 SANTA BARBARA UNIFIED SCHOOL DISTRICT ANNUAL FINANCIAL REPORT TABLE OF CONTENTS FINANCIAL SECTION Independent Auditors' Report 2 Management's Discussion and Analysis 5 Basic Financial Statements Government-Wide
COUNCIL AGENDA REPORT LONG RANGE CAPITAL FUNDING OPTIONS:
 wx F MEETING DATE: 09/ 15/ 15 ITEM NO: O8 c'ns COUNCIL AGENDA REPORT DATE: TO: FROM: LAUREL PREVETTI, TOWN MANAGER W i SUBJECT: LONG RANGE CAPITAL FUNDING OPTIONS: A. IDENTIFY SPECIFIC FUNDING OPTIONS
Alameda Unified School District Board Presentation
 Alameda Unified School District Board Presentation May 20, 2009 Prepared by: Michele Huntoon, CPA, Associate Vice President Lewis Wiley Jr., Director, Management Consulting Services Financial Trends 1
III. Statistical Section
 III. Statistical Section Miami-Dade County Public Schools giving our students the world 140 NET ASSETS BY COMPONENT - PRIMARY GOVERNMENT Last Five Fiscal Years (amounts expressed in millions) TABLE 1
SAN LEANDRO UNIFIED SCHOOL DISTRICT ANNUAL FINANCIAL REPORT JUNE 30, 2013
 ANNUAL FINANCIAL REPORT TABLE OF CONTENTS FINANCIAL SECTION Independent Auditors' Report 2 Management's Discussion and Analysis 5 Basic Financial Statements Government-Wide Financial Statements Statement
Budget Study Session A Fiscal Profile of CVUSD. Business Services Division September 12, 2012
 Budget Study Session A Fiscal Profile of CVUSD Business Services Division September 12, 2012 Budget Study Session #1 Common School Financial Terms Concurrent Budget Cycles State of California Budget CVUSD
BOARD OF EDUCATION Attachment: Discussion 11. PALO ALTO UNIFIED SCHOOL DISTRICT Date:
 BOARD OF EDUCATION Attachment: Discussion 11 PALO ALTO UNIFIED SCHOOL DISTRICT Date: 09.08.15 TO: FROM: Glenn Max McGee, Superintendent Cathy Mak, Chief Business Official SUBJECT: 2014-15 Ending Balance
Solana Beach School District
 B U D G E T W O R K S H O P Solana Beach School District 2017-18 Proposed Budget June 8, 2017 Our Mission is to provide a child-centered education of the highest quality, using the unique vision and resources
Lapkoff & Gobalet Demographic Research, Inc.
 Lapkoff & Gobalet Demographic Research, Inc. 22361 Rolling Hills Road, Saratoga, CA 95070-6560 (408) 725-8164 Fax (408) 725-1479 2120 6 th Street #9, Berkeley, CA 94710-2204 (510) 540-6424 Fax (510) 540-6425
BERRYESSA UNION SCHOOL DISTRICT AUDIT REPORT For the Fiscal Year Ended June 30, 2018
 AUDIT REPORT For the Fiscal Year Ended June 30, 2018 For the Fiscal Year Ended June 30, 2018 Table of Contents FINANCIAL SECTION Page Independent Auditors Report... 1 Management s Discussion and Analysis...
ABC UNIFIED SCHOOL DISTRICT ANNUAL FINANCIAL REPORT JUNE 30, 2013
 ABC UNIFIED SCHOOL DISTRICT ANNUAL FINANCIAL REPORT TABLE OF CONTENTS FINANCIAL SECTION Independent Auditors' Report 2 Management's Discussion and Analysis 5 Basic Financial Statements Government-Wide
(This page left intentionally blank)
") (This page left intentionally blank) INTRODUCTION This report is one in an ongoing series of periodic analyses of public policy issues by the Davenport Institute. This report analyzes public, K-12 education
(This page left intentionally blank) INTRODUCTION This report is one in an ongoing series of periodic analyses of public policy issues by the Davenport Institute. This report analyzes public, K-12 education
LOMA PRIETA JOINT UNION ELEMENTARY SCHOOL DISTRICT
 LOMA PRIETA JOINT UNION ELEMENTARY SCHOOL DISTRICT AUDIT REPORT JUNE 30, 2015 OF SANTA CLARA COUNTY LOS GATOS, CALIFORNIA JUNE 30, 2015 The Loma Prieta Joint Union Elementary School District was established
OJAI UNIFIED SCHOOL DISTRICT
 OJAI UNIFIED SCHOOL DISTRICT ANNUAL FINANCIAL REPORT TABLE OF CONTENTS FINANCIAL SECTION Independent Auditor's Report 2 Management's Discussion and Analysis 5 Basic Financial Statements Government-Wide
Change in Population & Unemployment Rates City of Chino - San Bernardino County - State of California
 Change in Population & Unemployment Rates City of Chino - San Bernardino County - State of California Year Population Average Annual Population Percentage Change San Bernardino County Population City Population
BUDGET ADVISORY COMMITTEE M i n u t e s Tuesday, February 27, 2018 Library Room 4245
 BUDGET ADVISORY COMMITTEE M i n u t e s Tuesday, February 27, 2018 Library Room 4245 The meeting was called to order by Doug Roberts (Co-Chair). Members present: Jackie De Lap, Junior N. Diarrassouba,
SONOMA COUNTY OFFICE OF EDUCATION AUDIT REPORT For the Fiscal Year Ended June 30, 2018
 SONOMA COUNTY OFFICE OF EDUCATION AUDIT REPORT For the Fiscal Year Ended June 30, 2018 For the Fiscal Year Ended June 30, 2018 Table of Contents FINANCIAL SECTION Page Independent Auditors Report... 1
1989LITTLE ORCHARD. Industrial Facility. ±158,200 s.f. state-of-the-art FOR SALE OR LEASE OVERVIEW. ±158,200 square feet
 ±158,200 s.f. state-of-the-art Industrial Facility OVERVIEW JLL is pleased to bring to market 1989 Little Orchard Street in. This ±158,200 square feet state-ofthe-art industrial/manufacturing building
Palo Alto Unified School District
 2014-15 Fiscal Facts As of 9/23/14 Board of Education Barb Mitchell, President Melissa Baten Caswell, Vice President Heidi Emberling Dana Tom Camille Townsend Central Administration Glenn Max McGee, Ph.D.,
SANTA CLARA VALLEY TRANSPORTATION AUTHORITY SAN JOSE, CALIFORNIA
 SANTA CLARA VALLEY TRANSPORTATION AUTHORITY SAN JOSE, CALIFORNIA Comprehensive Annual Financial Report (CAFR) For Fiscal Year Ended June 30, 2017 Prepared by: Finance and Budget Division THIS PAGE IS INTENTIONALLY
Lennox School District
 Dated: June 13, 2013 Prepared by: EASTSHORE CONSULTING FINANCIAL PLANNING CAMPAIGN STRATEGIES PUBLIC RELATIONS EASTSHORE CONSULTING FINANCIAL PLANNING CAMPAIGN STRATEGIES PUBLIC RELATIONS 1714 Franklin
CITY OF SAN JOSE BRANCH LIBRARY BOND PROJECTS FUND (A Fund of the City of San José)
") CITY OF SAN JOSE BRANCH LIBRARY BOND PROJECTS FUND (A Fund of the City of San José) Independent Auditor s Reports, Financial Statements, Other Supplementary Information and Independent Accountant s Report
CITY OF SAN JOSE BRANCH LIBRARY BOND PROJECTS FUND (A Fund of the City of San José) Independent Auditor s Reports, Financial Statements, Other Supplementary Information and Independent Accountant s Report
ASPIRE PUBLIC SCHOOLS (A CALIFORNIA NON-PROFIT PUBLIC BENEFIT CORPORATION)
") (A CALIFORNIA NON-PROFIT PUBLIC BENEFIT CORPORATION) FINANCIAL STATEMENTS WITH INDEPENDENT AUDITOR S REPORT YEARS ENDED TABLE OF CONTENTS PAGE INDEPENDENT AUDITOR S REPORT 1 FINANCIAL STATEMENTS Statements
(A CALIFORNIA NON-PROFIT PUBLIC BENEFIT CORPORATION) FINANCIAL STATEMENTS WITH INDEPENDENT AUDITOR S REPORT YEARS ENDED TABLE OF CONTENTS PAGE INDEPENDENT AUDITOR S REPORT 1 FINANCIAL STATEMENTS Statements
Our Mission. To inspire every student to think, to learn, to achieve, to care
 At a Glance Our Mission To inspire every student to think, to learn, to achieve, to care MESSAGE FROM OUR SUPERINTENDENT High Performance in Cherry Creek Schools Harry Bull, Jr., Ed.D. The Cherry Creek
THE SCHOOL BOARD OF MIAMI-DADE COUNTY, FLORIDA NET POSITION BY COMPONENT - PRIMARY GOVERNMENT
 NET POSITION BY COMPONENT - PRIMARY GOVERNMENT (amounts expressed in millions) Primary Government: 2005 2006 2007 2008 2009 Governmental activities: Net investment in capital assets $ 1,200.6 $ 1,429.7
OAK GROVE SCHOOL DISTRICT ANNUAL FINANCIAL REPORT FOR THE YEAR ENDED JUNE 30, 2015
 ANNUAL FINANCIAL REPORT FOR THE YEAR ENDED TABLE OF CONTENTS FINANCIAL SECTION Independent Auditor s Report 2 Management's Discussion and Analysis 5 Basic Financial Statements Government-Wide Financial
San Jose Water Company
 San Jose Water Company 110 W. Taylor Street San Jose, CA 95110-2131 March 22, 2018 California Public Utilities Commission 505 Van Ness Avenue San Francisco, CA 94102 Advice Letter No. 518 San Jose Water
Budget Planning
 1 of 31 2014-15 Budget Planning San Dieguito Union High School District Board Workshop District Office Board Room, 4:45 p.m. 2 of 31 Agenda Budget Perspectives Governor s Budget Proposal State Economy
Morgan Hill Unified School District Adopted Budget Multi-Year Projection. Presented to: Morgan Hill Board of Education June 20, 2017
 Morgan Hill Unified School District 2017-18 Adopted Budget Multi-Year Projection Presented to: Morgan Hill Board of Education June 20, 2017 What does the Multi-Year Projection (MYP) have to do with Budget?
EAST SIDE UNION HIGH SCHOOL DISTRICT 2002 MEASURE G BOND FUND ANNUAL FINANICAL REPORT JUNE 30, 2012
 EAST SIDE UNION HIGH SCHOOL DISTRICT ANNUAL FINANICAL REPORT TABLE OF CONTENTS FINANCIAL SECTION Independent Auditor s Report 1 2002 Measure G Bond Fund Balance Sheet 2 Statement of Revenues, Expenditures,
SAN JOSÉ/EVERGREEN COMMUNITY COLLEGE DISTRICT. FINANCIAL STATEMENTS June 30, 2015
 SAN JOSÉ/EVERGREEN COMMUNITY COLLEGE DISTRICT FINANCIAL STATEMENTS June 30, 2015 FINANCIAL STATEMENTS WITH SUPPLEMENTARY INFORMATION For the Year Ended June 30, 2015 TABLE OF CONTENTS Page Independent
arbara School Distri ts S cond Int rim R port March 1 0, 20 9
 T ---SantaBarbara --- SCHOOL DISTRICTS anta arbara School Distri ts 2008-09 S cond Int rim R port March 1 0, 20 9 720 Santa Barbara Street / Santa Barbara. CA 93101 / (805) 963-4338/ www.sbsdk12.org TO:
January 18, 2019 and February 1,
 Up Level Your LCAP! January 18, 2019 and February 1, 2019 http://tinyurl.com/levelupresources 1 Welcome County Superintendent Dr. Mary Ann Dewan SCCOE: Equity Diversity Inclusion Partnership 2 Purpose
MOUNT DIABLO UNIFIED SCHOOL DISTRICT AUDIT REPORT For the Fiscal Year Ended June 30, 2015
 MOUNT DIABLO UNIFIED SCHOOL DISTRICT AUDIT REPORT For the Fiscal Year Ended June 30, 2015 For the Fiscal Year Ended June 30, 2015 Table of Contents FINANCIAL SECTION Page Independent Auditors Report...
NATOMAS UNIFIED SCHOOL DISTRICT Sacramento, California. FINANCIAL STATEMENTS June 30, 2011
 Sacramento, California FINANCIAL STATEMENTS June 30, 2011 FINANCIAL STATEMENTS WITH SUPPLEMENTARY INFORMATION For the Year Ended June 30, 2011 TABLE OF CONTENTS Page Independent Auditors' Report 1-2 Management's
SUPERINTENDENT S BUDGET RECOMMENDATION
 SUPERINTENDENT S BUDGET RECOMMENDATION G U I L F O RD C O U N T Y B O A R D O F E D U C AT ION A P R I L 1 0, 2 0 18 S H A R O N L. C O N T R E R A S, P H. D. S U P E R I N T E N D E N T Funding Trends
 California Department of Education, May 2016 School Year 2016-2017 Sunrise Middle School Application for Free and Reduced-Price Meals: State Meal Program Complete one application per household. Read the
PROPOSED BUDGET
 2016-17 PROPOSED BUDGET Public Hearing on June 14, 2016 Adoption on June 28, 2016 Board of Trustees: Zerrall Mc Daniel Board President Gregory Gustafson Clerk Karan Bowsher Trustee Sherri Reusche Trustee
COMPTON UNIFIED SCHOOL DISTRICT
 AUDIT REPORT JUNE 30, 2011 OF LOS ANGELES COUNTY COMPTON, CALIFORNIA JUNE 30, 2011 The Compton Unified School District was established on July 1, 1970, and is comprised of an area of approximately 30 square
Miami-Dade County Public Schools giving our students the world
 Miami-Dade County Public Schools giving our students the world Statistical Section The Statistical Section presents detailed information as a context for understanding what the information in the financial
Rocky Point Charter School
 Rocky Point Charter School Fiscal Review May 7, 2010 Joel D. Montero Chief Executive Officer May 7, 2010 Deborah Stierli, Director Rocky Point Charter School 3500 Tamarack Drive Redding, CA 96003 Dear
May 23, Dr. Donald A. Phillips, Superintendent Poway Unified School District Twin Peaks Road Poway, CA Dear Dr.
 May 23, 2007 Dr. Donald A. Phillips, Superintendent Poway Unified School District 13626 Twin Peaks Road Poway, CA 92064 Dear Dr. Phillips: The purpose of this management letter is to present the findings