HEMSON C o n s u l t i n g L t d.
|
|
|
- Rudolph Cameron Terry
- 5 years ago
- Views:
Transcription
1 DEVELOPMENT CHARGES BACKGROUND STUDY City of Brampton C o n s u l t i n g L t d. May 28 th, 2014
2 TABLE OF CONTENTS EXECUTIVE SUMMARY...1 I INTRODUCTION...13 II III THE METHODOLOGY USES A CITY-WIDE APPROACH TO ALIGN DEVELOPMENT-RELATED COSTS AND BENEFITS...15 A. A CITY-WIDE DEVELOPMENT CHARGE IS PROPOSED...15 B. KEY STEPS IN DETERMINING DEVELOPMENT CHARGES FOR FUTURE DEVELOPMENT-RELATED PROJECTS...16 POPULATION IS FORECAST TO INCREASE BY 144,100 AND NON- RESIDENTIAL BUILDING SPACE BY 4.9MILLION SQUARE METRES BY A. BRAMPTON HAS EXPERIENCED RAPID GROWTH IN RECENT YEARS...20 B. THE RESIDENTIAL FORECAST IS BASED ON THE FORECASTS ENDORSED BY CITY COUNCIL IN APRIL C. NON-RESIDENTIAL SPACE FORECAST IS BASED ON FORECAST EMPLOYMENT GROWTH...22 IV SUMMARY OF HISTORIC CAPITAL SERVICE LEVELS...24 V THE DEVELOPMENT-RELATED CAPITAL FORECAST...26 VI VII A. A DEVELOPMENT-RELATED CAPITAL FORECAST IS PROVIDED FOR COUNCIL S APPROVAL...26 B. THE DEVELOPMENT-RELATED CAPITAL FORECAST FOR CITY- WIDE SERVICES...27 PROPOSED DEVELOPMENT CHARGES ARE CALCULATED IN ACCORDANCE WITH THE DCA...31 A. UNADJUSTED DEVELOPMENT CHARGE CALCULATION FOR CITY-WIDE SERVICES...31 COMPARISON OF CALCULATED AND CURRENT DEVELOPMENT CHARGES...40 VIII LONG-TERM CAPITAL AND OPERATING COSTS...44 A. NET OPERATING COSTS FOR THE CITY S SERVICES ESTIMATED TO INCREASE BY $56.17 MILLION OVER 10 YEARS...44 B. LONG-TERM CAPITAL FINANCING FROM NON-DEVELOPMENT CHARGE SOURCES FOR GENERAL SERVICES TOTALS $ MILLION...44
3 C. LONG-TERM CAPITAL FINANCING FROM NON-DEVELOPMENT CHARGE SOURCES FOR ENGINEERED SERVICES TOTALS $76.25 MILLION TO IX DEVELOPMENT CHARGES ADMINISTRATION...48 APPENDIX A: DEVELOPMENT FORECAST...50 APPENDIX B: GENERAL SERVICES TECHNICAL APPENDICES INTRODUCTION AND OVERVIEW...65 APPENDIX B.1: GENERAL GOVERNMENT...71 APPENDIX B.2: LIBRARY SERVICES...81 APPENDIX B.3: FIRE SERVICES...89 APPENDIX B.4: RECREATION SERVICES...99 APPENDIX B.5: PUBLIC WORKS: BUILDINGS AND FLEET APPENDIX B.6: PARKING APPENDIX B.7: TRANSIT APPENDIX C: ROADS APPENDIX D: DEVELOPMENT CHARGES RESERVE FUNDS APPENDIX E: LONG-TERM CAPITAL AND OPERATING IMPACTS...204
4 1 EXECUTIVE SUMMARY The following summarizes the findings of the 2014 Development Charges Background Study. A. STUDY CONSISTENT WITH DEVELOPMENT CHARGES LEGISLATION This study calculates development charges for the City of Brampton in compliance with the provisions of the Development Charges Act, 1997 (DCA) and its associated regulation (Ontario Regulation 82/98). The City of Brampton s existing development charges by-laws, as noted below, expire on August 5, 2014 and Council must pass new development charges bylaws before the expiry date in order to continue to levy development charges. The by-laws are: # : General Government # : Recreation Services # : Fire Services # : Library Services # : Transit Services # : Road Services # : Bramwest Parkway/North-South Transportation Corridor The City needs to continue implementing development charges to fund capital projects related to development throughout Brampton so that new development pays for its capital requirements to the extent allowed by the DCA and so that new services required by growth are provided in a fiscally responsible manner. The DCA and O. Reg. 82/98 require that a development charges background study be prepared in which development charges are determined with reference to: a forecast of the amount, type and location of housing units, population and non-residential development anticipated in the City;
5 2 a review of future capital projects, including an analysis of gross expenditures, funding sources, and net expenditures incurred or to be incurred by the City to provide for the expected development, including the determination of the development and nondevelopment-related components of the capital projects; and an examination of the long-term capital and operating costs for the capital infrastructure required for each service to which the development charges by-laws would relate. This report identifies the development-related net capital costs which are attributable to development that is forecast to occur in the City. These costs are apportioned to types of development (residential, non-residential) in a manner that reflects the increase in the need for each service attributable to each type of development. B. ALL SERVICES WITH DEVELOPMENT-RELATED COSTS INCLUDED IN THE ANALYSIS The following City services have been included in the development charge analysis: General Government Library Services Fire Services Recreation Services Public Works: Buildings & Fleet Parking Transit Roads Bramwest Parkway/North-South Transportation Corridor C. APPROACH USED TO CALCULATE DEVELOPMENT CHARGES A City-wide average cost approach is used to calculate development charges for all services. This approach results in uniform charges throughout the City.
6 3 D. THE CITY OF BRAMPTON IS ANTICIPATED TO GROW BY 144,100 PEOPLE AND 65,910 EMPLOYEES OVER 10 YEARS A development forecast for the 10 year study period, , estimates that the City's population will grow by approximately 144,100 people and by about 297,200 persons to ultimate development (2041 for the purposes of this study). Population growth in new housing units is expected to add 162,396 people over the period and 311,666 to ultimate development. The City s employment is forecast to grow by approximately 65,910 employees over the next 10 years and 135,790 to ultimate development. This employment growth is projected to generate about 4.97 million square metres of new, non-residential building space between 2014 and 2023 and 9.52 million square metres to ultimate development (2041). The following is a summary of the projected growth for the City: Existing RESIDENTIAL FORECAST As At 2013 Forecast Change As At 2023 Forecast Change As At 2041 Households 158,240 43, ,405 90, ,326 Population Census 557, ,100, 701, , ,000 In New Households 162, ,666 NON-RESIDENTIAL FORECAST Non-Residential Building Space (sq.m) Existing As At 2013 Forecast Change As At 2023 Forecast Change As At ,967,120-9,523,450 - Employment 185,570 65, , , ,360
7 4 E. FUNDING ENVELOPE BASED ON NET GROWTH In accordance with the DCA, development charges have been calculated at a level no higher than the average service level provided in the City over the ten-year period immediately preceding the preparation of the background study, on a service by service basis. The maximum permissible funding envelopes in this study are based on net population, employment and household growth. F. THE DEVELOPMENT CHARGES STUDY INCLUDES A $1.06 BILLION DEVELOPMENT-RELATED CAPITAL PROGRAM FOR GENERAL SERVICES OVER THE NEXT 10 YEARS AND A $1.44 BILLION PROGRAM FOR ENGINEERED SERVICES TO ULTIMATE DEVELOPMENT The development-related capital programs for general services including General Government, Library Services, Fire Services, Recreation Services, Public Works: Building & Fleet, Parking and Transit totaling $1.06 billion. The engineered services capital program, including City-wide road works and Bramwest/NSTC infrastructure totals an additional $1.44 billion. This amount is estimated to provide for development-related infrastructure required to 2041 and beyond. The DCA requires that development-related net capital costs for general services be reduced by grants, subsidies, and recoveries from other governments; capital replacements or other benefits provided to the existing community; existing reserve fund balances; amounts that exceed historic service levels; and a statutory 10 per cent reduction for eligible soft (or general) services, when calculating development charges. After these deductions, the costs eligible for recovery through development charges for the general services capital program is reduced to $ million, and the engineered services development-related capital program decreases to $1.37 billion. These amounts are eligible for recovery through development charges. The following is a summary of the development-related capital program.
8 5 General Services Gross Cost ($000) DC Eligible Cost For Recovery ($000) General Government $16,599.6 $10,666.6 Library Services $70,887.0 $21,951.3 Fire Services $82,519.5 $29,122.2 Recreations Services $425,410.7 $346,201.6 Public Works: Buildings and Fleet $113,459.2 $29,393.0 Parking $23,550.2 $0.0 Transit $330,818.6 $72,698.8 Total 10-Year General Services $1,063,244.8 $510,033.7 Engineered Services Gross Cost* ($000) DC Eligible Cost For Recovery ($000) Roads - Excluding Bramwest NSTC $1,378,793.0 $1,313,834.4 Roads - Bramwest NSTC $63,287.8 $51,991.9 Total Engineered Services to 2041 (Roads) $1,442,080.8 $1,365,826.3 * net of grants, subsidies and other recoveries
9 6 G. CALCULATED CITY-WIDE DEVELOPMENT CHARGES The following tables summarize the calculated residential and non-residential City-wide development charges. Calculated Residential Charges for City-Wide Services Charge Per Unit Type (1) Apartments Percentage Singles/ Rows & Other of Grand > 750 sq.ft < = 750 sq.ft SERVICE Semis Multiples Total GENERAL GOVERNMENT $216 $174 $122 $76 0.8% LIBRARY SERVICES $661 $533 $374 $ % FIRE SERVICES $631 $509 $357 $ % RECREATION SERVICES $9,131 $7,365 $5,161 $3, % PUBLIC WORKS $637 $514 $360 $ % PARKING $0 $0 $0 $0 0.0% TRANSIT $1,533 $1,237 $867 $ % SUB-TOTAL GENERAL SERVICES $12,809 $10,332 $7,241 $4, % ROADS - EXCLUDING BRAMWEST/NSTC $13,572 $10,947 $7,671 $4, % ROADS - BRAMWEST NSTC $554 $447 $313 $ % TOTAL CHARGE PER UNIT $26,935 $21,726 $15,225 $9, % (1) Based on a PPU of:
10 7 Calculated Non-Residential Charges for City-Wide Services INDUSTRIAL/OFFICE NON-INDUSTRIAL/NON-OFFICE Non-Residential Percentage Non-Residential Percentage Charge per of Grand Charge per of Grand SERVICE Square Metre Total Square Metre Total GENERAL GOVERNMENT $ % $ % LIBRARY SREVICES $ % $ % FIRE SERVICES $ % $ % RECREATION SERVICES $ % $ % PUBLIC WORKS $ % $ % PARKING $ % $ % TRANSIT $ % $ % SUB-TOTAL GENERAL SERVICES $ % $ % ROADS - EXCLUDING BRAMWEST/NSTC $ % $ % ROADS - BRAMWEST NSTC $ % $ % TOTAL CHARGE PER SQUARE METRE $ % $ %
11 8 As illustrated in the next table, the calculated residential charge is 5.3 per cent higher than the present charge for single and semi-detached units. Comparison of Single/Semi Detached Unit Residential Charges Current Calculated Difference in Charge per Charge per Calculated & Single/Semi Single/Semi Current Charge SERVICE $/Unit $ % GENERAL GOVERNMENT $47 $216 $ % LIBRARY SERVICES $716 $661 ($55) -7.7% FIRE SERVICES $485 $631 $ % RECREATION SERVICES $8,261 $9,131 $ % PUBLIC WORKS $552 $637 $ % PARKING $343 $0 ($343) % TRANSIT $1,307 $1,533 $ % SUB-TOTAL GENERAL SERVICES $11,711 $12,809 $1, % ROADS - EXCLUDING BRAMWEST/NSTC $13,291 $13,572 $ % ROADS - BRAMWEST NSTC $584 $554 ($30) -5.1% TOTAL CHARGE PER UNIT $25,586 $26,935 $1, % The general services portion of the charge increases by $1,098, or 9.4 per cent, over present rates. The increase reflects land and construction cost increases in excess of the legislated indexing rate. The Roads (excluding Bramwest/NSTC) charge is calculated to increase by 2.1 per cent ($281); reflecting cost increases being experienced for roads and related projects. The Bramwest NSTC roads charge is calculated to decrease by 5.1 per cent ($30). The calculated non-residential development charge for industrial and major office development is approximately 7.9 per cent lower than the City s current
12 9 charge. This is primarily due to an increase in the floor space per worker assumption when compared to the 2009 development charges study. Comparison of Industrial/Office Non-Residential Charge Current Calculated Difference in Industrial and Industrial and Calculated & Office Charge Office Charge Current Charge SERVICE $/sq. m $ % GENERAL GOVERNMENT $0.15 $0.68 $ % LIBRARY SERVICES $0.00 $ FIRE SERVICES $1.61 $1.97 $ % RECREATION SERVICES $0.00 $ PUBLIC WORKS $1.84 $1.99 $ % PARKING $1.14 $0.00 ($1.14) % TRANSIT $4.34 $4.79 $ % SUB-TOTAL GENERAL SERVICES $9.08 $9.43 $ % ROADS - EXCLUDING BRAMWEST/NSTC $38.47 $34.46 ($4.01) -10.4% ROADS - BRAMWEST NSTC $1.66 $1.42 ($0.24) -14.3% TOTAL CHARGE PER SQUARE METRE $49.21 $45.31 ($3.90) -7.9% The calculated non-residential development charge for non-industrial and nonoffice development (i.e. retail and institutional) is approximately 6.7 per cent lower than the City s current charge.
13 10 Comparison of Other Non-Residential Charge Current Non- Calculated Non- Industrial and Industrial and Difference in Non-Office Non-Office Calculated & Charge Charge Current Charge SERVICE $/sq. m $ % GENERAL GOVERNMENT $0.18 $0.68 $ % LIBRARY SERVICES $0.00 $ FIRE SERVICES $1.84 $1.97 $ % RECREATION SERVICES $0.00 $ PUBLIC WORKS $2.11 $1.99 ($0.12) -5.6% PARKING $1.31 $0.00 ($1.31) % TRANSIT $4.97 $4.79 ($0.18) -3.7% SUB-TOTAL GENERAL SERVICES $10.41 $9.43 ($0.98) -9.4% ROADS - EXCLUDING BRAMWEST/NSTC $88.74 $83.82 ($4.92) -5.5% ROADS - BRAMWEST NSTC $4.51 $3.45 ($1.06) -23.5% TOTAL CHARGE PER SQUARE METRE $ $96.70 ($6.96) -6.7% H. A PORTION OF DEVELOPMENT-RELATED COSTS REQUIRE FUNDING FROM NON-DEVELOPMENT CHARGE SOURCES The Development Charges Act, 1997 requires that the development-related net capital costs for soft services be reduced by 10 per cent in calculating the applicable development charge for these services. The 10 per cent share of development-related net capital costs not included in the development charge calculation must be funded from non-development charge sources. In total, about $63.80 million is identified to provide for the required 10 per cent reduction. Non-development charge funding for replacement portions of the capital forecast (e.g. Station #201 and #203) and other benefits to the existing community (e.g. library collection materials) will total an additional $83.96 million.
14 11 community (e.g. library collection materials) will total an additional $83.96 million. In summary, tax-supported funding of $ million will be required over the periods to support the development-related capital program. It is estimated that net operating costs will increase by about $56.17 million by the year 2023 as the facilities and infrastructure embodied in the capital forecast come on stream and are operated and maintained. I. NO SIGNIFICANT CHANGES ARE RECOMMENDED REGARDING COLLECTION OR BY-LAW ADMINISTRATION It is recommended that practices regarding collection of development charges and by-law administration continue to the extent possible. It is further recommended that the collection and administration policies be as consistent as practicable with those of the Regional Municipality of Peel in order to simplify by-law administration and aid understanding for those required to pay the charges. It is recommended that the by-law permit the payment of a development charge in cash or through services in lieu agreements. The municipality is not obligated to enter into services in lieu agreements. As required under the DCA, the City should codify any rules regarding application of the by-laws and exemptions within the development charges bylaws proposed for adoption. It is recommended that no exemptions, other than those required in the Development Charges Act, 1997, be formally adopted in the by-laws. The current non-statutory discount for industrial development is proposed to be eliminated since the calculated rate is lower than the City s current discounted rate.
15 12 City Staff have proposed that exemptions on portions of places of worship and full service hotels be maintained. City Staff have proposed a change in by-law wording that would waive development charges on the work portion of live-work units It is recommended that the City continue to pursue cost-sharing and uploading with the Regional Municipality of Peel for road-related infrastructure that meets the criteria of Regional significance. It is proposed that conservation authorities be removed from the definition of a local board It is recommended that Council adopt a set of Local Service Guidelines that will be presented through a Corporate Report. It is recommended that Council adopt the development-related capital forecast included in this background study, subject to annual review through the City s normal capital budget process.
16 13 I INTRODUCTION This City of Brampton Development Charges Background Study is presented as part of a process to lead to the approval of new development charge by-laws in compliance with the Development Charges Act, 1997 (DCA). The DCA and Ontario Regulation 82/98 (O. Reg. 82/98) require that a development charges background study be prepared in which development charges are determined with reference to: A forecast of the amount, type and location of housing units, population and non-residential development anticipated in the City; The average capital service levels provided in the City over the 10 year period immediately preceding the preparation of the background study; A review of capital works in progress and anticipated future capital projects, including an analysis of gross expenditures, funding sources, and net expenditures incurred or to be incurred by the City or its local boards to provide for the expected development, including the determination of the growth and non-development-related components of the capital projects; and An examination of the long term capital and operating costs for the capital infrastructure required for each service to which the development charges bylaws would relate. This study presents the results of the review which determines the developmentrelated net capital costs which are attributable to new development that is forecast to occur in the City of Brampton. These development-related net capital costs are then apportioned among various types of development (residential; non-residential) in a manner that reflects the increase in the need for each service attributable to each type of development. The study arrives, therefore, at proposed development charges for various types of development. The DCA provides for a period of public review and comment regarding the proposed development charges. Following completion of this process, in accordance with the DCA and Council s review of this study and the comments it receives regarding this study or other information brought to its attention about the proposed charges, it is intended that Council will pass new development charges for the City.
17 14 The remainder of this study sets out the information and analysis upon which the proposed development charges are based. Section II designates the services for which the development charges are proposed and the areas within the City to which the development charges will apply. It also briefly reviews the methodology that has been used in this background study. Section III presents a summary of the forecast residential and non-residential development which is expected to occur within the City over the period and to 2041 (ultimate development). Section IV summarizes the historic 10 year average capital service levels that have been attained in the City which form the basis for the development charge calculations. Section V, summarizes the development-related capital forecast that has been developed by various City departments and boards is reviewed. Section VI summarizes the calculation of applicable development charges and the resulting calculated development charges by class and type of development. Section VII provides a comparison of existing development charge rates in the City with the rates calculated in this study. Section VIII provides an examination of the long term capital and operating costs for each service included in the development charge calculation. Section IX provides a review of development charges administrative matters such as collection method and timing of payments, exemptions, credits for services-in-lieu, front-end financing, etc.
18 15 II THE METHODOLOGY USES A CITY-WIDE APPROACH TO ALIGN DEVELOPMENT-RELATED COSTS AND BENEFITS Several key steps are required in calculating any development charge. However, specific circumstances arise in each municipality which must be reflected in the calculation. This study, has therefore, been tailored for the City of Brampton s unique circumstances. The approach to the proposed development charges is focussed on providing a reasonable alignment of development-related costs with the development that necessitates them. A. A CITY-WIDE DEVELOPMENT CHARGE IS PROPOSED The City provides a wide range of services to the community it serves and has an extensive inventory of facilities, land, infrastructure, vehicles and equipment. The DCA provides municipalities with flexibility to define services that will be included in the development charge by-laws, provided that the other provisions of the Act and its associated regulations are met. The DCA also requires that the by-laws designate the areas within which the by-laws shall be imposed. The development charges may apply to all lands in the municipality or to other designated development areas as specified in the by-laws. 1. Services Based on a City-Wide Approach For the majority of services that the City provides, a range of capital facilities, land, equipment and infrastructure is available throughout the City; arenas, community centres, pools, libraries, fire stations, arterial roads, transit, parks and so on. As new development occurs, new facilities will need to be added so that service levels in newly developing areas are provided at levels enjoyed in existing communities. A widely accepted method for sharing the development-related capital costs for such City services is to apportion them over all new development anticipated in the City.
19 16 The following services are included in the City-wide development charge calculation: General Government; Library Services; Fire Services; Recreation Services Public Works Building & Fleet; Parking; Transit; Roads; and Bramwest Parkway/North-South Transportation Corridor These services form a reasonable basis on which to plan and administer the development charges. It is noted that the analysis of each of these services examines the individual capital facilities and equipment that make them up. For example, Recreation Services includes various indoor facilities such as community centres, pools, arenas; associated land requirements as allowed under the DCA; and equipment. The resulting development charge for these services would be imposed against all development anywhere in the City. B. KEY STEPS IN DETERMINING DEVELOPMENT CHARGES FOR FUTURE DEVELOPMENT-RELATED PROJECTS Several key steps are required in calculating development charges for future development-related projects. These are summarized below. 1. Development Forecast The first step in the methodology requires a development forecast to be prepared for the 10 year study period, , for most City-wide services and for growth to ultimate development (2041) for roads services. The forecast of the future residential and non-residential development used in this study is based on development anticipated to occur within approved Official Plan designated urban areas. The forecast reflects Growth Plan targets, 2011 Census data and recent development activity. For the residential portion of the forecast the net (or Census) population growth and population growth in new units is estimated. Net population growth equals the population in new housing units reduced by the decline in the population in the existing base anticipated over the 10 year period and to build-out (due to reducing household sizes as the community ages). Net population is used in the calculation of
20 17 the development charges funding envelopes. In calculating the per capita development charge, however, the population growth in new housing units is used. The non-residential portion of the forecast estimates the Gross Floor Area (GFA) of building space to be developed over the 10 year period, , and to The forecast provides estimates for three categories: population-related development, major office development, and employment land development. The forecast of GFA is based on the employment forecast for the City. Factors for floor space per worker by category are used to convert the employment forecast into gross floor areas for the purposes of the development charges study. 2. Service Categories and Historic Service Levels The Development Charges Act provides that the increase in the need for service attributable to anticipated development:... must not include an increase that would result in the level of service exceeding the average level of that service provided in the municipality over the 10-year period immediately preceding the preparation of the background study...(s. 5. (1) 4.) Historic 10 year average service levels thus form the basis for development charges. A review of City s capital service levels for buildings, land, vehicles, and so on, has therefore been prepared as a reference for the calculation, so that the portion of future capital projects that may be included in the development charge can be determined. The historic service levels used in this study have been calculated based on the period Development-Related Capital Forecast and Analysis of Net Capital Costs to be Included in the Development Charges A development-related capital forecast has been prepared by the City s departments and boards as part of the present study. The forecast identifies development-related projects and their gross and net costs, after allowing for capital grants, subsidies or other contributions as required by the Act (DCA, s. 5. (2)). In some cases, the capital costs identified in these forecasts represents supplementary funding requirements for projects which have had partial funding, already approved in previous years, under previously approved Capital Budgets. As such, the summary of funding attributed to some projects, may appear, low. The capital forecast provides another cornerstone upon which development charges are based. The DCA requires that the increase in the need for service attributable to the anticipated development may include an increase:
21 18... only if the council of the municipality has indicated that it intends to ensure that such an increase in need will be met. (s. 5. (1) 3.) In conjunction with DCA, s. 5. (1) 4. referenced above, these sections have the effect of requiring that the development charge be calculated on the lesser of the historic 10 year average service levels or the service levels embodied in future plans of the City. The development-related capital forecast prepared for this study ensures that development charges are only imposed to help pay for projects that have been or are intended to be purchased or built in order to accommodate future anticipated development. It is not sufficient in the calculation of development charges merely to have had the service in the past. There must also be a demonstrated commitment to continue to emplace facilities or infrastructure in the future. In this regard, Ontario Regulation 82/98, s. 3 states that: For the purposes of paragraph 3 of subsection 5 (1) of the Act, the council of a municipality has indicated that it intends to ensure that an increase in the need for service will be met if the increase in service forms part of an Official Plan, capital forecast or similar expression of the intention of the council and the plan, forecast or similar expression of the intention of the council has been approved by the council. For some projects in the development-related capital forecast, a portion of the project may confer benefits to existing residents. As required by the DCA, s. 5. (1) 6., these portions of projects and their associated net costs are the funding responsibility of the City from non-development charges sources. The amount of City funding for such non-growth shares of projects is also identified as part of the preparation of the development-related capital forecast. There is also a requirement in the DCA to reduce the applicable development charge by the amount of any uncommitted excess capacity that is available for a service. Such capacity is available to partially meet the future servicing requirements. Adjustments are made in the analysis to meet this requirement of the Act. Finally, in calculating development charges, the development-related net capital costs must be reduced by 10 per cent for all services except services related to a highway and fire (DCA, s. 5. (1) 8.). The 10 per cent discount is applied to the other services, e.g. recreation, libraries, parking, transit and the resulting City funding responsibility from non-development charge sources is identified. 4. Attribution to Types of Development The next step in the determination of development charges is the allocation of the development-related net capital costs between the residential and the non-residential sectors. This is done by using different apportionments for different services in
22 19 accordance with the demands which the two sectors would be expected to place on the various services and the different benefits derived from those services. Where reasonable data exist, the apportionment is based on the expected demand for, and use of, the service by each sector (e.g. shares of population and employment). Finally, the residential component of the City-wide development charge is applied to different housing types on the basis of average occupancy factors. The non-residential component is applied on the basis of gross building space in square metres. 5. Final Adjustment The final determination of the development charge results from adjustments made to development-related net capital costs for each service and sector resulting from the application of any unallocated reserve fund balances that are available to finance the development-related capital costs in the capital forecast. A cash flow analysis is also undertaken to account for the timing of projects and receipt of development charges. Interest earnings or borrowing costs are therefore accounted for in the calculation as allowed under the DCA.
23 20 III POPULATION IS FORECAST TO INCREASE BY 144,100 AND NON-RESIDENTIAL BUILDING SPACE BY 4.9MILLION SQUARE METRES BY 2023 This section provides the basis for the development forecasts used in calculating the development charges and provides a summary of the forecast results. The development forecast in the development charges background study is based on estimates of growth occurring within approved Official Plan designated urban areas. This forecast is consistent with the population and employment forecasts endorsed by City Council in April 2014 for use in completing the City s 2014 Development Charges By-law update. This section begins with a brief discussion of recent growth trends in the GTA and in Brampton. This is followed by a summary of the results of the housing unit and population forecast and of the non-residential employment and space forecast. Details of the forecasts are provided in Appendix A. A. BRAMPTON HAS EXPERIENCED RAPID GROWTH IN RECENT YEARS During the 10-year period from 2004 to 2013 the City of Brampton experienced rapid population and employment growth. This growth was fuelled by a strong GTA economy and continued migration into the metropolitan region. Moving forward, Brampton is expected to continue to experience rapid housing growth until its greenfield housing capacity becomes largely exhausted, at some point during the 2030s. However, the rate of growth is expected to slow from the levels experienced over the past 10 years. Brampton s population and housing growth has well exceeded the GTA average in recent years. Between the 2001 and 2011 Census, the population of the GTA grew by 972,200 people or 19 per cent. During this same period the City of Brampton s population grew by approximately 61 per cent per cent to a 2011 Census value of 523,900. The number of housing units in Brampton has grown at a lower rate than population; likely as a result of the increase in the average number of persons residing in dwelling units. In contrast to other parts of the GTA, average household sizes in Brampton
24 21 have grown over the course of the last decade, from an average household size of 3.4 in 2004 to 3.53 in For example, the population in new dwelling unit assumption for single and semi detached units has been increased from 4.0 in the 2009 Development Charges Study to 4.24 in this Study. The City of Brampton has experienced stable employment growth over the past decade. In early years the City s employment growth rate slowed from 3.1 per cent per year from 2004 to 2006 to 2 per cent from 2007 to In recent years, however, the growth rate has rebounded to approximately 3.8 per cent in 2012 and B. THE RESIDENTIAL FORECAST IS BASED ON THE FORECASTS ENDORSED BY CITY COUNCIL IN APRIL 2014 The residential development forecast is based on development that is expected in designated urban areas of Brampton s Official Plan. A description of the forecast methodology and more detailed tables of results are provided in Appendix A. Table 1 provides a summary of the residential forecast for two planning periods: a 10 year planning period, , and development. As noted in Section II, for development charges calculation purposes, the 10 year planning period is applicable to non-engineering services. The ultimate development forecast has been utilized in the calculation of the Roads & Related component of development charges. Table 1 Summary of Residential Development Charges Forecast Existing RESIDENTIAL FORECAST As At Forecast As at Forecast As at Mid-Year 2013 Change Mid Year-2023 Change Mid-Year 2041 Households 158,240 43, ,405 90, ,326 Population Census 557, , , , ,000 With Undercoverage 580, , , , ,100 In New Households 162, ,666 % higher than "net" population 13% 5% The City s Census population is expected to increase by about 144,100 people over the next 10 years reaching about 701,900 by The ultimate population is forecast to reach about 855,000 persons.
25 22 The population figures referred to above reflect the net increase in population. This is the increase after taking into account the expected continuation of the decline in occupancy factors in existing housing units. The population residing in new housing units is expected to increase by 162,396 people over the 10-year planning period and 311,666 people to ultimate development. About 43,200 housing units are forecast to be developed between 2014 and Over the long-term to 2041, about 90,100 additional housing units are forecast to be developed. Over this time period, the composition of the new units is forecast to be 54 per cent singles/semis, 20 per cent rows and other multiples, and 26 per cent apartments. C. NON-RESIDENTIAL SPACE FORECAST IS BASED ON FORECAST EMPLOYMENT GROWTH The non-residential space forecast is based on the forecast of employment, since most new non-residential space is required to accommodate new employment growth. Non-residential space is forecast according to three categories: population related employment, major office employment, and employment land employment. Population related employment includes traditional retail forms, such as regional centres, district centres, neighbourhood convenience, highway commercial, big box and power centres occupied by retail and local service uses. Population related employment also includes institutional space consisting of all community institutional uses such as schools, places of worship and hospitals. Major office employment is defined as that working in free-standing office buildings of 20,000 square feet or greater. Employment land employment consists of buildings in Brampton s industrial areas and may include some non-traditional retail space and office space associated with industrial or storage uses. Because new non-residential space is required primarily to accommodate new employment growth, employment and space are expected to grow at similar rates over the forecast period. The non-residential space forecast prepared for development charges purposes is summarized on Table 2.
26 23 Table 2 Summary of Non-Residential Development Forecast Existing NON-RESIDENTIAL FORECAST As At Forecast As at Forecast As at Mid-Year 2013 Change Mid Year-2023 Change Mid-Year 2041 Employment 185,570 65, , , ,360 Non-Residential Building Space (sq.m.) 4,967,120 9,523,450 Industrial / Office Building Space (sq.m.) 3,951,720 7,491,150 Non-Industrial Building Spaces (sq.m.) 1,015,400 2,032,300 Table 2 provides a summary of the employment forecast for the period and to ultimate development. Over the next 10 years, employment is projected to grow by 65,910 employees, an increase of nearly 36 per cent. Beyond 2023 to ultimate development, a further 69,880 employees are forecast to be added. Overall, City of Brampton employment is forecast to increase by 135,790 employees, about 73 per cent, between now and ultimate development. The table also shows that about 4.97 million square metres of Gross Floor Area (GFA) is forecast to come on-stream over the next decade. During the post 2023 period to ultimate development it is forecast that a further 4.56 million square metres of GFA will be added. Overall, about 9.52 million square meters of GFA will be added from 2014 to The major share of space (3.95 million square metres or about 80 per cent) that is forecast to be added over the next 10 years is anticipated in the employment land (i.e. industrial) and major office space category. The remaining forecast refers be population related employment space (i.e. non-industrial/non-office space) at about 1.02 million square metres (approximately 20 per cent of the total).
27 24 IV SUMMARY OF HISTORIC CAPITAL SERVICE LEVELS The DCA and Ontario Regulation 82/98 require that the development charges be set at a level no higher than the average service level provided in the municipality over the 10 year period immediately preceding the preparation of the background study, on a service by service basis. For non-engineering services (fire, library, recreation, transit etc.) the legislative requirement is met by documenting historic service levels for the preceding 10 years, in this case, for the period Typically, service levels for non-engineering services are measured as a ratio of inputs per capita (or per population plus employment). O. Reg. 82/98 requires that when determining historical service levels both quantity and quality of service be taken into consideration. In most cases, the service levels are initially established in quantitative terms. For example, service levels for buildings are presented in terms of square feet per capita. The qualitative aspect is introduced by the consideration of the monetary value of the facility or service. In the case of buildings, for example, the cost would be shown in terms of $ s/square foot to replace or construct a facility of the same quality. This approach helps to ensure that the development-related capital facilities that are to be charged to new development reflect not only the quantity (number and size) but also the quality (value or replacement cost) of service provided historically by the City. Both the quantitative and qualitative aspects of service levels used in the present analysis are based on information provided by staff of the City and boards, and is based on historical records and their experience with costs to acquire or construct similar facilities, equipment and infrastructure as of Table 3 summarizes service levels for all services included in the development charge calculation. Appendices B and C provide detailed historical inventory data upon which the calculation of service levels is based.
28 25 TABLE 3 CITY OF BRAMPTON SUMMARY OF AVERAGE HISTORIC SERVICE LEVELS FOR GENERAL AND ROADS SERVICES Service Service Level Indicator 1.0 GENERAL GOVERNMENT $42.34 per capita & employment Buildings $31.40 per capita & employment Land $7.56 per capita & employment Materials $0.83 per capita & employment General Government Fleet $2.55 per capita & employment 2.0 LIBRARY SERVICES $ per capita Buildings $ per capita Land $21.31 per capita Materials $30.13 per capita Furniture and Equipment $11.12 per capita 3.0 FIRE SERVICES $ per household Buildings $ per household Land $ per household Vehicles $ per household Equipment $44.50 per household 4.0 RECREATION $2, per capita Indoor Recreation $1, per capita Park Facilities $ per capita Outdoor Buildings $68.47 per capita Parkland $ per capita Special Facilities $ per capita Fleet and Equipment $39.71 per capita 5.0 PUBLIC WORKS - BUILDINGS & FLEET $ per capita & employment Buildings $38.96 per capita & employment Land $74.05 per capita & employment Furniture $1.98 per capita & employment Fleet $24.97 per capita & employment 6.0 PARKING $ per capita & employment Parking Lots $91.92 per capita & employment Land $19.34 per capita & employment Equipment $0.55 per capita & employment 7.0 TRANSIT $ per capita & employment Transil Facilities $79.02 per capita & employment Service Centres/Terminals $19.47 per capita & employment Land $49.93 per capita & employment Bus Shelters/Pads $13.79 per capita & employment Stops/Loops $10.69 per capita & employment Equipment $21.86 per capita & employment Vehicles $ per capita & employment 8.0 ROADS $7, per capita & employment Roads and Related Infrastructure $7, per capita & employment
29 26 V THE DEVELOPMENT-RELATED CAPITAL FORECAST A. A DEVELOPMENT-RELATED CAPITAL FORECAST IS PROVIDED FOR COUNCIL S APPROVAL The DCA requires the Council of a municipality to express its intent to provide future capital facilities at the level incorporated in the development charges calculation. As noted above in Section II, Ontario Regulation 82/98, s. 3 states that: For the purposes of paragraph 3 of subsection 5 (1) of the Act, the council of a municipality has indicated that it intends to ensure that an increase in the need for service will be met if the increase in service forms part of an official plan, capital forecast or similar expression of the intention of the council and the plan, forecast or similar expression of the intention of the council has been approved by the council. Based on the development forecasts summarized in Section III and detailed in Appendix A, staff of the City departments, in collaboration with the consultants, developed a development-related capital forecast as of December 31, 2013 setting out those projects that are required to service anticipated development. For all services except Roads, the capital plan covers the 10 year period from As permitted by the DCA s. 5 (1) 4., the development charge for Roads services is based on ultimate development expected in the City (to 2041). It should be noted, in some cases, the capital costs identified in these forecasts represents supplementary funding requirements for projects which have had partial funding, already approved in previous years, under previously approved Capital Budgets. As such, the summary of funding attributed to some projects, may appear, low. One of the recommendations contained in this background study is for Council to adopt the development-related capital forecast developed for the purposes of the development charges calculation. It is assumed that future capital budgets and forecasts will continue to bring forward the development-related projects contained herein, that are consistent with the growth occurring in the City. It is acknowledged that changes to the forecast presented here, may occur through the City s normal capital budget process.
30 27 B. THE DEVELOPMENT-RELATED CAPITAL FORECAST FOR CITY-WIDE SERVICES A summary of the Development-Related Capital Forecast for general services is presented in Table 4.
31 28 TABLE 4 CITY OF BRAMPTON SUMMARY OF DEVELOPMENT-RELATED CAPITAL FORECAST FOR GENERAL SERVICES (in $000) Gross Grants/ Municipal Total Net Capital Program Service Cost Subsidies Cost GENERAL GOVERNMENT $16,599.6 $0.0 $16,599.6 $535.3 $10,914.3 $764.3 $764.3 $1,189.3 $441.4 $541.4 $541.4 $441.4 $ Development-Related Studies $4,571.0 $0.0 $4,571.0 $171.0 $550.0 $400.0 $400.0 $825.0 $400.0 $500.0 $500.0 $400.0 $ Buildings and Fleet $12,028.6 $0.0 $12,028.6 $364.3 $10,364.3 $364.3 $364.3 $364.3 $41.4 $41.4 $41.4 $41.4 $ LIBRARY SERVICES $70,887.0 $0.0 $70,887.0 $22,694.0 $2,977.0 $3,077.0 $3,277.0 $3,477.0 $3,677.0 $18,877.0 $4,077.0 $4,277.0 $4, Recovery of Negative Reserve Fund Balance $20,017.0 $0.0 $20,017.0 $20,017.0 $0.0 $0.0 $0.0 $0.0 $0.0 $0.0 $0.0 $0.0 $ Buildings, Land & Furnishings $15,500.0 $0.0 $15,500.0 $50.0 $50.0 $50.0 $50.0 $50.0 $50.0 $15,050.0 $50.0 $50.0 $ Material Acquisitions $35,370.0 $0.0 $35,370.0 $2,627.0 $2,927.0 $3,027.0 $3,227.0 $3,427.0 $3,627.0 $3,827.0 $4,027.0 $4,227.0 $4, FIRE SERVICES $82,519.5 $0.0 $82,519.5 $44,858.5 $11,428.0 $8,303.0 $2,000.0 $6,430.0 $6,200.0 $2,000.0 $900.0 $200.0 $ Recovery of Negative Reserve Fund Balance $23,683.5 $0.0 $23,683.5 $23,683.5 $0.0 $0.0 $0.0 $0.0 $0.0 $0.0 $0.0 $0.0 $ Buildings, Land & Furnishings $46,816.0 $0.0 $46,816.0 $20,980.0 $10,203.0 $6,253.0 $0.0 $4,780.0 $4,600.0 $0.0 $0.0 $0.0 $ Vehicles $6,045.0 $0.0 $6,045.0 $120.0 $1,075.0 $1,200.0 $1,100.0 $750.0 $700.0 $1,100.0 $0.0 $0.0 $ Equipment $5,975.0 $0.0 $5,975.0 $75.0 $150.0 $850.0 $900.0 $900.0 $900.0 $900.0 $900.0 $200.0 $ RECREATION AND PARKS $425,410.7 $10,680.0 $414,730.7 $19,516.9 $99,131.9 $24,567.9 $26,284.9 $55,769.9 $32,937.9 $34,239.9 $39,138.9 $27,467.9 $55, Major Facilities $104,360.0 $0.0 $104,360.0 $1,030.0 $5,880.0 $850.0 $13,500.0 $42,100.0 $1,500.0 $20,500.0 $19,000.0 $0.0 $ Park Facilities and Equipment/Fleet $10,448.7 $0.0 $10,448.7 $644.9 $644.9 $4,644.9 $644.9 $644.9 $644.9 $644.9 $644.9 $644.9 $ Parkland Development $310,602.0 $10,680.0 $299,922.0 $17,842.0 $92,607.0 $19,073.0 $12,140.0 $13,025.0 $30,793.0 $13,095.0 $19,494.0 $26,823.0 $55, PUBLIC WORKS: BUILDINGS AND FLEET $113,459.2 $0.0 $113,459.2 $41,862.3 $8,999.1 $8,320.1 $19,305.1 $3,923.1 $9,131.1 $19,830.1 $696.1 $696.1 $ Recovery of Negative Reserve Fund Balance $38,016.2 $0.0 $38,016.2 $38,016.2 $0.0 $0.0 $0.0 $0.0 $0.0 $0.0 $0.0 $0.0 $ Buildings, Land & Equipment $68,482.0 $0.0 $68,482.0 $3,150.0 $8,303.0 $7,624.0 $18,609.0 $3,227.0 $8,435.0 $19,134.0 $0.0 $0.0 $ Equipment $6,961.0 $0.0 $6,961.0 $696.1 $696.1 $696.1 $696.1 $696.1 $696.1 $696.1 $696.1 $696.1 $ PARKING $23,550.2 $0.0 $23,550.2 $2,355.0 $2,355.0 $2,355.0 $2,355.0 $2,355.0 $2,355.0 $2,355.0 $2,355.0 $2,355.0 $2, Parking Facilities $23,550.2 $0.0 $23,550.2 $2,355.0 $2,355.0 $2,355.0 $2,355.0 $2,355.0 $2,355.0 $2,355.0 $2,355.0 $2,355.0 $2, TRANSIT $330,818.6 $149,092.0 $181,726.6 $57,459.6 $14,658.0 $8,739.0 $5,794.0 $79,221.0 $3,171.0 $3,171.0 $3,171.0 $3,171.0 $3, Recovery of Negative Reserve Fund Balance $44,936.6 $0.0 $44,936.6 $44,936.6 $0.0 $0.0 $0.0 $0.0 $0.0 $0.0 $0.0 $0.0 $ Buildings, Land & Equipment $76,500.0 $0.0 $76,500.0 $750.0 $750.0 $0.0 $0.0 $75,000.0 $0.0 $0.0 $0.0 $0.0 $ Vehicles $205,179.0 $148,009.0 $57,170.0 $11,461.0 $13,596.0 $8,427.0 $5,482.0 $3,909.0 $2,859.0 $2,859.0 $2,859.0 $2,859.0 $2, Other Transit $4,203.0 $1,083.0 $3,120.0 $312.0 $312.0 $312.0 $312.0 $312.0 $312.0 $312.0 $312.0 $312.0 $312.0 TOTAL TEN-YEAR GENERAL SERVICES $1,063,244.8 $159,772.0 $903,472.8 $189,281.7 $150,463.3 $56,126.3 $59,780.3 $152,365.3 $57,913.4 $81,014.4 $50,879.4 $38,608.4 $67,040.4
32 29 The table provides a total for all general services analysed over the 10 year period, The Roads & Related services analysed to ultimate development (2041) are not included in this table. Further details on the capital plans for each individual service category are available in Appendices B C. The Development-Related Capital Forecast for ten-year general services estimates a total gross cost of $1.06 billion. Approximately, $ million in senior government grants, subsidies or other recoveries are expected to offset the cost of the program. Therefore, the net municipal cost of the capital program is $ million. This capital forecast incorporates those projects identified to be related to development anticipated in the next 10 years. It is not implied that all of these costs are to be recovered from new development by way of development charges (see the following Section VI for the method and determination of net capital costs attributable to growth). Portions of this capital forecast may relate to providing servicing for development which has occurred prior to 2014 (for which development charge reserve fund balances exist), for replacement of existing capital facilities (e.g. Fire station repositioning/replacement) or for growth anticipated to occur beyond the planning period. In addition, the amounts shown on Table 4 have not been reduced by 10 per cent for various soft (or general) services as mandated by s. 5 (1) 8. of the DCA. Of the $ million in ten-year net municipal capital costs for general services, $ million (46 per cent) is related to the provision of Recreation Services. The development of City-wide parkland and the construction of new recreation facilities are included in the capital program. This service category also provides for the acquisition of recreation related City-wide fleet and equipment. The development-related capital program for Transit relates to the recovery of a negative reserve fund balance, a new maintenance and storage facility garage, additional vehicles and transit equipment. This program also includes two new minor transit terminals in 2014 and 2015, located in the northeast and northwest end of the City. The net municipal cost for this program totals to $ million and represents 20% of the net municipal capital costs for general services.
33 30 The next largest development-related capital component is for Public Works at $ million (13 per cent). The capital program includes for the recovery of the City s negative reserve fund balance and the construction of new works yards throughout the planning period. The program also includes new additions to the City s fleet and equipment inventory. Fire Services represents $82.52 million (9 per cent) of the capital program and provides for two new stations, a new training facility, an apparatus and maintenance facility (remaining unfunded balance only) and the replacement of two stations (#201 and #203) with larger facilities as a result of growth. The program also provides for the recovery of the negative reserve fund balance as well as new vehicles and equipment (e.g. opticom, dispatch and firefighting equipment). The development-related capital forecast for Library Services totals about $70.89 million (8 per cent). The program includes the construction of a new District 3 library branch. The capital forecast also includes additions to the City s library collections. Parking services represents $23.55 million (3 per cent) of the capital program and is solely related to a proportion of the annual lease payments associated with the construction of a new building and parking lot associated with the new South West Quadrant (City Hall Expansion) project. General Government is included at $16.60 million (2 per cent). General Government service consists of two components, general government services relating to buildings (e.g. animal control, courthouse) and fleet; and general government service for development-related studies. In addition to the development-related capital forecast for general services, approximately $1.44 billion in net roads and related works are planned to In addition to roads, the program also provides for grade separations, structures, sidewalks, streetlights, intersection improvements, traffic signalization, streetscaping and development-related studies. Of the $1.44 billion in costs, $63.29 million relates to the Bramwest Parkway, which has a separate reserve fund.
34 31 VI PROPOSED DEVELOPMENT CHARGES ARE CALCULATED IN ACCORDANCE WITH THE DCA This section summarizes the calculation of development charges for each service category and the resulting total development charge by type of development. For Citywide services, the calculation of the unadjusted per capita (residential) and per square metre (non-residential) charges is reviewed. Adjustments to these amounts resulting from a cash flow analysis that takes interest earnings and borrowing costs into account are also discussed. For residential development, the adjusted total per capita amount is then converted to a variable charge by housing unit type using various unit occupancy factors. For nonresidential development, the charge is differentiated by use (industrial/office and nonoffice/non-industrial). The calculated non-residential charges are based on gross floor area (GFA) of building space. It is noted that the calculation of the City-wide development charges does not include any provision for exemptions required under the DCA, such as the exemption for enlargements of up to 50 per cent on existing industrial buildings. Such legislated exemptions, or other exemptions which Council may choose to provide, will result in loss of development charge revenue for the affected types of development. Any such revenue loss may not be made up, however, by offsetting increases in other portions of the calculated charge. A. UNADJUSTED DEVELOPMENT CHARGE CALCULATION FOR CITY-WIDE SERVICES A summary of the unadjusted residential and non-residential development charges for City-wide services is presented in Tables 5 and 6. The totals in the table separate the ten-year City-wide general services from the City-wide Roads Services which are analysed to ultimate development. Further details of the calculation for each individual City service category are available in Appendices B C.
35 32 TABLE 5 CITY OF BRAMPTON SUMMARY OF UNADJUSTED RESIDENTIAL AND NON-RESIDENTIAL DEVELOPMENT CHARGES 10-YEAR CAPITAL PROGRAM FOR GENERAL SERVICES 10 Year Growth in Population in New Units 162, Year Growth in Square Meters 4,967,120 Development-Related Capital Forecast ( ) Total DC Net Replacement Legislated Eligible Service Municipal & Benefit to Service Available Post-2023 Costs for Residential Non-Residential Cost Existing Discount DC Reserves Benefit Recovery Share Share ($000) ($000) ($000) ($000) ($000) ($000) % $000 % $ GENERAL GOVERNMENT $16,599.6 $1,611.0 $1,498.9 $1,854.4 $968.7 $10, % $7, % $3,093.3 Unadjusted Development Charge Per Capita ($) $46.63 Unadjusted Development Charge Per Sq. M. ($) $ LIBRARY SERVICES $70,887.0 $26,500.0 $4,438.7 $0.0 $17,997.0 $21, % $21, % $0.0 Unadjusted Development Charge Per Capita ($) $ Unadjusted Development Charge Per Sq. M. ($) $ FIRE SERVICES $82,519.5 $14,465.0 $0.0 $0.0 $38,932.3 $29, % $20, % $8,445.5 Unadjusted Development Charge Per Capita ($) $ Unadjusted Development Charge Per Sq. M. ($) $ RECREATION AND PARKS $414,730.7 $22,374.0 $39,235.7 $3,205.1 $3,714.3 $346, % $346, % $0.0 Unadjusted Development Charge Per Capita ($) $2, Unadjusted Development Charge Per Sq. M. ($) $ PUBLIC WORKS: BUILDINGS AND FLEET $113,459.2 $0.0 $0.0 $0.0 $84,066.2 $29, % $20, % $8,524.0 Unadjusted Development Charge Per Capita ($) $ Unadjusted Development Charge Per Sq. M. ($) $ PARKING $23,550.2 $19,009.1 $454.1 $4,087.0 $0.0 $0.0 71% $0.0 29% $0.0 Unadjusted Development Charge Per Capita ($) $0.00 Unadjusted Development Charge Per Sq. M. ($) $ TRANSIT $181,726.6 $0.0 $18,172.7 $0.0 $90,855.2 $72, % $51, % $21,082.7 Unadjusted Development Charge Per Capita $ Unadjusted Development Charge Per Sq. M. $4.24 Total - 10 Year City-Wide General Services $903,472.8 $83,959.1 $63,800.0 $9,146.4 $236,533.6 $510,033.7 $468,888.3 $41,145.4 Unadjusted Development Charge Per Capita ($) $2, Unadjusted Development Charge Per Sq. M. ($) $8.28
36 33 TABLE 6 CITY OF BRAMPTON SUMMARY OF RESIDENTIAL AND NON-RESIDENTIAL DEVELOPMENT CHARGES CAPITAL PROGRAM FOR ROADS AND RELATED INFRASTRUCTURE: Population in New Units ( ) 311,666 Non-residential Floor Space Growth in Square Meters ( ) 9,523,450 Industrial and Major Office 7,491,150 Population Related 2,032,300 Development-Related Capital Program Total DC Net Replacement Legislated Eligible Municipal & Benefit to Service Available Post-2041 Costs for Residential Non-Residential Cost Existing Discount DC Reserves Benefit Recovery Share Share ($000) ($000) ($000) ($000) ($000) ($000) % $000 % $ ROADS - EXCLUDING BRAMWEST NSTC $ 1,378,793.0 $ 64,958.6 $ - $ - $ - $ 1,313, % $ 919, % $ 394,150.3 Unadjusted Development Charge Per Capita $2, Industrial/Office Unadjusted Development Charge Per Sq. M $31.95 Non-Industrial/Office Unadjusted Development Charge Per Sq. M $ ROADS - BRAMWEST PARKWAY / NSTC $ 63,287.8 $ - $ - $ 11,295.9 $ - $ 51, % $ 36, % $ 15,597.6 Unadjusted Development Charge Per Capita $ Industrial/Office Unadjusted Development Charge Per Sq. M $1.26 Non-Industrial/Office Unadjusted Development Charge Per Sq. M $3.01 Total - City-Wide Hard Services (to 2041) $1,442,080.8 $64,958.6 $0.0 $11,295.9 $0.0 $1,365,826.3 $956,078.4 $409,747.9 Unadjusted Development Charge Per Capita ($) $3, Industrial/Office Unadjusted Development Charge Per Sq. M $33.21 Non-Industrial/Office Unadjusted Development Charge Per Sq. M $79.20
37 34 1. General Services A summary of the unadjusted residential and non-residential development charges for the City-wide general services is presented in Table 5. The capital forecast for the general services incorporates those projects identified to be related to development anticipated in the next ten years. However, not all of the capital costs are to be recovered from new development by way of development charges. Table 5 shows that $83.96 million of the capital forecast relates to replacement of existing capital facilities or for shares of projects that provide benefit to the existing community. This amount results from the replacement of two fire stations, the portions of library collections materials, portion of the parking lease relating to non-public parking spaces and shares of development-related studies. These portions of capital costs will have to be funded from non-development charge revenue sources. An additional share of $9.15 million has been identified as available development charges reserves and represents the revenues collected from previous development charges. This portion has been netted out of the chargeable capital costs. Another share of the forecast, $ million, is attributable to development beyond the 2023 period (and may therefore be recovered under future development charge studies). The DCA, s. 5 (1) 8 requires that development-related net capital costs for soft services be reduced by 10 per cent in calculating the applicable development charge. The discount does not apply to the Fire Services or services related to a highway. The 10 per cent share of development-related net capital costs not included in the development charge calculations must be funded from non-development charge sources. In total, about $63.80 million is identified as the required 10 per cent reduction. The total costs eligible for recovery through development for general services is $ million. This amount is allocated between the residential and non-residential sectors to derive the unadjusted development charges. Library and Recreation Services are all deemed to benefit residential development only, while the General Government, Fire Services, Public Works: Buildings & Fleet, Parking and Transit services are allocated between both sectors based on shares of population and employment growth. Approximately $ million of the general services
38 35 development charges eligible capital program is deemed to benefit residential development. When this amount is divided by the ten year population growth in new units (162,396) an unadjusted charge of $2, per capita is the result. The nonresidential share of the general services capital program totals $41.15 million and when this amount is divided by the ten year forecast of non-residential space growth (4,967,120 square metres) an unadjusted charge of $8.28 per square metre is the result. One general services non-residential charge has been calculated for all forms of development (industrial/office, and non-industrial/non-office) since these forms of land uses are expected to generate similar servicing requirements. 2. Roads Services Roads services include roads structures, sidewalks, streetlights, intersection improvements, grade separations, gateways, traffic signalization and road projects associated with Bramwest Parkway/NSTC. The total net municipal cost estimated for this infrastructure is $1.44 billion after grants, subsidies, and other recoveries are removed (see Table 6). This infrastructure will be used to service the ultimate development of the lands within the City s currently designated urban areas. This development is expected to occur over the next 28 years. Not all of the net municipal costs are to be recovered from new development by way of development charges. Table 6 shows that $64.96 million of the capital programs is identified as the benefit to existing share. This amount has been netted off the chargeable capital cost. Another deduction is made to account for development charges collected from prior growth ($11.30 million) related solely to the Bramwest NSTC corridor. The remaining $1.37 billion is related to development in the period and has been included in the development charge calculation. The capital program eligible for recovery through development charges is allocated to the residential and non-residential sectors based on future shares of population and employment growth over the planning period to On this basis, the allocation to the residential and non-residential sectors is calculated at 70 per cent and 30 per cent, respectively. This amount is allocated to the residential and non-residential sectors based on each sector s share of forecast future population in new units and employment growth to ultimate development. The residential sector s unadjusted
39 36 development charge is calculated at $3, per capita. This charge is based on population in new units to growth to 2041 of 311,666. The non-residential share of the capital program costs has been allocated according to each use s share of total employment growth to The industrial and major office development sector s share results in an unadjusted development charge of $33.21 per square metre. This charge is based on growth in industrial and office floor space to 2041 of 7,491,150 square metres. The population related (i.e. non-industrial and non-office developments) sector s share results in an unadjusted development charge of $79.20 per square metre. This charge is based on growth in population related floor space to 2041 of 2,032,300 square metres. 3. Adjusted Rates for City-Wide Residential and Non-Residential Development Charges Final adjustments to the unadjusted development charge rates summarized above are made through a cash flow analysis. The analysis, details of which are included in the Appendices, considers the borrowing cost and interest earnings associated with the timing of expenditures and development charge receipts for each service. Tables 7, 8 and 9 summarize the results of the adjustment for the residential and nonresidential components of the City-wide rates respectively. As shown on Table 7, the adjusted per capita rate for general services increases from $2, to $3, after the cash flow analysis. For all roads, the charge increases after the cash flow analysis, from $3, to $3, per capita. Residential City-wide development charges are proposed to vary by dwelling unit type to reflect their different occupancy factors and resulting demand for services. As shown in the Table, the proposed residential charge for City services ranges from $9,529 for small apartments (<=750 sq.ft) to $26,935 for single detached and semi-detached units. The proposed charge for rows (and other multiple units) is $21,726 and $15,225 for large apartments (>750 sq.ft). Table 8 shows that the adjusted rate for Industrial and Office development increases from $41.49 to $45.31 per square metre. Table 9 shows that the adjusted rate for other non-residential development increases from $87.48 to $96.70 per square metre.
40 37 TABLE 7 CITY OF BRAMPTON RESIDENTIAL DEVELOPMENT CHARGE Unadjusted Adjusted Charge Charge Per Unit Type (1) Charge Per Per Capita Singles/ Rows / Other Large Apts Small Apts SERVICE Capita After Cashflow Semis Multiples > 750 sq.ft < = 750 sq.ft GENERAL GOVERNMENT $46.63 $50.95 $216 $174 $122 $76 LIBRARY SERVICES $ $ $661 $533 $374 $234 FIRE SERVICES $ $ $631 $509 $357 $223 RECREATION SERVICES $2, $2, $9,131 $7,365 $5,161 $3,230 PUBLIC WORKS $ $ $637 $514 $360 $225 PARKING $0.00 $0.00 $0 $0 $0 $0 TRANSIT $ $ $1,533 $1,237 $867 $543 SUB-TOTAL PER CAPITA $2, $3, $12,809 $10,332 $7,241 $4,531 ROADS - EXCLUDING BRAMWEST/NSTC $2, $3, $13,572 $10,947 $7,671 $4,802 ROADS - BRAMWEST/NSTC $ $ $554 $447 $313 $196 TOTAL CHARGE PER CAPITA $5, $6, $26,935 $21,726 $15,225 $9,529 1: Person per unit:
41 38 TABLE 8 CITY OF BRAMPTON NON-RESIDENTIAL DEVELOPMENT CHARGE INDUSTRIAL/OFFICE DEVELOPMENT CHARGE Unadjusted Adjusted Charge Charge SERVICE ($/sq.m.) ($/sq.m.) GENERAL GOVERNMENT $0.62 $0.68 LIBRARY SERVICES $0.00 $0.00 FIRE SERVICES $1.70 $1.97 RECREATION SERVICES $0.00 $0.00 PUBLIC WORKS $1.72 $1.99 PARKING $0.00 $0.00 TRANSIT $4.24 $4.79 SUB-TOTAL PER SQ METRE $8.28 $9.43 ROADS - EXCLUDING BRAMWEST/NSTC $31.95 $34.46 ROADS - BRAMWEST NSTC $1.26 $1.42 TOTAL CHARGE PER SQ METRE $41.49 $45.31
42 39 TABLE 9 CITY OF BRAMPTON NON-RESIDENTIAL DEVELOPMENT CHARGE NON-INDUSTRIAL/NON-OFFICE DEVELOPMENT CHARGE Unadjusted Adjusted Charge Charge SERVICE ($/sq.m.) ($/sq.m.) GENERAL GOVERNMENT $0.62 $0.68 LIBRARY SERVICES $0.00 $0.00 FIRE SERVICES $1.70 $1.97 RECREATION SERVICES $0.00 $0.00 PUBLIC WORKS $1.72 $1.99 PARKING $0.00 $0.00 TRANSIT $4.24 $4.79 SUB-TOTAL PER SQ METRE $8.28 $9.43 ROADS - EXCLUDING BRAMWEST/NSTC $76.18 $83.82 ROADS - BRAMWEST NSTC $3.01 $3.45 TOTAL CHARGE PER SQ METRE $87.48 $96.70
43 40 VII COMPARISON OF CALCULATED AND CURRENT DEVELOPMENT CHARGES Tables 10, 11 and 12 present a comparison of total proposed City-wide development charges for a single/semi-detached housing unit and per square metre respectively with the City s existing charges (as of February 1, 2014). Table 10 shows that the calculated charge per single/semi detached unit of $26,935 will produce an increase of $1,349, or 5.3 per cent, over the present development charge. Table 11 shows the calculated charge for the non-residential Industrial and Office sectors. The calculated charge of $45.31 per square metre represents a decrease of about 7.9 per cent ($3.90) from the existing rate of $ Table 12 shows the calculated charge for the other non-residential uses. The calculated charge of $96.70 per square metre represents a decrease of about 6.7 per cent ($6.96) over the existing rate of $
44 41 TABLE 10 CITY OF BRAMPTON RESIDENTIAL DEVELOPMENT CHARGE PER SINGLE/SEMI DETACHED UNIT Current Calculated Difference in Charge per Charge per Calculated & Current Single/Semi Single/Semi Charge SERVICE $/Unit $ % GENERAL GOVERNMENT $47 $216 $ % LIBRARY SERVICES $716 $661 ($55) -7.7% FIRE SERVICES $485 $631 $ % RECREATION SERVICES $8,261 $9,131 $ % PUBLIC WORKS $552 $637 $ % PARKING $343 $0 ($343) % TRANSIT $1,307 $1,533 $ % SUB-TOTAL GENERAL SERVICES $11,711 $12,809 $1, % ROADS - EXCLUDING BRAMWEST/NSTC $13,291 $13,572 $ % ROADS - BRAMWEST NSTC $584 $554 ($30) -5.1% TOTAL CHARGE PER UNIT $25,586 $26,935 $1, %
45 42 TABLE 11 CITY OF BRAMPTON NON-RESIDENTIAL DEVELOPMENT CHARGE PER SQUARE METRE INDUSTRIAL/OFFICE DEVELOPMENT Current Calculated Difference in Industrial and Industrial and Calculated & Current Office Charge Office Charge Charge SERVICE $/sq. m $ % GENERAL GOVERNMENT $0.15 $0.68 $ % LIBRARY SERVICES $0.00 $ FIRE SERVICES $1.61 $1.97 $ % RECREATION SERVICES $0.00 $ PUBLIC WORKS $1.84 $1.99 $ % PARKING $1.14 $0.00 ($1.14) % TRANSIT $4.34 $4.79 $ % SUB-TOTAL GENERAL SERVICES $9.08 $9.43 $ % ROADS - EXCLUDING BRAMWEST/NSTC $38.47 $34.46 ($4.01) -10.4% ROADS - BRAMWEST NSTC $1.66 $1.42 ($0.24) -14.3% TOTAL CHARGE PER SQUARE METRE $49.21 $45.31 ($3.90) -7.9%
46 43 TABLE 12 CITY OF BRAMPTON NON-RESIDENTIAL DEVELOPMENT CHARGE PER SQUARE METRE NON-INDUSTRIAL AND NON-OFFICE DEVELOPMENT Current Non- Calculated Non- Industrial and Industrial and Difference in Non-Office Non-Office Calculated & Current Charge Charge Charge SERVICE $/sq. m $ % GENERAL GOVERNMENT $0.18 $0.68 $ % LIBRARY SERVICES $0.00 $ FIRE SERVICES $1.84 $1.97 $ % RECREATION SERVICES $0.00 $ PUBLIC WORKS $2.11 $1.99 ($0.12) -5.6% PARKING $1.31 $0.00 ($1.31) % TRANSIT $4.97 $4.79 ($0.18) -3.7% SUB-TOTAL GENERAL SERVICES $10.41 $9.43 ($0.98) -9.4% ROADS - EXCLUDING BRAMWEST/NSTC $88.74 $83.82 ($4.92) -5.5% ROADS - BRAMWEST NSTC $4.51 $3.45 ($1.06) -23.5% TOTAL CHARGE PER SQUARE METRE $ $96.70 ($6.96) -6.7%
47 44 VIII LONG-TERM CAPITAL AND OPERATING COSTS This section provides a brief examination of the long-term capital and operating costs for the capital facilities and infrastructure to be included in the development charges by-law. This examination is required as one of the features of the Development Charges Act, A. NET OPERATING COSTS FOR THE CITY S SERVICES ESTIMATED TO INCREASE BY $56.17 MILLION OVER 10 YEARS Table 13 summarizes the estimated increase in net operating costs that the City will experience for additions associated with the planned capital program. These estimates were provided by City Finance based on the 2014 Capital Budget As shown in Table 13, by 2023, the City s net operating costs for general services are estimated to increase by $53.10 million. Significant increases in net operating costs will be experienced as new facilities such as fire stations, community centres and busses are added. Operating and maintenance costs will also increase as additions to the City s road network are made. Page 2 of the table shows that $3.07 million in additional operating costs are anticipated over the first 10 years of the program. B. LONG-TERM CAPITAL FINANCING FROM NON-DEVELOPMENT CHARGE SOURCES FOR GENERAL SERVICES TOTALS $ MILLION Table 13 also summarizes the components of the development-related capital program that will require funding from non-development charge sources as discussed above in Section VI. In total $ million will need to be financed from non-development charge sources over the next ten years for General Services. This includes $ million in interim financing, would be addressed through the City s annual budget process. Because the by-laws must be revisited at least every five years, however, it is difficult to determine the quantum of interim financing that may be required. This also includes $9.15 million in development charges reserves which can offset a portion of the capital program. Appendix E provides a breakdown of the non-development charge financing requirements by service.
48 45 C. LONG-TERM CAPITAL FINANCING FROM NON-DEVELOPMENT CHARGE SOURCES FOR ENGINEERED SERVICES TOTALS $76.25 MILLION TO 2041 Page 2 of Table 13 provides a summary of non-development charges funding for road infrastructure. Most notably, $64.96 million in taxation funding is required for the replacement share of projects. In addition, $11.30 million in development charges reserves are on hand to fund a portion of program.
49 46 TABLE 13 - PAGE 1 CITY OF BRAMPTON SUMMARY OF LONG TERM CAPITAL AND OPERATING COST IMPACTS GENERAL SERVICES ($000) NET OPERATING IMPACTS TOTAL General Government $0.0 $1,883.8 $1,883.8 $1,883.8 $1,883.8 $1,883.8 $1,883.8 $1,883.8 $1,883.8 $1,883.8 n/a Library Services $0.0 $0.0 $0.0 $0.0 $0.0 $0.0 $0.0 $0.0 $0.0 $0.0 n/a Fire Services $15.0 $60.0 $2,780.0 $5,460.0 $10,870.0 $10,920.0 $13,336.0 $13,336.0 $13,336.0 $13,336.0 n/a Recreation $644.7 $3,594.8 $5,036.7 $6,243.9 $6,827.2 $7,410.6 $8,235.6 $8,485.6 $9,060.6 $9,560.6 n/a Transit $1,605.1 $8,227.3 $11,668.9 $13,690.7 $15,712.5 $17,734.3 $19,756.1 $21,777.9 $23,799.7 $25,821.5 n/a Public Works $21.0 $413.0 $1,401.0 $2,289.0 $2,331.0 $2,373.0 $2,415.0 $2,457.0 $2,499.0 $2,499.0 n/a TOTAL OPERATING IMPACTS $2,286 $14,179 $22,770 $29,567 $37,625 $40,322 $45,626 $47,940 $50,579 $53,101 n.a. LONG-TERM CAPITAL IMPACTS GENERAL SERVICES Total Net Cost $189,281.7 $150,463.3 $56,126.3 $59,780.3 $152,365.3 $57,913.4 $81,014.4 $50,879.4 $38,608.4 $67,040.4 $903,472.8 Net Cost From Development Charges $140,883.0 $108,488.5 $26,171.3 $24,747.5 $52,026.0 $29,429.3 $23,806.1 $28,777.7 $25,068.8 $50,635.1 $510,033.7 Net Cost From Non-DC Sources $48,398.6 $41,974.8 $29,954.9 $35,032.7 $100,339.3 $28,484.0 $57,208.2 $22,101.6 $13,539.5 $16,405.2 $393, Discount Portion $9,887.4 $12,577.5 $3,287.2 $3,129.0 $13,721.1 $3,704.6 $4,579.8 $3,632.2 $3,220.1 $6,060.8 $63, Replacement/BTE $6,671.9 $12,045.9 $7,375.9 $7,734.9 $5,350.9 $6,085.9 $13,935.9 $13,510.9 $5,610.9 $5,635.9 $83, Available DC Reserves (1) $3,911.8 $1,905.4 $416.2 $416.2 $416.2 $416.2 $416.2 $416.2 $416.2 $416.2 $9, For Post 2023 Development (2) $27,927.5 $15,445.9 $18,875.7 $23,752.7 $80,851.1 $18,277.3 $38,276.3 $4,542.3 $4,292.3 $4,292.3 $236,533.6 TOTAL LONG-TERM CAPITAL IMPACTS $48,398.6 $41,974.8 $29,954.9 $35,032.7 $100,339.3 $28,484.0 $57,208.2 $22,101.6 $13,539.5 $16,405.2 $393,439.2 TOTAL NET OPERATING & CAPITAL IMPACTS $50,684.5 $56,153.7 $52,725.3 $64,600.2 $137,963.9 $68,805.7 $102,834.7 $70,041.9 $64,118.6 $69,506.1 n.a. Notes: (1) To extent possible costs have been offset by existing DC Reserve Fund Balances. (2) Costs for growth beyond 2023 may be recovered from future DC and therefore may only be an interim financing requirement.
50 47 TABLE 13 - PAGE 2 CITY OF BRAMPTON SUMMARY OF LONG TERM CAPITAL AND OPERATING COST IMPACTS ENGINEERED SERVICES ($000) NET OPERATING IMPACTS TOTAL Roads $1,040.0 $1,131.5 $1,875.5 $2,423.5 $2,626.5 $2,804.5 $2,859.5 $3,006.5 $3,067.5 $3,067.5 n/a TOTAL OPERATING IMPACTS $1,040.0 $1,131.5 $1,875.5 $2,423.5 $2,626.5 $2,804.5 $2,859.5 $3,006.5 $3,067.5 $3,067.5 n.a. LONG-TERM CAPITAL IMPACTS ROADS Total Net Cost $1,442,080.8 Net Cost From Development Charges $1,365,826.3 Net Cost From Non-DC Sources $76, Discount Portion $0.0 - Replacement/BTE $64, Available DC Reserves (1) $11, For Post 2041 Development (2) $0.0 TOTAL LONG-TERM CAPITAL IMPACTS $76,254.4 Notes: (1) To extent possible costs have been offset by existing DC Reserve Fund Balances. (2) Costs for growth beyond 2041 may be recovered from future DC and therefore may only be an interim financing requirement.
51 48 IX DEVELOPMENT CHARGES ADMINISTRATION No significant changes are recommended to the City s current policies and practices regarding development charge administration. In this regard: It is recommended that practices regarding collection of development charges and by-law administration continue to the extent possible. It is further recommended that the collection and administration policies be as consistent as practicable with those of the Regional Municipality of Peel in order to simplify by-law administration and aid understanding for those required to pay the charges. It is recommended that the by-law permit the payment of a development charge in cash or through services in lieu agreements. The municipality is not obligated to enter into services in lieu agreements. As required under the DCA, the City should codify any rules regarding application of the by-laws and exemptions within the development charges bylaws proposed for adoption. It is recommended that no exemptions, other than those required in the Development Charges Act, 1997, be formally adopted in the by-laws. The current non-statutory discount for industrial development is proposed to be eliminated since the calculated rate is lower than the City s current discounted rate. City Staff have proposed that exemptions on portions of places of worship and full service hotels be maintained. City Staff have proposed a change in by-law wording that would waive development charges on the work portion of live-work units It is recommended that the City continue to pursue cost-sharing and uploading with the Regional Municipality of Peel for road-related infrastructure that meets the criteria of Regional significance.
52 49 It is proposed that conservation authorities be removed from the definition of a local board It is recommended that Council adopt a set of Local Service Guidelines that will be presented through a Corporate Report. It is recommended that Council adopt the development-related capital forecast included in this background study, subject to annual review through the City s normal capital budget process.
53 50 APPENDIX A DEVELOPMENT FORECAST
54 51 APPENDIX A RESIDENTIAL AND NON-RESIDENTIAL DEVELOPMENT FORECAST This appendix provides the details of the development forecast used in the preparation of the Development Charges Background Study for the City of Brampton. The development forecast in the development charges background study is based on estimates of growth occurring within approved Official Plan designated urban areas. This forecast is consistent with the population and employment forecasts endorsed by City Council in April 2014 for use in completing the City s 2014 Development Charges By-law update. Historical Activities A.1 Historic Population, Households & Employment A.2 Household Size by Unit Type by Period of Construction Forecast Tables A.3 Population, Household & Employment Forecast Summary A.4 Forecast Population & Household Growth Summary A.5 Households By Unit Type A.6 Household Growth By Unit Type A.7 Persons-per-unit (PPU) in New Units A.8 Forecast Population in New Units A.9 Forecast Employment Growth A.10 Non-Residential Space Forecast The appendix begins with a brief discussion of the forecast key inputs and results in the context of recent development activity. This is followed by more detailed methodological discussions of the residential and non-residential forecast. A. FORECAST KEY INPUTS In preparing updated forecast for the City of Brampton s land use and infrastructure planning needs and Development Charges Background Study, the following were incorporated:
55 52 Amendment 2 to the Growth Plan and its background work contained in Greater Golden Horseshoe Forecasts to 2041, Technical Report, November 2012 and its June 2013 Addendum; Region of Peel and City of Brampton Official Plans 2011 Census data on population and housing; 2011 National Household Survey on housing occupancy (persons per unit) and employment by place of work; City of Brampton Employment Survey to 2013; A full update of the City of Brampton s land use databases including existing and potential housing unit counts and existing and potential employment land development; Changes to new secondary plan areas resulting from revised draft secondary plans and newly submitted block plans. These revisions include: SPA 40 (Bram West); SPA 47 (Highway 427 Industrial); SPA 48 (Sandringham Wellington North) and SPA 51 (Mount Pleasant); An emerging planning framework for the Heritage Heights area as a result of Official Plan Amendment 43 and more work by the land owners on their Heritage Heights Vision Plan prepared in early 2013 B. FORECASTS PROJECT SLIGHTLY LESS GROWTH THAN RECENT ACTIVITY During the 10-year period from 2004 to 2013 the City of Brampton experienced rapid population and employment growth. This growth was fuelled by a strong GTA economy and continued migration into the metropolitan region. Moving forward, Brampton is expected to continue to experience rapid housing growth until its greenfield housing capacity becomes largely exhausted at some point during the 2030s. However, the rate of growth is expected to slow from the levels experienced over the past 10 years. 1. Historical Growth in Population and Housing Units in Brampton Has Been Rapid (Table A.1) Brampton s population and housing growth has well exceeded the GTA average in recent years. Between the 2001 and 2011 Census, the population of the GTA grew by 972,200 people or 19 per cent. During this same period the City of Brampton s population grew by approximately 61 per cent per cent to a 2011 Census value of 523,900.
56 53 Population Growth in Brampton, Peel Region and the GTA Population 2006 Population 2011 Population Population Growth Brampton 325, , , ,500 61% Peel Region 989,000 1,159,500 1,296, ,800 31% GTA 5,081,800 5,556,000 6,054, ,200 19% Note: See Appendix A Table 1 Source: Statistics Canada, 2001, 2006, 2011 Census The number of housing units in Brampton has grown at a lower rate than population; likely as a result of the increase in the average number of persons residing in dwelling units. In contrast to other parts of the GTA, average household sizes in Brampton have grown over the course of the last decade, from an average household size of 3.4 in 2004 to 3.53 in The City of Brampton has experienced stable employment growth over the past decade. In early years the City s employment growth rate slowed from 3.1% per year from 2004 to 2006 to 2% from 2007 to In recent years, however, the growth rate has rebounded to approximately 3.8% in 2012 and Employment Growth in Brampton, Peel Region and the GTA 2002 to Employment 2006 Employment 2011 Employment Employment Growth Brampton 133, , ,120 38,480 29% Peel Region 534, , , ,300 22% GTA 2,732,800 2,965,000 3,109, ,000 14% Note: See Appendix A Table 3 Source: Statistics Canada, 2001, 2006 Census, 2011 Census Over the 10-year period from , the City s employment base increased by 30.6%. Brampton added 43,439 new employees in the period. These figures are slightly higher than the 10-year growth rates for the Census periods, where the City s employment base grew by 28.8%. In the past 10 years, the City of Brampton accommodated 25 per cent of Peel Region s and 10 per cent of the GTA s employment growth during the period.
57 54 2. Brampton Households Have High Occupancy Levels (Table A.2) Occupancy levels for single and semi detached, row and other multiple and apartment units in Brampton by period of construction are provided in Table A.2. In 2011, the average Brampton dwelling contained approximately 3.5 persons, which is significantly higher than the GTA average The values are from the National Household Survey (NHS). The PPU values for each new dwelling type are: Single detached 4.31; Semis 3.87; Rows 3.31; and Apartments These values are forecasted to remain relatively similar over time (see Table A.7). C. RESIDENTIAL FORECAST HAS BEEN UPDATED TO REFLECT THE LATEST AVAILABLE INFORMATION Much of the residential growth forecast is based on the City s Official Plan growth targets and 2011 Census data. In 2013, the Province updated Schedule 3 population and employment targets at the Regional level through Amendment 2 to the Growth Plan for the Greater Golden Horseshoe. The residential growth forecast incorporates 2011 Census data including population and the 2011 National Household Survey for data on occupied dwelling unit types, and average household size by dwelling unit type Hemson has also utilized updates of the City of Brampton s land use databases to supplement the Census and NHS data. D. FORECAST OF RESIDENTIAL UNITS BY STRUCTURE TYPE IS USED TO DISTRIBUTE POPULATION GROWTH IN NEW UNITS The residential unit and population in new units forecast for the City is based on the forecast of three unit structure types: singles and semis; rows and other multiples; and apartments. The population in new units are estimated using person per unit factors. The attached series of tables provide all of the assumptions and results for the forecasts. The purpose of each table and key assumptions are provided in the descriptions below: 1. Forecast of Households and Population (Tables A.3 and A.4) Table A.3 provides a summary of the total City-wide household, population and employment forecast from 2014 to ultimate development. Ultimate development for
58 55 the purposes of this development charges study is Table A.4 details the annual growth of population, housing, population in new units and employment to 2041 The City s Census population is forecast to rise from approximately 557,800 in 2013 to 701,900 in 2023 and to 855,000 at ultimate development (in 2041). This represents respective increases of 26 per cent and 53 per cent when measured against the 2013 population. The City s Census population estimates are slightly lower than the Official Plan targets due to Census undercoverage. This undercoverage is commonly estimated at 4%. Households are forecast to increase from approximately 158,240 in 2013 to 201,405 in 2023 and to 248,326 at ultimate development. These are increases of 27 per cent and 57 per cent respectively. The higher rate of household growth compared to population growth reflects a decline in occupancy levels expected in existing housing units and a significant shift to higher density development with lower persons per unit. The population estimated to reside in the new dwelling units is 162,396 over the 10- year period and 311,666 over the longer period to ultimate development (in 2041). These estimates are based on application of person per unit factors to each dwelling type. The per capita residential development charge rates are calculated based on these estimates. Tables A.5 and A.6 detail housing unit growth for singles and semis, rows and other multiples and apartments. The forecast of residential units by unit type applies an assumption of the mix of development during each of the five year Census periods. In the initial 10-year forecast period from , which applies to soft services, approximately 66 per cent of new housing units are anticipated to be single and semi detached units, 20 per cent rows and other multiples and 13 per cent apartments. This mix is expected to change over the course of the forecast so that over the period about 43 per cent of new housing units are expected to be singles/semis, 19 per cent rows and other multiples and 38 per cent apartments. The higher share of apartment units in the later part of the forecast reflects the shrinking of the City s land supply and a shift towards intensification of existing urban areas within Brampton s Urban Growth Centre. The forecast of population in new units is shown in Tables A.7 and A.8.
59 56 E. NON-RESIDENTIAL SPACE FORECAST BASED ON THE FORECAST OF EMPLOYMENT (TABLES A.9 AND A.10) City-wide non-residential development charges are calculated on a per square metre basis. Therefore, as required by the DCA, a forecast for non-residential building space is provided. Consistent with the residential forecast, the non-residential building space forecast covers a period from 2014 to ultimate development (2041). The 10-year forecast period ( ) is used for soft services and the forecast to ultimate development is used for engineered services (e.g. roads and related). The nonresidential building space used in this study is based on the employment forecast. The forecast of employment in the City is separated into three categories. They are: Population-related employment employment scattered through the community including most retail and institutional employment and home-based employment; Major office employment employment in office buildings of 20,000 square feet or greater; and Employment land employment the mix of commercial and industrial activities occurring in what are typically (but somewhat inaccurately) called industrial areas. The non-residential space forecast prepared for development charges purposes is based on these employment forecasts and described below. 1. Population-Related Employment and Space Forecast In 2013, approximately 80,780 or 44 per cent of the City s 185,570 employees are employed in population-related activities. City-wide population-related employment is forecast to grow by 34 per cent between 2013 and 2023 to a total of 108,410 employees. Growth in the period following 2023 is expected to be modest with total population-related employment increasing to 134,120 at ultimate development. It is estimated that retail and commercial employment represents a majority of the City s current population-related employment. Retail and other commercial jobs are expected to comprise 50 per cent of population-related employment growth throughout the forecast. For converting population-related employment growth to building space a factor of 40 square metre per employee is used. Over the 10-year planning period , about 1.02 million square metre of building space is forecast to be added in this category. Over the period to build-out 2.03 million square metres will be added.
60 57 2. Major Office Employment and Space Forecast In 2013, 13,590 workers or 7 per cent of the City's total employment is employed in the major office category. In the 10-year forecast period Brampton s major office employment is forecast to increase by 83 percent to 24,850 employees. At ultimate development 47,290 employees are forecast to be employed in the major office category. While major office space has a high profile in the community, employment in this category is not a large part of the existing base in Brampton (7.5%). This share of total employment is expected to continue into the future with the development of the City s Urban Growth Centre. A ratio of 27 m 2 per employee is used in the forecast to estimate future major office building space. Approximately 304,000 m 2 of major office space is forecast to be added by By ultimate development about 910,000 m 2 is forecast. 3. Employment Land Forecast Employment within designated employment lands is the largest category of employment in Brampton, and this is expected to remain the case throughout the forecast. Typical operations that occur on employment lands include manufacturing, distribution and smaller offices. In 2013, an estimated 91,200 people, or 49 per cent of the City s total employment, were employed in the employment lands category. With the development of the west Brampton employment area this amount is expected to grow by 30 per cent over the 10-year forecast period from and by 54 per cent to ultimate development. Growth in building space on employment lands is forecast by applying a ratio of 135 m 2 per employee. Approximately 3.65 million m 2 are forecast to be added by 2023 and 6.58 million m 2 are expected to be added by 2041.
61 TABLE A.1 City of Brampton Historic Population, Households & Employment 58 Mid-Year Population Growth Growth % Households Growth Growth % HH Size Employment Growth Growth % Activity Rate , , , % ,661 19, % 102,699 5, % ,820 4, % 40.0% ,062 20, % 108,064 5, % ,131 4, % 38.9% ,670 21, % 113,709 5, % ,577 4, % 37.9% ,558 22, % 119,649 5, % ,162 4, % 36.9% ,800 24, % 125,900 6, % ,890 4, % 35.9% ,486 16, % 130,261 4, % ,009 3, % 35.3% ,814 17, % 134,773 4, % ,190 3, % 34.7% ,808 17, % 139,442 4, % ,435 3, % 34.1% ,495 18, % 144,272 4, % ,744 3, % 33.4% ,900 19, % 149,270 4, % ,120 3, % 32.9% ,300 17, % 153,930 4, % ,730 6, % 33.0% ,800 16, % 158,240 4, % ,570 6, % 33.3% , % 50, % 43, % Source: Statistics Canada, Census of Canada
62 TABLE A.2 Household Size by Unit Type by Period of Construction Geography: Brampton CY ( 26.5%) 59 Period of Construction Pre Pre Total Singles Household Population 2,865 8,190 16,635 25,435 26,345 27,585 18,420 32,675 88,135 55, , , ,240 Households 975 2,890 5,870 8,065 7,655 7,435 4,745 7,960 20,365 13,035 45,595 33,400 78,995 Household Size Semis Household Population 430 1,225 5,785 11,465 2,315 1,420 3,400 10,875 24,980 11,675 36,915 36,655 73,570 Households ,805 3, ,910 6,435 3,035 10,870 9,470 20,340 Household Size Singles & Semis Household Population 3,295 9,415 22,420 36,900 28,660 29,005 21,820 43, ,115 67, , , ,810 Households 1,105 3,275 7,675 11,695 8,320 7,875 5,650 10,870 26,800 16,070 56,465 42,870 99,335 Household Size Rows Household Population 320 1,005 3,590 11,120 4,230 4,275 5,240 7,925 9,580 8,595 37,705 18,175 55,880 Households ,125 3,760 1,290 1,335 1,605 2,495 2,705 2,790 12,045 5,495 17,540 Household Size Apartments (no duplex) - 1BR or Less Household Population ,685 2,635 1,860 1,840 1, ,355 11,185 1,895 13,080 Households ,005 1, ,935 1,245 7,180 Household Size Apartments (no duplex) - 2BR or More Household Population 935 2,655 5,745 13,215 7,230 5,250 3,055 1,785 1,480 2,205 39,870 3,685 43,555 Households ,120 4,475 2,525 2,125 1, ,390 1,505 15,895 Household Size All Apartments (no duplex) Household Population 1,495 3,645 7,675 16,355 9,130 7,245 4,085 2,445 2,040 3,780 52,075 5,820 57,895 Households 645 1,460 3,275 6,225 3,540 3,105 1,720 1, ,965 20,990 2,765 23,755 Household Size Duplex Units Household Population ,435 2,920 4,805 6,655 4,080 4,545 4,945 1,120 25,555 6,065 31,620 Households ,270 1,780 1,070 1,115 1, ,125 1,520 8,645 Household Size All Units Household Population 5,110 14,065 33,685 64,375 42,020 40,525 31,145 53, ,735 80, , , ,585 Households 1,845 5,075 12,075 21,680 13,150 12,315 8,975 14,385 30,305 20,825 89,500 51, ,630 Household Size Source: Statistics Canada, 2011 National Household Survey Special Run.
63 60 TABLE A.3 TABLE A.4 Population, Household & Employment Forecast Summary Forecast Population & Household Growth Summary Population Population Household Household Pop'n in Employment Employment Mid-Year Population Households Employment PPU Activity Rate Mid-Year Growth Growth % Growth Growth % New HHs Growth Growth % , , , % , , , % , , , % , , , % , % 3, % 14,619 6, % , , , % , % 4, % 16,034 7, % , , , % , % 4, % 16,131 7, % , , , % , % 4, % 17,281 6, % , , , % , % 4, % 17,586 6, % , , , % , % 4, % 17,523 6, % , , , % , % 4, % 16,894 6, % , , , % , % 4, % 16,135 6, % , , , % , % 4, % 15,096 5, % , , , % , % 4, % 15,097 5, % , , , % , % 4, % 14,846 5, % , , , % , % 4, % 14,925 5, % , , , % , % 4, % 14,983 5, % , , , % , % 4, % 14,812 5, % , , , % , % 4, % 14,771 5, % , , , % , % 4, % 14,515 5, % , , , % , % 3, % 12,879 4, % , , , % , % 2, % 7,275 3, % , , , % , % 2, % 6,441 3, % , , , % , % 1, % 4,804 2, % , , , % , % 1, % 4,043 2, % , , , % , % 1, % 3,992 2, % , , , % , % 1, % 3,866 2, % , , , % , % 1, % 3,686 2, % , , , % , % 1, % 3,479 2, % , , , % , % 1, % 3,461 3, % , , , % , % 1, % 3,380 3, % , , , % , % 1, % 3,111 2, % , % 43, % 162,396 65, % , % 31, % 109,006 41, % , % 74, % 271, , % , % 15, % 40,263 28, % , % 90, % 311, , %
64 TABLE A.5 TABLE A.6 Households By Unit Type Household Growth By Unit Type 61 Singles Semis Rows Apts Total HHs Singles Semis Rows Apts Total HHs ,005 20,240 17,215 32, , ,955 20,820 17,895 33, , , , ,710 21,700 18,419 33, , , , ,870 22,420 19,094 33, , , , ,120 23,070 19,994 33, , , , ,323 23,629 20,885 34, , , , ,823 24,229 21,785 34, , , , ,273 24,879 22,735 35, , , , ,673 25,529 23,685 36, , , , ,023 26,129 24,585 36, , , , ,254 26,720 25,427 37, , , , ,254 27,300 26,252 38, , , , ,254 27,860 27,077 39, , , , ,204 28,390 27,902 40, , , , ,154 28,920 28,727 40, , , , ,107 29,435 29,552 41, , , , ,007 29,945 30,377 42, , , ,000 4, ,907 30,445 31,202 43, , , ,000 4, ,807 30,945 31,952 44, , , ,000 4, ,407 31,395 32,652 45, , , ,000 3, ,895 31,793 33,139 46, , ,018 2, ,395 32,068 33,489 47, , ,040 2, ,620 32,218 33,839 49, , ,045 1, ,720 32,308 34,189 50, , ,045 1, ,810 32,398 34,539 51, , ,040 1, ,892 32,479 34,873 52, , ,035 1, ,972 32,554 35,173 53, , ,020 1, ,052 32,624 35,423 54, , ,010 1, ,132 32,694 35,673 55, , ,000 1, ,202 32,764 35,923 56, , , ,270 32,831 36,120 57, , ,276
65 62 TABLE A.7 TABLE A.8 PPU in New Units Population in New Units Total Pop Singles Semis Rows Apts Total HHs Singles Semis Rows Apts In New Units ,354 2,812 2, , ,756 2,546 3, , ,561 2,197 3,070 1,303 16, ,821 2,351 3,092 1,017 17, ,573 2,540 3,255 1,217 17, ,327 2,534 3,246 1,417 17, ,082 2,332 3,067 1,413 16, ,545 2,289 2,862 1,439 16, ,541 2,246 2,800 1,509 15, ,528 2,165 2,796 1,607 15, ,302 2,047 2,793 1,705 14, ,289 2,044 2,789 1,803 14, ,287 1,985 2,784 1,927 14, ,062 1,964 2,785 2,000 14, ,061 1,925 2,785 2,000 14, ,059 1,925 2,531 1,999 14, ,785 1,732 2,362 1,999 12, ,068 1,530 1,644 2,034 7, ,122 1,059 1,181 2,079 6, ,182 2,089 4, ,182 2,090 4, ,182 2,080 3, ,130 2,071 3, ,014 2,042 3, ,023 3, ,003 3, ,964 3, ,893 3, ,088 24,013 29,551 11, , ,914 15,152 20,473 15, , ,002 39,165 50,024 27, , ,847 4,007 10,075 20,334 40, ,849 43,172 60,099 47, ,666
66 TABLE A.9 Forecast Employment Growth 63 Employment Growth Major Growth Population- Growth Total Growth Year Land % Office % Related % % , % 13, % 80, % 185, % , % 14, % 83, % 192, % , % 15, % 86, % 199, % , % 16, % 89, % 206, % , % 17, % 92, % 213, % , % 19, % 95, % 220, % , % 20, % 98, % 227, % , % 21, % 101, % 233, % , % 22, % 104, % 240, % , % 23, % 106, % 245, % , % 24, % 108, % 251, % , % 25, % 110, % 257, % , % 26, % 112, % 262, % , % 28, % 114, % 268, % , % 29, % 116, % 274, % , % 30, % 119, % 279, % , % 31, % 121, % 284, % , % 32, % 123, % 289, % , % 33, % 124, % 292, % , % 35, % 125, % 296, % , % 36, % 126, % 299, % , % 37, % 127, % 301, % , % 38, % 128, % 304, % , % 39, % 128, % 306, % , % 41, % 130, % 309, % , % 42, % 131, % 312, % , % 44, % 132, % 315, % , % 45, % 133, % 318, % , % 47, % 134, % 321, % , % 11, % 27, % 65, % , % 8, % 16, % 41, % , % 20, % 44, % 107, % , % 13, % 9, % 28, % , % 33, % 53, % 135, %
67 TABLE A.10 Non-Residential Space Forecast 64 Employment Land Major Office Population-Related Total Year Empl Growth Space (m 2 ) Empl Growth Space (m 2 ) Empl Growth Space (m 2 ) Empl Growth Space (m 2 ) , ,000 1,000 27,000 2,600 90,100 6, , , ,500 1,000 27,000 2, ,600 7, , , ,250 1,080 29,160 2, ,600 7, , , ,500 1,200 32,400 3,020 98,400 6, , , ,500 1,230 33,210 3,070 86,900 6, , , ,750 1,200 32,400 3, ,700 6, , , ,050 1,200 32,400 2, ,500 6, , , ,650 1,200 32,400 2, ,000 6, , , ,000 1,100 29,700 2,090 82,600 5, , , ,500 1,050 28,350 2,110 83,000 5, , , ,000 1,050 28,350 2,050 81,400 5, , , ,000 1,050 28,350 2,090 82,600 5, , , ,100 1,090 29,430 2,090 82,600 5, , , ,500 1,100 29,700 2,340 92,400 5, , , ,500 1,150 31,050 2,360 93,200 5, , , ,000 1,150 31,050 2,280 90,500 5, , , ,000 1,170 31,590 2,060 81,400 4, , , ,400 1,200 32,400 1,220 48,200 3, , , ,000 1,200 32,400 1,030 40,700 3, , ,750 1,200 32, ,800 2, , ,000 1,200 32, ,400 2, , ,500 1,200 32, ,400 2, , ,150 1,270 34, ,700 2, , ,750 1,300 35,100 1,120 44,200 2, , ,750 1,400 37,800 1,050 41,500 2, , ,750 1,600 43,200 1,040 41,500 3, , ,050 1,600 43,200 1,050 41,500 3, , ,350 1,510 40, ,900 2, , ,020 3,647,700 11, ,020 27,630 1,015,400 65,910 4,967, ,900 2,146,500 8, ,920 16, ,300 41,350 3,040, , ,050 13, ,960 9, ,600 28,530 1,515, ,750 6,581,250 33, ,900 53,340 2,032, ,790 9,523,450
68 65 APPENDIX B GENERAL SERVICES TECHNICAL APPENDIX
69 66 GENERAL SERVICES TECHNICAL APPENDICES INTRODUCTION AND OVERVIEW The following seven appendices provide the detailed analysis undertaken to establish the development charge rates for each of the general services in the City of Brampton: Appendix B.1 General Government Appendix B.2 Library Services Appendix B.3 Fire Services Appendix B.4 Recreation Services Appendix B.5 Public Works: Buildings & Fleet Appendix B.6 Parking Appendix B.7 Transit Every appendix contains a set of three tables. The tables provide the background data and analysis undertaken to arrive at the calculated development charge rates for that particular service. An overview of the content and purpose of each of the tables is given below. TABLE 1 HISTORIC SERVICE LEVELS Table 1 presents the data used to determine the 10-year historic service level. The DCA and Ontario Regulation 82/98 require that development charges be set at a level no higher than the average service level provided in the municipality over the 10-year period immediately preceding the preparation of the background study, on a service by service basis. For the purpose of this study, the historic inventory period is defined as O. Reg. 82/98 requires that, when defining and determining historic service levels, both the quantity and quality of service be taken into consideration. In most cases, the service levels are initially established in quantitative terms. For example, service levels for buildings are presented in terms of square feet. The qualitative aspect is introduced
70 67 by considering the monetary value of the facility or service. In the case of buildings, for example, the cost would be shown in terms of cost per square foot to replace or construct a facility of the same quality. This approach helps to ensure that the development-related capital facilities that are to be funded by new growth reflect, not only the quantity (number and size), but also the quality (replacement value or cost) of service provided by the municipality in the past. Both the quantitative and qualitative aspects of service levels used in the current analysis are based on information provided by City staff in consultation with Hemson. This information is generally based on historical records and experience with costs to acquire or construct similar facilities, equipment and infrastructure. Table 1 also shows the calculation of the maximum allowable funding envelope, net of uncommitted excess capacity and the legislated ten per cent reduction (for all applicable services). The maximum allowable is defined as the 10-year historic service level (expressed as either $/capita, $/household or $/population & employment) multiplied by the forecast increase in net population growth, net household growth, or net population and employment growth, over the future planning period. The resulting figure is the value of capital infrastructure that would have to be constructed for that particular service so that the 10-year historic service level is maintained. There is also a requirement in the DCA to consider excess capacity within the City s existing infrastructure that may be available to partially meet the future servicing requirements. If Council has expressed its intent, before or at the time the capacity was created, to recoup the cost of providing the capacity from new development, it is considered committed excess capacity under the DCA, and the associated capital cost is eligible for recovery. Should notional uncommitted excess capacity exist, if it is determined to be available to service new development, appropriate adjustments are made to the calculations. TABLE PROVISIONAL DEVELOPMENT-RELATED CAPITAL BUDGET AND CALCULATION OF THE UNADJUSTED DEVELOPMENT CHARGES In order to impose a development charge, it is not sufficient to merely base the charge on historic service levels. The DCA requires that Council express its intent to provide future capital facilities to support future growth. Based on the growth forecasts presented in Appendix A, City staff, in collaboration with consultants, have
71 68 developed a development-related capital forecast which sets out the projects required to service anticipated growth for the 10-year period from To determine the share of the program that is eligible for recovery through development charges, the project costs are reduced by any anticipated grants, subsidies or other recoveries, replacement shares and benefit to existing shares, and the legislated 10 per cent reduction for any eligible service. A replacement share occurs when a new facility will, at least in part, replace a facility that is demolished, redeployed or will otherwise not be available to serve its former function. The replacement share of the capital program is not deemed to be development-related and is therefore removed from the development charge calculation. The capital cost for replacement will require funding from nondevelopment charge sources, typically property taxes. When calculating development charges, the development-related net capital cost must be reduced by 10 per cent for all services except fire services and engineered services (DCA s.5.(1)8.). The 10 per cent discount is therefore applied to all general services considered in this appendix with the exception of Fire Services and Public Works: Buildings and Fleet. As with replacement shares, the 10 per cent mandatory reduction must be funded from non-development charge sources. The capital program less any replacement shares or benefit to existing shares, 10 per cent discounts, yields the development-related costs. Although deemed developmentrelated, not all of the net development-related capital program may be recoverable from development charges in the period from For some services, reserve fund balances may be available to fund a share of the program. In addition, for some services, a portion of the capital program may service growth occurring after This portion of the capital program is deemed pre-built service capacity and is considered as committed excess capacity to be recovered under future development charges. The capital costs associated with pre-built service capacity are also removed from the development charge calculation. The remaining portion of the net capital program represents the development-related cost that may be included in the development charge. In all cases, as required, this amount is equal to or less than the maximum allowable capital amount as calculated
72 69 at the end of Table 1. The result is the discounted development-related net capital costs eligible for recovery against growth over the forecast period from Calculation of the Unadjusted Development Charges Rates The section below the capital program displays the calculation of the unadjusted development charge rates. The term unadjusted development charge is used to distinguish the charge that is calculated prior to cash flow financing considerations. The cash flow analysis is shown in Table 3. The first step in determining the unadjusted development charge rate is to allocate the development-related net capital cost between the residential and non-residential sectors. For General Government, Fire Services, Public Works, Parking and Transit, the development-related costs have been apportioned as 71 per cent residential and 29 per cent non-residential. This apportionment is based on the anticipated shares of population in new units and employment growth over the 10-year forecast period. The development-related costs associated with the Library Services and Recreation Services have been allocated 100 per cent to the residential sector, as the need for these services is generally driven by residential development. The residential share of the DC eligible costs are then divided by the forecast population growth in new units. This gives the unadjusted residential development charge per capita. The non-residential development-related net capital costs are divided by the forecast increase in non-residential gross floor area (GFA). This yields a charge per square metre of new non-residential development. TABLE 3 CASH FLOW ANALYSIS A cash flow analysis is also undertaken to account for the timing of projects and receipt of development charges. Interest earnings or borrowing costs, therefore, are accounted for in the calculation as allowed under the DCA. Based on the growth forecast, the analysis calculates the development charge rate required to finance the net development-related capital spending plan, including provisions for any borrowing costs or interest earnings on the reserve funds. The cash flow analysis is designed so that the closing cash balance at the end of the planning period is as close to nil as possible.
73 70 In order to determine appropriate development charge rates reflecting borrowing and earnings necessary to support the net development-related funding requirement, assumptions are used for the inflation rate and interest rate. An inflation rate of 2 per cent is used for the funding requirements, an interest rate of 5.5 per cent is used for borrowing on the funds, and an interest rate of 3.5 per cent is applied to positive balances. Table 3 displays the results of the cash flow analysis and provides the adjusted or final per capita residential and per square metre (of GFA) non-residential development charges.
74 71 APPENDIX B.1 GENERAL GOVERNMENT
75 72 APPENDIX B.1 GENERAL GOVERNMENT The DCA allows the cost of development-related studies and other general government functions to be included in the calculation of the development charges, as long as they are permitted under the legislation. Consistent with s. 5 (1) 7 of the DCA, the eligible development-related net capital cost for the provision of studies and permitted general government expenditures is reduced by 10 per cent in calculating the development charges. TABLE 1 HISTORIC SERVICE LEVELS General Government service consists of two components, general government services relating to buildings (e.g. animal control, courthouse) and fleet; and general government service for development-related studies. General Government services for buildings in Brampton are currently provided out of two City owned facilities valued at $19.91 million. The land associated with this space totals 4.16 acres and is valued at $4.79 million. Materials and equipment are valued at $529,100. Fleet and maintenance equipment add another $2.34 million to the value of the inventory. The replacement value of the 2013 inventory of capital assets for General Government is $27.57 million and the average historic service level over 10 years is $42.34 per population and employment. The historic service level, multiplied by the ten-year forecast of net population and employment growth, results in a ten-year maximum allowable funding envelope of $8.89 million (210,010 net population and employment growth x historic service level of $42.34/population and employment). No uncommitted excess capacity has been identified in this service. The general government funding envelope must be reduced by ten per cent as required under the DCA. The resulting net maximum allowable funding envelope brought forward to the development charges calculation is reduced to $8.00 million. The historic service level cap does not apply to development-related studies.
76 73 TABLE PROVISIONAL DEVELOPMENT-RELATED CAPITAL BUDGET AND CALCULATION OF THE UNADJUSTED DEVELOPMENT CHARGES As shown on Table 2, the development-related gross cost for general government is $16.60 million. The most significant project in the capital program relates to the construction of a new Animal Shelter planned for 2015 for a total cost of $10.00 million. The capital program also provides for various planning studies, including the completion of the 2014 Development Charges Background Study and two additional DC studies, annual funding for a Peel Climate Change Strategy, secondary plan reviews, growth management program support and enhancement studies, as well as other various development-related studies. Recognizing that not all projects under this service are entirely a result of new growth in the City, benefit to existing shares have been netted off the total cost. These shares amount to $1.61 million, which will not be recovered through development charges. The legislated ten per cent discount totals $1.50 million. The funds that are available in the DC reserves amount to $1.85 million, and are used to help offset the cost of the program. Post-period benefit shares in the amount of $968,700 have been identified for this service and will be eligible for recovery in future development charge studies. The remaining $10.67 million is eligible for development charges funding in the 10- year forecast planning period. This amount is included in the development charge calculation and is allocated 71 per cent, or $7.57 million to the residential sector and 29 per cent, or $3.09 million to the non-residential sector based on shares of 10-year growth in population in new units and employment. The resulting unadjusted per capita residential charge is $46.63 before cash flow adjustments. The non-residential unadjusted charge is $0.62 per square metre. TABLE 3 CASH FLOW ANALYSIS After cash flow consideration, the residential charge increases to $50.95 per capita and the non-residential charge increases to $0.68 per square metre.
77 74 GENERAL GOVERNMENT SUMMARY 10-year Hist. Service Level Development-Related Capital Program ($000's) Unadjusted Development Charge Adjusted Development Charge $/pop & emp Total Net DC Recoverable $/capita $/sq.m $/capita $/sq.m $42.34 $16,600 $10,667 $46.63 $0.62 $50.95 $0.68
78 75 APPENDIX B.1 TABLE 1 - PAGE 1 GENERAL GOVERNMENT INVENTORY OF CAPITAL ASSETS BUILDINGS # of Square Feet UNIT COST Facility Name ($/sq.ft) Court House 58,488 58,488 58,488 58,488 58,488 58,488 58,488 58,488 58,488 58,488 $300 Animal Shelter $2,361.0 $2,361.0 $2,361.0 $2,361.0 $2,361.0 $2,361.0 $2,361.0 $2,361.0 $2,361.0 $2,361.0 Total (#) 58,488 58,488 58,488 58,488 58,488 58,488 58,488 58,488 58,488 58,488 Total ($000) $19,907.4 $19,907.4 $19,907.4 $19,907.4 $19,907.4 $19,907.4 $19,907.4 $19,907.4 $19,907.4 $19,907.4 LAND # of Acres UNIT COST Facility Name ($/acre) Court House $1,500,000 Animal Shelter $850,000 Total (acres) Total ($000) $4,790.5 $4,790.5 $4,790.5 $4,790.5 $4,790.5 $4,790.5 $4,790.5 $4,790.5 $4,790.5 $4,790.5 MATERIALS AND EQUIPMENT Total Value of Materials and Equipment ($000) Description Court House $497.5 $497.5 $497.5 $497.5 $497.5 $497.5 $497.5 $497.5 $497.5 $497.5 Animal Shelter $31.6 $31.6 $31.6 $31.6 $31.6 $31.6 $31.6 $31.6 $31.6 $31.6 Total ($000) $529.1 $529.1 $529.1 $529.1 $529.1 $529.1 $529.1 $529.1 $529.1 $529.1
79 APPENDIX B.1 TABLE 1 - PAGE 2 76 GENERAL GOVERNMENT INVENTORY OF CAPITAL ASSETS OTHER DEPT. FLEET & MAINTENANCE EQUIPMENT (#) # of Vehicles or Pieces of Equipment UNIT COST City-Owned Items ($/Item) CAR, STATION WAGONS $40,478 COMPACT PICKUPS $25,667 COMPACT 4X $38,414 3/4 & 1 TON PICKUP $54,028 3/4 & 1 TON 4X4 PICKUPS $47,810 COMPACT VANS $26,150 3/4 & 1 TON VANS $50,700 TRAILER $19,048 SIDEWALK PLOWS AND SKID STEER LOADERS $99,143 TURF EQUIPMENT MOWERS, TRIMMERS, GATORS $36,446 SPECIALTY EQUIPMENT NOT CLASSIFIED $65,959 Sub-total (#) Sub-total ($000) $352.9 $253.8 $356.2 $2,083.9 $2,177.7 $2,357.5 $2,170.2 $2,091.3 $2,648.5 $2,331.3 OTHER DEPT. FLEET & MAINTENANCE EQUIPMENT (#) # of Vehicles or Pieces of Equipment UNIT COST Percentage of Year Rented Items ($/Item) Rented (%) CAR, STATION WAGONS $3,412 33% COMPACT PICKUPS $5,124 54% COMPACT 4X $4,713 47% Sub-total (#) Sub-total City's Share ($000) $20.8 $20.8 $20.8 $20.8 $20.8 $20.8 $11.3 $11.3 $7.9 $9.6 Total General Government Fleet (#) Total General Government Fleet ($000) $373.7 $274.6 $377.0 $2,104.7 $2,198.5 $2,378.3 $2,181.5 $2,102.6 $2,656.4 $2,340.9
80 77 APPENDIX B.1 TABLE 1 - PAGE 3 GENERAL GOVERNMENT SERVICE LEVEL ANALYSIS Historic Population 386, , , , , , , , , ,800 Historic Employment 146, , , , , , , , , ,570 Total Historic Population & Employment 533, , , , , , , , , ,370 INVENTORY SUMMARY ($000) Buildings $19,907.4 $19,907.4 $19,907.4 $19,907.4 $19,907.4 $19,907.4 $19,907.4 $19,907.4 $19,907.4 $19,907.4 Land $4,790.5 $4,790.5 $4,790.5 $4,790.5 $4,790.5 $4,790.5 $4,790.5 $4,790.5 $4,790.5 $4,790.5 Materials $529.1 $529.1 $529.1 $529.1 $529.1 $529.1 $529.1 $529.1 $529.1 $529.1 General Government Fleet $373.7 $274.6 $377.0 $2,104.7 $2,198.5 $2,378.3 $2,181.5 $2,102.6 $2,656.4 $2,340.9 Total ($000) $25,600.8 $25,501.6 $25,604.0 $27,331.7 $27,425.5 $27,605.3 $27,408.5 $27,329.6 $27,883.4 $27,568.0 SERVICE LEVELS ($/pop & employ) Average Service Level Buildings $37.33 $35.50 $33.76 $32.66 $31.60 $30.57 $29.57 $28.60 $27.65 $26.78 $31.40 Land $8.98 $8.54 $8.12 $7.86 $7.60 $7.36 $7.12 $6.88 $6.65 $6.44 $7.56 Materials $0.99 $0.94 $0.90 $0.87 $0.84 $0.81 $0.79 $0.76 $0.73 $0.71 $0.83 General Government Fleet $0.70 $0.49 $0.64 $3.45 $3.49 $3.65 $3.24 $3.02 $3.69 $3.15 $2.55 Total ($/pop & employ) $48.00 $45.47 $43.42 $44.84 $43.53 $42.39 $40.72 $39.26 $38.72 $37.08 $42.34 CALCULATION OF MAXIMUM ALLOWABLE GENERAL GOVERNMENT 10-Year Funding Envelope Calculation Excess Capacity Calculation 10 Year Average Service Level $42.34 Total Value of Inventory in 2013 $27,567,963 Net Population & Employment Growth ,010 Inventory Using Average Service Level $31,474,286 Maximum Allowable Funding Envelope 8,891,823 Excess Capacity $0 Less: Uncommitted Excess Capacity $0 Excess Capacity: Uncommitted Less: 10% Legislated Reduction $889,182 Discounted Maximum Allowable Funding Envelope $8,002,641
81 78 APPENDIX B-1 TABLE 2 CITY OF BRAMPTON 2014 DEVELOPMENT CHARGES BACKGROUND STUDY DEVELOPMENT-RELATED CAPITAL PROGRAM Gross Grants/ Net Ineligible Cost Total DC Eligible Costs Service Project Description Timing Project Subsidies/Other Municipal Replacement 10% DC Eligble Available DC Post Cost Recoveries Cost and BTE Share Reduction Costs Reserves GENERAL GOVERNMENT 1.1 Buildings and Fleet New Vehicles and Equipment various $ 414,111 $ - $ 414,111 $ - $ 41,411 $ 372,700 $ 74,540 $ 298,160 $ Recovery of Oversized Courthouse Share 2014 $ 322,900 $ - $ 322,900 $ - $ 32,290 $ 290,610 $ 290,610 $ - $ Recovery of Oversized Courthouse Share 2015 $ 322,900 $ - $ 322,900 $ - $ 32,290 $ 290,610 $ 290,610 $ - $ Animal Shelter 2015 $ 10,000,000 $ - $ 10,000,000 $ - $ 1,000,000 $ 9,000,000 $ 1,198,648 $ 7,704,481 $ 96, Recovery of Oversized Courthouse Share 2016 $ 322,900 $ - $ 322,900 $ - $ 32,290 $ 290,610 $ - $ - $ 290, Recovery of Oversized Courthouse Share 2017 $ 322,900 $ - $ 322,900 $ - $ 32,290 $ 290,610 $ - $ - $ 290, Recovery of Oversized Courthouse Share 2018 $ 322,900 $ - $ 322,900 $ - $ 32,290 $ 290,610 $ - $ - $ 290,610 $ 12,028,611 $ - $ 12,028,611 $ - $ 1,202,861 $ 10,825,750 $ 1,854,408 $ 8,002,641 $ 968, Development-Related Studies Natural Heritage Inventory 2014 $ 71,000 $ - $ 71,000 $ 36,000 $ 3,500 $ 31,500 $ - $ 31,500 $ Development Charges Study 2014 $ 100,000 $ - $ 100,000 $ - $ 10,000 $ 90,000 $ - $ 90,000 $ Central Area Study 2015 $ 150,000 $ - $ 150,000 $ 75,000 $ 7,500 $ 67,500 $ - $ 67,500 $ Growth Management Program Support and Enhancement 2015 $ 50,000 $ - $ 50,000 $ 25,000 $ 2,500 $ 22,500 $ - $ 22,500 $ Miscellaneous Planning Studies 2015 $ 200,000 $ - $ 200,000 $ 100,000 $ 10,000 $ 90,000 $ - $ 90,000 $ Peel Climate Change Strategy 2015 $ 100,000 $ - $ 100,000 $ 50,000 $ 5,000 $ 45,000 $ - $ 45,000 $ Secondary Plan Reviews 2015 $ 50,000 $ - $ 50,000 $ - $ 5,000 $ 45,000 $ - $ 45,000 $ Growth Management Program Support and Enhancement 2016 $ 50,000 $ - $ 50,000 $ 25,000 $ 2,500 $ 22,500 $ - $ 22,500 $ Miscellaneous Planning Studies 2016 $ 200,000 $ - $ 200,000 $ 100,000 $ 10,000 $ 90,000 $ - $ 90,000 $ Peel Climate Change Strategy 2016 $ 100,000 $ - $ 100,000 $ 50,000 $ 5,000 $ 45,000 $ - $ 45,000 $ Secondary Plan Reviews 2016 $ 50,000 $ - $ 50,000 $ - $ 5,000 $ 45,000 $ - $ 45,000 $ Growth Management Program Support and Enhancement 2017 $ 50,000 $ - $ 50,000 $ 25,000 $ 2,500 $ 22,500 $ - $ 22,500 $ Miscellaneous Planning Studies 2017 $ 200,000 $ - $ 200,000 $ 100,000 $ 10,000 $ 90,000 $ - $ 90,000 $ Peel Climate Change Strategy 2017 $ 100,000 $ - $ 100,000 $ 50,000 $ 5,000 $ 45,000 $ - $ 45,000 $ Secondary Plan Reviews 2017 $ 50,000 $ - $ 50,000 $ - $ 5,000 $ 45,000 $ - $ 45,000 $ Growth Management Program Support and Enhancement 2018 $ 50,000 $ - $ 50,000 $ 25,000 $ 2,500 $ 22,500 $ - $ 22,500 $ Miscellaneous Planning Studies 2018 $ 200,000 $ - $ 200,000 $ 100,000 $ 10,000 $ 90,000 $ - $ 90,000 $ Peel Climate Change Strategy 2018 $ 100,000 $ - $ 100,000 $ 50,000 $ 5,000 $ 45,000 $ - $ 45,000 $ Secondary Plan Reviews 2018 $ 50,000 $ - $ 50,000 $ - $ 5,000 $ 45,000 $ - $ 45,000 $ Development Charges Study 2018 $ 425,000 $ - $ 425,000 $ - $ 42,500 $ 382,500 $ - $ 382,500 $ Miscellaneous Planning Studies 2019 $ 200,000 $ - $ 200,000 $ 100,000 $ 10,000 $ 90,000 $ - $ 90,000 $ Peel Climate Change Strategy 2019 $ 100,000 $ - $ 100,000 $ 50,000 $ 5,000 $ 45,000 $ - $ 45,000 $ Secondary Plan Reviews 2019 $ 50,000 $ - $ 50,000 $ - $ 5,000 $ 45,000 $ - $ 45,000 $ Growth Management Program Support and Enhancement 2019 $ 50,000 $ - $ 50,000 $ 25,000 $ 2,500 $ 22,500 $ - $ 22,500 $ Central Area Study 2020 $ 100,000 $ - $ 100,000 $ 50,000 $ 5,000 $ 45,000 $ - $ 45,000 $ Growth Management Program Support and Enhancement 2020 $ 50,000 $ - $ 50,000 $ 25,000 $ 2,500 $ 22,500 $ - $ 22,500 $ Miscellaneous Planning Studies 2020 $ 200,000 $ - $ 200,000 $ 100,000 $ 10,000 $ 90,000 $ - $ 90,000 $ Peel Climate Change Strategy 2020 $ 100,000 $ - $ 100,000 $ 50,000 $ 5,000 $ 45,000 $ - $ 45,000 $ Secondary Plan Reviews 2020 $ 50,000 $ - $ 50,000 $ - $ 5,000 $ 45,000 $ - $ 45,000 $ Central Area Study 2021 $ 100,000 $ - $ 100,000 $ 50,000 $ 5,000 $ 45,000 $ - $ 45,000 $ Growth Management Program Support and Enhancement 2021 $ 50,000 $ - $ 50,000 $ 25,000 $ 2,500 $ 22,500 $ - $ 22,500 $ Miscellaneous Planning Studies 2021 $ 200,000 $ - $ 200,000 $ 100,000 $ 10,000 $ 90,000 $ - $ 90,000 $ Peel Climate Change Strategy 2021 $ 100,000 $ - $ 100,000 $ 50,000 $ 5,000 $ 45,000 $ - $ 45,000 $ Secondary Plan Reviews 2021 $ 50,000 $ - $ 50,000 $ - $ 5,000 $ 45,000 $ - $ 45,000 $ Growth Management Program Support and Enhancement 2022 $ 50,000 $ - $ 50,000 $ 25,000 $ 2,500 $ 22,500 $ - $ 22,500 $ Miscellaneous Planning Studies 2022 $ 200,000 $ - $ 200,000 $ 100,000 $ 10,000 $ 90,000 $ - $ 90,000 $ Peel Climate Change Strategy 2022 $ 100,000 $ - $ 100,000 $ 50,000 $ 5,000 $ 45,000 $ - $ 45,000 $ Secondary Plan Reviews 2022 $ 50,000 $ - $ 50,000 $ - $ 5,000 $ 45,000 $ - $ 45,000 $ Development Charges Study 2023 $ 425,000 $ - $ 425,000 $ - $ 42,500 $ 382,500 $ - $ 382,500 $ - $ 4,571,000 $ - $ 4,571,000 $ 1,611,000 $ 296,000 $ 2,664,000 $ - $ 2,664,000 $ - TOTAL GENERAL GOVERNMENT $ 16,599,611 $ - $ 16,599,611 $ 1,611,000 $ 1,498,861 $ 13,489,750 $ 1,854,408 $ 10,666,641 $ 968,701 Residential Development Charge Calculation Residential Share of DC Eligible Costs 71.0% $7,573, Net Funding Envelope for Facilities $8,002, Year Growth in Population in New Units 162,396 Unadjusted Development Charge Per Capita ($) $46.63 Reserve Fund Balance $1,854,408 Non-Residential Development Charge Calculation Non-Residential Share of DC Eligible Costs 29.0% $ 3,093, Year Growth in Square Meters 4,967,120 Unadjusted Development Charge Per Sq.M ($) $0.62
82 79 APPENDIX B.1 TABLE 3 - PAGE 1 CITY OF BRAMPTON CASHFLOW AND DETERMINATION OF DEVELOPMENT CHARGE GENERAL GOVERNMENT RESIDENTIAL DEVELOPMENT CHARGE 1.00 GENERAL GOVERNMENT OPENING CASH BALANCE FROM APPLICABLE RESERVES TOTAL OPENING CASH BALANCE ($000) (4,428.7) (3,976.8) (3,422.9) (3,105.0) (2,458.2) (1,832.6) (1,202.7) (548.5) RESIDENTIAL FUNDING REQUIREMENTS 1.00 General Government : Non Inflated $ $5, $ $ $ $ $ $ $ $ $7, General Government: Inflated $ $5, $ $ $ $ $ $ $ $ $7, POPULATION GROWTH - Population in New Units 14,619 16,034 16,131 17,281 17,586 17,523 16,894 16,135 15,096 15, ,396 REVENUE - current ($000) - Dev. Charge Receipts $9, Interest on Opening Balance (243.6) (218.7) (188.3) (170.8) (135.2) (100.8) (66.1) (30.2) ($1,130.95) - Interest on In-year Transactions (excl.int.) 11.2 (136.5) ($29.32) TOTAL REVENUE $7, CLOSING CASH BALANCE (4,428.7) (3,976.8) (3,422.9) (3,105.0) (2,458.2) (1,832.6) (1,202.7) (548.5) Adjusted Charge Per Capita $50.95 Allocation of Capital Program Residential Sector 71.0% Non-Residential Sector 29.0% Rates for 2014 Inflation Rate 2.0% Interest Rate on Positive Balances 3.5% Interest Rate on Negative Balances 5.5%
83 80 APPENDIX B.1 TABLE 3 - PAGE 2 CITY OF BRAMPTON CASHFLOW AND DETERMINATION OF DEVELOPMENT CHARGE GENERAL GOVERNMENT NON-RESIDENTIAL DEVELOPMENT CHARGE 1.00 GENERAL GOVERNMENT OPENING CASH BALANCE FROM APPLICABLE RESERVES TOTAL OPENING CASH BALANCE ($000) $0.00 $ ($1,667.36) ($1,423.69) ($1,211.09) ($1,131.38) ($898.92) ($668.92) ($429.34) ($179.59) NON-RESIDENTIAL FUNDING REQUIREMENTS 1.00 General Government : Non Inflated $43.88 $2, $67.37 $67.37 $ $67.37 $80.42 $80.42 $67.37 $ $3, General Government: Inflated $43.88 $2, $70.09 $71.50 $ $74.38 $90.57 $92.38 $78.94 $ $3, NON-RESIDENTIAL GROWTH - Sq. Metres in New Buildings 549, , , , , , , , , ,850 4,967,120 REVENUE - current ($000) - Dev. Charge Receipts $3, Interest on Opening Balance (91.7) (78.3) (66.6) (62.2) (49.4) (36.8) (23.6) (9.9) ($406.83) - Interest on In-year Transactions (excl.int.) 5.8 (53.9) ($11.65) TOTAL REVENUE $3, CLOSING CASH BALANCE (1,667.4) (1,423.7) (1,211.1) (1,131.4) (898.9) (668.9) (429.3) (179.6) 36.3 Allocation of Capital Program 2014 Adjusted Charge Per Capita $0.68 Residential Sector 71.0% Non-Residential Sector 29.0% Rates for 2014 Inflation Rate: 2.0% Interest Rate on Positive Balances 3.5% Interest Rate on Negative Balances 5.5%
84 81 APPENDIX B.2 LIBRARY SERVICES
85 82 APPENDIX B.2 LIBRARY SERVICES The Brampton Public Library is responsible for the provision of library services in the City of Brampton. Brampton Library offers a variety of programming and servicing, including special programs for adults, seniors, teens and children. In 2013, the Library operated out of seven branches throughout the City and the Library expects to expand its service over the next 10 years. TABLE 1 HISTORIC SERVICE LEVELS The total space used to provide Library Services in Brampton totals 184,700 square feet in 2013 with a replacement value of $69.69 million. The land associated with this space totals acres and is valued at $12.80 million. Materials total $16.87 million and furniture and equipment add another $7.79 million to the value of the inventory. Personal computer related equipment is excluded in this total as required by the DCA. The replacement value of the 2013 inventory of capital assets for Library Services is $ million, and the average historic service level over 10 years is $ per capita. The historic service level multiplied by the ten-year forecast of net population growth results in a ten-year maximum allowable funding envelope of $24.39 million (144,100 net population growth x historic service level of $169.26/capita). Finally, the Library Services funding envelope must be reduced by ten per cent as required under the DCA. The resulting net maximum allowable funding envelope brought forward to the development charges calculation is reduced to $21.95 million. TABLE PROVISIONAL DEVELOPMENT-RELATED CAPITAL BUDGET & CALCULATION OF THE UNADJUSTED DEVELOPMENT CHARGES The first project in Library Services capital program is for the recovery of the negative reserve fund balance. The negative reserve fund relates to the previously committed excess capacity. The negative DC reserve fund balance for library services amounts to $18.02 million (after the 10 per cent statutory discount) and this full amount is brought forward for recovery through development charges.
86 83 The development-related capital program also includes the construction of a new District 3 library branch in 2020 for a cost of $15.00 million. The Brampton Public Library also plans to expand its collections over the ten-year planning horizon. An amount of $35.37 million has been included to reflect the acquisition of new collection materials. Recognizing that approximately 75 per cent of all collection material acquisitions are considered to be a replacement and provide a benefit to the existing community, $26.50 million has been removed from the DC calculation. The total gross cost of the library DC capital program is $70.89 million. No grants, subsidies or other recoveries are anticipated to fund any shares of the above mentioned projects, and as such the net cost to the municipality remains at $70.89 million. Benefit-to-existing and replacement shares in the amount of $26.50 million related to the additional collection materials have been removed from the DC calculations. The legislated 10 per cent discount totals $4.44 million and is netted off of the net municipal costs, leaving $39.95 million as the total development related costs. An amount of $18.0 million, the amount by which the remaining DC eligible costs exceed the maximum allowable funding envelope, is deemed a post-period benefit, and will be considered for recovery in subsequent development charge by-laws. The DC costs eligible for recovery amount to $21.95 million, which is allocated entirely against future residential development in the City of Brampton. This results in an unadjusted development charge of $ per capita. TABLE 3 CASH FLOW ANALYSIS The cash flow analysis is displayed in Table 3. It considers the timing of the projects against the timing of the development charge revenues to determine adjusted calculated rates. After cash flow analysis, the residential charge increases to $ per capita. LIBRARY SERVICES SUMMARY 10-year Hist. Service Level Development-Related Capital Program ($000's) Unadjusted Development Charge Adjusted Development Charge $/capita Total Net DC Recoverable $/capita $/sq.m $/capita $/sq.m $ $70,887 $21,951 $ $0.00 $ $0.00
87 84 APPENDIX B.2 TABLE 1 - PAGE 1 LIBRARY SERVICES INVENTORY OF CAPITAL ASSETS BUILDINGS # of Square Feet UNIT COST Branch Name ($/sq.ft) Four Corners 38,939 38,939 38,939 38,939 38,939 38,939 38,939 38,939 38,939 38,939 $368 Chinguacousy 50,283 50,283 50,283 50,283 50,283 52,724 52,724 52,724 52,724 52,724 $368 Cyril Clark 17,650 17,650 17,650 17,650 17,650 25,354 25,354 25,354 25,354 25,354 $368 South Fletcher's Branch 12,754 12,754 12,754 12,754 12,754 12,754 12,754 12,754 12,754 12,754 $368 Gore Meadows (formerly Springdale) ,156 $378 Mount Pleasant Village ,112 22,112 22,112 $450 Temporary Locations: North West Interim Branch (Creditview) - 3,188 3,188 3,188 3,188 3,188 3, $221 North East Interim Branch (Mountainash) - - 2,632 2,632 2,632 2,632 2,632 2,632 2,632 2,632 $221 Total (sq.ft.) 119, , , , , , , , , ,671 Total ($000) $44,022.4 $44,726.9 $45,308.6 $45,308.6 $45,308.6 $49,041.9 $49,041.9 $58,287.8 $58,287.8 $69,686.8 LAND # of Acres UNIT COST Branch Name ($/acre) Four Corners $2,000,000 Chinguacousy $2,000,000 Cyril Clark $700,000 South Fletcher's Branch $700,000 Gore Meadows (formerly Springdale) $700,000 Mount Pleasant Village $700,000 Temporary Locations: North West Interim Branch (Creditview) $700,000 North East Interim Branch (Mountainash) $1,500,000 Total (acres) Total ($000) $9,036.0 $9,918.0 $10,008.0 $10,008.0 $10,008.0 $10, $10, $9, $9, $12,801.00
88 85 APPENDIX B.2 TABLE 1 - PAGE 2 LIBRARY SERVICES INVENTORY OF CAPITAL ASSETS MATERIALS # of Collection Materials UNIT COST Collection ($/item) Material Inventory 607, , , , , , , , , ,897 $23 Total All Materials (#) 607, , , , , , , , , ,897 Total ($000) $14,206.0 $13,504.0 $13,609.6 $13,697.0 $12,971.9 $12,728.5 $14,018.0 $14,897.1 $15,907.7 $16,869.0 FURNITURE AND EQUIPMENT Total Value of Furniture and Equipment ($000) Branch Name Four Corners $1,367.0 $1,367.0 $1,367.0 $1,367.0 $1,367.0 $1,395.7 $1,467.1 $1,483.0 $1,487.6 $1,501.0 Chinguacousy $1,669.0 $1,669.0 $1,669.0 $1,669.0 $1,669.0 $2,212.9 $2,315.7 $2,337.2 $2,431.4 $2,464.2 Cyril Clark $586.0 $586.0 $586.0 $586.0 $586.0 $609.5 $1,445.3 $1,447.7 $1,452.2 $1,466.8 South Fletcher's Branch $428.0 $428.0 $428.0 $428.0 $428.0 $538.9 $898.2 $899.8 $917.7 $922.8 Gore Meadows (formerly Springdale) $0.0 $0.0 $0.0 $0.0 $0.0 $0.0 $0.0 $0.0 $129.5 $806.1 Mount Pleasant Village $0.0 $0.0 $0.0 $0.0 $0.0 $0.0 $0.0 $375.5 $381.7 $523.3 Temporary Locations: North West Interim Branch (Creditview) $0.0 $109.0 $109.0 $109.0 $109.0 $130.9 $135.1 $0.0 $0.0 $0.0 North East Interim Branch (Mountainash) $0.0 $0.0 $84.0 $84.0 $84.0 $99.5 $103.7 $104.7 $104.7 $104.7 Total ($000) $4,050.0 $4,159.0 $4,243.0 $4,243.0 $4,243.0 $4,987.4 $6,365.1 $6,647.8 $6,904.6 $7,788.9
89 86 APPENDIX B.2 TABLE 1 - PAGE 3 LIBRARY SERVICES SERVICE LEVEL ANALYSIS Historic Population 386, , , , , , , , , ,800 INVENTORY SUMMARY ($000) Buildings $44,022.4 $44,726.9 $45,308.6 $45,308.6 $45,308.6 $49,041.9 $49,041.9 $58,287.8 $58,287.8 $69,686.8 Land $9,036.0 $9,918.0 $10,008.0 $10,008.0 $10,008.0 $10,008.0 $10,008.0 $9,441.0 $9,441.0 $12,801.0 Materials $14,206.0 $13,504.0 $13,609.6 $13,697.0 $12,971.9 $12,728.5 $14,018.0 $14,897.1 $15,907.7 $16,869.0 Furniture and Equipment $4,050.0 $4,159.0 $4,243.0 $4,243.0 $4,243.0 $4,987.4 $6,365.1 $6,647.8 $6,904.6 $7,788.9 Total ($000) $71,314.4 $72,307.9 $73,169.2 $73,256.6 $72,531.5 $76,765.9 $79,433.1 $89,273.8 $90,541.2 $107,145.7 SERVICE LEVEL ($/capita) Average Service Level Buildings $ $ $ $ $96.85 $ $97.21 $ $ $ $ Land $23.37 $24.22 $23.07 $22.22 $21.39 $20.60 $19.84 $18.02 $17.44 $22.95 $21.31 Materials $36.74 $32.97 $31.37 $30.40 $27.73 $26.20 $27.79 $28.44 $29.39 $30.24 $30.13 Furniture and Equipment $10.47 $10.15 $9.78 $9.42 $9.07 $10.27 $12.62 $12.69 $12.76 $13.96 $11.12 Total ($/capita) $ $ $ $ $ $ $ $ $ $ $ CALCULATION OF MAXIMUM ALLOWABLE LIBRARY SERVICES 10-Year Funding Envelope Calculation Excess Capacity Calculation 10 Year Average Service Level $ Total Value of Inventory in 2013 $ 107,145,688 Net Population Growth ,100 Inventory Using Average Service Level $ 94,413,228 Maximum Allowable Funding Envelope 24,390,366 Excess Capacity $12,732,460 Less: Uncommitted Excess Capacity $0 Excess Capacity: Committed Less: 10% Legislated Reduction $2,439,037 Discounted Maximum Allowable Funding Envelope $21,951,329
90 87 APPENDIX B-2 TABLE 2 CITY OF BRAMPTON 2014 DEVELOPMENT CHARGES BACKGROUND STUDY DEVELOPMENT-RELATED CAPITAL PROGRAM Gross Grants/ Net Ineligible Cost Total DC Eligible Costs Service Project Description Timing Project Subsidies/Other Municipal Replacement 10% DC Eligble Available DC Post Cost Recoveries Cost and BTE Share Reduction Costs Reserves LIBRARY SERVICES 2.1 Recovery of Negative Reserve Fund Balance 2014 $ 20,016,994 $ - $ 20,016,994 $ - $ 2,001,699 $ 18,015,294 $ - $ 18,015,294 $ Buildings, Land & Furnishings Automation Software Upgrades various $ 500,000 $ - $ 500,000 $ - $ 50,000 $ 450,000 $ - $ 450,000 $ District 3 Library 2020 $ 15,000,000 $ - $ 15,000,000 $ - $ 1,500,000 $ 13,500,000 $ - $ - $ 13,500, $ - $ - $ - $ - $ - $ - $ - $ - $ - $ 15,500,000 $ - $ 15,500,000 $ - $ 1,550,000 $ 13,950,000 $ - $ 450,000 $ 13,500, Material Acquisitions Additional Collection Materials 2014 $ 2,627,000 $ - $ 2,627,000 $ 1,750,000 $ 87,700 $ 789,300 $ - $ 789,300 $ Additional Collection Materials 2015 $ 2,927,000 $ - $ 2,927,000 $ 1,950,000 $ 97,700 $ 879,300 $ - $ 879,300 $ Additional Collection Materials 2016 $ 3,027,000 $ - $ 3,027,000 $ 2,150,000 $ 87,700 $ 789,300 $ - $ 789,300 $ Additional Collection Materials 2017 $ 3,227,000 $ - $ 3,227,000 $ 2,350,000 $ 87,700 $ 789,300 $ - $ 789,300 $ Additional Collection Materials 2018 $ 3,427,000 $ - $ 3,427,000 $ 2,550,000 $ 87,700 $ 789,300 $ - $ 238,835 $ 550, Additional Collection Materials 2019 $ 3,627,000 $ - $ 3,627,000 $ 2,750,000 $ 87,700 $ 789,300 $ - $ - $ 789, Additional Collection Materials 2020 $ 3,827,000 $ - $ 3,827,000 $ 2,950,000 $ 87,700 $ 789,300 $ - $ - $ 789, Additional Collection Materials 2021 $ 4,027,000 $ - $ 4,027,000 $ 3,150,000 $ 87,700 $ 789,300 $ - $ - $ 789, Additional Collection Materials 2022 $ 4,227,000 $ - $ 4,227,000 $ 3,350,000 $ 87,700 $ 789,300 $ - $ - $ 789, Additional Collection Materials 2023 $ 4,427,000 $ - $ 4,427,000 $ 3,550,000 $ 87,700 $ 789,300 $ - $ - $ 789,300 $ 35,370,000 $ - $ 35,370,000 $ 26,500,000 $ 887,000 $ 7,983,000 $ - $ 3,486,035 $ 4,496,965 TOTAL LIBRARY SERVICES $ 70,886,994 $ - $ 70,886,994 $ 26,500,000 $ 4,438,699 $ 39,948,294 $ - $ 21,951,329 $ 17,996,965 Residential Development Charge Calculation Residential Share of DC Eligible Costs 100% $21,951, Net Funding Envelope for Library $21,951, Year Growth in Population in New Units 162,396 Unadjusted Development Charge Per Capita ($) $ Reserve Fund Balance ($18,015,294) Non-Residential Development Charge Calculation Non-Residential Share of DC Eligible Costs 0% $ - 10 Year Growth in Square Meters 4,967,120 Unadjusted Development Charge Per Sq.M ($) $0.00
91 88 APPENDIX B.2 TABLE 3 CITY OF BRAMPTON CASHFLOW AND DETERMINATION OF DEVELOPMENT CHARGE LIBRARY BOARD RESIDENTIAL DEVELOPMENT CHARGE 2.00 LIBRARY SERVICES OPENING CASH BALANCE FROM APPLICABLE RESERVES TOTAL OPENING CASH BALANCE ($000) 0.0 (17,025.2) (16,325.4) (15,443.1) (14,282.8) (12,360.0) (10,020.0) (7,603.2) (5,132.7) (2,661.7) RESIDENTIAL FUNDING REQUIREMENTS 2.00 Library Services : Non Inflated $18, $ $ $ $ $45.00 $45.00 $45.00 $45.00 $45.00 $21, Library Services: Inflated $18, $ $ $ $ $49.68 $50.68 $51.69 $52.72 $53.78 $22, POPULATION GROWTH - Population in New Units 14,619 16,034 16,131 17,281 17,586 17,523 16,894 16,135 15,096 15, ,396 REVENUE - current ($000) - Dev. Charge Receipts 2, , , , , , , , , ,814.0 $27, Interest on Opening Balance 0.0 (936.4) (897.9) (849.4) (785.6) (679.8) (551.1) (418.2) (282.3) (146.4) ($5,546.98) - Interest on In-year Transactions (excl.int.) (455.7) ($67.43) TOTAL REVENUE 1, , , , , , , , , ,715.9 $22, CLOSING CASH BALANCE (17,025.2) (16,325.4) (15,443.1) (14,282.8) (12,360.0) (10,020.0) (7,603.2) (5,132.7) (2,661.7) Adjusted Charge Per Capita $ Allocation of Capital Program Residential Sector 100.0% Non-Residential Sector 0.0% Rates for 2014 Inflation Rate 2.0% Interest Rate on Positive Balances 3.5% Interest Rate on Negative Balances 5.5%
92 89 APPENDIX B.3 FIRE SERVICES
93 90 APPENDIX B.3 FIRE SERVICES Brampton s Fire and Emergency Services is responsible for the provision of fire protection and prevention services across the City. The Fire Protection and Prevention Act defines fire protection services as...fire suppression, fire prevention, fire safety education, communication, training of persons involved in the provision of fire protection services, rescue and emergency services and the delivery of all those services. The City s Fire and Emergency Services has a full time equivalent staff complement of approximately 386 responding to fires, medical emergencies, transportation accidents, industrial accidents, rescues, and a wide range of other lifethreatening emergencies. TABLE 1 HISTORIC SERVICE LEVELS Table 1 displays the ten year historic inventory for buildings, land, vehicles and equipment. Fire and Emergency Services currently operates out of sixteen stations plus a fire life safety centre. The total building area for all fire related buildings is 129,800 square feet with a replacement value of $47.95 million. The land associated with the fire stations totals acres, worth $22.09 million. The 2013 fleet totals 83 vehicles with a replacement value of $24.48 million. Equipment in all stations is valued at approximately $6.67 million. The 2013 total replacement value of the inventory of capital assets for Fire and Emergency Services is $ million, resulting in a ten year historic average service level of $ per household. The historic service level, multiplied by the ten year forecast in household growth (43,165), results in a ten year maximum allowable funding envelope of $29.12 million. No uncommitted excess capacity exists for this service; therefore, the full funding envelope is brought forward to the development charges calculation.
94 91 TABLE PROVISIONAL DEVELOPMENT-RELATED CAPITAL BUDGET& CALCULATION OF THE UNADJUSTED DEVELOPMENT CHARGES The first project in the Fire and Emergency Services capital program is for the recovery of the negative reserve fund balance. The negative reserve fund relates to the previously committed excess capacity. The negative DC reserve fund balance for fire services amounts to $23.68 million and this full amount is brought forward for recovery through development charges. Over the 10-year forecast period Fire and Emergency Services is expected to add two new stations, one training facility, an apparatus and maintenance facility and replace two stations (#201 and #203) with larger facilities as a result of growth. These new building projects combined amount to $46.82 million. The City anticipates funding the remaining portion ($3.53 million) of the new Apparatus and Maintenance Facility in The two new stations (station #14 and #15) are expected to be developed in 2018 and 2019 respectively, for a combined cost of $9.38 million. The new training facility will be constructed for a total cost of $19.96 million. A deduction of $220,000 is made to the training facility amount to reflect a benefit to the existing community. Stations 201 (Headquarters) and Station #203 are expected to be reconstructed and expanded for a total cost of $13.95 million. A deduction of $10.70 million is made to this amount to account for the replacement shares equivalent to the current stations. The remainder ($12.02 million) of the development-related capital program consists of new vehicles and equipment (e.g. opticom, dispatch and firefighting equipment). Altogether, the ten year capital forecast for fire services amounts to $82.52 million. A deduction of $14.47 million is made to this amount to account for the replacement shares, which are largely associated with the replacement of stations 201 and 203, as well as annual equipment acquisitions. A significant portion of the capital program, $38.93 million, is deemed to benefit development post 2023, and will be considered for recovery in subsequent development charge by-laws. The remaining $29.12 million is related to development in the planning period and is eligible for DC recovery in this period. The DCA does not require a 10 per cent statutory discount for fire and protection services.
95 92 The development-related net capital cost of $29.12 million is allocated 71 per cent to residential development ($20.68 million) and 29 per cent to non-residential development ($8.45 million). This apportionment is based on the anticipated shares of population in new units and employment growth over the ten-year forecast period. The residential share of the net development-related capital cost is divided by the 10- year forecast growth in population in new units to derive an unadjusted charge of $ per capita. The non-residential share of the net growth related capital cost is divided by the 10-year forecast growth in floor space, resulting in an unadjusted charge of $1.70 per square metre. TABLE 3 CASH FLOW ANALYSIS After cash flow consideration, the residential calculated charge increases to $ per capita and the non-residential charge increases to $1.97 per square metre. FIRE SERVICES SUMMARY 10-year Hist Unadjusted Adjusted Service Level Development-Related Capital Program ($000's) Development Charge Development Charge $/household Total Net DC Recoverable $/capita $/sq.m $/capita $/sq.m $ $82,520 $29,122 $ $1.70 $ $1.97
96 93 APPENDIX B.3 TABLE 1 - PAGE 1 FIRE SERVICES INVENTORY OF CAPITAL ASSETS BUILDINGS # of Square Feet UNIT COST Station Name ($/sq.ft) Station #201 Headquarters 13,544 13,544 13,544 13,544 13,544 13,544 13,544 13,544 13,544 13,544 $366 Station #202 6,745 6,745 6,745 6,745 6,745 6,745 6,745 6,745 6,745 6,745 $366 Station #203 17,981 17,981 17,981 17,981 17,981 17,981 17,981 21,694 21,694 21,694 $366 Station #204 5,900 5,900 5,900 5,900 5,900 5,900 5,900 5,900 5,900 5,900 $366 Station #205 5,900 5,900 5,900 5,900 5,900 5,900 8,239 8,239 8,239 8,239 $366 Station #206 6,711 6,711 6,711 6,711 6,711 6,711 6,711 6,711 6,711 6,711 $366 Station #207 7,194 7,194 7,194 7,194 7,194 7,194 7,194 7,194 7,194 7,194 $366 Station #208 6,747 6,747 6,747 6,747 6,747 6,747 6,747 6,747 6,747 6,747 $366 Station #209 9,608 9,608 9,608 9,608 9,608 9,608 9,608 9,608 9,608 9,608 $366 Station #210 9,668 9,668 9,668 9,668 9,668 9,668 9,668 9,668 9,668 9,668 $366 Station # ,068 11,068 11,068 $412 Station #213 8,919 8,919 8,919 8,919 8,919 8,919 8,919 8,919 8,919 8,919 $412 Churchville Station # $200 Huttonville Station #218 1,269 1,269 1,269 1,269 1,269 1,269 1,269 1,269 1,269 1,269 $200 Castlemore Station #219 1,626 1,626 1,626 1,626 1,626 1,626 1,626 1,626 1,626 1,626 $217 Fire Life Safety Centre 10,847 10,847 10,847 10,847 10,847 10,847 10,847 10,847 10,847 10,847 $366 Total (sq.ft.) 113, , , , , , , , , ,779 Total ($000) $41,374.7 $41,374.7 $41,374.7 $41,374.7 $41,374.7 $41,374.7 $42,230.6 $48,145.9 $47,953.5 $47,953.5 LAND # of Acres UNIT COST Station Name ($/acre) A&M Facility - 52 Rutherford Rd $700,000 Station #201 Headquarters $1,500,000 Station # $700,000 Station # $850,000 Station # $700,000 Station # $700,000 Station # $1,500,000 Station # $700,000 Station # $700,000 Station # $700,000 Station # $700,000 Station # $700,000 Station # $700,000 Station # $700,000 Churchville Station # $700,000 Huttonville Station # $700,000 Castlemore Station # $700,000 Fire Life Safety Centre $700,000 Total (acres) Total ($000) $18,163.8 $18,163.8 $18,163.8 $19,143.8 $19,143.8 $19,145.0 $19,145.0 $20,433.0 $22,085.0 $22,085.0
97 94 APPENDIX B.3 TABLE 1 - PAGE 2 FIRE SERVICES INVENTORY OF CAPITAL ASSETS VEHICLES # of Vehicles UNIT COST Vehicle Type ($/vehicle) Aerials/Towers $1,100,000 Air/Light Vehicle $400,000 Chief/Training Vehicle $35,000 Command Post $650,000 Fire Prevention cars $25,000 Flashover $87,000 Hazardous Materials Unit $650,000 Platon Chiefs Vehicle $65,000 Pumper/ Rescue $700,000 Pumpers/Tankers $600,000 Rehabilitation unit $220,000 Technical rescue $450,000 Total (#) Total ($000) $19,792.0 $20,962.0 $21,742.0 $23,197.0 $23,322.0 $23,422.0 $24,047.0 $24,117.0 $23,617.0 $24,477.0 FURNITURE & EQUIPMENT (excluding computers) Total Value of Furniture & Equipment ($) UNIT COST Description $/Unit - Opticom Traffic Controller Pre-Emption Device (# intersections) $6,000 - Opticom Traffic Controller Pre-Emption Device ($000) $1,764.0 $1,956.0 $2,220.0 $2,430.0 $2,574.0 $2,694.0 $2,808.0 $2,952.0 $3,072.0 $1,896.0 Emtrac Traffic Controller Pre-Emption Device (# of Intersections) $4,418 - Furniture & Equipment - all stations ($000) $1,704.3 $1,704.3 $1,704.3 $1,704.3 $1,704.3 $1,704.3 $1,739.4 $1,961.1 $1,946.7 $1,946.7 $15 -# of Firefighters $5,000 Total ($000) $5,088.3 $5,330.3 $5,594.3 $5,934.3 $6,083.3 $6,248.3 $6,397.4 $6,718.1 $6,823.7 $6,667.2
98 95 APPENDIX B.3 TABLE 1 - PAGE 3 FIRE SERVICES SERVICE LEVEL ANALYSIS Historic Households 113, , , , , , , , , ,240 INVENTORY SUMMARY ($000) Buildings $41,375 $41,375 $41,375 $41,375 $41,375 $41,375 $42,231 $48,146 $47,953 $47,953 Land $18,164 $18,164 $18,164 $19,144 $19,144 $19,145 $19,145 $20,433 $22,085 $22,085 Vehicles $19,792 $20,962 $21,742 $23,197 $23,322 $23,422 $24,047 $24,117 $23,617 $24,477 Equipment $5,088 $5,330 $5,594 $5,934 $6,083 $6,248 $6,397 $6,718 $6,824 $6,667 Total ($000) $84,419 $85,831 $86,875 $89,650 $89,924 $90,190 $91,820 $99,414 $100,479 $101,183 SERVICE LEVEL ($/household) Average Service Level Buildings $ $ $ $ $ $ $ $ $ $ $ Land $ $ $ $ $ $ $ $ $ $ $ Vehicles $ $ $ $ $ $ $ $ $ $ $ Equipment $44.75 $44.55 $44.43 $45.56 $45.14 $44.81 $44.34 $45.01 $44.33 $42.13 $44.50 Total ($/household) $ $ $ $ $ $ $ $ $ $ $ CALCULATION OF MAXIMUM ALLOWABLE FIRE SERVICES 10-Year Funding Envelope Calculation Excess Capacity Calculation 10 Year Average Service Level $ Total Value of Inventory in 2013 $ 101,182,676 Net Household Growth ,165 Inventory Using Average Service Level $ 106,759,646 Maximum Allowable Funding Envelope 29,122,244 Excess Capacity $ - Less: Uncommitted Excess Capacity $0 Excess Capacity: Uncommitted Discounted Maximum Allowable Funding Envelope $29,122,244 Excess Calculation ($000)
99 96 APPENDIX B-3 TABLE 2 CITY OF BRAMPTON 2014 DEVELOPMENT CHARGES BACKGROUND STUDY DEVELOPMENT-RELATED CAPITAL PROGRAM Gross Grants/ Net Ineligible Cost Total DC Eligible Costs Service Project Description Timing Project Subsidies/Other Municipal Replacement 0% DC Eligble Available DC Post Cost Recoveries Cost and BTE Share Reduction Costs Reserves FIRE SERVICES 3.1 Recovery of Negative Reserve Fund Balance 2014 $ 23,683,542 $ - $ 23,683,542 $ - $ - $ 23,683,542 $ - $ 23,683,542 $ Buildings, Land & Furnishings Apparatus and Maintenance Facility 2014 $ 3,530,000 $ - $ 3,530,000 $ - $ - $ 3,530,000 $ - $ 3,530,000 $ Station 201 Headquarter Replacement and Expansion 2014 $ 250,000 $ - $ 250,000 $ 212,000 $ - $ 38,000 $ - $ 38,000 $ Station 203 Replacement and Expansion 2014 $ 4,600,000 $ - $ 4,600,000 $ 2,773,000 $ - $ 1,827,000 $ - $ 1,675,701 $ 151, Training Facility 2014 $ 12,600,000 $ - $ 12,600,000 $ - $ - $ 12,600,000 $ - $ - $ 12,600, Training Facility 2015 $ 1,107,000 $ - $ 1,107,000 $ - $ - $ 1,107,000 $ - $ - $ 1,107, Station 201 Headquarter Replacement and Expansion 2015 $ 9,096,000 $ - $ 9,096,000 $ 7,710,000 $ - $ 1,386,000 $ - $ - $ 1,386, Training Facility 2016 $ 6,253,000 $ - $ 6,253,000 $ 220,000 $ - $ 6,033,000 $ - $ - $ 6,033, Station Design and Construction 2018 $ 180,000 $ - $ 180,000 $ - $ - $ 180,000 $ - $ - $ 180, Station 214 & Training - Construction 2018 $ 4,600,000 $ - $ 4,600,000 $ - $ - $ 4,600,000 $ - $ - $ 4,600, Station Design and Construction 2019 $ 4,600,000 $ - $ 4,600,000 $ - $ - $ 4,600,000 $ - $ - $ 4,600,000 $ 46,816,000 $ - $ 46,816,000 $ 10,915,000 $ - $ 35,901,000 $ - $ 5,243,701 $ 30,657, Vehicles New Vehicle 2014 $ 120,000 $ - $ 120,000 $ - $ - $ 120,000 $ - $ 120,000 $ New Vehicle 2015 $ 1,075,000 $ - $ 1,075,000 $ - $ - $ 1,075,000 $ - $ - $ 1,075, New Vehicle 2016 $ 1,200,000 $ - $ 1,200,000 $ - $ - $ 1,200,000 $ - $ - $ 1,200, New Vehicle 2017 $ 1,100,000 $ - $ 1,100,000 $ - $ - $ 1,100,000 $ - $ - $ 1,100, New Vehicle 2018 $ 750,000 $ - $ 750,000 $ - $ - $ 750,000 $ - $ - $ 750, New Vehicle 2019 $ 700,000 $ - $ 700,000 $ - $ - $ 700,000 $ - $ - $ 700, New Vehicle 2020 $ 1,100,000 $ - $ 1,100,000 $ - $ - $ 1,100,000 $ - $ - $ 1,100,000 $ 6,045,000 $ - $ 6,045,000 $ - $ - $ 6,045,000 $ - $ 120,000 $ 5,925, Equipment Opticom 2014 $ 75,000 $ - $ 75,000 $ - $ - $ 75,000 $ - $ 75,000 $ Opticom 2015 $ 150,000 $ - $ 150,000 $ 75,000 $ - $ 75,000 $ - $ - $ 75, Opticom 2016 $ 150,000 $ - $ 150,000 $ 75,000 $ - $ 75,000 $ - $ - $ 75, Dispatch Equipment 2016 $ 350,000 $ - $ 350,000 $ 200,000 $ - $ 150,000 $ - $ - $ 150, Fire Fightining Equipment 2016 $ 350,000 $ - $ 350,000 $ 250,000 $ - $ 100,000 $ - $ - $ 100, Opticom 2017 $ 200,000 $ - $ 200,000 $ 100,000 $ - $ 100,000 $ - $ - $ 100, Dispatch Equipment 2017 $ 350,000 $ - $ 350,000 $ 200,000 $ - $ 150,000 $ - $ - $ 150, Fire Fightining Equipment 2017 $ 350,000 $ - $ 350,000 $ 250,000 $ - $ 100,000 $ - $ - $ 100, Opticom 2018 $ 200,000 $ - $ 200,000 $ 100,000 $ - $ 100,000 $ - $ - $ 100, Dispatch Equipment 2018 $ 350,000 $ - $ 350,000 $ 200,000 $ - $ 150,000 $ - $ - $ 150, Fire Fightining Equipment 2018 $ 350,000 $ - $ 350,000 $ 250,000 $ - $ 100,000 $ - $ - $ 100, Opticom 2019 $ 200,000 $ - $ 200,000 $ 100,000 $ - $ 100,000 $ - $ - $ 100, Dispatch Equipment 2019 $ 350,000 $ - $ 350,000 $ 200,000 $ - $ 150,000 $ - $ - $ 150, Fire Fightining Equipment 2019 $ 350,000 $ - $ 350,000 $ 250,000 $ - $ 100,000 $ - $ - $ 100, Opticom 2020 $ 200,000 $ - $ 200,000 $ 100,000 $ - $ 100,000 $ - $ - $ 100, Dispatch Equipment 2020 $ 350,000 $ - $ 350,000 $ 200,000 $ - $ 150,000 $ - $ - $ 150, Fire Fightining Equipment 2020 $ 350,000 $ - $ 350,000 $ 250,000 $ - $ 100,000 $ - $ - $ 100, Opticom 2021 $ 200,000 $ - $ 200,000 $ 100,000 $ - $ 100,000 $ - $ - $ 100, Dispatch Equipment 2021 $ 350,000 $ - $ 350,000 $ 200,000 $ - $ 150,000 $ - $ - $ 150, Fire Fightining Equipment 2021 $ 350,000 $ - $ 350,000 $ 250,000 $ - $ 100,000 $ - $ - $ 100, Opticom 2022 $ 200,000 $ - $ 200,000 $ 100,000 $ - $ 100,000 $ - $ - $ 100, Opticom 2023 $ 200,000 $ - $ 200,000 $ 100,000 $ - $ 100,000 $ - $ - $ 100,000 $ 5,975,000 $ - $ 5,975,000 $ 3,550,000 $ - $ 2,425,000 $ - $ 75,000 $ 2,350,000 TOTAL FIRE SERVICES $ 82,519,542 $ - $ 82,519,542 $ 14,465,000 $ - $ 68,054,542 $ - $ 29,122,244 $ 38,932,299 Residential Development Charge Calculation Residential Share of DC Eligible Costs 71% $20,676, Net Funding Envelope for Fire $29,122, Year Growth in Population in New Units 162,396 Unadjusted Development Charge Per Capita ($) $ Reserve Fund Balance ($23,683,542) Non-Residential Development Charge Calculation Non-Residential Share of DC Eligible Costs 29% $ 8,445, Year Growth in Square Meters 4,967,120 Unadjusted Development Charge Per Sq.M ($) $1.70
100 97 APPENDIX B.3 TABLE 3 - PAGE 1 CITY OF BRAMPTON CASHFLOW AND DETERMINATION OF DEVELOPMENT CHARGE FIRE SERVICES RESIDENTIAL DEVELOPMENT CHARGE 3.00 FIRE SERVICES OPENING CASH BALANCE FROM APPLICABLE RESERVES TOTAL OPENING CASH BALANCE ($000) 0.0 (19,010.5) (17,580.1) (16,006.2) (14,110.1) (12,004.3) (9,735.4) (7,390.4) (4,991.0) (2,587.8) RESIDENTIAL FUNDING REQUIREMENTS 3.00 Fire Services : Non Inflated $20, $0.00 $0.00 $0.00 $0.00 $0.00 $0.00 $0.00 $0.00 $0.00 $20, Fire Services: Inflated $20, $0.00 $0.00 $0.00 $0.00 $0.00 $0.00 $0.00 $0.00 $0.00 $20,676.8 POPULATION GROWTH - Population in New Units 14,619 16,034 16,131 17,281 17,586 17,523 16,894 16,135 15,096 15, ,396 REVENUE - current ($000) - Dev. Charge Receipts 2, , , , , , , , , ,684.5 $26, Interest on Opening Balance 0.0 (1,045.6) (966.9) (880.3) (776.1) (660.2) (535.4) (406.5) (274.5) (142.3) ($5,687.9) - Interest on In-year Transactions (excl.int.) (508.8) ($84.0) TOTAL REVENUE 1, , , , , , , , , ,589.1 $20,678.1 CLOSING CASH BALANCE (19,010.5) (17,580.1) (16,006.2) (14,110.1) (12,004.3) (9,735.4) (7,390.4) (4,991.0) (2,587.8) Adjusted Charge Per Capita $ Allocation of Capital Program Residential Sector 71.0% Non-Residential Sector 29.0% Rates for 2014 Inflation Rate 2.0% Interest Rate on Positive Balances 3.5% Interest Rate on Negative Balances 5.5%
101 98 APPENDIX B.3 TABLE 3 - PAGE 2 CITY OF BRAMPTON CASHFLOW AND DETERMINATION OF DEVELOPMENT CHARGE FIRE DEPARTMENT NON-RESIDENTIAL DEVELOPMENT CHARGE 3.00 FIRE DEPARTMENT OPENING CASH BALANCE FROM APPLICABLE RESERVES TOTAL OPENING CASH BALANCE ($000) $0.00 ($7,566.25) ($6,782.05) ($5,976.80) ($5,251.90) ($4,547.88) ($3,724.96) ($2,853.22) ($1,937.09) ($1,018.90) NON-RESIDENTIAL FUNDING REQUIREMENTS 3.00 Fire Department : Non Inflated $8, $0.00 $0.00 $0.00 $0.00 $0.00 $0.00 $0.00 $0.00 $0.00 $8, Fire Department: Inflated $8, $0.00 $0.00 $0.00 $0.00 $0.00 $0.00 $0.00 $0.00 $0.00 $8, NON-RESIDENTIAL GROWTH - Sq. Metres in New Buildings 549, , , , , , , , , ,850 4,967,120 REVENUE - current ($000) - Dev. Charge Receipts 1, , , , , , , , ,056.7 $10, Interest on Opening Balance 0.0 (416.1) (373.0) (328.7) (288.9) (250.1) (204.9) (156.9) (106.5) (56.0) ($2,181.25) - Interest on In-year Transactions (excl.int.) (202.5) ($34.85) TOTAL REVENUE ,019.2 $8, CLOSING CASH BALANCE (7,566.3) (6,782.1) (5,976.8) (5,251.9) (4,547.9) (3,725.0) (2,853.2) (1,937.1) (1,018.9) 0.2 Allocation of Capital Program 2014 Adjusted Charge Per Capita $1.97 Residential Sector 71.0% Non-Residential Sector 29.0% Rates for 2014 Inflation Rate: 2.0% Interest Rate on Positive Balances 3.5% Interest Rate on Negative Balances 5.5%
102 99 APPENDIX B.4 RECREATION SERVICES
103 100 APPENDIX B.4 RECREATION SERVICES The Public Services Department is responsible for the provision of Recreation services in the City of Brampton. Recreation services are delivered through a variety of indoor facilities including community centres, gymnasiums and arenas, as well as parkland and outdoor facilities. Cultural facilities are not eligible to be recovered through development charges and are excluded from this study. TABLE 1 HISTORIC SERVICE LEVELS The City operates 48 indoor recreation facilities of various types. The inventory includes 12 major community centres and 7 minor community centres. These centres total 1.11 million and 184,900 square feet, respectively, with a combined value of $ million. The 30,500 square feet of gymnasiums are valued at $8.53 million and seniors centres, which occupy 39,900 square feet totalling $11.93 million. There are two stand-alone arenas in the City of Brampton, which are valued at $18.40 million. The remaining 141,300 square feet of indoor recreation space add $49.33 million to the total value of the inventory. The City owns a substantial amount of equipment used to provide recreation services. This includes fitness equipment, ice resurfacers, operations equipment, audio/video equipment, furniture and miscellaneous equipment. The total replacement value of all indoor recreation equipment in 2013 was $41.34 million. The land associated with these indoor facilities totals acres, valued at $99.49 million. The City of Brampton also provides outdoor recreation facilities to the local population. In total, there are over 700 park facilities offered, including soccer fields, baseball diamonds, football fields, tennis courts, bocce courts, batting cages, cricket pitches, rugby fields, running tracks, splash pads, skateboard parks, lacrosse fields, and playgrounds. The total value of these facilities in 2013 was $ million. Also included in the outdoor recreation inventory of capital assets are outdoor buildings, park equipment and special park facilities. In total, there are 132,000square feet of outdoor building space occupying acres of land in Brampton. The total
104 101 value of the buildings and land for these structures is valued at approximately $37.88 million. Equipment associated with outdoor park buildings totals $3.72 million. Outdoor maintenance equipment, which includes miscellaneous tools, mowers, forklifts, and generators totals $2.11 million. The remaining special park facilities include various club houses and infrastructure, such as lawn bowling clubs, band shells, boathouses, mini-golf courses, greenhouses, outdoor swimming pools and rinks, and golf clubs. These facilities, as well as the acres of land with which they are associated, are valued at $89.04 million. The City of Brampton s recreation inventory also includes tableland parkland, valleylands and other non-developable natural heritage lands. Together, these items amount to almost 3,700 acres of developed parkland, valued at $ million. Finally, the parks and recreation fleet and maintenance equipment inventory includes both City-owned items and rented items that provide services to the residents of Brampton. The total recreation related fleet and equipment is valued at approximately $24.18 million. The combined value of capital assets for Recreation is valued at $1.47 billion. The ten year historic average service level is $2, per capita, and this, multiplied by the ten-year forecast of net population growth, results in a ten year maximum allowable funding envelope of $ million. No uncommitted excess capacity has been identified for this service. Recreation is a service for which development-related capital costs must be reduced by ten per cent under the DCA. The resulting net maximum allowable funding envelope brought forward to the development charges calculation is reduced to $ million. TABLE PROVISIONAL DEVELOPMENT-RELATED CAPITAL BUDGET& CALCULATION OF THE UNADJUSTED DEVELOPMENT CHARGES The largest project of the Major Facilities component of the Recreation capital program related to the construction of the new Mississauga/Embleton Community Recreation Centre. This is proposed as a four year phased development project to occur between 2014 and 2018 for a total gross project cost of $51.21 million. No other recreation centres will be decommissioned as a result of the construction of this new centre, therefore, no replacement shares have been removed from the total project
105 102 cost. The remaining major facilities projects include the repurposing of the Old Flower City Community Campus Building for a total cost of $11.80 million, and the modernization of existing facilities, for a total cost of $41.10 million. Recognizing that a portion of the facility modernizations will benefit the existing community, approximately 40 per cent, or $16.44 million, is considered to be the replacement and benefit to existing share, which will not be recovered through development charges. The park facility and equipment/fleet amounts to a total gross cost of $10.45 million. This provides for new indoor fields (FCCC Lawn Bowling) in 2016 for a total gross cost of $4.00 million. The capital program also includes a provision of $6.45 million to cover the cost of acquiring recreation related fleet and equipment over the ten-year planning period while maintaining the average historic level of service. All of these projects are deemed to be entirely development-related and neither replacement nor benefit to existing shares has been deducted. The City also intends to continue the development of parkland. This program totals $ million and includes various developments such as Gore Meadows, Northwest Brampton Community Park, Eldorado Park, Loafers Lake, Torbram/Sandalwood, City valleylands and the Heritage/Bovaird City-wide Park. In addition, new community and neighbourhood parks are planned throughout the planning period. However, the City anticipates receiving about $10.68 million in CIL to offset the cost of acquiring the North West Brampton Community Park in Additionally, $5.93 million in replacement and benefit to existing shares have been identified, and therefore, this amount will not be recovered through development charges. The ten year capital forecast for Recreation totals $ million, of which $10.68 million is to be funded by CIL. $22.37 million is identified as a replacement or benefit to existing share, and the legislated ten per cent discount totals $39.24 million. These shares are netted off of the net municipal costs, leaving $ million as the total development related costs. $3.21 million is available in the Recreation DC reserve fund balance to fund development-related projects. An amount of $3.71 million represents the portion of the development-related cost which exceeds the maximum allowable funding envelope and is deemed to benefit growth beyond the period. This share can be recovered through subsequent development charges studies.
106 103 The DC costs eligible for recovery amount to $ million which is allocated entirely against future residential development in the City. This results in an unadjusted development charge of $2, per capita. TABLE 3 CASH FLOW ANALYSIS After cash flow consideration, the residential calculated charge increases to $2, per capita. The following table summarizes the calculation of the Recreation development charge. RECREATION SERVICES SUMMARY 10-year Hist. Service Level Development-Related Capital Program ($000's) Unadjusted Development Charge Adjusted Development Charge $/capita Total Net DC Recoverable $/capita $/sq.m $/capita $/sq.m $2, $425,411 $346,202 $2, $0.00 $2, $0.00
107 104 APPENDIX B.4 TABLE 1 - PAGE 1 RECREATION FACILITIES INVENTORY OF CAPITAL ASSETS MAJOR COMMUNITY CENTRES # of Square Feet UNIT COST Facility Name ($/sq.ft) Brampton Soccer Centre , , , , , , ,309 $346 Cassie Campell Community Centre , , , , , ,355 $407 Century Gardens Recreation Complex 77,129 77,129 77,129 77, , , , , , ,904 $444 Chinguacousy Wellness Centre 43,188 43,188 43,188 43,188 43,188 43,188 43,188 43,188 43,188 43,188 $444 Chris Gibson Recreation Centre 51,272 51,272 51,272 51,272 51,272 51,272 51,272 51,272 51,272 51,272 $444 Earnscliffe Recreation Centre 47,699 47,699 47,699 90,493 90,493 90,493 90,493 90,493 90,493 90,493 $444 Gore Meadows Community Centre ,394 $378 Greenbriar Recreation Centre 44,575 44,575 44,575 44,575 44,575 44,575 44,575 44,575 44,575 44,575 $317 Jim Archdekin Recreation Centre 47,052 47,052 47,052 47,052 47,052 47,052 47,052 47,052 47,052 47,052 $375 PowerAde Centre 152, , , , , , , , , ,040 $375 South Fletcher's Sportsplex 159, , , , , , , , , ,642 $359 Terry Miller Recreation Centre 60,344 60,344 60,344 60,344 60,344 60,344 60,344 60,344 60,344 60,344 $317 Total (sq.ft.) 682, , , ,044 1,064,174 1,064,174 1,064,174 1,064,174 1,064,174 1,107,568 Total ($000) $262,562.4 $262,562.4 $262,562.4 $328,049.7 $412,569.0 $412,569.0 $412,569.0 $412,569.0 $412,569.0 $428,972.0 MINOR COMMUNITY CENTRES # of Square Feet UNIT COST Facility Name ($/sq.ft) Balmoral Recreation Centre 17,439 17,439 17,439 17,439 17,439 17,439 17,439 17,439 17,439 17,439 $317 Brampton Curling Club 28,258 28,258 28,258 28,258 28,258 28,258 28,258 28,258 28,258 28,258 $386 Centre for Sports Excellence (formerly McMurchy Pool) 38,527 38,527 38,527 38,527 38,527 38,527 38,527 38,527 38,527 38,527 $444 Chinguacousy Curling Club 26,857 26,857 26,857 26,857 26,857 26,857 26,857 32,539 32,539 32,539 $386 Ellen Mitchell Recreation Centre 14,178 14,178 14,178 14,178 14,178 14,178 14,178 14,178 14,178 14,178 $444 Howden Recreation Centre 23,080 23,080 23,080 23,080 23,080 23,080 23,080 23,080 23,080 23,080 $444 Loafer's Lake Recreation Centre 30,913 30,913 30,913 30,913 30,913 30,913 30,913 30,913 30,913 30,913 $444 Total (sq.ft.) 179, , , , , , , , , ,934 Total ($000) $74,172.8 $74,172.8 $74,172.8 $74,172.8 $74,172.8 $74,172.8 $74,172.8 $76,366.0 $76,366.0 $76,366.0
108 105 APPENDIX B.4 TABLE 1 - PAGE 2 RECREATION FACILITIES INVENTORY OF CAPITAL ASSETS SHARED GYMASIUM FACILITIES # of Square Feet UNIT COST Facility Name ($/sq.ft) Century Gardens Rec Ctr / Gordon Graydon Senior Elem. 4,639 4,639 4,639 4,639 4,639 4,639 4,639 4,639 4,639 4,639 $280 Huttonville Community Centre / Huttonville Elem. School 10,637 10,637 10,637 10,637 10,637 10,637 10,637 10,637 10,637 10,637 $280 Jim Archdekin Rec Ctr / Heart Lake Secondary School 5,753 5,753 5,753 5,753 5,753 5,753 5,753 5,753 5,753 5,753 $280 Ken Giles Community Ctr / Sir Wilfred Laurier Elem. School 2,666 2,666 2,666 2,666 2,666 2,666 2,666 2,666 2,666 2,666 $280 Mount Pleasant Comm Ctr / MP Village Elementary School ,543 2,543 2,543 $280 Terry Miller Rec Ctr / Judith Nyman Secondary School 4,216 4,216 4,216 4,216 4,216 4,216 4,216 4,216 4,216 4,216 $280 Total (sq.ft.) 27,911 27,911 27,911 27,911 27,911 27,911 27,911 30,454 30,454 30,454 Total ($000) $7,815.1 $7,815.1 $7,815.1 $7,815.1 $7,815.1 $7,815.1 $7,815.1 $8,527.1 $8,527.1 $8,527.1 SENIOR CENTRES # of Square Feet UNIT COST Facility Name ($/sq.ft) Centennial Recreation Centre 7,766 7,766 7, $279 FCCC Seniors Centre ,224 15,224 15,224 15,224 15,224 15,224 15,224 15,224 $301 FCCC Seniors Centre Gymnasium 10,939 10,939 10,939 10,939 $322 Knightbridge Community Centre 6,567 6,567 6,567 6,567 6,567 6,567 6,567 6,567 6,567 6,567 $279 Snelgrove Community Centre 7,153 7,153 7,153 7,153 7,153 7,153 7,153 7,153 7,153 7,153 $278 Total (sq.ft.) 21,486 21,486 36,710 28,944 28,944 28,944 39,883 39,883 39,883 39,883 Total ($000) $5,995.1 $5,995.1 $10,579.0 $8,409.4 $8,409.4 $8,409.4 $11,931.8 $11,931.8 $11,931.8 $11,931.8 ARENAS # of Square Feet UNIT COST Facility Name ($/sq.ft) Memorial Arena 33,128 33,128 33,128 33,128 33,128 33,128 33,128 33,128 33,128 33,128 $265 Victoria Park Arena 35,379 35,379 35,379 35,379 35,379 35,379 35,379 35,379 35,379 35,379 $272 Total (sq.ft.) 68,507 68,507 68,507 68,507 68,507 68,507 68,507 68,507 68,507 68,507 Total ($000) $18,402.5 $18,402.5 $18,402 $18,402 $18,402.5 $18,402.5 $18,402.5 $18,402.5 $18,402.5 $18,402.5
109 106 APPENDIX B.4 TABLE 1 - PAGE 3 RECREATION FACILITIES INVENTORY OF CAPITAL ASSETS OTHER INDOOR FACILITIES # of Square Feet UNIT COST Facility Name ($/sq.ft) Alderlea ,153 $741 Avondale Community Centre 6,928 6,928 6,928 6,928 6,928 6,928 6,928 6,928 6,928 6,928 $350 Brampton Tennis Club 1,118 1,118 1,118 1,118 1,118 1,118 1,118 1,118 1,118 1,118 $108 Castlemore Bocce Courts 5,647 5,647 5,647 5,647 5,647 5,647 5,647 5,647 5,647 5,647 $167 Castlemore Community Centre (former Fire Station 217) $210 Central Public School Recreation Centre 25,930 25,930 25,930 25,930 25,930 25,930 25,930 25,930 25,930 25,930 $352 Chinguacousy Park Optimist Club and Ski Chalet (New) ,428 18,428 $437 Ebenezer Hall 1,500 1,500 1,500 1,500 1,500 1,500 1,500 2,798 2,798 2,798 $445 FCCC - Dorm Building "D" 8,045 8,045 8,045 8,045 8,045 8,045 8,045 8,045 8,045 8,045 $286 FCCC - Dorm Building "E" 7,415 7,415 7,415 7,415 7,415 7,415 7,415 7,415 7,415 7,415 $286 FCCC - Dorm Building "F" 8,045 8,045 8,045 8,045 8,045 8,045 8,045 8,045 8,045 8,045 $286 FCCC - Gymnasium 21,538 21,538 21,538 21, $267 Ken Giles Recreation Centre 28,907 28,907 28,907 28,907 28,907 28,907 28,907 28,907 28,907 28,907 $267 Mount Pleasant Community Centre ,523 2,523 2,523 $450 Norton Place Recreation Centre 1,341 1,341 1,341 1,341 1,341 1,341 1,341 1,341 1,341 1,341 $267 Old Optimist Community Centre (Chinguacousy) 6,985 6,985 6,985 6,985 6,985 6,985 6, $276 Professor's Lake Recreation Centre 13,061 13,061 13,061 13,061 13,061 13,061 13,061 13,061 13,061 13,061 $289 Total (sq.ft.) 136, , , , , , , , , ,301 Total ($000) $39,513.7 $39,513.7 $39,513.7 $39,513.7 $33,764.1 $33,764.1 $33,764.1 $33,547.4 $41,802.6 $49,326.0
110 107 APPENDIX B.4 TABLE 1 - PAGE 4 RECREATION FACILITIES - EQUIPMENT INVENTORY OF CAPITAL ASSETS MAJOR COMMUNITY CENTRES ($) Value of Equipment ($) UNIT COST Facility Name ($/sq.ft) Brampton Soccer Centre $0 $0 $0 $3,224,405 $3,224,405 $3,224,405 $3,224,405 $3,224,405 $3,224,405 $3,224,405 $24 Cassie Campell Community Centre $0 $0 $0 $0 $4,561,299 $4,561,299 $4,561,299 $4,561,299 $4,561,299 $4,561,299 $27 Century Gardens Recreation Complex $2,092,404 $2,092,404 $2,092,404 $2,092,404 $3,117,188 $3,117,188 $3,117,188 $3,117,188 $3,117,188 $3,117,188 $27 Chinguacousy Wellness Centre $1,177,206 $1,177,206 $1,177,206 $1,177,206 $1,177,206 $1,177,206 $1,177,206 $1,177,206 $1,177,206 $1,177,206 $27 Chris Gibson Recreation Centre $1,353,987 $1,353,987 $1,353,987 $1,353,987 $1,353,987 $1,353,987 $1,353,987 $1,353,987 $1,353,987 $1,353,987 $26 Earnscliffe Recreation Centre $1,298,113 $1,298,113 $1,298,113 $2,462,739 $2,462,739 $2,462,739 $2,462,739 $2,462,739 $2,462,739 $2,462,739 $27 Gore Meadows Community Centre $0 $0 $0 $0 $0 $0 $0 $0 $0 $943,830 $22 Greenbriar Recreation Centre $1,144,049 $1,144,049 $1,144,049 $1,144,049 $1,144,049 $1,144,049 $1,144,049 $1,144,049 $1,144,049 $1,144,049 $26 Jim Archdekin Recreation Centre $1,174,218 $1,174,218 $1,174,218 $1,174,218 $1,174,218 $1,174,218 $1,174,218 $1,174,218 $1,174,218 $1,174,218 $25 PowerAde Centre $3,972,539 $3,972,539 $3,972,539 $3,972,539 $3,972,539 $3,972,539 $3,972,539 $3,972,539 $3,972,539 $3,972,539 $26 South Fletcher's Sportsplex $4,430,469 $4,430,469 $4,430,469 $4,430,469 $4,430,469 $4,430,469 $4,430,469 $4,430,469 $4,430,469 $4,430,469 $28 Terry Miller Recreation Centre $1,654,576 $1,654,576 $1,654,576 $1,654,576 $1,654,576 $1,654,576 $1,654,576 $1,654,576 $1,654,576 $1,654,576 $27 Total ($000) $18,297.6 $18,297.6 $18,297.6 $22,686.6 $28,272.7 $28,272.7 $28,272.7 $28,272.7 $28,272.7 $29,216.5 MINOR COMMUNITY CENTRES ($) Value of Equipment ($) UNIT COST Facility Name ($/sq.ft) Balmoral Recreation Centre $618,102 $618,102 $618,102 $618,102 $618,102 $618,102 $618,102 $618,102 $618,102 $618,102 $35 Brampton Curling Club $615,185 $615,185 $615,185 $615,185 $615,185 $615,185 $615,185 $615,185 $615,185 $615,185 $22 Centre for Sports Excellence (formerly McMurchy Pool) $1,377,555 $1,377,555 $1,377,555 $1,377,555 $1,377,555 $1,377,555 $1,377,555 $1,377,555 $1,377,555 $1,377,555 $36 Chinguacousy Curling Club $584,684 $584,684 $584,684 $584,684 $584,684 $584,684 $584,684 $708,383 $708,383 $708,383 $22 Ellen Mitchell Recreation Centre $462,105 $462,105 $462,105 $462,105 $462,105 $462,105 $462,105 $462,105 $462,105 $462,105 $33 Howden Recreation Centre $740,580 $740,580 $740,580 $740,580 $740,580 $740,580 $740,580 $740,580 $740,580 $740,580 $32 Loafer's Lake Recreation Centre $925,749 $925,749 $925,749 $925,749 $925,749 $925,749 $925,749 $925,749 $925,749 $925,749 $30 Total ($000) $5,324.0 $5,324.0 $5,324.0 $5,324.0 $5,324.0 $5,324.0 $5,324.0 $5,447.7 $5,447.7 $5,447.7
111 108 APPENDIX B.4 TABLE 1 - PAGE 5 RECREATION FACILITIES - EQUIPMENT INVENTORY OF CAPITAL ASSETS SENIOR CENTRES ($) Value of Equipment ($) UNIT COST Facility Name ($/sq.ft) Centennial Recreation Centre $198,568 $198,568 $198,568 $0 $0 $0 $0 $0 $0 $0 $26 FCCC Seniors Centre $0 $0 $389,261 $389,261 $389,261 $389, $389,261 $389,261 $389,261 $26 FCCC Seniors Centre Gymnasium $0 $0 $0 $0 $0 $0 $279,580 $279,580 $279,580 $279,580 $26 Knightbridge Community Centre $182,321 $182,321 $182,321 $182,321 $182,321 $182,321 $182,321 $182,321 $182,321 $182,321 $28 Snelgrove Community Centre $198,591 $198,591 $198,591 $198,591 $198,591 $198,591 $198,591 $198,591 $198,591 $198,591 $28 Total ($000) $579.5 $579.5 $968.7 $770.2 $770.2 $770.2 $1,049.8 $1,049.8 $1,049.8 $1,049.8 ARENAS ($) Value of Equipment ($) UNIT COST Facility Name ($/sq.ft) Memorial Arena $810,238 $810,238 $810,238 $810,238 $810,238 $810,238 $810,238 $810,238 $810,238 $810,238 $24 Victoria Park Arena $865,292 $865,292 $865,292 $865,292 $865,292 $865,292 $865,292 $865,292 $865,292 $865,292 $24 Total ($000) $1,675.5 $1,675.5 $1,675.5 $1,675.5 $1,675.5 $1,675.5 $1,675.5 $1,675.5 $1,675.5 $1,675.5 OTHER INDOOR FACILITIES ($) Value of Equipment ($) UNIT COST Facility Name ($/sq.ft) Alderlea $0 $0 $0 $0 $0 $0 $0 $0 $0 $304,590 $30 Avondale Community Centre $145,469 $145,469 $145,469 $145,469 $145,469 $145,469 $145,469 $145,469 $145,469 $145,469 $21 Brampton Tennis Club $29,572 $29,572 $29,572 $29,572 $29,572 $29,572 $29,572 $29,572 $29,572 $29,572 $26 Castlemore Bocce Courts $110,796 $110,796 $110,796 $110,796 $110,796 $110,796 $110,796 $110,796 $110,796 $110,796 $20 Castlemore Community Centre (former Fire Station 217) $0 $0 $0 $0 $0 $0 $0 $0 $23,635 $23,635 $25 Central Public School Recreation Centre $685,873 $685,873 $685,873 $685,873 $685,873 $685,873 $685,873 $685,873 $685,873 $685,873 $26 Chinguacousy Park Optimist Club and Ski Chalet (New) $0 $0 $0 $0 $0 $0 $0 $0 $584,569 $584,569 $32 Ebenezer Hall $39,547 $39,547 $39,547 $39,547 $39,547 $39,547 $39,547 $73,768 $73,768 $73,768 $26 FCCC - Dorm Building "D" $205,097 $205,097 $205,097 $205,097 $205,097 $205,097 $205,097 $205,097 $205,097 $205,097 $25 FCCC - Dorm Building "E" $198,208 $198,208 $198,208 $198,208 $198,208 $198,208 $198,208 $198,208 $198,208 $198,208 $27 FCCC - Dorm Building "F" $157,846 $157,846 $157,846 $157,846 $157,846 $157,846 $157,846 $157,846 $157,846 $157,846 $20 FCCC - Gymnasium $575,724 $575,724 $575,724 $575,724 $0 $0 $0 $0 $0 $0 $27 Ken Giles Recreation Centre $916,982 $916,982 $916,982 $916,982 $916,982 $916,982 $916,982 $916,982 $916,982 $916,982 $32 Mount Pleasant Community Centre $0 $0 $0 $0 $0 $0 $0 $66,518 $66,518 $66,518 $26 Norton Place Recreation Centre $35,846 $35,846 $35,846 $35,846 $35,846 $35,846 $35,846 $35,846 $35,846 $35,846 $27 Old Optimist Community Centre (Chinguacousy) $186,713 $186,713 $186,713 $186,713 $186,713 $186,713 $186,713 $0 $0 $0 $27 Professor's Lake Recreation Centre $414,318 $414,318 $414,318 $414,318 $414,318 $414,318 $414,318 $414,318 $414,318 $414,318 $32 Total ($000) $3,702.0 $3,702.0 $3,702.0 $3,702.0 $3,126.3 $3,126.3 $3,126.3 $3,040.3 $3,648.5 $3,953.1
112 109 APPENDIX B.4 TABLE 1 - PAGE 6 RECREATION FACILITIES - LAND INVENTORY OF CAPITAL ASSETS MAJOR COMMUNITY CENTRES # of Acres UNIT COST Facility Name ($/acre) Brampton Soccer Centre $700,000 Cassie Campell Community Centre $700,000 Century Gardens Recreation Complex $700,000 Chinguacousy Wellness Centre $700,000 Chris Gibson Recreation Centre $700,000 Earnscliffe Recreation Centre $700,000 Gore Meadows Community Centre $700,000 Greenbriar Recreation Centre $700,000 Jim Archdekin Recreation Centre $700,000 PowerAde Centre $700,000 South Fletcher's Sportsplex $700,000 Terry Miller Recreation Centre $700,000 Total (acres) Total ($000) $44,590.2 $44,590.2 $44,590.2 $53,774.2 $63,619.8 $63,616.0 $63,616.0 $63,616.0 $63,616.0 $67,256.0 MINOR COMMUNITY CENTRES (acres) # of Acres UNIT COST Facility Name ($/acre) Balmoral Recreation Centre $700,000 Brampton Curling Club $700,000 Centre for Sports Excellence (formerly McMurchy Pool) $700,000 Chinguacousy Curling Club $700,000 Ellen Mitchell Recreation Centre $700,000 Howden Recreation Centre $700,000 Loafer's Lake Recreation Centre $700,000 Total (acres) Total ($000) $10,710.0 $10,710.0 $10,710.0 $10,710.0 $10,710.0 $10,710.0 $10,710.0 $10,710.0 $10,710.0 $10,710.0
113 110 APPENDIX B.4 TABLE 1 - PAGE 7 RECREATION FACILITIES - LAND INVENTORY OF CAPITAL ASSETS OTHER INDOOR FACILITIES # of Acres UNIT COST Facility Name ($/acre) Alderlea $700,000 Avondale Community Centre $700,000 Brampton Tennis Club $1,000,000 Castlemore Bocce Courts $700,000 Castlemore Community Centre (former Fire Station 217) $700,000 Central Public School Recreation Centre $700,000 Ebenezer Hall $700,000 FCCC - Dorm Building "D" $700,000 FCCC - Dorm Building "E" $700,000 FCCC - Dorm Building "F" $700,000 FCCC - Gymnasium $700,000 Ken Giles Recreation Centre $700,000 Mount Pleasant Community Centre $700,000 Norton Place Recreation Centre $700,000 Optimist Community Centre $700,000 Professor's Lake Recreation Centre $700,000 Total (acres) Total ($000) $10,634.0 $10,634.0 $10,634.0 $10,634.0 $9,248.0 $9,248.0 $10,148.0 $11,527.0 $11,625.0 $11,625.0 SHARED GYMNASIUM FACILITIES # of Acres UNIT COST Facility Name ($/acre) Century Gardens Rec Ctr / Gordon Graydon Senior Elem $700,000 Huttonville Community Centre / Huttonville Elem. School $700,000 Jim Archdekin Rec Ctr / Heart Lake Secondary School $700,000 Ken Giles Community Ctr / Sir Wilfred Laurier Elem. School $700,000 Mount Pleasant Comm Ctr / MP Village Elementary School $700,000 Terry Miller Rec Ctr / Judith Nyman Secondary School $700,000 Total (acres) Total ($000) $1,680.0 $1,680.0 $1,680.0 $1,680.0 $1,680.0 $1,680.0 $1,680.0 $1,834.0 $1,834.0 $1,834.0
114 111 APPENDIX B.4 TABLE 1 - PAGE 8 RECREATION FACILITIES - LAND INVENTORY OF CAPITAL ASSETS SENIOR CENTRES # of Acres UNIT COST Facility Name ($/acre) Centennial Recreation Centre $700,000 FCCC Seniors Centre Gymnasium $700,000 FCCC Seniors Centre $700,000 Knightbridge Community Centre $700,000 Snelgrove Community Centre $700,000 Total (acres) Total ($000) $2,317.0 $2,317.0 $3,892.0 $3,185.0 $3,185.0 $3,185.0 $3,892.0 $3,892.0 $3,892.0 $3,892.0 ARENAS # of Acres UNIT COST Facility Name ($/acre) Memorial Arena $700,000 Victoria Park Arena $700,000 Total (acres) Total ($000) $4,172.0 $4,172.0 $4,172.0 $4,172.0 $4,172.0 $4,172.0 $4,172.0 $4,172.0 $4,172.0 $4,172.0
115 112 APPENDIX B.4 TABLE 1 - PAGE 9 RECREATION PARK FACILITIES INVENTORY OF CAPITAL ASSETS Major Soccer - Lighted # of Fields UNIT COST Park Name ($/Field) Avondale (Stadium) $573,730 Century Gardens Park $466,585 Chinguacousy $395,300 Chris Gibson Park $300,600 Creditview Sandalwood $300,600 Morris Kerbel District Park $466,585 Norton Place $395,300 Victoria Park (Stadium) $627,860 Subtotal (#) Subtotal ($) $3,047,530 $3,047,530 $3,621,260 $3,621,260 $4,222,460 $4,222,460 $3,431,860 $3,431,860 $3,431,860 $3,431,860 Major Diamond - Lighted # of Fields UNIT COST Park Name ($/Diamond) Blue Oak Park $710,520 Bramalea Community $710,520 Brampton Sports Park $710,520 Caterpillar Lands $465,565 Carabram Park $465,565 Century Gardens $465,565 Chinguacousy Park $465,565 Chris Gibson $465,565 Chris Gibson $974,465 Dave Dash (Fairgrounds) $974,465 Drinkwater Community Park $465,565 Duggan Park $465,565 Earnscliffe $710,520 Fairgrounds Park $710,520 Fletchers Green Park $465,565 FCCC $974,465 Moorehead Park $465,565 Morris Kerbel District Park $465,565 Morris Kerbel District Park $974,465 Norton Place Park $710,520 Rosalea Park $465,565 Sesquicentennial Park $710,520 Teramoto Park $974,465 Victoria Park $465,565 Subtotal (#) Subtotal ($) $22,426,930 $25,269,010 $23,406,750 $23,406,750 $23,915,650 $23,915,650 $22,984,520 $22,984,520 $22,984,520 $24,222,930
116 113 APPENDIX B.4 TABLE 1 - PAGE 10 RECREATION PARK FACILITIES INVENTORY OF CAPITAL ASSETS Artificial Turf Fields # of Fields UNIT COST Park Name ($/Field) Creditview Sandalwood (Major Lit Soccer) $953,680 Chinguacousy Park (Terry Fox Stadium / Lit Football) $1,726,010 Teramoto Park (Lit Football / Soccer) $437,500 Subtotal (#) Subtotal ($) $0 $0 $0 $0 $0 $0 $0 $1,726,010 $1,726,010 $4,070,870 Football # of Fields UNIT COST Park Name ($/Field) Lighted Chinguacousy Park $410,840 Creditview Sandalwood $371,770 Unlighted Chinguacousy Park $237,780 Creditview Sandalwood $198,710 Subtotal (#) Subtotal ($) $648,620 $410,840 $808,260 $397,420 $743,540 $743,540 $743,540 $743,540 $743,540 $743,540 Major Soccer - Unlighted # of Fields UNIT COST Park Name ($/Field) Blue Oak Park $70,130 Bramalea Ltd. Community Park $287,085 Cherrytree Park $70,130 Ching Sandalwood (Cassie Campbell) $287,085 Chinguacousy Park $241,790 Chris Gibson Park $91,100 Creditview Sandalwood $241,790 Dixie HWY 407 park $185,800 Dixie/Sandalwood $241,790 Eldorado Park $241,790 FCCC $241,790 Greenbriar Park S $241,790 Homestead Park $70,130 Leander Park $70,130 Loafer's Lake Park $241,790 Major Oaks Park $185,800 Northampton Park $70,130 Richvale Park $70,130 Subtotal (#) Subtotal ($) $3,759,880 $5,060,480 $7,064,930 $6,994,800 $7,085,390 $7,085,390 $6,360,020 $6,360,020 $6,360,020 $5,876,440
117 114 APPENDIX B.4 TABLE 1 - PAGE 11 RECREATION PARK FACILITIES INVENTORY OF CAPITAL ASSETS Minor Soccer - Unlighted # of Fields UNIT COST Park Name ($/Field) Balmoral Park $157,425 Batsman Park $157,425 Carabram Park $96,320 Centennial Park $157,425 Earnscliffe Park $157,425 FCCC $157,425 Fred Kline Park $157,425 Greenbriar Park S $157,425 Hilldale Park N $157,425 Jefferson park $16,990 Kingswood Park $96,320 Lafrance Park $16,990 Loafer's Lake Park $157,425 Mosswood Park $16,990 Sandalwood Park $96,320 Torbram Sandalwood Park $157,425 Valleybrook Park $96,320 Valleydown Park $16,990 Victoria Park $191,730 South Fletcher's $157,425 St. John Bosco $16,990 Grenoble $16,990 Subtotal (#) Subtotal ($) $2,366,510 $2,366,510 $2,209,085 $2,209,085 $2,366,510 $2,366,510 $2,366,510 $2,366,510 $2,523,935 $3,153,635 Mini Soccer - Unlighted # of Fields UNIT COST Park Name ($/Field) Armbro Park $16,990 Ashurst Park $16,990 Centennial Park $157,245 Central Public $157,245 Century Gardens Park $191,730 Ching Sandalwood (Cassie Campbell) $191,730 Chris Gibson Park $101,565 Creditview Sandalwood $101,565 D.M.G Ching Park $157,245 Dearborne Park $16,990 Dixie HWY 407 Park $101,565 Earnscliffe $157,245 FCCC $157,245 Fred Kee Park $157,245
118 115 APPENDIX B.4 TABLE 1 - PAGE 12 RECREATION PARK FACILITIES INVENTORY OF CAPITAL ASSETS Mini Soccer - Unlighted CONT'D # of Fields UNIT COST Park Name ($/Field) Hilldale Park N $157,245 Meadowlands Park $101,565 Seaborn Park $16,990 Sheridan Woodlands $16,990 South Fletcher's $157,245 Tobram Sandalwood $157,245 Weybridge Park $16,990 Subtotal (#) Subtotal ($) $3,543,500 $4,254,455 $5,437,145 $5,437,145 $7,707,545 $7,864,790 $7,864,790 $7,550,300 $7,235,810 $6,446,090 Major Diamond - Unlighted # of Fields UNIT COST Park Name ($/Diamond) Caterpillar Lands $196,715 Century Gardens Park $544,135 Conservation Drive Park $430,650 County Court Park $430,650 Duggan Park $430,650 Earnscliffe Park $196,715 Fallen Oak Park $430,650 Fred Kline Park $430,650 Madoc Drive Park $196,715 Major William Sharpe $196,715 Moorehead Park $430,650 Ray Lawson $196,715 Richvale Park $196,715 Sesquicentennial Park $544,135 Subtotal (#) Subtotal ($) $6,537,840 $6,537,840 $6,341,125 $6,341,125 $6,341,125 $5,947,695 $5,947,695 $5,947,695 $5,947,695 $5,947,695 Minor Diamond - Unlighted # of Fields UNIT COST Park Name ($/Diamond) Allan Kerbell Park $199,115 Armbro Park $96,705 Ashurst Park $96,705 Bach Park $96,705 Beatty -Fleming Park $96,705 Burton Park $199,115 Castlehill Park $96,705 Central Public $199,115 Cherrytree Park $96,705 Chris Gibson Park $168,880 Donnelly East Park $199,115 Earnscliffe Park $220,085
119 116 APPENDIX B.4 TABLE 1 - PAGE 13 RECREATION PARK FACILITIES INVENTORY OF CAPITAL ASSETS Minor Diamond - Unlighted CONT'D # of Fields UNIT COST Park Name ($/Diamond) Fred Kee Park $199,115 Fred Kline Park $199,115 Gatesgill $147,910 Greenbriar $220,085 Havelock Park $96,705 Hickory Wood Park $96,705 Jefferson Park $96,705 Kaneff Park $96,705 Kingswood Park $147,910 Knightsbridge Park $147,910 Loafer's Lake Park $199,115 Meadowlands Park $96,705 Nasmith Park $96,705 Notre Dame Park $96,705 Richvale Park $96,705 Sandalwood Park $147,910 Timberlane Park $96,705 White Spruce Park $147,910 Subtotal (#) Subtotal ($) $5,402,935 $5,402,935 $5,402,935 $5,306,230 $5,306,230 $5,306,230 $5,209,525 $5,209,525 $5,209,525 $5,209,525 Lighted Tennis # of Courts UNIT COST Park Name ($/Court) Century Gardens Park $87,350 Chinguacousy Park $85,780 County Court Park $101,120 Drinkwater Community Park $81,235 Earnscliffe Park $90,340 Greenbriar Park S $109,640 Howden $109,640 Morris Kerbel District Park $87,350 Richvale $92,015 Sandalwood Park $101,120 Steacy Park $90,340 Valleybrook $101,120 White Spruce Park $94,745 Cassie Campell $87,350 Subtotal (#) Subtotal ($) $3,508,365 $3,508,365 $3,147,005 $3,198,745 $3,548,145 $3,438,505 $3,438,505 $3,438,505 $3,438,505 $3,438,505
120 117 APPENDIX B.4 TABLE 1 - PAGE 14 RECREATION PARK FACILITIES INVENTORY OF CAPITAL ASSETS Unlighted Tennis # of Courts UNIT COST Park Name ($/Court) Allen Kerbel Park $67,015 Centennial Park $67,015 Clark Park $57,910 English St $57,910 Ken Park $57,910 Knightsbridge Park $57,910 Northwood Park $57,910 Peel Village Park $57,910 Vanier Park $57,910 Subtotal (#) Subtotal ($) $1,145,815 $1,145,815 $1,145,815 $1,145,815 $1,145,815 $1,145,815 $1,145,815 $1,145,815 $1,145,815 $1,145,815 Bocce # of Courts UNIT COST Park Name ($/Court) Lighted Calvert $19,120 Castlemore $30,410 Flower City COM $41,970 Wildfield- St.Johns $26,450 Unlighted County Court Park $31,690 Subtotal (#) Subtotal ($) $319,640 $319,640 $319,640 $319,640 $361,610 $361,610 $361,610 $361,610 $361,610 $361,610 Batting Cages # of Facilities UNIT COST Park Name ($/Cage) Century Gardens Park $63,445 Chinguacousy Park $63,445 Flower City Community Campus $63,445 Old Fair Grounds $63,445 Subtotal (#) Subtotal ($) $253,780 $253,780 $190,335 $126,890 $190,335 $190,335 $190,335 $126,890 $126,890 $126,890
121 118 APPENDIX B.4 TABLE 1 - PAGE 15 RECREATION PARK FACILITIES INVENTORY OF CAPITAL ASSETS Cricket # of Facilities UNIT COST Park Name ($/Facility) Brampton Sports Park $56,660 Batsman Park $162,490 Camden Park $15,280 Ching Sandalwood (Cassie Campbell) $162,490 Creditview/Sandalwood $104,980 Dixie/ $104,980 Dixie/Sandalwood $162,490 Earnscliffe $104,980 Flower City Community Campus $104,980 Teramoto Park $104,980 Torbram/Sandalwood $162,490 Subtotal (#) Subtotal ($) $510,240 $930,160 $1,140,120 $1,140,120 $1,465,100 $1,465,100 $1,570,080 $1,570,080 $1,570,080 $1,895,060 Rugby # of Facilities UNIT COST Park Name ($/Facility) Brampton Sports Park $157,430 Subtotal (#) Subtotal ($) $314,860 $314,860 $314,860 $314,860 $314,860 $314,860 $314,860 $314,860 $314,860 $314,860 Multi Purpose Courts # of Courts UNIT COST Park Name ($/Court) Allan Kerbel Park $29,605 Aloma Park $68,350 Blue Lake Parkette $68,350 Burnt Elm Park $68,350 Ching Sandalwood $68,350 Dearbourne Park $29,605 Dixie Sandalwood Park (west) $114,530 Dixie Sandalwood Park (east) $48,795 Earnscliffe Park $29,605 McMicking Park $68,350 Fairlawn Park $68,350 Fiddlers Parkette $29,605 Flower City Community Campus $68,350 Gore Meadows East $48,795 Howden Park $90,120 Minaker Park $68,350 Morris Kerbel Park $29,605 Peelton Park $29,605 Teramoto Park $90,120
122 119 APPENDIX B.4 TABLE 1 - PAGE 16 RECREATION PARK FACILITIES INVENTORY OF CAPITAL ASSETS Multi Purpose Courts CONT'D # of Courts UNIT COST Park Name ($/Court) Timberlane Park $29,605 Todd Edward Baylis Park $48,795 Treeline Park $68,350 Van Scott Parkette $68,350 Wiggins Park $68,350 Subtotal (#) Subtotal ($) $863,345 $863,345 $931,695 $1,192,975 $1,261,325 $1,192,975 $1,192,975 $1,192,975 $1,192,975 $1,380,685 Track # of Tracks UNIT COST Location ($/Track) Chinguacousy Park $246,280 Chinguacousy Park (in Terry Fox Stadium) $1,106,040 Teramoto Park $437,500 Subtotal (#) Subtotal ($) $246,280 $246,280 $246,280 $246,280 $246,280 $246,280 $0 $1,106,040 $1,106,040 $1,543,540 Wading Pools / Splashpads # of Pools/Splashpads UNIT COST Location ($/Facility) Batsman $160,700 Brampton Soccer Center $318,100 Cassie Campell $318,100 Century Gardens $318,100 Chinguacousy Park $498,300 Ernest Majury Park $160,700 Gage Park $160,700 Peel Village Park $160,700 Subtotal (#) Subtotal ($) $980,400 $980,400 $980,400 $1,298,500 $1,616,600 $1,616,600 $1,616,600 $1,934,700 $1,934,700 $2,095,400 Skateboard Parks # of Skateboard Parks UNIT COST Location ($/Facility) Ching Park E Skate Park $223,300 Ching Park E Skate Park $907,175 Gore Meadows Community Park - East $223,300 Jim Archdekin Recreation Ctr $109,300 Memorial Fairgrounds $223,300 South Fletchers Sports Complex $109,300 Worthington Park $109,300 Subtotal (#) Subtotal ($) $774,500 $774,500 $774,500 $1,458,375 $1,458,375 $1,458,375 $1,458,375 $1,458,375 $1,458,375 $1,681,675
123 120 APPENDIX B.4 TABLE 1 - PAGE 17 RECREATION PARK FACILITIES INVENTORY OF CAPITAL ASSETS Lacrosse # of Facilities UNIT COST Park Name ($/Facility) Creditview Sandalwood $42,975 Creditview Sandalwood Lit $210,510 FCCC $42,975 FCCC - Box Lacrosse $656,000 Subtotal (#) Subtotal ($) $85,950 $85,950 $171,900 $85,950 $1,077,020 $1,077,020 $1,077,020 $1,077,020 $1,077,020 $1,077,020 SHADE STRUCTURES # of Facilities UNIT COST Park Name ($/Structure) Albert Callaghan Memorial Park $59,000 Anne Nash Park $59,000 Barbreh Brown Park $59,000 Bayridge Park $59,000 Black Forest Park N $59,000 Black Forest Park S $59,000 Blue Lake Parkette $52,000 Blue Oak Park $59,000 Blue Oak Park $107,000 Bottomwood Park $59,000 Bramalea Ltd Com Pk $52,000 Bramalea Ltd Com Pk $59,000 Brampton-Marikina Friendship Park $59,000 Brampton Sports Park $59,000 Burnt Elm Park $59,000 Calderstone Park $59,000 Carabram Park $59,000 Castlehill Park $59,000 Centennial Park $59,000 Chris Gibson Park $59,000 Chudleigh Park $59,000 Cobblehill Park $59,000 Crystalview Park $59,000 Cunnington Parkette $59,000 D.M.G.Ching Pk $52,000 Damatta Park $59,000 Dixie / 407 City Park $79,000 Dixie Sandalwood Park $59,000 Earl Cook Parkette $59,000 Eldorado Park $79,000 Evening Stars Park $59,000 Fairlawn Park $59,000 Fallen Oak Park $59,000
124 121 APPENDIX B.4 TABLE 1 - PAGE 18 RECREATION PARK FACILITIES INVENTORY OF CAPITAL ASSETS SHADE STRUCTURES CONT'D # of Facilities UNIT COST Park Name ($/Structure) Fiddlers Parkette $59,000 Flower City Community Campus $59,000 Francis H. Taylor Pk $59,000 Gage Park (Bandshell) $107,000 George M. Lee Park $59,000 Giffen Family Park $59,000 Gladys And George Gray $59,000 Gold Parkette $59,000 Grey Whale Park $59,000 Halldorson Park $59,000 Harry A Sheilds Pkt $59,000 Havelock Park $59,000 Heartview Marsh $59,000 Hedgeline Parkette $59,000 Hickory Wood Park $79,000 Homestead Park $59,000 Iceland Park $59,000 J. And M. Mcgie Pk $59,000 James & Edna Davis Pk $59,000 James William Hewson $52,000 James William Hewson $59,000 Johnstone Park $59,000 Kanashiro Parkette $59,000 Kiwanis Memorial Park $79,000 Koretz Park $59,000 Lakelands Park $59,000 Lightcatcher Park $59,000 Lillie Roberts Park $79,000 Lloyd Sanderson Park $79,000 Lorenzo Park $59,000 Lougheed Park $59,000 Major William Sharpe $59,000 Matthew Cation Park $59,000 Mckinney Parkette $59,000 Mcmicking Park $59,000 Minaker Park $59,000 Morrow Park $59,000 Mountainash Park E $59,000 Northampton Park $59,000 Old Fairgrounds Park $59,000 RC Charlton Park $59,000 Riversedge Park $59,000
125 122 APPENDIX B.4 TABLE 1 - PAGE 19 RECREATION PARK FACILITIES INVENTORY OF CAPITAL ASSETS SHADE STRUCTURES CONT'D # of Facilities UNIT COST Park Name ($/Structure) Sled Dog Park $59,000 Sleightholme Park $59,000 Smirle Lawson Park $59,000 Snowcap Park $59,000 Teramoto Park $107,000 Timberlane Park $59,000 Tony Rinomato Park $59,000 Torbram Sandalwood $59,000 Treeline Park $59,000 Trudelle Parkette $59,000 Twin Falls Park $59,000 Upperlinks Park $59,000 Via Romano Parkette $59,000 Wiggins Park $59,000 Wiggins Park $79,000 Worthington Park $59,000 Subtotal (#) Shade Structures Subtotal ($) $1,836,000 $2,367,000 $2,721,000 $3,587,000 $3,823,000 $4,007,000 $3,962,000 $4,847,000 $5,486,000 $5,829,000 PLAY EQUIPMENT - JUNIOR # of Facilities UNIT COST Park Name ($/Structure) Bloomingdale Park $91,100 Bridekirk Park $91,100 Cantrill Park $91,100 Gladstone-Shaw Park $34,300 Hilldale Park North $34,300 Kindle Parkette $91,100 Richvale Park (South) $91,100 Southwell Parkette $34,300 Valleydown Park $91,100 Watchman Park $91,100 Subtotal (#) - Play Equipment - JUNIOR Subtotal ($) $615,200 $649,500 $649,500 $740,600 $740,600 $740,600 $740,600 $740,600 $740,600 $740,600
126 123 APPENDIX B.4 TABLE 1 - PAGE 20 RECREATION PARK FACILITIES INVENTORY OF CAPITAL ASSETS PLAY EQUIPMENT - SENIOR # of Facilities UNIT COST Park Name ($/Structure) Anderson Family Park $139,400 Beatty Fleming Park $139,400 Carleton Park $139,400 Dafoe Parkette $139,400 Donn Reynolds Parkette $139,400 Dumfries Parkette $139,400 Ezard Park $139,400 Fairhill Parkette $139,400 Francis H. Taylor Park $139,400 Gentry Park $139,400 Greenmount Park North $139,400 Jacksonville Park $139,400 Ken Park $139,400 Koretz Park $139,400 Loafer's Lake Park Loop $59,200 Maplehurst Parkette $139,400 Meadowlark Parkette $139,400 Newton Road Park $139,400 Notre Dame Park $139,400 Rollingwood Park $139,400 Rosepac Park $139,400 Scottsdale Parkette South $139,400 Sheridan Parkette $139,400 Softneedle Parkette $139,400 Suncrest Parkette $139,400 Thorndale Park $139,400 Turtle Creek Park $139,400 Subtotal (#) Play Equipment - SENIOR Subtotal ($) $2,927,400 $3,066,800 $3,066,800 $3,066,800 $3,345,600 $3,485,000 $3,485,000 $3,485,000 $3,485,000 $3,683,600 PLAY EQUIPMENT - COMBINED (JUNIOR / SENIOR) # of Facilities UNIT COST Park Name ($/Structure) Albert Callaghan Memorial Park $ 152,900 Allan Kerbel Park $ 152,900 Aloma Park $ 152,900 Anne Nash Park $ 152,900 Asa Hall Parkette $ 152,900 Bach Park $ 152,900 Banting Park $ 152,900 Barbreh Brown Park $ 152,900
127 124 APPENDIX B.4 TABLE 1 - PAGE 21 RECREATION PARK FACILITIES INVENTORY OF CAPITAL ASSETS PLAY EQUIPMENT - COMBINED (JUNIOR / SENIOR) CONT'D # of Facilities UNIT COST Park Name ($/Structure) Bayridge Park $ 152,900 Berisford Park $ 152,900 Black Forest Park South $ 152,900 Blackmere Parkette $ 152,900 Blue Lake Parkette $ 152,900 Blue Oak Park $ 152,900 Boreham Park $ 152,900 Bottomwood Park $ 152,900 Brighton Parkette $ 34,300 Brookbank Parkette $ 152,900 Bruce Beer Park $ 152,900 Buick Park $ 152,900 Burnt Elm Park $ 152,900 Burton Park $ 152,900 Calderstone Park $ 152,900 Camden Park (East) $ 152,900 Camden Park (West) $ 152,900 Carabram Park $ 152,900 Caruso Park $ 152,900 Centennial Park $ 152,900 Chamney Court Parkette $ 152,900 Chinguacousy Lions Club Water Tower Park $ 152,900 Chinguacousy Sandalwood Park $ 152,900 Chris Gibson Park (North) $ 152,900 Chris Gibson Park (South) $ 152,900 Churchville Park $ 152,900 Clark Park $ 152,900 Clover Bloom Parkette $ 152,900 Cobblehill Park $ 152,900 Conservation Drive Park $ 152,900 County Court Park $ 152,900 Crenshaw Parkette $ 152,900 Crescent Hill Park $ 152,900 Cresthaven park $ 152,900 Crown Victoria Parkette $ 152,900 Gladys and George Gray Park $ 152,900 Crystalview Park $ 152,900 Cunnington Park $ 152,900 Curtis Park $ 152,900 Cutters Parkette $ 152,900 Damatta Park $ 152,900 Dearbourne Park $ 152,900 Dexfield Park $ 152,900 Dixie Sandalwood Park $ 211,100
128 125 APPENDIX B.4 TABLE 1 - PAGE 22 RECREATION PARK FACILITIES INVENTORY OF CAPITAL ASSETS PLAY EQUIPMENT - COMBINED (JUNIOR / SENIOR) CONT'D # of Facilities UNIT COST Park Name ($/Structure) Donnelly Park $ 152,900 Donwoods Parkette $ 152,900 Dorchester Park $ 152,900 Dorset Park $ 152,900 Drinkwater Community Park $ 152,900 Duggan Park $ 152,900 Earl Cook Parkette $ 152,900 Earnscliffe Park $ 152,900 Eastbourne Park $ 152,900 Egerton Park $ 152,900 English Street Park $ 152,900 Ernest and Edith Parr Parkette $ 152,900 Ernest Majury Park $ 152,900 Evening Stars Park $ 152,900 Fairgrounds Park $ 152,900 Fairlawn Park $ 152,900 Fallen Oak Park $ 152,900 Fallingdale Park $ 152,900 Fanshawe Parkette $ 152,900 Fern Valley Parkette $ 152,900 Fernforest Way West $ 152,900 Ferri Parkette $ 152,900 Fiddlers Parkette $ 152,900 Fletcher's Parkette $ 152,900 Frank Harkema Park $ 152,900 Fred Kee Park $ 152,900 Fred Kline Park $ 152,900 Gage Park $ 152,900 Gatesgill Park $ 152,900 George M. Lee Park $ 152,900 George Ransier Park $ 152,900 Giffen Family Park $ 152,900 Glenforest Park South $ 152,900 Glenmanor Park $ 152,900 Gold Parkette $ 152,900 Greenbriar Park South $ 152,900 Harry A. Shields Parkette $ 152,900 Havelock Park $ 152,900 Hazelwood Park South $ 152,900 Heartview Marsh $ 152,900 Hedgeline Parkette $ 152,900 Hickory Wood Park $ 152,900 Hilldale Park South $ 152,900 Homestead Park $ 152,900
129 126 APPENDIX B.4 TABLE 1 - PAGE 23 RECREATION PARK FACILITIES INVENTORY OF CAPITAL ASSETS PLAY EQUIPMENT - COMBINED (JUNIOR / SENIOR) CONT'D # of Facilities UNIT COST Park Name ($/Structure) Howden Park $ 152,900 Iceland Parkette $ 152,900 Inder Heights Park $ 152,900 Ironblock Park $ 152,900 Ivy Bridge Parkette $ 152,900 Jacob Shook Park $ 152,900 James and Edna Davis Park $ 152,900 James and Margaret McGie Park $ 152,900 James William Hewson Park $ 152,900 Jefferson Park $ 152,900 Jellicoe Parkette $ 152,900 Johnstone Park $ 152,900 Jordan Park $ 152,900 JP Hutton Park $ 152,900 Kanashiro Parkette $ 152,900 Keirstead Park $ 152,900 Kincaid Parkette $ 152,900 Kingfisher Park $ 152,900 Kingswood Park $ 152,900 Knightsbridge Park $ 152,900 La France Park $ 152,900 Lake Louise Parkette $ 152,900 Larande Park $ 152,900 Lascelles Park $ 152,900 Laurelcrest Park North $ 152,900 Leander Park $ 152,900 Lethbridge Park $ 152,900 Lightcatcher Park $ 152,900 Lloyd Sanderson Park $ 152,900 Loafer's Lake Park $ 152,900 Lorenzo Park $ 152,900 Lougheed Park $ 152,900 Major William Sharpe Park $ 152,900 Manitou Park $ 152,900 Manorcrest Park $ 152,900 Martindale Parkette $ 152,900 Mary Goodwillie Young Park $ 152,900 Matthew Cation Park $ 152,900 Maxwell and Lois Rice Park $ 152,900 McKinney Parkette $ 152,900 McMicking Park $ 152,900 Meadowland Park $ 152,900 Millstone Parkette $ 152,900 Minaker Park $ 152,900
130 127 APPENDIX B.4 TABLE 1 - PAGE 24 RECREATION PARK FACILITIES INVENTORY OF CAPITAL ASSETS PLAY EQUIPMENT - COMBINED (JUNIOR / SENIOR) CONT'D # of Facilities UNIT COST Park Name ($/Structure) Morris Kerbel Park $ 152,900 Morrow Park $ 152,900 Mosswood Park $ 152,900 Mount Pleasant Square $ 152,900 Mountainash Park $ 152,900 Murray Street Park $ 152,900 Nancy McCredie Park $ 152,900 Nasmith Park $ 152,900 Native Landing Parkette $ 152,900 Northampton Park (North) $ 152,900 Northampton Park (South) $ 152,900 Norton Place Park $ 152,900 Omega Parkette $ 152,900 Patrick O'Leary Park $ 152,900 Peddle Family Wood $ 152,900 Peel Village Park $ 152,900 Piane Park $ 152,900 Picasso Park $ 152,900 Pickard Park $ 152,900 Professor's Lake Park (East) $ 152,900 Professor's Lake Park (West) $ 152,900 Professor's Lake Waterslide $ 152,900 Ravenscliffe Parkette $ 152,900 Reed Parkette $ 152,900 Richvale Park (North) $ 152,900 Ridgehill Park $ 152,900 River Heights Park $ 152,900 Robert Reid Park & Trail $ 152,900 Roehampton Park $ 152,900 Royal Salisbury Parkette $ 152,900 RM Wells Park $ 152,900 Rushmore Parkette $ 152,900 Salisbury Circle Parkette $ 152,900 Seaborn Park $ 152,900 Sheridan Woodlands $ 152,900 Sid Manser Park $ 152,900 Sled Dog Park $ 152,900 Sleightholme Park $ 152,900 Snowcap Park $ 152,900 Sparrow Park $ 152,900 Stillman Park $ 152,900 Summer Valley Parkette $ 152,900 Sunforest Parkette $ 152,900 Sunny Meadow Parkette $ 152,900
131 128 APPENDIX B.4 TABLE 1 - PAGE 25 RECREATION PARK FACILITIES INVENTORY OF CAPITAL ASSETS PLAY EQUIPMENT - COMBINED (JUNIOR / SENIOR) CONT'D # of Facilities UNIT COST Park Name ($/Structure) Talbot Park $ 152,900 Tara Park $ 152,900 Timberlane Park $ 152,900 Todd Edward Baylis Park $ 152,900 Tony Rinomato Park $ 152,900 Torbram Sandalwood Community Park $ 152,900 Trailside Park $ 152,900 Treeline Park $ 152,900 Treleaven Park $ 152,900 Trudelle Parkette $ 152,900 Tumbleweed Parkette $ 152,900 Twin Falls Park $ 152,900 Upperlink Park $ 152,900 Upwood Park $ 152,900 Valleybrook Park $ 152,900 Van Scott Parkette $ 152,900 Via Romano Parkette $ 152,900 W.A. Russell Parkette $ 152,900 Watson Valley (East) $ 152,900 Watson Valley (West) $ 152,900 Weybridge Park $ 152,900 Whitewash Parkette $ 152,900 Wiggins Park $ 152,900 William Porter Park $ 82,200 William Sheard Park $ 152,900 Winterfold Park $ 152,900 Woodview Park $ 152,900 Subtotal (#) Play Equipment - COMBINED (JUNIOR / SENIOR) Subtotal ($) $23,122,200 $25,721,500 $26,486,000 $28,073,200 $28,837,700 $29,449,300 $29,908,000 $30,754,700 $31,060,500 $31,672,100
132 129 APPENDIX B.4 TABLE 1 - PAGE 26 RECREATION PARK FACILITIES INVENTORY OF CAPITAL ASSETS PLAY EQUIPMENT - BARRIER FREE # of Facilities UNIT COST Park Name ($/Structure) Armbro Park $ 160,700 Batsman Park $ 236,200 Beaconsfield Park $ 160,700 Bramalea Ltd. Community Park $ 160,700 Brampton-Marikina Friendship Park $ 160,700 Castlehill Park $ 160,700 Century Gardens Park $ 236,200 Chudliegh Park $ 160,700 Donald M. Gordon Chinguacousy Park (East) $ 236,200 Donald M. Gordon Chinguacousy Park (West) $ 160,700 Durham Park $ 160,700 Eldorado Park (East) $ 160,700 Eldorado Park (West) $ 160,700 Folkstone Park $ 160,700 Goldcrest Park $ 160,700 Gore Meadows Community Park - East $ 160,700 Great Lakes Park $ 160,700 Grey Whale Park $ 160,700 Halldorson Park $ 160,700 Haverty Parkette $ 160,700 Henry Verschuren Park $ 160,700 Joseph Lawson Park $ 160,700 Kingknoll Park $ 160,700 Lakelands Park $ 160,700 Lillie Roberts Park $ 160,700 Lorenville Park $ 160,700 Luongo Park $ 160,700 Massey Park $ 160,700 Maybeck Park $ 160,700 Merganser Parkette $ 160,700 Moorehead Park $ 160,700 Northwood Park $ 160,700 Purple Lilac Park $ 160,700 RC Charlton Park $ 160,700 Riversedge Park $ 160,700 Smirle 'Big Train' Lawson Park $ 160,700 Stemford Parkette $ 160,700 Teramoto Park $ 236,200 Vanier Park $ 160,700 Worthington Park $ 160,700 Subtotal (#) Play Equipment - BARRIER FREE Subtotal ($) $3,289,500 $3,289,500 $3,610,900 $4,253,700 $4,575,100 $4,575,100 $4,575,100 $4,972,000 $6,011,700 $6,730,000 Total All Facilities (#) Total All Facilities ($) $88,527,220 $96,866,995 $100,188,240 $103,963,265 $111,695,915 $112,216,740 $109,945,335 $114,846,150 $116,673,585 $122,818,945
133 130 APPENDIX B.4 TABLE 1 - PAGE 27 RECREATION OUTDOOR BUILDINGS INVENTORY OF CAPITAL ASSETS # of Square Feet UNIT COST OUTDOOR BUILDINGS (sq.ft.) ($/sq.ft) Batsman Park Comfort Station ,142 $320 Brampton Cemetery Mtce Bldg ,470 $360 Brampton Cemetary Office $248 Century Gardens Fieldhouse 4,141 4,141 4,141 4, $247 Chinguacousy Park Parks building 3,502 3,502 3,502 3,502 3,502 3,502 3,502 3,502 3,502 3,502 $186 Ching. Ski-hill Pump House $186 Ching. Ski-hill Rope-tow Hut $186 Ching. Ski-hill T-bar Line Hut $186 Chinguacousy Park Mini Golf / Snack Bar 3,385 3,385 3,385 3,385 3,385 3,385 3,385 3,385 3,385 3,385 $186 Chinguacousy Park Garage 2,625 2,625 2,625 2,625 2,625 2,625 2,625 2,625 2,625 2,625 $186 Chinguacousy Park Tennis & Baseball Storage $186 Chinguacousy Park Splash Pad Buildings $186 Chinguacousy Sports Box $186 Chinguacousy Park Track Building 2,200 2,200 2,200 2,200 2,200 2,200 2,200 2,200 $186 Chinguacousy Park Track and Field Bleachers / Scorebox ,136 10,136 10,136 $186 Chinguacousy Wellness Centre Fieldhouse $186 County Court Field House 1,299 1,299 1,299 1,299 1,299 1,299 1,299 1,299 1,299 1,299 $296 Crescent Hill Storage Bldg 2, $186 Duggan Park Field House 1,681 1,681 1,681 1,681 1,681 1,681 1,681 1,681 1,681 1,681 $273 Earnscliffe Storage Shed $186 Eldorado Parks Shed $186 Eldorado Storage Well Building $186 Ellen Street Parks Garage $186 Fairgrounds Park Indoor Batting Cages 2,354 2,354 2,354 2,354 2,354 2,354 2,354 2,354 2,354 2,354 $186 Fairgrounds Park Scorebox / Snack Bar / Washrooms $309 FCCC Parks Warehouse 4,718 4,718 4,718 4,718 4,718 4,718 4,718 4,718 4,718 4,718 $186 FCCC OPP - Greenhouse (Chapel Building) 4,162 4,162 4,162 4,162 4, $186
134 131 APPENDIX B.4 TABLE 1 - PAGE 28 RECREATION OUTDOOR BUILDINGS INVENTORY OF CAPITAL ASSETS # of Square Feet UNIT COST OUTDOOR BUILDINGS (sq.ft.) CONT'D ($/sq.ft) Fred Kline Field House $186 Glidden Parks Operation Centre ,363 64,363 64,363 64,363 $195 Loafer's Lake Sheds $186 Norton Park Shed $186 Orenda Road Parks Operation Centre 24,698 24,698 24,698 24,698 24,698 24, $186 Orenda Parks West Building 7,115 7,115 7,115 7,115 7,115 7,115 7,115 7,115 7,115 7,115 $186 Peel Village Pumphouse $186 Peel Village Golf Course Garage 1,809 1,809 1,809 1,809 1,809 1,809 1,809 1,809 1,809 1,809 $186 Quonset Hut/Ogada Wilderness Centre 3,600 3,600 3,600 3,600 3,600 3,600 3, $186 Roselea Tennis Clubhouse & Storage $186 Rotary Club House Sheds $186 Sesquicentennial Park Depot 7,265 7,265 7,265 7,265 7,265 7,265 7,265 7,265 7,265 7,265 $186 Teramoto Parks Depot ,063 9,063 $176 Valleybrook Fieldhouse $186 Victoria Park Shed $186 Total (sq.ft.) 88,177 85,453 85,394 84,463 80,652 76, , , , ,083 Total ($000) $17,258.2 $16,750.8 $16,739.8 $16,566.4 $15,625.1 $14,850.0 $22,763.5 $23,868.7 $24,972.1 $26,204.1
135 132 APPENDIX B.4 TABLE 1 - PAGE 29 RECREATION OUTDOOR BUILDINGS INVENTORY OF CAPITAL ASSETS # of Acres UNIT COST LAND FOR OUTDOOR BUILDINGS (acres) ($/acre) Batsman Park Comfort Station ,000 Brampton Cemetery Mtce Bldg ,000 Brampton Cemetary Office ,000 Century Gardens Fieldhouse ,000 Chinguacousy Park Parks building ,000 Ching. Ski-hill Pump House ,000 Ching. Ski-hill Rope-tow Hut ,000 Ching. Ski-hill T-bar Line Hut ,000 Chinguacousy Park Mini Golf / Snack Bar ,000 Chinguacousy Park Garage ,000 Chinguacousy Park Tennis & Baseball Storage ,000 Chinguacousy Park Splash Pad Buildings ,000 Chinguacousy Sports Box ,000 Chinguacousy Park Track Building ,000 Chinguacousy Park Track and Field Bleachers / Scorebox ,000 Chinguacousy Wellness Centre Fieldhouse ,000 County Court Field House ,000 Crescent Hill Storage Bldg ,000 Duggan Park Field House ,000 Earnscliffe Storage Shed ,000 Eldorado Parks Shed ,000 Eldorado Storage Well Building ,000 Ellen Street Parks Garage ,000 Fairgrounds Park Indoor Batting Cages ,000 Fairgrounds Scorebox / Snack Bar / Washrooms ,000 FCCC Parks Warehouse ,000 FCCC OPP - Greenhouse (Chapel Building) ,000
136 133 APPENDIX B.4 TABLE 1 - PAGE 30 RECREATION OUTDOOR BUILDINGS INVENTORY OF CAPITAL ASSETS # of Acres UNIT COST LAND FOR OUTDOOR BUILDINGS (acres) CONT'D ($/acre) Fred Kline Field House ,000 Glidden Parks Operations Centre ,000 Loafer's Lake Sheds ,000 Norton Park Shed ,000 Orenda Road Parks Operation Centre ,000 Orenda Parks West Building ,000 Peel Village Pumphouse ,000 Peel Village Golf Course Garage ,000 Quonset Hut/Ogada Wilderness Centre ,000 Roselea Tennis Clubhouse & Storage ,000,000 Rotary Club House Sheds ,000 Sesquicentennial Park Depot ,000 Teramoto Parks Depot ,000 Valleybrook Field House ,000 Victoria Park Shed ,000 Total (acres) Total ($000) $9,018.0 $8,640.0 $8,640.0 $8,605.0 $8,605.0 $8,416.0 $9,865.0 $9,858.0 $11,531.0 $11,671.0
137 134 APPENDIX B.5 TABLE 1 - PAGE 31 RECREATION OUTDOOR BUILDINGS INVENTORY OF CAPITAL ASSETS EQUIPMENT FOR OUTDOOR BUILDINGS Total Value of Equipment for Outdoor Buildings ($000) Description Brampton Cemetery Mtce Bldg $13.1 $13.1 $13.1 $13.1 $13.1 $13.1 $13.1 $13.1 $13.1 $13.1 Brampton Cemetary Office $21.5 $21.5 $21.5 $21.5 $21.5 $21.5 $21.5 $21.5 $21.5 $21.5 Ellen Street Parks Garage $15.5 $15.5 $15.5 $15.5 $15.5 $15.5 $15.5 $15.5 $15.5 $15.5 Century Gardens Fieldhouse $71.3 $71.3 $71.3 $71.3 $5.7 $5.7 $5.7 $5.7 $0.0 $0.0 Chinguacousy Park Parks building $60.3 $60.3 $60.3 $60.3 $60.3 $60.3 $60.3 $60.3 $60.3 $60.3 Ching. Ski-hill Pump House $8.7 $8.7 $8.7 $8.7 $8.7 $8.7 $8.7 $8.7 $8.7 $8.7 Ching. Ski-hill Rope-tow Hut $2.6 $2.6 $2.6 $2.6 $2.6 $2.6 $2.6 $0.0 $0.0 $0.0 Ching. Ski-hill T-bar Line Hut $1.0 $1.0 $0.0 $0.0 $0.0 $0.0 $0.0 $0.0 $0.0 $0.0 Chinguacousy Park Mini Golf / Snack Bar $58.3 $58.3 $58.3 $58.3 $58.3 $58.3 $58.3 $58.3 $58.3 $58.3 Chinguacousy Park Garage $45.2 $45.2 $45.2 $45.2 $45.2 $45.2 $45.2 $45.2 $45.2 $45.2 Chinguacousy Park Wading Pool Buildings $4.9 $4.9 $4.9 $4.9 $4.9 $4.9 $4.9 $4.9 $4.9 $4.9 Chinguacousy Sports Box $7.7 $7.7 $7.7 $7.7 $7.7 $7.7 $7.7 $0.0 $0.0 $0.0 Chinguacousy Park Track Building $0.0 $0.0 $0.0 $0.0 $0.0 $0.0 $0.0 $0.0 $0.0 $0.0 County Court Field House $22.4 $22.4 $22.4 $22.4 $22.4 $22.4 $22.4 $22.4 $22.4 $22.4 Crescent Hill Storage Bldg $46.9 $0.0 $0.0 $0.0 $0.0 $0.0 $0.0 $0.0 $0.0 $0.0 Duggan Park Fieldhouse $28.9 $28.9 $28.9 $28.9 $28.9 $28.9 $28.9 $28.9 $28.9 $28.9 Earnscliffe Storage Shed $16.0 $16.0 $16.0 $0.0 $0.0 $0.0 $0.0 $0.0 $0.0 $0.0 Eldorado Parks Shed $8.6 $8.6 $8.6 $8.6 $8.6 $8.6 $8.6 $8.6 $8.6 $8.6 Eldorado Storage Well Building $0.6 $0.6 $0.6 $0.6 $0.6 $0.6 $0.6 $0.6 $0.6 $0.6 Eldorado Well Holding Tank Building $0.0 $0.0 $0.0 $0.0 $0.0 $0.0 $0.0 $0.0 $0.0 $0.0 Fred Kline Fieldhouse $8.6 $8.6 $8.6 $8.6 $8.6 $8.6 $8.6 $8.6 $8.6 $8.6 Glidden Parks Operations Centre $0.0 $0.0 $0.0 $0.0 $0.0 $0.0 $511.1 $511.1 $511.1 $511.1 Loafer's Lake Sheds $8.6 $8.6 $8.6 $8.6 $8.6 $8.6 $8.6 $8.6 $8.6 $8.6 Northwood Park Wading Pool $0.0 $0.0 $0.0 $0.0 $0.0 $0.0 $0.0 $0.0 $0.0 $0.0 Norton Park Shed $27.2 $27.2 $27.2 $27.2 $27.2 $27.2 $27.2 $27.2 $27.2 $27.2 Orenda Road Parks Operation Centre $511.1 $511.1 $511.1 $511.1 $511.1 $511.1 $0.0 $0.0 $0.0 $0.0 OPP - Helicopter Hanger (Park Maintenance) $81.2 $81.2 $81.2 $81.2 $0.0 $0.0 $0.0 $0.0 $0.0 $0.0 OPP - Greenhouse (Chapel Building) $71.6 $71.6 $71.6 $71.6 $71.6 $0.0 $0.0 $0.0 $0.0 $0.0 Peel Village Golf Course Garage $31.1 $31.1 $31.1 $31.1 $31.1 $31.1 $31.1 $31.1 $31.1 $31.1 Rotary Club House & Shed $22.0 $22.0 $22.0 $22.0 $22.0 $22.0 $22.0 $22.0 $22.0 $22.0 Valleybrook Field House $3.6 $3.6 $3.6 $3.6 $3.6 $3.6 $3.6 $3.6 $3.6 $3.6 Victoria Park Shed $1.9 $1.9 $1.9 $1.9 $1.9 $1.9 $1.9 $1.9 $1.9 $1.9 White Spruce Park Storage Bldg. $0.0 $0.0 $0.0 $0.0 $0.0 $0.0 $0.0 $0.0 $0.0 $0.0 Chinguacousy Wellness Centre Fieldhouse $8.6 $8.6 $8.6 $8.6 $8.6 $8.6 $8.6 $8.6 $8.6 $8.6 Memorial Snack Bar/Washrooms $8.6 $8.6 $8.6 $8.6 $8.6 $8.6 $8.6 $8.6 $8.6 $8.6 Quonset Hut/Ogada Wilderness Centre $62.0 $62.0 $62.0 $62.0 $62.0 $62.0 $62.0 $0.0 $0.0 $0.0 Chinguacousy Park Tennis & Baseball Storage $10.6 $10.6 $10.6 $10.6 $10.6 $10.6 $10.6 $10.6 $10.6 $10.6 Sesquicentennial Park Fieldhouse $0.0 $0.0 $0.0 $0.0 $80.9 $80.9 $80.9 $80.9 $80.9 $80.9 Park Maintenance Equipment $1,728.1 $2,009.8 $2,228.6 $2,499.0 $2,708.4 $2,708.4 $2,708.4 $2,708.4 $2,708.4 $2,708.4 Total ($000) $3,018.2 $3,253.1 $3,470.9 $3,725.3 $3,868.7 $3,797.1 $3,797.1 $3,724.8 $3,719.1 $3,719.1
138 135 APPENDIX B.4 TABLE 1 - PAGE 32 RECREATION OUTDOOR MAINTENANCE EQUIPMENT INVENTORY OF CAPITAL ASSETS # of Equipment UNIT COST MAINTENANCE EQUIPMENT (#'s) ($/equip) Aerator $4,400 Aerator (Verti Drain) $24,750 Air Compressor $810 Aquacide $20,100 Att - Aerator $6,300 Att - Blower $2,100 Att - Edger $1,530 Att - Mott $5,000 Att - Mower $2,000 Att - Overseeder $16,000 Att - Renovator $26,800 Att - Roller $3,600 Att - Trailer Roller $8,800 Att - Rotary Mower $2,200 Att - Spreader $5,700 Att - Tiller $7,200 Att - Topdresser $31,400 Att - Groomer $5,500 Auger $890 Auger - Power $5,400 Backpack Blower $410 Blower - Handheld $190 Blower - Little Wonder $1,300 Boat Motor $1,800 Box Blade $3,750 Brush Trimmer $1,200 Chainsaw - Regular $470 Concrete Saw $1,200
139 136 APPENDIX B.4 TABLE 1 - PAGE 33 RECREATION OUTDOOR MAINTENANCE EQUIPMENT INVENTORY OF CAPITAL ASSETS # of Equipment UNIT COST MAINTENANCE EQUIPMENT (#'s) CONT'D ($/equip) Dethatcher $2,400 Drill $700 Edger $940 Forklift $16,700 Gator $14,200 Gator Pro $44,200 Generator $3,000 Gill $2,800 Golf Cart $4,900 Groomer $5,400 Handheld Blower $190 Hedge Trimmer $370 Ice Edger $5,800 Infielder $6,280 Lawn Mower $540 Lazer $2,800 Lely Spreader $5,400 Madvac $50,400 Mower - Walker $16,900 Painter $200 Polesaw $440 Post Pounder $1,500 Power Broom $530 Power Sweeper $690 Pressure Washer $870 Pump $1,640
140 137 APPENDIX B.4 TABLE 1 - PAGE 34 RECREATION OUTDOOR MAINTENANCE EQUIPMENT INVENTORY OF CAPITAL ASSETS # of Equipment UNIT COST MAINTENANCE EQUIPMENT (#'s) CONT'D ($/equip) Rainboy $6,650 Roller $6,290 Sandsifter $13,960 Seeder - walk behind $1,800 Snowblower $1,900 Snowmobile $2,400 Sod Cutter $4,900 Soil Pulverizer $2,300 Sprayer $7,500 Spreader - walk behind $240 Steamer $7,000 String Trimmer $310 Stump Grinder $5,900 Sweeper $43,300 Tamper $1,500 Tiller $1,710 Topdresser $12,850 Tractor $23,800 Trailer $11,600 Trencher $8,700 Verti Drain $23,900 Walk Behind Blower $1,420 Walk Behind Sweeper $3,880 Water Cart $1,380 Winch $1,700 Total (#) Total ($000) $1,467.8 $1,602.4 $1,746.8 $1,952.9 $2,087.3 $2,175.3 $2,310.8 $2,334.3 $2,061.4 $2,109.0
141 138 APPENDIX B.4 TABLE 1 - PAGE 35 RECREATION SPECIAL FACILITIES INVENTORY OF CAPITAL ASSETS Total Value of Miscellaneous Special Facilities ($000) Miscellaneous Special Facilities ($000) Brampton Sports Park Box Ball Hockey $0.0 $0.0 $0.0 $0.0 $597.0 $597.0 $597.0 $597.0 $597.0 $597.0 Century Gardens Lawn Bowling Club $1,274.0 $1,274.0 $1,274.0 $1,274.0 $1,274.0 $1,274.0 $1,274.0 $1,274.0 $1,274.0 $1,274.0 Chinguacousy Bandshell $776.0 $776.0 $776.0 $0.0 $0.0 $0.0 $0.0 $0.0 $0.0 $0.0 Chinguacousy Boathouse $0.0 $0.0 $0.0 $0.0 $0.0 $0.0 $0.0 $0.0 $2,316.0 $2,316.0 Chinguacousy Formal Gardens $4,580.0 $4,580.0 $4,580.0 $4,580.0 $4,580.0 $4,580.0 $4,580.0 $4,580.0 $4,580.0 $4,580.0 Chinguacousy Greenhouses/ Barns, Paddocks, Parks Ops $3,738.0 $3,738.0 $3,738.0 $3,738.0 $3,738.0 $3,738.0 $3,738.0 $3,738.0 $3,738.0 $3,738.0 Chinguacousy Mini-Golf $326.0 $326.0 $326.0 $326.0 $326.0 $326.0 $585.0 $585.0 $585.0 $585.0 Chinguacousy Winter Tennis Centre $3,590.0 $3,590.0 $3,590.0 $3,590.0 $3,590.0 $3,590.0 $3,590.0 $4,265.0 $4,265.0 $4,265.0 Chinguacousy Sandalwood Wet Field Hockey $0.0 $0.0 $0.0 $0.0 $0.0 $0.0 $0.0 $0.0 $0.0 $1,631.4 Civic Centre Outdoor Rink $1,042.0 $1,042.0 $1,042.0 $1,042.0 $1,042.0 $1,042.0 $1,042.0 $0.0 $0.0 $0.0 Creditview Sandalwood Field House $1,800.0 $1,800.0 $1,800.0 $1,800.0 $1,800.0 $1,800.0 Eldorado Outdoor Pool $866.0 $866.0 $866.0 $866.0 $866.0 $866.0 $866.0 $866.0 $866.0 $866.0 Eldorado Pavillion $954.5 $954.5 $954.5 $954.5 $954.5 $954.5 $954.5 $954.5 $954.5 $954.5 Ezard Park Silo $173.1 $173.1 $173.1 $173.1 $173.1 $173.1 $173.1 $173.1 $173.1 $173.1 FCCC Lawn Bowling $0.0 $0.0 $0.0 $0.0 $0.0 $0.0 $0.0 $3,864.0 $3,864.0 $3,864.0 Gage Park Artif. Ice/Fieldhse $3,464.0 $3,464.0 $3,464.0 $3,464.0 $3,464.0 $3,464.0 $3,464.0 $3,464.0 $3,464.0 $3,464.0 Mount Pleasant Ice Skating / Reflecting Pond $0.0 $0.0 $0.0 $0.0 $0.0 $0.0 $0.0 $806.0 $806.0 $806.0 Peel Village Golf - Clubhouse $810.0 $810.0 $810.0 $810.0 $810.0 $810.0 $810.0 $810.0 $810.0 $ Development (# holes) $2,673.0 $2,673.0 $2,673.0 $2,673.0 $2,673.0 $2,673.0 $2,673.0 $2,673.0 $2,673.0 $2,673.0 Sesquicentennial Park Field House $2,902.5 $2,902.5 $2,902.5 $2,902.5 $2,902.5 $2,902.5 Teramoto Comfort Station $0.0 $0.0 $0.0 $0.0 $0.0 $0.0 $0.0 $0.0 $684.3 $684.3 Total ($000) $24,266.6 $24,266.6 $24,266.6 $23,490.6 $28,790.1 $28,790.1 $29,049.1 $33,352.1 $36,352.3 $37,983.7
142 139 APPENDIX B.4 TABLE 1 - PAGE 36 RECREATION SPECIAL FACILITIES INVENTORY OF CAPITAL ASSETS # of Acres UNIT COST Miscellaneous Special Facilities (acres) ($/acre) Brampton Sports Park Box Ball Hockey $700,000 Century Gardens Lawn Bowling Club $700,000 Chinguacousy Bandshell $700,000 Chinguacousy Boathouse $700,000 Chinguacousy Formal Gardens $700,000 Chinguacousy Greenhouses/ Barns, Paddocks, Parking $700,000 Chinguacousy Mini-Golf $700,000 Chinguacousy Winter Tennis Centre $700,000 Chinguacousy Sandalwood Wet Field Hockey $700,000 Civic Centre Outdoor Rink $1,500,000 Creditview Sandalwood Field House ,000 Eldorado Outdoor Pool $700,000 Eldorado Pavilion $700,000 Ezard Park Silo $700,000 FCCC Lawn Bowling $700,000 Gage Park Artif. Ice/Fieldhse $2,500,000 Mount Pleasant Ice Skating / Reflecting Pond $700,000 Peel Village Golf Course - Clubhouse $700,000 Peel Village Golf Course - Development of Course $700,000 Peel Village Golf Course - Land $300,000 Sesquicentennial Park Field House ,000 Teramoto Comfort Station ,000 Total (#) Total ($000) $50,080.5 $50,080.5 $50,080.5 $46,673.0 $48,493.0 $48,492.0 $47,505.0 $48,020.0 $48,967.0 $51,060.0
143 140 APPENDIX B.4 TABLE 1 - PAGE 37 RECREATION PARK DEVELOPMENT INVENTORY OF CAPITAL ASSETS # of acres UNIT COST TABLELAND (acre) ($/acre) Active Tableland 1,596 1,662 1,670 1,700 1,775 1,876 1,954 1,954 1,992 2,048 $164,746 Other Tableland $125,068 Cemeteries $82,534 Total (acre) 1,875 1,946 1,955 1,989 2,064 2,171 2,257 2,273 2,318 2,382 Total ($000) $296,725.5 $308,224.0 $309,622.1 $314,945.9 $327,365.4 $344,690.3 $358,524.3 $360,546.7 $367,730.9 $377,995.2 # of acres UNIT COST HAZARDLAND (acre) ($/acre) Various Hazardland ,002 1,135 1,214 1,276 $66,523 Total (acre) ,002 1,135 1,214 1,276 Total ($000) $45,430.2 $47,697.0 $50,854.8 $54,344.6 $58,020.2 $61,714.7 $66,666.7 $75,515.6 $80,732.3 $84,896.0
144 141 APPENDIX B.4 TABLE 1 - PAGE 38 RECREATION PARKS FLEET AND MAINTENANCE EQUIPMENT INVENTORY OF CAPITAL ASSETS PARKS FLEET & MAINTENANCE EQUIPMENT (#) # of Vehicles or Pieces of Equipment UNIT COST City-Owned Items ($/Item) COMPACT PICKUPS $25,667 COMPACT 4X $38,414 3/4 & 1 TON PICKUP $54,028 3/4 & 1 TON 4X4 PICKUPS $47,810 COMPACT VANS $26,150 3/4 & 1 TON VANS $50, TON S AXLE, DUAL AXLE DUMP,FLAT BED $78, TON SAXLE,D WHEELDUMP,FLAT BED,TANKER $165, TON TANDEM AXLE DUMPS, FLUSHER,FLAT BED $286, TON SPECVEHICLE, BUCK,CRANE,BODYINTERCH $271,500 TRAILER $19,048 ICE RESURFACERS $102,000 LOADER BACKHOE COMBINATIONS AND EXCAVATORS $166,000 FRONT END LOADERS RUBBER TIRE AND CRAWLER $281,000 STREET SWEEPERS MECHANICAL AND VACUUM $250,800 TRACTORS FARM TYPE ALL SIZES $88,840 SIDEWALK PLOWS AND SKID STEER LOADERS $99,143 TURF EQUIPMENT MOWERS, TRIMMERS, GATORS $36,446 ASPHROLLERS,GRINDERS,HOTBX,CON/ASPHSAW,TAMPER $23,250 SPECIALTY EQUIPMENT NOT CLASSIFIED $65,959 Sub-total (#) Sub-total ($000) $10,434.3 $10,720.3 $11,653.5 $20,401.6 $20,487.1 $22,676.3 $22,533.9 $23,637.0 $24,117.1 $24,009.8 PARKS FLEET & MAINTENANCE EQUIPMENT (#) # of Vehicles or Pieces of Equipment UNIT COST Percentage of Year Rented Items ($/Item) Rented (%) COMPACT PICKUPS $5,442 52% COMPACT 4X $5,423 55% 3/4 & 1 TON PICKUP $5,332 43% 3/4 & 1 TON 4X4 PICKUPS $3,909 48% LOADER BACKHOE COMBINATIONS AND EXCAVATORS $15,229 39% Sub-total (#) Sub-total City's Share ($000) $189.0 $189.0 $189.0 $189.0 $189.0 $189.0 $184.6 $164.0 $185.6 $172.6 Total Parks and Recreation Fleet (#) $189.0 $191.0 $208.0 $364.0 $368.0 $399.0 $408.0 $428.0 $450.0 $445.0 Total Parks and Recreation Fleet ($000) $10,623.4 $10,909.3 $11,842.6 $20,590.7 $20,676.2 $22,865.4 $22,718.5 $23,800.9 $24,302.7 $24,182.3
145 142 APPENDIX B.4 TABLE 1 - PAGE 39 RECREATION SUMMARY OF SERVICE LEVEL ANALYSIS Historic Population 386, , , , , , , , , ,800 INVENTORY SUMMARY ($000) Indoor Recreation - Major Facilities $408,461 $408,461 $413,045 $476,363 $555,133 $555,133 $558,655 $561,344 $569,599 $593,525 Indoor Recreation - Equipment $29,579 $29,579 $29,968 $34,158 $39,169 $39,169 $39,448 $39,486 $40,094 $41,343 Indoor Recreation - Land $74,103 $74,103 $75,678 $84,155 $92,615 $92,611 $94,218 $95,751 $95,849 $99,489 Park Facilities $88,527 $96,867 $100,188 $103,963 $111,696 $112,217 $109,945 $114,846 $116,674 $122,819 Outdoor Buildings $17,258 $16,751 $16,740 $16,566 $15,625 $14,850 $22,764 $23,869 $24,972 $26,204 Land for Outdoor Buildings $9,018 $8,640 $8,640 $8,605 $8,605 $8,416 $9,865 $9,858 $11,531 $11,671 Equipment for Outdoor Buildings $3,018 $3,253 $3,471 $3,725 $3,869 $3,797 $3,797 $3,725 $3,719 $3,719 Parkland $342,156 $355,921 $360,477 $369,290 $385,386 $406,405 $425,191 $436,062 $448,463 $462,891 Special Facilities Buildings $24,267 $24,267 $24,267 $23,491 $28,790 $28,790 $29,049 $33,352 $36,352 $37,984 Special Facilities Land $50,080 $50,080 $50,080 $46,673 $48,493 $48,492 $47,505 $48,020 $48,967 $51,060 Parks Fleet and Maintenance Equipment $10,623 $10,909 $11,843 $20,591 $20,676 $22,865 $22,718 $23,801 $24,303 $24,182 Total ($000) $1,057,091 $1,078,831 $1,094,397 $1,187,581 $1,310,056 $1,332,745 $1,363,156 $1,390,114 $1,420,523 $1,474,887 SERVICE LEVEL ($/capita) Average Service Level Indoor Recreation - Major Facilities $1, $ $ $1, $1, $1, $1, $1, $1, $1, $1, Indoor Recreation - Equipment $76.50 $72.22 $69.08 $75.83 $83.73 $80.63 $78.19 $75.37 $74.07 $74.12 $75.97 Indoor Recreation - Land $ $ $ $ $ $ $ $ $ $ $ Park Facilities $ $ $ $ $ $ $ $ $ $ $ Outdoor Buildings $44.63 $40.90 $38.59 $36.77 $33.40 $30.57 $45.12 $45.56 $46.13 $46.98 $40.87 Land for Outdoor Buildings $23.32 $21.10 $19.92 $19.10 $18.39 $17.32 $19.55 $18.82 $21.30 $20.92 $19.98 Equipment for Outdoor Buildings $7.81 $7.94 $8.00 $8.27 $8.27 $7.82 $7.53 $7.11 $6.87 $6.67 $7.63 Parkland $ $ $ $ $ $ $ $ $ $ $ Special Facilities Buildings $62.76 $59.25 $55.94 $52.15 $61.54 $59.26 $57.58 $63.66 $67.16 $68.10 $60.74 Special Facilities Land $ $ $ $ $ $99.82 $94.16 $91.66 $90.46 $91.54 $ Fleet and Maintenance Equipment $27.47 $26.64 $27.30 $45.71 $44.20 $47.07 $45.03 $45.43 $44.90 $43.35 $39.71 Total ($/capita) $2, $2, $2, $2, $2, $2, $2, $2, $2, $2, $2, CALCULATION OF MAXIMUM ALLOWABLE RECREATION 10-Year Funding Envelope Calculation Excess Capacity Calculation 10 Year Average Service Level $2, Total Value of Inventory in 2013 $ 1,474,887,259 Net Population Growth ,100 Inventory Using Average Service Level $ 1,489,022,057 Maximum Allowable Funding Envelope 384,668,481 Excess Capacity $0 Less: Uncommitted Excess Capacity $0 Excess Capacity: uncommitted Less: 10% Legislated Reduction $38,466,848 Discounted Maximum Allowable Funding Envelope $346,201,632
146 143 APPENDIX B-4 TABLE 2 - PAGE 1 CITY OF BRAMPTON 2014 DEVELOPMENT CHARGES BACKGROUND STUDY DEVELOPMENT-RELATED CAPITAL PROGRAM Gross Grants/ Net Ineligible Cost Total DC Eligible Costs Service Project Description Timing Project Subsidies/Other Municipal Replacement 10% DC Eligble Available DC Post Cost Recoveries Cost and BTE Share Reduction Costs Reserves RECREATION AND PARKS 4.1 Major Facilities Indoor Asset Replacement & Expansion (remaining cost) 2014 $ 250,000 $ - $ 250,000 $ - $ 25,000 $ 225,000 $ 225,000 $ - $ Mississauga/Embleton Facility 2014 $ 780,000 $ - $ 780,000 $ - $ 78,000 $ 702,000 $ 702,000 $ - $ Facility Repurposing (Old FCC - Admin Building) 2015 $ 550,000 $ - $ 550,000 $ - $ 55,000 $ 495,000 $ - $ 495,000 $ Mississauga/Embleton Facility 2015 $ 5,330,000 $ - $ 5,330,000 $ - $ 533,000 $ 4,797,000 $ - $ 4,797,000 $ Facility Repurposing (Old FCC - Admin Building) 2016 $ 750,000 $ - $ 750,000 $ - $ 75,000 $ 675,000 $ - $ 675,000 $ Mississauga/Embleton Facility 2016 $ 100,000 $ - $ 100,000 $ - $ 10,000 $ 90,000 $ - $ 90,000 $ Facility Repurposing (Old FCC - Admin Building) 2017 $ 9,000,000 $ - $ 9,000,000 $ - $ 900,000 $ 8,100,000 $ - $ 8,100,000 $ Mississauga/Embleton Facility 2017 $ 4,500,000 $ - $ 4,500,000 $ - $ 450,000 $ 4,050,000 $ - $ 4,050,000 $ Facility Repurposing (Old FCC - Admin Building) 2018 $ 1,500,000 $ - $ 1,500,000 $ - $ 150,000 $ 1,350,000 $ - $ 1,350,000 $ Mississauga/Embleton Facility 2018 $ 40,500,000 $ - $ 40,500,000 $ - $ 4,050,000 $ 36,450,000 $ - $ 36,450,000 $ Recreation Facility Modernizations 2018 $ 100,000 $ - $ 100,000 $ 40,000 $ 6,000 $ 54,000 $ - $ 54,000 $ Recreation Facility Modernizations 2019 $ 1,500,000 $ - $ 1,500,000 $ 600,000 $ 90,000 $ 810,000 $ - $ 810,000 $ Recreation Facility Modernizations 2020 $ 20,500,000 $ - $ 20,500,000 $ 8,200,000 $ 1,230,000 $ 11,070,000 $ - $ 11,070,000 $ Recreation Facility Modernizations 2021 $ 19,000,000 $ - $ 19,000,000 $ 7,600,000 $ 1,140,000 $ 10,260,000 $ - $ 10,260,000 $ - Subtotal Major Facilities $ 104,360,000 $ - $ 104,360,000 $ 16,440,000 $ 8,792,000 $ 79,128,000 $ 927,000 $ 78,201,000 $ Park Facilities and Equipment/Fleet Indoor Fields - FCCC Lawn Bowling 2016 $ 4,000,000 $ - $ 4,000,000 $ - $ 400,000 $ 3,600,000 $ - $ 3,600,000 $ Addition of new fleet/equipment Various $ 6,448,673 $ - $ 6,448,673 $ - $ 644,867 $ 5,803,805 $ - $ 2,089,490 $ 3,714,316 Subtotal Park Facilities and Equipment/Fleet $ 10,448,673 $ - $ 10,448,673 $ - $ 1,044,867 $ 9,403,805 $ - $ 5,689,490 $ 3,714,316
147 144 APPENDIX B-4 TABLE 2 - PAGE 2 CITY OF BRAMPTON 2014 DEVELOPMENT CHARGES BACKGROUND STUDY DEVELOPMENT-RELATED CAPITAL PROGRAM Gross Grants/ Net Ineligible Cost Total DC Eligible Costs Service Project Description Timing Project Subsidies/Other Municipal Replacement 10% DC Eligble Available DC Post Cost Recoveries Cost and BTE Share Reduction Costs Reserves Parkland Development Alderlea 2014 $ 71,000 $ - $ 71,000 $ - $ 7,100 $ 63,900 $ 63,900 $ - $ Chinguacousy Park Enhancements 2014 $ 350,000 $ - $ 350,000 $ - $ 35,000 $ 315,000 $ 315,000 $ - $ Creditview/Sandalwood City wide Park 2014 $ 3,908,000 $ - $ 3,908,000 $ - $ 390,800 $ 3,517,200 $ 1,899,157 $ 1,618,043 $ Gore Meadows 2014 $ 7,500,000 $ - $ 7,500,000 $ - $ 750,000 $ 6,750,000 $ - $ 6,750,000 $ Civic Design 2014 $ 353,000 $ - $ 353,000 $ - $ 35,300 $ 317,700 $ - $ 317,700 $ Heritage Program 2014 $ 250,000 $ - $ 250,000 $ - $ 25,000 $ 225,000 $ - $ 225,000 $ Mississauga / Bovaird Community Park 2014 $ 250,000 $ - $ 250,000 $ - $ 25,000 $ 225,000 $ - $ 225,000 $ Neighbourhood Parks 2014 $ 2,149,000 $ - $ 2,149,000 $ - $ 214,900 $ 1,934,100 $ - $ 1,934,100 $ Pathways Implementation Program 2014 $ 195,000 $ - $ 195,000 $ - $ 19,500 $ 175,500 $ - $ 175,500 $ Valleyland Development 2014 $ 2,816,000 $ - $ 2,816,000 $ - $ 281,600 $ 2,534,400 $ - $ 2,534,400 $ Alderlea 2015 $ 175,000 $ - $ 175,000 $ - $ 17,500 $ 157,500 $ - $ 157,500 $ Gore Meadows 2015 $ 75,000,000 $ - $ 75,000,000 $ - $ 7,500,000 $ 67,500,000 $ - $ 67,500,000 $ Civic Design 2015 $ 250,000 $ - $ 250,000 $ - $ 25,000 $ 225,000 $ - $ 225,000 $ Heritage Program 2015 $ 500,000 $ - $ 500,000 $ - $ 50,000 $ 450,000 $ - $ 450,000 $ Mississauga / Bovaird Community Park 2015 $ 2,000,000 $ - $ 2,000,000 $ - $ 200,000 $ 1,800,000 $ - $ 1,800,000 $ Neighbourhood Parks 2015 $ 4,000,000 $ - $ 4,000,000 $ - $ 400,000 $ 3,600,000 $ - $ 3,600,000 $ Torbram/Sandalwood Community Park 2015 $ 5,000,000 $ - $ 5,000,000 $ - $ 500,000 $ 4,500,000 $ - $ 4,500,000 $ Pathways Implementation Program 2015 $ 562,000 $ - $ 562,000 $ 10,000 $ 55,200 $ 496,800 $ - $ 496,800 $ Valleyland Development 2015 $ 4,820,000 $ - $ 4,820,000 $ - $ 482,000 $ 4,338,000 $ - $ 4,338,000 $ Wayfinding & Signage Program 2015 $ 300,000 $ - $ 300,000 $ 150,000 $ 15,000 $ 135,000 $ - $ 135,000 $ Alderlea 2016 $ 150,000 $ - $ 150,000 $ - $ 15,000 $ 135,000 $ - $ 135,000 $ Eldorado Park Development 2016 $ 3,000,000 $ - $ 3,000,000 $ 2,250,000 $ 75,000 $ 675,000 $ - $ 675,000 $ Civic Design 2016 $ 250,000 $ - $ 250,000 $ - $ 25,000 $ 225,000 $ - $ 225,000 $ Heritage Program 2016 $ 3,996,000 $ - $ 3,996,000 $ - $ 399,600 $ 3,596,400 $ - $ 3,596,400 $ Neighbourhood Parks 2016 $ 4,250,000 $ - $ 4,250,000 $ - $ 425,000 $ 3,825,000 $ - $ 3,825,000 $ NW Brampton Community Park 2016 $ 14,280,000 $ 10,680,000 $ 3,600,000 $ - $ 360,000 $ 3,240,000 $ - $ 3,240,000 $ Pathways Implementation Program 2016 $ 617,000 $ - $ 617,000 $ 5,000 $ 61,200 $ 550,800 $ - $ 550,800 $ Valleyland Development 2016 $ 2,910,000 $ - $ 2,910,000 $ - $ 291,000 $ 2,619,000 $ - $ 2,619,000 $ Wayfinding & Signage Program 2016 $ 300,000 $ - $ 300,000 $ 150,000 $ 15,000 $ 135,000 $ - $ 135,000 $ Civic Design 2017 $ 250,000 $ - $ 250,000 $ - $ 25,000 $ 225,000 $ - $ 225,000 $ Loafers Lake Park Development 2017 $ 3,500,000 $ - $ 3,500,000 $ 2,624,000 $ 87,600 $ 788,400 $ - $ 788,400 $ New Community Park $ 500,000 $ - $ 500,000 $ - $ 50,000 $ 450,000 $ - $ 450,000 $ Neighbourhood Parks 2017 $ 4,500,000 $ - $ 4,500,000 $ - $ 450,000 $ 4,050,000 $ - $ 4,050,000 $ Pathways Implementation Program 2017 $ 500,000 $ - $ 500,000 $ 10,000 $ 49,000 $ 441,000 $ - $ 441,000 $ Valleyland Development 2017 $ 2,640,000 $ - $ 2,640,000 $ - $ 264,000 $ 2,376,000 $ - $ 2,376,000 $ Wayfinding & Signage Program 2017 $ 250,000 $ - $ 250,000 $ 125,000 $ 12,500 $ 112,500 $ - $ 112,500 $ Civic Design 2018 $ 250,000 $ - $ 250,000 $ - $ 25,000 $ 225,000 $ - $ 225,000 $ Neighbourhood Parks 2018 $ 4,750,000 $ - $ 4,750,000 $ - $ 475,000 $ 4,275,000 $ - $ 4,275,000 $ New Community Park $ 2,875,000 $ - $ 2,875,000 $ - $ 287,500 $ 2,587,500 $ - $ 2,587,500 $ Pathways Implementation Program 2018 $ 500,000 $ - $ 500,000 $ 10,000 $ 49,000 $ 441,000 $ - $ 441,000 $ Valleyland Development 2018 $ 4,400,000 $ - $ 4,400,000 $ - $ 440,000 $ 3,960,000 $ - $ 3,960,000 $ Wayfinding & Signage Program 2018 $ 250,000 $ - $ 250,000 $ 125,000 $ 12,500 $ 112,500 $ - $ 112,500 $ Civic Design 2019 $ 200,000 $ - $ 200,000 $ - $ 20,000 $ 180,000 $ - $ 180,000 $ Gore / Castlemore Community Park 2019 $ 675,000 $ - $ 675,000 $ - $ 67,500 $ 607,500 $ - $ 607,500 $ Neighbourhood Parks 2019 $ 5,000,000 $ - $ 5,000,000 $ - $ 500,000 $ 4,500,000 $ - $ 4,500,000 $ New Community Park $ 21,888,000 $ - $ 21,888,000 $ - $ 2,188,800 $ 19,699,200 $ - $ 19,699,200 $ Pathways Implementation Program 2019 $ 500,000 $ - $ 500,000 $ 10,000 $ 49,000 $ 441,000 $ - $ 441,000 $ Valleyland Development 2019 $ 2,330,000 $ - $ 2,330,000 $ - $ 233,000 $ 2,097,000 $ - $ 2,097,000 $ Wayfinding & Signage Program 2019 $ 200,000 $ - $ 200,000 $ 100,000 $ 10,000 $ 90,000 $ - $ 90,000 $ -
148 145 APPENDIX B-4 TABLE 2 - PAGE 3 CITY OF BRAMPTON 2014 DEVELOPMENT CHARGES BACKGROUND STUDY DEVELOPMENT-RELATED CAPITAL PROGRAM Gross Grants/ Net Ineligible Cost Total DC Eligible Costs Service Project Description Timing Project Subsidies/Other Municipal Replacement 10% DC Eligble Available DC Post Cost Recoveries Cost and BTE Share Reduction Costs Reserves Parkland Development (Cont'd) Civic Design 2020 $ 200,000 $ - $ 200,000 $ - $ 20,000 $ 180,000 $ - $ 180,000 $ Gore Meadows 2020 $ 1,000,000 $ - $ 1,000,000 $ - $ 100,000 $ 900,000 $ - $ 900,000 $ Gore / Castlemore Community Park 2020 $ 4,835,000 $ - $ 4,835,000 $ - $ 483,500 $ 4,351,500 $ - $ 4,351,500 $ Neighbourhood Parks 2020 $ 4,750,000 $ - $ 4,750,000 $ - $ 475,000 $ 4,275,000 $ - $ 4,275,000 $ Pathways Implementation Program 2020 $ 450,000 $ - $ 450,000 $ 10,000 $ 44,000 $ 396,000 $ - $ 396,000 $ Valleyland Development 2020 $ 1,660,000 $ - $ 1,660,000 $ - $ 166,000 $ 1,494,000 $ - $ 1,494,000 $ Wayfinding & Signage Program 2020 $ 200,000 $ - $ 200,000 $ 100,000 $ 10,000 $ 90,000 $ - $ 90,000 $ Civic Design 2021 $ 200,000 $ - $ 200,000 $ - $ 20,000 $ 180,000 $ - $ 180,000 $ Gore Meadows 2021 $ 6,000,000 $ - $ 6,000,000 $ - $ 600,000 $ 5,400,000 $ - $ 5,400,000 $ Heritage / Bovaird City Wide Park 2021 $ 1,544,000 $ - $ 1,544,000 $ - $ 154,400 $ 1,389,600 $ - $ 1,389,600 $ Neighbourhood Parks 2021 $ 4,500,000 $ - $ 4,500,000 $ - $ 450,000 $ 4,050,000 $ - $ 4,050,000 $ NW Brampton Community Park 2021 $ 200,000 $ - $ 200,000 $ - $ 20,000 $ 180,000 $ - $ 180,000 $ Pathways Implementation Program 2021 $ 450,000 $ - $ 450,000 $ 10,000 $ 44,000 $ 396,000 $ - $ 396,000 $ Valleyland Development 2021 $ 6,450,000 $ - $ 6,450,000 $ - $ 645,000 $ 5,805,000 $ - $ 5,805,000 $ Wayfinding & Signage Program 2021 $ 150,000 $ - $ 150,000 $ 75,000 $ 7,500 $ 67,500 $ - $ 67,500 $ Civic Design 2022 $ 200,000 $ - $ 200,000 $ - $ 20,000 $ 180,000 $ - $ 180,000 $ Heritage / Bovaird City Wide Park 2022 $ 13,783,000 $ - $ 13,783,000 $ - $ 1,378,300 $ 12,404,700 $ - $ 12,404,700 $ Neighbourhood Parks 2022 $ 4,500,000 $ - $ 4,500,000 $ - $ 450,000 $ 4,050,000 $ - $ 4,050,000 $ NW Brampton Community Park 2022 $ 5,200,000 $ - $ 5,200,000 $ - $ 520,000 $ 4,680,000 $ - $ 4,680,000 $ Pathways Implementation Program 2022 $ 450,000 $ - $ 450,000 $ 10,000 $ 44,000 $ 396,000 $ - $ 396,000 $ Valleyland Development 2022 $ 2,540,000 $ - $ 2,540,000 $ - $ 254,000 $ 2,286,000 $ - $ 2,286,000 $ Wayfinding & Signage Program 2022 $ 150,000 $ - $ 150,000 $ 75,000 $ 7,500 $ 67,500 $ - $ 67,500 $ Civic Design 2023 $ 200,000 $ - $ 200,000 $ - $ 20,000 $ 180,000 $ - $ 180,000 $ Neighbourhood Parks 2023 $ 4,250,000 $ - $ 4,250,000 $ - $ 425,000 $ 3,825,000 $ - $ 3,825,000 $ New Community Park $ 2,300,000 $ - $ 2,300,000 $ - $ 230,000 $ 2,070,000 $ - $ 2,070,000 $ NW Brampton Community Park 2023 $ 45,830,000 $ - $ 45,830,000 $ - $ 4,583,000 $ 41,247,000 $ - $ 41,247,000 $ Pathways Implementation Program 2023 $ 300,000 $ - $ 300,000 $ 10,000 $ 29,000 $ 261,000 $ - $ 261,000 $ Valleyland Development 2023 $ 2,000,000 $ - $ 2,000,000 $ - $ 200,000 $ 1,800,000 $ - $ 1,800,000 $ Wayfinding & Signage Program 2023 $ 150,000 $ - $ 150,000 $ 75,000 $ 7,500 $ 67,500 $ - $ 67,500 $ - Subtotal Parkland Development $ 310,602,000 $ 10,680,000 $ 299,922,000 $ 5,934,000 $ 29,398,800 $ 264,589,200 $ 2,278,057 $ 262,311,143 $ - TOTAL RECREATION AND PARKS $ 425,410,673 $ 10,680,000 $ 414,730,673 $ 22,374,000 $ 39,235,667 $ 353,121,005 $ 3,205,057 $ 346,201,632 $ 3,714,316 Residential Development Charge Calculation Residential Share of DC Eligible Costs 100% $346,201, Net Funding Envelope for Parks & Recre $346,201, Year Growth in Population in New Units 162,396 Unadjusted Development Charge Per Capita ($) $2, Reserve Fund Balance $3,205,057 Non-Residential Development Charge Calculation Non-Residential Share of DC Eligible Costs 0% $ - 10 Year Growth in Square Meters 4,967,120 Unadjusted Development Charge Per Sq.M ($) $0.00
149 146 APPENDIX B.4 TABLE 3 CITY OF BRAMPTON CASHFLOW AND DETERMINATION OF DEVELOPMENT CHARGE RECREATION SERVICES RESIDENTIAL DEVELOPMENT CHARGE 4.00 RECREATION SERVICES OPENING CASH BALANCE FROM APPLICABLE RESERVES TOTAL OPENING CASH BALANCE ($000) ,799.3 (38,354.5) (24,411.5) (8,030.5) (21,587.1) (12,547.6) 2, , , RESIDENTIAL FUNDING REQUIREMENTS 4.00 Recreation Services : Non Inflated $13, $88, $19, $20, $49, $28, $22, $27, $24, $49, $346, Recreation Services: Inflated $13, $90, $20, $22, $53, $31, $25, $32, $28, $59, $378, POPULATION GROWTH - Population in New Units 14,619 16,034 16,131 17,281 17,586 17,523 16,894 16,135 15,096 15, ,396 REVENUE - current ($000) - Dev. Charge Receipts 31, , , , , , , , , ,854.3 $382, Interest on Opening Balance (2,109.5) (1,342.6) (441.7) (1,187.3) (690.1) ($4,005.38) - Interest on In-year Transactions (excl.int.) (1,519.6) (351.0) (563.6) ($801.02) TOTAL REVENUE 31, , , , , , , , , ,002.8 $378, CLOSING CASH BALANCE 17,799.3 (38,354.5) (24,411.5) (8,030.5) (21,587.1) (12,547.6) 2, , , Adjusted Charge Per Capita $2, Allocation of Capital Program Residential Sector 100.0% Non-Residential Sector 0.0% Rates for 2014 Inflation Rate 2.0% Interest Rate on Positive Balances 3.5% Interest Rate on Negative Balances 5.5%
150 147 APPENDIX B.5 PUBLIC WORKS: BUILDINGS AND FLEET
151 148 APPENDIX B.5 PUBLIC WORKS: BUILDINGS AND FLEET This appendix covers the yards and fleet components of the City s operations. The Public Works Department operates from several works facilities located throughout the City to provide repair and maintenance services for roads, sidewalks, streetlights and other infrastructure. Information regarding roads and related infrastructure can be found in Appendix C. Only engineering related fleet and equipment are included in this service. TABLE 1 HISTORIC SERVICE LEVELS The Public Works Department operates out of two primary locations: Williams Parkway Works Operation Centre and Sandalwood Yard. The current inventory of capital assets for Public Works includes building space, salt domes and sheds with a total replacement value of $46.14 million. The acres of land associated with the Public Works yards is valued at $46.94 million. Furniture and equipment, excluding computers totals $1.25 million. The 251 Public Works vehicles and related equipment add an additional $18.86 million to the value of the capital assets. The total value of the Public Works capital inventory is $ million. The ten year historic average service level is $ per population and employee, and this, multiplied by the ten year forecast growth in net population and employment, results in a ten year maximum allowable funding envelope of $29.39 million. Under the Development Charges Act, 1997, services related to a highway as defined in subsection 1(1) of the Municipal Act, 2001, need not to be reduced by the legislated 10 per cent (as with other general services). The services and capital assets of Public Works: Buildings and Fleet are considered to be related to a highway, and as such, the maximum allowable of $29.39 million is not required to be reduced by ten per cent and therefore the full amount is brought forward to the development charges calculation.
152 149 TABLE PROVISIONAL DEVELOPMENT-RELATED CAPITAL BUDGET& CALCULATION OF THE UNADJUSTED DEVELOPMENT CHARGES The first project in the Public Works capital program is for the recovery of the negative reserve fund balance. The negative reserve fund relates to the previously committed excess capacity. The negative DC reserve fund balance for public works services amounts to $38.02 million and this full amount is brought forward for recovery through development charges. The capital program also provides for the construction of two new works yards and top ups for previously budgeted projects over a seven year period from 2014 through to 2020 for a combined gross cost of $68.48 million. Finally, a provision for additional fleet and equipment adds $6.96 million to the gross program cost. The ten year capital forecast for Public Works totals $ million. No provincial government grants or subsidies or replacement shares are anticipated to offset the cost of the program. $84.07 million, the portion of the development-related cost which exceeds the maximum allowable funding envelope and this amount is deemed to benefit growth beyond 2023 and can be recovered through subsequent development charges studies. The DC costs eligible for recovery total to $29.39 million. This development related cost is allocated 71 per cent, or $20.87 million against new residential development, and 29 per cent, or $8.52 million against non-residential development. This yields an unadjusted residential development charge of $ per capita and $1.72 per square metre of new non-residential development.
153 150 TABLE 3 CASH FLOW ANALYSIS After cash flow consideration, both the residential and non-residential calculated charges increase to $ per capita and $1.99 per square metre, respectively. The following table summarizes the calculation of the Public Works: Buildings and Fleet development charge. PUBLIC WORKS: BUILDINGS AND FLEET SUMMARY 10-year Hist. Service Level Development-Related Capital Program ($000's) Unadjusted Development Charge Adjusted Development Charge $/pop & emp Total Net DC Recoverable $/capita $/sq.m $/capita $/sq.m $ $113,459 $29,393 $ $1.72 $ $1.99
154 151 APPENDIX B.5 TABLE 1 - PAGE 1 PUBLIC WORKS - BUILDINGS & FLEET INVENTORY OF CAPITAL ASSETS BUILDINGS ($000) Total Value of Buildings ($000) Facility Name Williams Parkway East Storage Shed $151.0 $151.0 $151.0 $151.0 $151.0 $151.0 $151.0 $151.0 $0.0 $0.0 Williams Parkway Salt Dome $619.9 $619.9 $619.9 $619.9 $619.9 $619.9 $619.9 $619.9 $619.9 $619.9 Williams Parkway Sand Dome $619.9 $619.9 $619.9 $619.9 $619.9 $619.9 $619.9 $619.9 $619.9 $619.9 Williams Parkway South Storage Shed $80.5 $80.5 $80.5 $80.5 $80.5 $80.5 $80.5 $80.5 $80.5 $80.5 Williams Parkway Vehicle Wash $332.4 $332.4 $332.4 $332.4 $332.4 $332.4 $332.4 $332.4 $332.4 $332.4 Williams Parkway Works Operation Centre $10,502.7 $10,502.7 $10,502.7 $10,502.7 $10,502.7 $13,658.0 $13,658.0 $13,658.0 $13,658.0 $13,658.0 Sandalwood Yard $2,837.1 $2,837.1 $2,837.1 $2,837.1 $2,837.1 $2,837.1 $2,837.1 $0.0 $0.0 $0.0 Sandalwood Salt Dome (old) $440.7 $440.7 $440.7 $440.7 $440.7 $440.7 $440.7 $0.0 $0.0 $0.0 Sandalwood Sand Dome (old) $440.7 $440.7 $440.7 $440.7 $440.7 $440.7 $440.7 $0.0 $0.0 $0.0 Sandalwood Yard Storage Bays Building (old) $126.0 $126.0 $126.0 $126.0 $126.0 $126.0 $126.0 $0.0 $0.0 $0.0 New Sandalwood Yard Facilities $0.0 $0.0 $0.0 $0.0 $0.0 $0.0 $0.0 $30,825.6 $30,825.6 $30,825.6 Sandalwood Yard Storage Bays Building Sandalwood Fabric Building Sandalwood Pole Barn- Phase 2 Sandalwood Pole Barn- Phase 3 Sandalwood Sand & Salt Storage and Garage Building Total ($000) $16,150.7 $16,150.7 $16,150.7 $16,150.7 $16,150.7 $19, $19, $46, $46, $46, LAND # of Acres UNIT COST Facility Name ($/acre) Sandalwood Fabric Building $850,000 Sandalwood Pole Barn- Phase $850,000 Sandalwood Yard $850,000 Sandalwood Salt Dome $850,000 Williams Parkway East Storage Shed $850,000 Williams Parkway Salt Dome $850,000 Williams Parkway Sand Dome $850,000 Williams Parkway South Storage Shed $850,000 Williams Parkway Vehicle Wash $850,000 Williams Parkway Works Operation Centre $850,000 Total (acres) Total ($000) $46,943.0 $46,943.0 $46,943.0 $46,943.0 $46,943.0 $46,943.0 $46,943.0 $46,943.0 $46,943.0 $46,943.0
155 152 APPENDIX B.5 TABLE 1 - PAGE 2 PUBLIC WORKS - BUILDINGS & FLEET INVENTORY OF CAPITAL ASSETS FURNITURE AND EQUIPMENT (excluding computers) Total Value of Furniture and Equipment ($000) UNIT COST Facility Name ($/item) Williams Parkway East Storage Shed $ $ $ $ $ $ $ $ $ $ $25.14 Williams Parkway South Storage Shed $50.81 $50.81 $50.81 $50.81 $50.81 $50.81 $50.81 $50.81 $50.81 $50.81 $25.40 Williams Parkway Vehicle Wash $ $ $ $ $ $ $ $ $ $ $ Williams Parkway Works Operation Centre $ $ $ $ $ $ $ $ $ $ $14.16 Sandalwood Yard $12.16 $12.16 $12.16 $12.16 $12.16 $12.16 $12.16 $12.16 $12.16 $12.16 $6.08 Sandalwood Yard - Storage Building $0.63 $0.63 $0.63 $0.63 $0.63 $0.63 $0.63 $0.63 $0.63 $0.63 $0.18 Total ($000) $1,253 $1,253 $1,253 $1,253 $1,253 $1,253 $1,253 $1,253 $1,253 $1,253
156 APPENDIX B.5 TABLE 1 - PAGE PUBLIC WORKS FLEET & MAINTENANCE EQUIPMENT INVENTORY OF CAPITAL ASSETS PUBLIC WORKS FLEET & MAINTENANCE EQUIPMENT (#) # of Vehicles or Pieces of Equipment UNIT COST City-Owned Items ($/Item) CAR, STATION WAGONS $40,478 COMPACT PICKUPS $25,667 COMPACT 4X $38,414 3/4 & 1 TON PICKUP $54,028 3/4 & 1 TON 4X4 PICKUPS $47,810 COMPACT VANS $26,150 3/4 & 1 TON VANS $50, TON S AXLE, DUAL AXLE DUMP,FLAT BED $78, TON SAXLE,D WHEELDUMP,FLAT BED,TANKER $165, TON TANDEM AXLE DUMPS, FLUSHER,FLAT BED $286, TON SPECVEHICLE, BUCK,CRANE,BODYINTERCH $271,500 TRAILER $19,048 LOADER BACKHOE COMBINATIONS AND EXCAVATORS $166,000 FRONT END LOADERS RUBBER TIRE AND CRAWLER $281,000 GRADERS $256,000 STREET SWEEPERS MECHANICAL AND VACUUM $250,800 TRACTORS FARM TYPE ALL SIZES $88,840 SIDEWALK PLOWS AND SKID STEER LOADERS $99,143 TURF EQUIPMENT MOWERS, TRIMMERS, GATORS $36,446 ASPHROLLERS,GRINDERS,HOTBX,CON/ASPHSAW,TAMPER $23,250 RD MAINTEQP,SIGNBRDS,STMRS,LEAFLOADRS,COMPRES $17,667 SPECIALTY EQUIPMENT NOT CLASSIFIED $65,959 Sub-total (#) Sub-total ($000) $11,984 $11,891 $14,164 $16,755 $16,617 $17,498 $16,678 $16,946 $18,661 $18,831 PUBLIC WORKS FLEET & MAINTENANCE EQUIPMENT (#) # of Vehicles or Pieces of Equipment UNIT COST Percentage of Year Rented Items ($/Item) Rented (%) COMPACT PICKUPS $3,120 29% COMPACT 4X $2,721 23% LOADER BACKHOE COMBINATIONS AND EXCAVATORS $18,619 39% Sub-total (#) Sub-total City's Share ($000) $62.0 $62.0 $62.0 $62.0 $62.0 $62.0 $67.5 $68.3 $43.8 $29.2 Total Public Works Fleet (#) Total Public Works Fleet ($000) $12,046.2 $11,952.6 $14,226.0 $16,816.6 $16,679.4 $17,559.6 $16,745.6 $17,014.8 $18,704.7 $18,860.4
157 154 APPENDIX B.5 TABLE 1 - PAGE 4 PUBLIC WORKS - BUILDINGS & FLEET SUMMARY OF SERVICE LEVEL ANALYSIS Historic Population 386, , , , , , , , , ,800 Historic Employment 146, , , , , , , , , ,570 Total Historic Population & Employment 533, , , , , , , , , ,370 INVENTORY SUMMARY ($000) Buildings $16,150.7 $16,150.7 $16,150.7 $16,150.7 $16,150.7 $19,306.0 $19,306.0 $46,287.2 $46,136.2 $46,136.2 Land $46,943.0 $46,943.0 $46,943.0 $46,943.0 $46,943.0 $46,943.0 $46,943.0 $46,943.0 $46,943.0 $46,943.0 Furniture $1,253.3 $1,253.3 $1,253.3 $1,253.3 $1,253.3 $1,253.3 $1,253.3 $1,253.3 $1,253.3 $1,253.3 Fleet $12,046.2 $11,952.6 $14,226.0 $16,816.6 $16,679.4 $17,559.6 $16,745.6 $17,014.8 $18,704.7 $18,860.4 Total ($000) $76,393.2 $76,299.6 $78,573.0 $81,163.6 $81,026.4 $85,061.9 $84,247.9 $111,498.3 $113,037.2 $113,192.9 SERVICE LEVEL ($/pop & employ) Average Service Level Buildings $30.29 $28.80 $27.39 $26.50 $25.64 $29.64 $28.68 $66.50 $64.08 $62.06 $38.96 Land $88.03 $83.72 $79.61 $77.02 $74.51 $72.08 $69.73 $67.44 $65.20 $63.15 $74.05 Furniture $2.35 $2.24 $2.13 $2.06 $1.99 $1.92 $1.86 $1.80 $1.74 $1.69 $1.98 Fleet $22.59 $21.32 $24.12 $27.59 $26.48 $26.96 $24.87 $24.45 $25.98 $25.37 $24.97 Total ($/pop & employ) $ $ $ $ $ $ $ $ $ $ $ CALCULATION OF MAXIMUM ALLOWABLE PUBLIC WORKS - BUILDINGS & FLEET 10-Year Funding Envelope Calculation Excess Capacity Calculation 10 Year Average Service Level $ Total Value of Inventory in 2013 $113,192,910 Net Population & Employment Growth ,010 Inventory Using Average Service Level $104,042,065 Maximum Allowable Funding Envelope $29,393,000 Excess Capacity $9,150,845 Less: Uncommitted Excess Capacity $0 Excess Capacity: Committed Discounted Maximum Allowable Funding Envelope $29,393,000
158 155 APPENDIX B-5 TABLE 2 CITY OF BRAMPTON 2014 DEVELOPMENT CHARGES BACKGROUND STUDY DEVELOPMENT-RELATED CAPITAL PROGRAM Gross Grants/ Net Ineligible Cost Total DC Eligible Costs Service Project Description Timing Project Subsidies/Other Municipal Replacement 0% DC Eligble Available DC Post Cost Recoveries Cost and BTE Share Reduction Costs Reserves PUBLIC WORKS: BUILDINGS AND FLEET 5.1 Recovery of Negative Reserve Fund Balance 2014 $ 38,016,181 $ - $ 38,016,181 $ - $ - $ 38,016,181 $ - $ 29,393,000 $ 8,623, Buildings, Land & Equipment New Works Yard 2014 $ 3,150,000 $ - $ 3,150,000 $ - $ - $ 3,150,000 $ - $ - $ 3,150, New Works Yard 2015 $ 8,303,000 $ - $ 8,303,000 $ - $ - $ 8,303,000 $ - $ - $ 8,303, New Works Yard 2016 $ 7,624,000 $ - $ 7,624,000 $ - $ - $ 7,624,000 $ - $ - $ 7,624, New Works Yard 2017 $ 18,609,000 $ - $ 18,609,000 $ - $ - $ 18,609,000 $ - $ - $ 18,609, New Works Yard 2018 $ 3,227,000 $ - $ 3,227,000 $ - $ - $ 3,227,000 $ - $ - $ 3,227, New Works Yard 2019 $ 8,435,000 $ - $ 8,435,000 $ - $ - $ 8,435,000 $ - $ - $ 8,435, New Works Yard 2020 $ 19,134,000 $ - $ 19,134,000 $ - $ - $ 19,134,000 $ - $ - $ 19,134,000 Subtotal Buildings, Land & Equipment $ 68,482,000 $ - $ 68,482,000 $ - $ - $ 68,482,000 $ - $ - $ 68,482, Equipment Additional Fleet and Equipment Various $6,961,000 $ - $ 6,961,000 $ - $ - $ 6,961,000 $ - $ - $ 6,961, $ - $ - $ - $ - $ - $ - $ - $ - $ - $ - $ - $ - $ - $ - $ - $ - $ - $ - Subtotal Equipment $ 6,961,000 $ - $ 6,961,000 $ - $ - $ 6,961,000 $ - $ - $ 6,961,000 TOTAL PUBLIC WORKS: BUILDINGS AND FLEET $ 113,459,181 $ - $ 113,459,181 $ - $ - $ 113,459,181 $ - $ 29,393,000 $ 84,066,181 Residential Development Charge Calculation Residential Share of DC Eligible Costs 71% $20,869, Net Funding Envelope for Public Works $29,393, Year Growth in Population in New Units 162,396 Unadjusted Development Charge Per Capita ($) $ Reserve Fund Balance ($38,016,181) Non-Residential Development Charge Calculation Non-Residential Share of DC Eligible Costs 29% $ 8,523, Year Growth in Square Meters 4,967,120 Unadjusted Development Charge Per Sq.M ($) $1.72
159 156 APPENDIX B.5 TABLE 3 - PAGE 1 CITY OF BRAMPTON CASHFLOW AND DETERMINATION OF DEVELOPMENT CHARGE PUBLIC WORKS: BUILDINGS AND FLEET RESIDENTIAL DEVELOPMENT CHARGE 5.00 PUBLIC WORKS: BUILDINGS & FLEET OPENING CASH BALANCE FROM APPLICABLE RESERVES TOTAL OPENING CASH BALANCE ($000) 0.0 (19,187.3) (17,743.6) (16,155.1) (14,241.4) (12,116.1) (9,826.2) (7,459.5) (5,037.9) (2,612.4) RESIDENTIAL FUNDING REQUIREMENTS 5.00 Public Works: Buildings & Fleet : Non Inflated $20, $0.00 $0.00 $0.00 $0.00 $0.00 $0.00 $0.00 $0.00 $0.00 $20, Public Works: Buildings & Fleet: Inflated $20, $0.00 $0.00 $0.00 $0.00 $0.00 $0.00 $0.00 $0.00 $0.00 $20, POPULATION GROWTH - Population in New Units 14,619 16,034 16,131 17,281 17,586 17,523 16,894 16,135 15,096 15, ,396 REVENUE - current ($000) - Dev. Charge Receipts 2, , , , , , , , , ,709.4 $26, Interest on Opening Balance 0.0 (1,055.3) (975.9) (888.5) (783.3) (666.4) (540.4) (410.3) (277.1) (143.7) ($5,740.87) - Interest on In-year Transactions (excl.int.) (513.5) ($84.78) TOTAL REVENUE 1, , , , , , , , , ,613.1 $20, CLOSING CASH BALANCE (19,187.3) (17,743.6) (16,155.1) (14,241.4) (12,116.1) (9,826.2) (7,459.5) (5,037.9) (2,612.4) Adjusted Charge Per Capita $ Allocation of Capital Program Residential Sector 71.0% Non-Residential Sector 29.0% Rates for 2014 Inflation Rate 2.0% Interest Rate on Positive Balances 3.5% Interest Rate on Negative Balances 5.5%
160 157 APPENDIX B.5 TABLE 3 - PAGE 2 CITY OF BRAMPTON CASHFLOW AND DETERMINATION OF DEVELOPMENT CHARGE PUBLIC WORKS: BUILDINGS AND FLEET NON-RESIDENTIAL DEVELOPMENT CHARGE 5.00 PUBLIC WORKS: BUILDINGS AND FLEET OPENING CASH BALANCE FROM APPLICABLE RESERVES TOTAL OPENING CASH BALANCE ($000) $0.00 ($7,635.63) ($6,843.03) ($6,029.13) ($5,296.43) ($4,584.78) ($3,753.00) ($2,871.81) ($1,945.82) ($1,017.73) NON-RESIDENTIAL FUNDING REQUIREMENTS 5.00 Public Works: Buildings And Fleet : Non Inflated $8, $0.00 $0.00 $0.00 $0.00 $0.00 $0.00 $0.00 $0.00 $0.00 $8, Public Works: Buildings And Fleet: Inflated $8, $0.00 $0.00 $0.00 $0.00 $0.00 $0.00 $0.00 $0.00 $0.00 $8, NON-RESIDENTIAL GROWTH - Sq. Metres in New Buildings 549, , , , , , , , , ,850 4,967,120 REVENUE - current ($000) - Dev. Charge Receipts 1, , , , , , , , ,067.5 $10, Interest on Opening Balance 0.0 (420.0) (376.4) (331.6) (291.3) (252.2) (206.4) (157.9) (107.0) (56.0) ($2,198.76) - Interest on In-year Transactions (excl.int.) (204.4) ($35.00) TOTAL REVENUE ,030.2 $8, CLOSING CASH BALANCE (7,635.6) (6,843.0) (6,029.1) (5,296.4) (4,584.8) (3,753.0) (2,871.8) (1,945.8) (1,017.7) 12.5 Allocation of Capital Program 2014 Adjusted Charge Per Capita $1.99 Residential Sector 71.0% Non-Residential Sector 29.0% Rates for 2014 Inflation Rate: 2.0% Interest Rate on Positive Balances 3.5% Interest Rate on Negative Balances 5.5%
161 158 APPENDIX B.6 PARKING
162 159 APPENDIX B.6 PARKING The City of Brampton currently owns and operates four structured lots and several outdoor surface parking lots. The benefits of the parking service are deemed to be City-wide for the purpose of calculating the development charge. TABLE 1 HISTORIC SERVICE LEVELS The current inventory of capital assets for parking includes 1,781 parking spaces, of which 1,410 are in structured lots and 371 are on surface lots. The total cost to develop the spaces amounts to $63.23 million. Land associated with the spaces, totalling 6.67 acres, is valued at $11.55 million. The equipment associated with municipal parking lots adds an additional $993,600 to the value of the inventory. The current total value of parking capital infrastructure is estimated to be $75.76 million. This infrastructure has provided the City with a ten year average service level of $ per population and employment. The service level, when multiplied by the ten year net population and employment growth in the City, results in a ten year maximum allowable funding envelope of $23.48 million. No uncommitted excess capacity is identified for this service. The resulting development charge eligible Parking capital costs must be reduced by ten per cent ($2.35 million) under the DCA. The discounted maximum allowable funding envelope brought forward to the development charges calculation is $21.13 million. TABLE PROVISIONAL DEVELOPMENT-RELATED CAPITAL BUDGET& CALCULATION OF THE UNADJUSTED DEVELOPMENT CHARGES The ten-year development-related capital program for Parking includes the annual lease payments associated with the construction of a new building and parking lot in the South West Quadrant of the City. Over the ten-year period, the total lease payments, solely related to parking infrastructure, amount to $23.55 million. No provincial government grants or subsidies are anticipated to offset the cost of the program. A benefit to existing share equivalent to the non-public parking spaces made available through the construction of the new lot is deducted from the net municipal cost. The replacement and benefit to existing share amounts to $19.01 million, and
163 160 this amount will not be recovered from development charges. The ten per cent reduction required by the DCA amounts to $454,100. The remaining $4.09 million development-related cost will be funded entirely by available Parking DC reserve funds. Therefore, no shares remain to be brought forward to the development charge calculation. The resulting unadjusted residential and nonresidential charges are $0 per capita and $0.00 per square metre of new non-residential development. TABLE 3 CASH FLOW ANALYSIS After cash flow analysis, both the residential and non-residential charges remain unchanged at $0. The following table summarizes the calculation of the Parking development charge. PARKING SUMMARY 10-year Hist. Service Level Development-Related Capital Program ($000's) Unadjusted Development Charge Adjusted Development Charge $/pop & emp Total Net DC Recoverable $/capita $/sq.m $/capita $/sq.m $ $23,550 $0 $0.00 $0.00 $0.00 $0.00
164 161 APPENDIX B.6 TABLE 1 - PAGE 1 PARKING INVENTORY OF CAPITAL ASSETS PARKING LOTS # of Parking Spaces UNIT COST Lot Name ($/space) Structured Lot City Hall $47,600 John Street $47,600 Market Square $47,600 Nelson Square $29,000 Outdoor Surface Parking Lots Alderlea Lot $3,300 Church Street Lot $3,300 Rosalea Upper Deck $3,300 Geroge Street Lot $3,300 YMCA Lot $3,300 Total # (spaces) 1,705 1,705 1,657 1,657 1,657 1,882 1,882 1,882 1,784 1,781 Total ($000) $55,211 $55,211 $52,926 $52,926 $52,926 $63,636 $63,636 $63,636 $63,312 $63,225 LAND # of Acres UNIT COST Lot Name ($/acre) Structured Lot City Hall $2,500,000 John Street $2,500,000 Market Square $2,500,000 Nelson Square $2,500,000 Outdoor Surface Parking Lots Alderlea Lot $1,000,000 Church Street Lot $1,000,000 Rosalea Upper Deck $700,000 Geroge Street Lot $2,500,000 YMCA Lot $1,000,000 Total # (acres) Total ($000) $11,935 $11,935 $11,935 $11,935 $11,935 $13,335 $13,335 $13,335 $11,545 $11,545
165 162 APPENDIX B.6 TABLE 1 - PAGE 2 PARKING INVENTORY OF CAPITAL ASSETS EQUIPMENT Equipment Value ($000) Lot Name City Hall Garage $33.3 $33.3 $33.3 $33.3 $33.3 $33.3 $33.3 $33.3 $235.0 $235.0 John Street Garage $0.0 $0.0 $0.0 $0.0 $0.0 $160.0 $160.0 $160.0 $160.0 $160.0 Market Square Garage $33.3 $33.3 $33.3 $33.3 $33.3 $33.3 $200.0 $200.0 $200.0 $200.0 Nelson Square Garage $27.4 $27.4 $27.4 $27.4 $27.4 $27.4 $27.4 $27.4 $27.4 $150.0 Pay on Display (On Street) $0.0 $0.0 $0.0 $0.0 $81.4 $81.4 $81.4 $81.4 $248.6 $248.6 Total ($000) $93.9 $93.9 $93.9 $93.9 $175.3 $335.3 $502.0 $502.0 $871.0 $993.6
166 163 APPENDIX B.6 TABLE 1 - PAGE 3 PARKING SERVICE LEVEL ANALYSIS Historic Population 386, , , , , , , , , ,800 Historic Employment 146, , , , , , , , , ,570 Total Historic Population & Employment 533, , , , , , , , , ,370 INVENTORY SUMMARY ($000) Parking Lots $55,211 $55,211 $52,926 $52,926 $52,926 $63,636 $63,636 $63,636 $63,312 $63,225 Land $11,935 $11,935 $11,935 $11,935 $11,935 $13,335 $13,335 $13,335 $11,545 $11,545 Equipment $94 $94 $94 $94 $175 $335 $502 $502 $871 $994 Total ($000) $67,239 $67,239 $64,955 $64,955 $65,036 $77,306 $77,473 $77,473 $75,728 $75,764 SERVICE LEVEL ($/pop & employ) Average Service Level Parking Lots $ $98.46 $89.75 $86.84 $84.01 $97.71 $94.52 $91.43 $87.93 $85.05 $91.92 Land $22.38 $21.29 $20.24 $19.58 $18.94 $20.48 $19.81 $19.16 $16.03 $15.53 $19.34 Equipment $0.18 $0.17 $0.16 $0.15 $0.28 $0.51 $0.75 $0.72 $1.21 $1.34 $0.55 Total ($/pop & employ) $ $ $ $ $ $ $ $ $ $ $ CALCULATION OF MAXIMUM ALLOWABLE PARKING 10-Year Funding Envelope Calculation Excess Capacity Calculation 10 Year Average Service Level $ Total Value of Inventory in 2013 $75,763,900 Net Population & Employment Growth ,010 Inventory Using Average Service Level $83,116,200 Maximum Allowable Funding Envelope $23,481,218 Excess Capacity $0 Less: Uncommitted Excess Capacity $0 Excess Capacity: Uncommitted Less: 10% Legislated Reduction $2,348,122 Discounted Maximum Allowable Funding Envelope $21,133,096
167 164 APPENDIX B-6 TABLE 2 CITY OF BRAMPTON 2014 DEVELOPMENT CHARGES BACKGROUND STUDY DEVELOPMENT-RELATED CAPITAL PROGRAM Gross Grants/ Net Ineligible Cost Total DC Eligible Costs Service Project Description Timing Project Subsidies/Other Municipal Replacement 10% DC Eligble Available DC Post Cost Recoveries Cost and BTE Share Reduction Costs Reserves PARKING 6.1 Parking Facilities Parking Garage - Lease Payments 2014 $ 2,355,019 $ - $ 2,355,019 $ 1,900,912 $ 45,411 $ 408,696 $ 408,696 $ - $ Parking Garage - Lease Payments 2015 $ 2,355,019 $ - $ 2,355,019 $ 1,900,912 $ 45,411 $ 408,696 $ 408,696 $ - $ Parking Garage - Lease Payments 2016 $ 2,355,019 $ - $ 2,355,019 $ 1,900,912 $ 45,411 $ 408,696 $ 408,696 $ - $ Parking Garage - Lease Payments 2017 $ 2,355,019 $ - $ 2,355,019 $ 1,900,912 $ 45,411 $ 408,696 $ 408,696 $ - $ Parking Garage - Lease Payments 2018 $ 2,355,019 $ - $ 2,355,019 $ 1,900,912 $ 45,411 $ 408,696 $ 408,696 $ - $ Parking Garage - Lease Payments 2019 $ 2,355,019 $ - $ 2,355,019 $ 1,900,912 $ 45,411 $ 408,696 $ 408,696 $ - $ Parking Garage - Lease Payments 2020 $ 2,355,019 $ - $ 2,355,019 $ 1,900,912 $ 45,411 $ 408,696 $ 408,696 $ - $ Parking Garage - Lease Payments 2021 $ 2,355,019 $ - $ 2,355,019 $ 1,900,912 $ 45,411 $ 408,696 $ 408,696 $ - $ Parking Garage - Lease Payments 2022 $ 2,355,019 $ - $ 2,355,019 $ 1,900,912 $ 45,411 $ 408,696 $ 408,696 $ - $ Parking Garage - Lease Payments 2023 $ 2,355,019 $ - $ 2,355,019 $ 1,900,912 $ 45,411 $ 408,696 $ 408,696 $ - $ - TOTAL PARKING $ 23,550,186 $ - $ 23,550,186 $ 19,009,119 $ 454,107 $ 4,086,961 $ 4,086,961 $ - $ - Residential Development Charge Calculation Residential Share of DC Eligible Costs 71% $ Net Funding Envelope for Parking $21,133, Year Growth in Population in New Units 162,396 Unadjusted Development Charge Per Capita ($) $0.00 Reserve Fund Balance $7,308,075 Non-Residential Development Charge Calculation Non-Residential Share of DC Eligible Costs 29% $ - 10 Year Growth in Square Meters 4,967,120 Unadjusted Development Charge Per Sq.M ($) $0.00
168 165 APPENDIX B.6 TABLE 3 - PAGE 1 CITY OF BRAMPTON CASHFLOW AND DETERMINATION OF DEVELOPMENT CHARGE PARKING RESIDENTIAL DEVELOPMENT CHARGE 6.00 PARKING OPENING CASH BALANCE FROM APPLICABLE RESERVES TOTAL OPENING CASH BALANCE ($000) RESIDENTIAL FUNDING REQUIREMENTS 6.00 Parking : Non Inflated $0.00 $0.00 $0.00 $0.00 $0.00 $0.00 $0.00 $0.00 $0.00 $0.00 $ Parking: Inflated $0.00 $0.00 $0.00 $0.00 $0.00 $0.00 $0.00 $0.00 $0.00 $0.00 $0.00 POPULATION GROWTH - Population in New Units 14,619 16,034 16,131 17,281 17,586 17,523 16,894 16,135 15,096 15, ,396 REVENUE - current ($000) - Dev. Charge Receipts $ Interest on Opening Balance $ Interest on In-year Transactions (excl.int.) $0.00 TOTAL REVENUE $0.00 CLOSING CASH BALANCE Adjusted Charge Per Capita $0.00 Allocation of Capital Program Residential Sector 71.0% Non-Residential Sector 29.0% Rates for 2014 Inflation Rate 2.0% Interest Rate on Positive Balances 3.5% Interest Rate on Negative Balances 5.5%
169 166 APPENDIX B.6 TABLE 3 - PAGE 2 CITY OF BRAMPTON CASHFLOW AND DETERMINATION OF DEVELOPMENT CHARGE PARKING NON-RESIDENTIAL DEVELOPMENT CHARGE 6.00 PARKING OPENING CASH BALANCE FROM APPLICABLE RESERVES TOTAL OPENING CASH BALANCE ($000) $0.00 $0.00 $0.00 $0.00 $0.00 $0.00 $0.00 $0.00 $0.00 $ NON-RESIDENTIAL FUNDING REQUIREMENTS 6.00 Parking : Non Inflated $0.00 $0.00 $0.00 $0.00 $0.00 $0.00 $0.00 $0.00 $0.00 $0.00 $ Parking: Inflated $0.00 $0.00 $0.00 $0.00 $0.00 $0.00 $0.00 $0.00 $0.00 $0.00 $0.00 NON-RESIDENTIAL GROWTH - Sq. Metres in New Buildings 549, , , , , , , , , ,850 4,967,120 REVENUE - current ($000) - Dev. Charge Receipts $ Interest on Opening Balance $ Interest on In-year Transactions (excl.int.) $0.00 TOTAL REVENUE $0.00 CLOSING CASH BALANCE Allocation of Capital Program 2014 Adjusted Charge Per Capita $0.00 Residential Sector 71.0% Non-Residential Sector 29.0% Rates for 2014 Inflation Rate: 2.0% Interest Rate on Positive Balances 3.5% Interest Rate on Negative Balances 5.5%
170 167 APPENDIX B.7 TRANSIT
171 168 APPENDIX B.7 TRANSIT Brampton Transit is responsible for the provision of public transportation in the City of Brampton. Transit is provided through a surface route network that stretches across the City, with over 300 buses and a variety of associated equipment and infrastructure. TABLE 1 HISTORIC SERVICE LEVELS Brampton Transit operates out of 413,500 square feet of transit yards worth $68.61 million. Service centres and terminals are valued at $27.98 million. The acres of land associated with Transit buildings and terminals are valued at $51.42 million. There are currently about 1,600 bus shelters and pads associated with Brampton Transit valued at $21.35 million. Stops and bus loops total $23.59 million. A variety of equipment, such as; radios, fare boxes, hoists and smartbus equipment adds another $35.51 million to the inventory. Finally, the 354 transit-related vehicles valued at $ million are included. The fleet and equipment includes conventional, Brampton Rapid Transit, and articulated busses, as well as trucks and maintenance vehicles. The total inventory of capital assets associated with Brampton Transit amounts to $ million. This results in a ten-year average historic service level of $ per population and employee. This service level, multiplied by the ten-year forecast of net population and employment growth results in a ten-year maximum allowable funding envelope of $76.20 million (210,010 net population and employment growth x historic service level of $362.86/population and employee). Recent capital investments in transit, funded through a variety of sources including property taxes, have resulted in an excess capacity of service. In consultation with staff, it has been determined that the $ million in calculated excess capacity is deemed to be committed excess capacity and this amount is not deducted from the funding envelope calculation. Transit must be reduced by ten per cent as required
172 169 under the DCA. The resulting net maximum allowable funding envelope is reduced to $68.58 million. The second component of the service level is the calculated congestion adjustment. MMM Group in consultation with City staff have calculated the adjustment at 6 per cent and applied to the maximum allowable funding envelope. A supporting memorandum on the congestion adjustment, prepared by MMM Group, is appended (Note to Draft: need to attach). The resulting funding envelope carried forwards to the development charges calculation is increased, therefore by 6 per cent, to $72.69 million. TABLE PROVISIONAL DEVELOPMENT-RELATED CAPITAL BUDGET& CALCULATION OF THE UNADJUSTED DEVELOPMENT CHARGES The gross development-related capital program for transit amounts to $ million and accounts for the recovery of a transit service negative reserve fund balance, two new minor terminals, the construction of a new maintenance and storage facility garage, additional vehicles and new bus shelters, pads and stops. The first project in the transit services capital program is for the recovery of the negative reserve fund balance. The negative reserve fund relates to the previously committed excess capacity. The negative DC reserve fund balance for transit services amounts to $40.44 million (after the 10 per cent statutory discount) and this full amount is brought forward for recovery through development charges. The capital program includes two minor transit terminals in 2014 and 2015 located in the northeast and northwest end of the City respectively. The combined cost of both of these facilities totals $1.50 million. In addition, the City anticipates constructing a new maintenance and storage facility garage in 2018 for a cost of $75.00 million. The most significant portion of the capital program is associated with the acquisition of new buses and rapid transit vehicles throughout the forecast period. Vehicle acquisitions amount to $ million. The City anticipates continuing utilizing dedicated gas tax revenue to offset the cost of acquiring new transit vehicles, and therefore, $ million in grants, subsidies and other recoveries has been identified to offset the cost of acquiring new vehicles.
173 170 Lastly, over the next ten-years the City expects to add bus shelters, pads and stops for a total cost of $4.20 million. Similarly, the City anticipates continuing utilizing dedicated gas tax revenue to offset project cost, and therefore, $1.08 million in grants, subsidies and other recoveries has been identified to offset the cost of acquiring new bus shelters, pads and stops. The ten year capital forecast for Transit service totals $ million. Of the total $ million in gross project costs, $ million is to be funded by alternative sources. No replacement/benefit to existing shares are identified. The legislated ten per cent discount amounts to $18.17 million and will be funded from nondevelopment charge sources. An additional portion of the program ($90.86 million) will be netted out as it is deemed to provide benefit beyond the planning period and will be eligible for funding under subsequent development charges. The DC costs eligible for recovery amounts to $72.70 million. This amount is allocated 71 per cent against residential development, or $51.62 million, and 29 per cent against non-residential development, or $21.08 million, based on the ratio of forecast growth in population in new units and employment. This yields unadjusted development charge rates of $ per capita and $4.24 per square metre, respectively. TABLE 3 CASH FLOW ANALYSIS After cash flow and reserve fund consideration, both the residential and nonresidential calculated charges increase to $ per capita and $4.79 per square metre, respectively. This is a reflection of the timing of the capital program and development charges revenues. The following table summarizes the calculation of the transit development charge: TRANSIT SUMMARY 10-year Hist. Service Level Development-Related Capital Program ($000's) Unadjusted Development Charge Adjusted Development Charge $/pop & emp Total Net DC Recoverable $/capita $/sq.m $/capita $/sq.m $ $330,818,650 $72,698,834 $ $4.24 $ $4.79
174 171 APPENDIX B.7 TABLE 1 - PAGE 1 TRANSIT INVENTORY OF CAPITAL ASSETS TRANSIT YARDS # of Square Feet UNIT COST Description ($/sq.ft) Transit Yard 185 Clark Blvd 149, , , , , , , , , ,197 $180 Transit Yard Sandalwood Facility , , , , , ,289 $158 Total (sq.ft.) 149, , , , , , , , , ,486 Total ($000) $26,855 $26,855 $26,855 $26,855 $68,613 $68,613 $68,613 $68,613 $68,613 $68,613 SERVICE CENTRES/TERMINALS Total Value of Transit Service Centres/Terminals ($000) Description Bramalea Transit Terminal $2,821.6 $2,821.6 $2,821.6 $2,821.6 $2,821.6 $2,821.6 $7,542.2 $7,542.2 $7,542.2 $7,542.2 Downtown Terminal $2,069.1 $2,069.1 $2,069.1 $2,069.1 $2,069.1 $2,069.1 $2,069.1 $2,069.1 $2,069.1 $2,069.1 Gateway Transit Terminal (A and B) $1,823.9 $1,823.9 $1,823.9 $1,823.9 $1,823.9 $1,823.9 $1,823.9 $1,823.9 $10,190.3 $10,190.3 Heart Lake Terminal $141.1 $141.1 $141.1 $141.1 $141.1 $141.1 $141.1 $141.1 $1,034.6 $1,034.6 Mount Pleasant GO Station Drivers Room $3,414 $3,414 $3,414 Mount Pleasant Village Terminal $3,326 $3,326 $3,326 Trinity Common Terminal $407.4 $407.4 $407.4 $407.4 $407.4 $407.4 $407.4 $407.4 $407.4 $407.4 Total Terminals / Service Center ($000) 7,263 7,263 7,263 7,263 7,263 7,263 11,984 18,723 27,983 27,983 LAND # of Acres UNIT COST Facility Name ($/acre) Transit Yards Transit Yard 185 Clark Blvd $700,000 Transit Yard Sandalwood Facility $850,000 Terminals Bramalea Transit Terminal $2,000,000 Downtown Terminal $2,500,000 Gateway Transit Terminal (A and B) $2,000,000 Heart Lake Terminal $1,500,000 Mount Pleasant GO Station Drivers Room $700,000 Mount Pleasant Village Terminal $700,000 Trinity Common Terminal $1,500,000 Total (acres) Total ($000) $15,236.0 $15,236.0 $15,236.0 $15,236.0 $34,701.0 $34,701.0 $47,741.0 $50,681.0 $51,421.0 $51,421.0
175 172 APPENDIX B.7 TABLE 1 - PAGE 2 TRANSIT INVENTORY OF CAPITAL ASSETS BUS SHELTERS/PADS Sheters/Pads UNIT COST Description ($/Item) Zum Stations - Minor (with Pad) $174,300 Zum Stations - Major (with Pad) $257,900 Bike Shelters (4'x8') $10,300 Bike Shelters (8'x8') $13,600 Conventional Bus Shelters / Pads (#) $7,800 Pads Only (#) ,047 $2,200 Total (#) ,133 1,208 1,319 1,413 1,514 1,605 Total Shelters / Pads ($000) $2,862.8 $3,139.6 $3,608.2 $4,032.0 $4,542.2 $4,847.2 $11,793.9 $16,802.4 $21,022.3 $21,354.1 STOPS/LOOPS Stops/Loops UNIT COST ($/Item) Bus Stops (Signs) 1,530 1,709 1,812 1,889 1,958 2,021 2,095 2,165 2,235 2,299 $172 Bus Bays $440,000 Bus Loops (#) $757,600 Total (#) 1,530 1,709 1,812 1,889 1,958 2,021 2,117 2,202 2,287 2,351 Total Stops/Loops ($000) $263.2 $293.9 $311.7 $324.9 $336.8 $347.6 $10,040.3 $16,970.0 $23,582.0 $23,593.0
176 173 APPENDIX B.7 TABLE 1 - PAGE 3 TRANSIT INVENTORY OF CAPITAL ASSETS EQUIPMENT Total Equipment UNIT COST Items ($/Item) Presto Equipment MSP Bus Fare Transaction Processor $2,640 Driver Control Unit $9,410 Service Provider Audit Access Computer $10,160 Station Point of Sale Device - Cash Drawer Option $420 Card Query Device, Wall & Pole Mounted $3,940 Station Point of Sale Device $9,820 Third Party Terminal (TPT/TPI) $3,220 Depot Data Concentrator $10,160 Depot Shift Computer with Card Interface Device $10,880 Depot Wireless Data Transmission System (Clark) $15,770 Wireless Bus Depot Site (Sandalwood) $224,900 Fare boxes $13,400 Receiver $63,500 Coin Sorter $12,000 Wrapper $18,550 Other Equipment Scaffolding $8,990 40' Hoists $168,170 60' Hoists $258,000 Tire Balancer $11,000 Tire Machine $13,000 Smartbus Equipment ($000) WiFi Switches and Equipment for all 3 Corridors $0 $0 $0 $0 $0 $5 $745 $2,384 $6,341 $6,611 Central System $0 $0 $0 $0 $0 $2,822 $2,822 $2,822 $2,822 $2,822 Other Smartbus Equipment $0 $0 $0 $0 $0 $8,688 $10,624 $12,603 $14,142 $15,099 Total (#) ,048 1,134 1,197 Sub-total ($000) $2,509.0 $2,750.2 $3,004.8 $3,165.6 $3,926.2 $15,831.3 $22,871.3 $27,532.1 $33,715.0 $35,510.0
177 174 APPENDIX B.7 TABLE 1 - PAGE 4 TRANSIT INVENTORY OF CAPITAL ASSETS VEHICLES # of Vehicles UNIT COST Type of Vehicle ($/Item) 40' Conventional Bus $427,000 40' BRT Bus $712,000 60' Articulated Bus $952,000 Mtce Trucks $49,000 Sander $8,325 Fork Lift $46,620 Trailer $7,500 Bobcat $29,400 Washer $12,000 Sweeper $75,000 Sub-total (#) Sub-total ($000) $68,267.8 $75,526.8 $83,212.8 $88,383.5 $90,697.4 $102,079.4 $119,879.4 $139,811.4 $162,267.4 $168,823.7
178 175 APPENDIX B.7 TABLE 1 - PAGE 5 TRANSIT SUMMARY OF SERVICE LEVEL ANALYSIS Historic Population 386, , , , , , , , , ,800 Historic Employment 146, , , , , , , , , ,570 Total Historic Population & Employment 533, , , , , , , , , ,370 INVENTORY SUMMARY ($000) Transil Facilities $26,855 $26,855 $26,855 $26,855 $68,613 $68,613 $68,613 $68,613 $68,613 $68,613 Service Centres/Terminals $7,263 $7,263 $7,263 $7,263 $7,263 $7,263 $11,984 $18,723 $27,983 $27,983 Land $15,236 $15,236 $15,236 $15,236 $34,701 $34,701 $47,741 $50,681 $51,421 $51,421 Bus Shelters/Pads $2,863 $3,140 $3,608 $4,032 $4,542 $4,847 $11,794 $16,802 $21,022 $21,354 Stops/Loops $263 $294 $312 $325 $337 $348 $10,040 $16,970 $23,582 $23,593 Equipment $2,509 $2,750 $3,005 $3,166 $3,926 $15,831 $22,871 $27,532 $33,715 $35,510 Vehicles $68,268 $75,527 $83,213 $88,383 $90,697 $102,079 $119,879 $139,811 $162,267 $168,824 Total ($000) $123,257 $131,065 $139,492 $145,261 $210,080 $233,683 $292,923 $339,133 $388,603 $397,298 SERVICE LEVEL ($/pop & employ) Average Service Level Transil Facilities $50.36 $47.89 $45.54 $44.06 $ $ $ $98.58 $95.29 $92.30 $79.02 Service Centres/Terminals $13.62 $12.95 $12.32 $11.92 $11.53 $11.15 $17.80 $26.90 $38.86 $37.64 $19.47 Land $28.57 $27.17 $25.84 $25.00 $55.08 $53.28 $70.91 $72.82 $71.42 $69.17 $49.93 Bus Shelters/Pads $5.37 $5.60 $6.12 $6.62 $7.21 $7.44 $17.52 $24.14 $29.20 $28.73 $13.79 Stops/Loops $0.49 $0.52 $0.53 $0.53 $0.53 $0.53 $14.91 $24.38 $32.75 $31.74 $10.69 Equipment $4.71 $4.90 $5.10 $5.19 $6.23 $24.31 $33.97 $39.56 $46.82 $47.77 $21.86 Vehicles $ $ $ $ $ $ $ $ $ $ $ Total ($/pop & employ) $ $ $ $ $ $ $ $ $ $ $ CALCULATION OF MAXIMUM ALLOWABLE TRANSIT 10-Year Funding Envelope Calculation Excess Capacity Calculation 10 Year Average Service Level $ Total Value of Inventory in 2013 $ 397,297,573 Net Population & Employment Growth ,010 Inventory Using Average Service Level $ 269,739,238 Maximum Allowable Funding Envelope 76,204,229 Excess Capacity $127,558,334 Less: Uncommitted Excess Capacity $0 Excess Capacity: Committed Less: 10% Legislated Reduction $7,620,423 Discounted Maximum Allowable Funding Envelope $68,583,806 Congestion 6% $4,115,028 REVISED MAXIMUM ALLOWABLE $72,698,834
179 176 APPENDIX B-7 TABLE 2 CITY OF BRAMPTON 2014 DEVELOPMENT CHARGES BACKGROUND STUDY DEVELOPMENT-RELATED CAPITAL PROGRAM Gross Grants/ Net Ineligible Cost Total DC Eligible Costs Service Project Description Timing Project Subsidies/Other Municipal Replacement 10% DC Eligble Available DC Post Cost Recoveries Cost and BTE Share Reduction Costs Reserves TRANSIT 7.1 Recovery of Negative Reserve Fund Balance 2014 $ 44,936,650 $ - $ 44,936,650 $ - $ 4,493,665 $ 40,442,985 $ - $ 40,442,985 $ Buildings, Land & Equipment Minor Terminal in Northeast End 2015 $ 750,000 $ - $ 750,000 $ - $ 75,000 $ 675,000 $ - $ 675,000 $ Minor Terminal in Northwest End 2014 $ 750,000 $ - $ 750,000 $ - $ 75,000 $ 675,000 $ - $ 675,000 $ Maintenance and Storage Facility Garage 2018 $ 75,000,000 $ - $ 75,000,000 $ - $ 7,500,000 $ 67,500,000 $ - $ - $ 67,500,000 $ 76,500,000 $ - $ 76,500,000 $ - $ 7,650,000 $ 68,850,000 $ - $ 1,350,000 $ 67,500, Vehicles Bus Purchases 2014 $ 4,725,000 $ 3,150,000 $ 1,575,000 $ - $ 157,500 $ 1,417,500 $ - $ 1,417,500 $ Bus Purchases 2015 $ 6,825,000 $ 3,675,000 $ 3,150,000 $ - $ 315,000 $ 2,835,000 $ - $ 2,835,000 $ Bus Purchases 2016 $ 6,825,000 $ 4,725,000 $ 2,100,000 $ - $ 210,000 $ 1,890,000 $ - $ 1,890,000 $ Bus Purchases 2017 $ 5,775,000 $ 4,725,000 $ 1,050,000 $ - $ 105,000 $ 945,000 $ - $ 945,000 $ Bus Purchases 2018 $ 5,775,000 $ 4,725,000 $ 1,050,000 $ - $ 105,000 $ 945,000 $ - $ 945,000 $ Queen Street LRT 2014 $ 1,200,000 $ 660,000 $ 540,000 $ - $ 54,000 $ 486,000 $ - $ 486,000 $ Zum 2014 $ 42,067,000 $ 35,580,000 $ 6,487,000 $ - $ 648,700 $ 5,838,300 $ - $ 5,838,300 $ Zum 2015 $ 23,628,000 $ 16,041,000 $ 7,587,000 $ - $ 758,700 $ 6,828,300 $ - $ 6,828,300 $ Zum 2016 $ 4,186,000 $ 718,000 $ 3,468,000 $ - $ 346,800 $ 3,121,200 $ - $ 3,121,200 $ Zum 2017 $ 1,573,000 $ - $ 1,573,000 $ - $ 157,300 $ 1,415,700 $ - $ 1,415,700 $ Provision for additional buses (post 2017) Various $ 102,600,000 $ 74,010,000 $ 28,590,000 $ - $ 2,859,000 $ 25,731,000 $ - $ 2,375,849 $ 23,355,151 $ 205,179,000 $ 148,009,000 $ 57,170,000 $ - $ 5,717,000 $ 51,453,000 $ - $ 28,097,849 $ 23,355, Other Transit Bus Shelters/Pads/Stops 2014 $ 459,000 $ 147,000 $ 312,000 $ - $ 31,200 $ 280,800 $ - $ 280,800 $ Bus Shelters/Pads/Stops 2015 $ 416,000 $ 104,000 $ 312,000 $ - $ 31,200 $ 280,800 $ - $ 280,800 $ Bus Shelters/Pads/Stops 2016 $ 416,000 $ 104,000 $ 312,000 $ - $ 31,200 $ 280,800 $ - $ 280,800 $ Bus Shelters/Pads/Stops 2017 $ 416,000 $ 104,000 $ 312,000 $ - $ 31,200 $ 280,800 $ - $ 280,800 $ Bus Shelters/Pads/Stops 2018 $ 416,000 $ 104,000 $ 312,000 $ - $ 31,200 $ 280,800 $ - $ 280,800 $ Bus Shelters/Pads/Stops 2019 $ 416,000 $ 104,000 $ 312,000 $ - $ 31,200 $ 280,800 $ - $ 280,800 $ Bus Shelters/Pads/Stops 2020 $ 416,000 $ 104,000 $ 312,000 $ - $ 31,200 $ 280,800 $ - $ 280,800 $ Bus Shelters/Pads/Stops 2021 $ 416,000 $ 104,000 $ 312,000 $ - $ 31,200 $ 280,800 $ - $ 280,800 $ Bus Shelters/Pads/Stops 2022 $ 416,000 $ 104,000 $ 312,000 $ - $ 31,200 $ 280,800 $ - $ 280,800 $ Bus Shelters/Pads/Stops 2023 $ 416,000 $ 104,000 $ 312,000 $ - $ 31,200 $ 280,800 $ - $ 280,800 $ - $ 4,203,000 $ 1,083,000 $ 3,120,000 $ - $ 312,000 $ 2,808,000 $ - $ 2,808,000 $ - TOTAL TRANSIT $ 330,818,650 $ 149,092,000 $ 181,726,650 $ - $ 18,172,665 $ 163,553,985 $ - $ 72,698,834 $ 90,855,151 Residential Development Charge Calculation Residential Share of DC Eligible Costs 71% $51,616, Net Funding Envelope for Transit $72,698, Year Growth in Population in New Units 162,396 Unadjusted Development Charge Per Capita ($) $ Reserve Fund Balance ($40,442,985) Non-Residential Development Charge Calculation Non-Residential Share of DC Eligible Costs 29% $ 21,082, Year Growth in Square Meters 4,967,120 Unadjusted Development Charge Per Sq.M ($) $4.24
180 177 APPENDIX B.7 TABLE 3 - PAGE 1 CITY OF BRAMPTON CASHFLOW AND DETERMINATION OF DEVELOPMENT CHARGE TRANSIT RESIDENTIAL DEVELOPMENT CHARGE 7.00 TRANSIT OPENING CASH BALANCE FROM APPLICABLE RESERVES TOTAL OPENING CASH BALANCE ($000) 0.0 (30,590.0) (34,273.4) (34,138.5) (31,474.6) (27,345.0) (22,142.7) (16,780.7) (11,313.4) (5,865.6) RESIDENTIAL FUNDING REQUIREMENTS 7.00 TRANSIT - constant ($000) $35, $7, $3, $2, $1, $ $ $ $ $ $51, TRANSIT - current ($000) $35, $7, $4, $2, $1, $ $ $ $ $ $52, POPULATION GROWTH - Population in New Units 14,619 16,034 16,131 17,281 17,586 17,523 16,894 16,135 15,096 15, ,396 REVENUE - current ($000) - Dev. Charge Receipts 5, , , , , , , , , ,525.3 $64, Interest on Opening Balance 0.0 (1,682.5) (1,885.0) (1,877.6) (1,731.1) (1,504.0) (1,217.8) (922.9) (622.2) (322.6) ($11,765.82) - Interest on In-year Transactions (excl.int.) (818.7) (53.6) ($109.31) TOTAL REVENUE 4, , , , , , , , , ,309.2 $52, CLOSING CASH BALANCE (30,590.0) (34,273.4) (34,138.5) (31,474.6) (27,345.0) (22,142.7) (16,780.7) (11,313.4) (5,865.6) Adjusted Charge Per Capita $ Allocation of Capital Program Residential Sector 71.0% Non-Residential Sector 29.0% Rates for 2014 Inflation Rate 2.0% Interest Rate on Positive Balances 3.5% Interest Rate on Negative Balances 5.5%
181 178 APPENDIX B.7 TABLE 3 - PAGE 2 CITY OF BRAMPTON CASHFLOW AND DETERMINATION OF DEVELOPMENT CHARGE TRANSIT NON-RESIDENTIAL DEVELOPMENT CHARGE 7.00 TRANSIT OPENING CASH BALANCE FROM APPLICABLE RESERVES TOTAL OPENING CASH BALANCE ($000) $0.00 ($12,010.93) ($13,023.87) ($12,572.77) ($11,604.05) ($10,295.56) ($8,421.63) ($6,439.25) ($4,359.94) ($2,287.51) NON-RESIDENTIAL FUNDING REQUIREMENTS 7.00 Transit : Non Inflated $14, $3, $1, $ $ $ $ $ $ $ $21, Transit: Inflated $14, $3, $1, $ $ $ $ $ $ $ $21, NON-RESIDENTIAL GROWTH - Sq. Metres in New Buildings 549, , , , , , , , , ,850 4,967,120 REVENUE - current ($000) - Dev. Charge Receipts 2, , , , , , , , , ,569.4 $25, Interest on Opening Balance 0.0 (660.6) (716.3) (691.5) (638.2) (566.3) (463.2) (354.2) (239.8) (125.8) ($4,455.85) - Interest on In-year Transactions (excl.int.) (321.5) (9.4) ($41.30) TOTAL REVENUE 2, , , , , , , , , ,485.4 $21, CLOSING CASH BALANCE (12,010.9) (13,023.9) (12,572.8) (11,604.1) (10,295.6) (8,421.6) (6,439.3) (4,359.9) (2,287.5) 18.2 Allocation of Capital Program 2014 Adjusted Charge Per Capita $4.79 Residential Sector 71.0% Non-Residential Sector 29.0% Rates for 2014 Inflation Rate: 2.0% Interest Rate on Positive Balances 3.5% Interest Rate on Negative Balances 5.5%
182 179
183 180
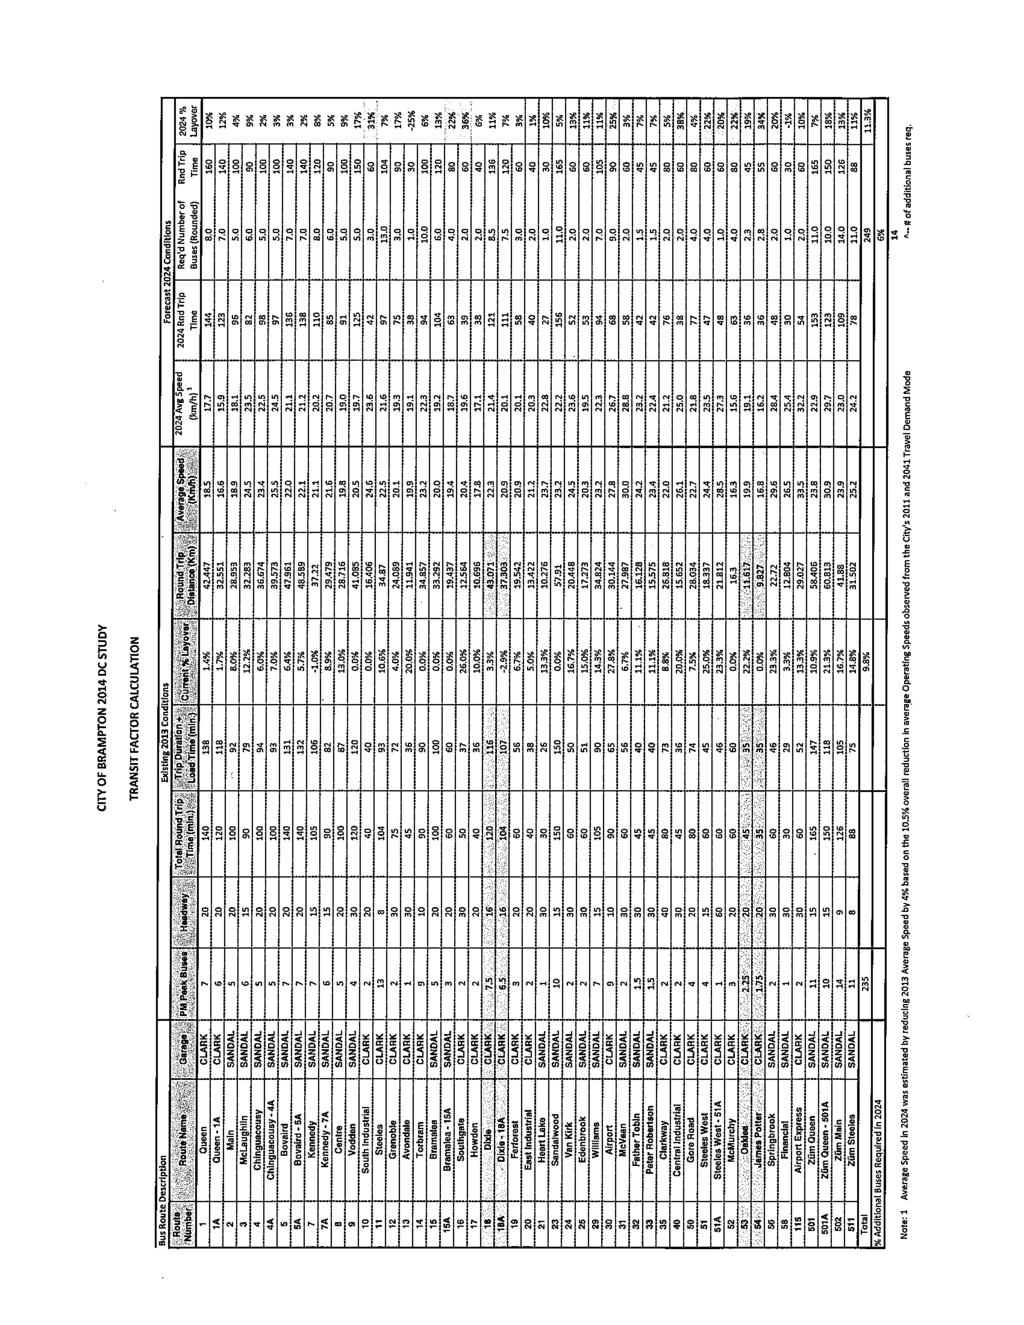
184 181
HEMSON C o n s u l t i n g L t d
 DEVELOPMENT CHARGES BACKGROUND STUDY Town of Gravenhurst C o n s u l t i n g L t d April, 2014 TABLE OF CONTENTS EXECUTIVE SUMMARY... 1 I INTRODUCTION... 7 II A TOWN-WIDE UNIFORM CHARGE APPROACH TO ALIGN
DEVELOPMENT CHARGES BACKGROUND STUDY. City of Woodstock. HEMSON C o n s u l t i n g L t d
 DEVELOPMENT CHARGES BACKGROUND STUDY City of Woodstock C o n s u l t i n g L t d April 6, 2018 TABLE OF CONTENTS Executive Summary... 1 I Introduction... 10 II A CityWide Methodology Aligns DevelopmentRelated
DEVELOPMENT CHARGES BACKGROUND STUDY STAFF CONSOLIDATION REPORT. HEMSON C o n s u l t i n g L t d. Grey County
 DEVELOPMENT CHARGES BACKGROUND STUDY Grey County STAFF CONSOLIDATION REPORT C o n s u l t i n g L t d. November 17, 2016 C o n s u l t i n g L t d. COUNTY OF GREY 2016 DEVELOPMENT CHARGES BACKGROUND STUDY
DEVELOPMENT CHARGES BACKGROUND STUDY
 DEVELOPMENT CHARGES BACKGROUND STUDY CONSOLIDATION STUDY C o n s u l t i n g L t d. April 25, 2018 TABLE OF CONTENTS Executive Summary... 1 I Introduction... 12 II III The Methodology Combines A CityWide
DEVELOPMENT CHARGES BACKGROUND STUDY
 DEVELOPMENT CHARGES BACKGROUND STUDY Revised City of Mississauga C o n s u l t i n g L t d. September 2009 TABLE OF CONTENTS EXECUTIVE SUMMARY... 1 I INTRODUCTION... 10 II METHODOLOGY IS BASED ON A CITY-WIDE
DEVELOPMENT CHARGES BACKGROUND STUDY. Staff Consolidation Report Accessible Version. HEMSON C o n s u l t i n g L t d.
 DEVELOPMENT CHARGES BACKGROUND STUDY Staff Consolidation Report Accessible Version HEMSON C o n s u l t i n g L t d. June 23, 215 Table of Contents Executive Summary... 1 I Introduction... 1 II A Municipal-Wide
2017 DEVELOPMENT CHARGES BACKGROUND STUDY. HEMSON C o n s u l t i n g L t d
 2017 DEVELOPMENT CHARGES BACKGROUND STUDY C o n s u l t i n g L t d June 23, 2017 TABLE OF CONTENTS EXECUTIVE SUMMARY... 1 I INTRODUCTION... 11 II A MUNICIPAL-WIDE METHODOLOGY ALIGNS DEVELOPMENT- RELATED
DEVELOPMENT CHARGES BACKGROUND STUDY
 DEVELOPMENT CHARGES BACKGROUND STUDY Town of New Tecumseth C o n s u l t i n g L t d. May 29, 2013 Amended June 18, 2014 TABLE OF CONTENTS EXECUTIVE SUMMARY... 1 I INTRODUCTION... 10 II THE METHODOLOGY
DEVELOPMENT CHARGES BACKGROUND STUDY
 DEVELOPMENT CHARGES BACKGROUND STUDY Town of Innisfil C o n s u l t i n g L t d. July 19, 2018 TABLE OF CONTENTS EXECUTIVE SUMMARY... 1 I PURPOSE OF THE DEVELOPMENT CHARGES BACKGROUND STUDY... 6 A. INTRODUCTION
2018 Development Charges Background Study. Report For Public Consultation. HEMSON C o n s u l t i n g L t d.
 2018 Development Charges Background Study Report For Public Consultation C o n s u l t i n g L t d. January 9, 2018 Table of Contents Executive Summary... 1 I Purpose of 2018 Development Charges Background
U BRAMPTON l"' J Co..
 U BRAMPTON l"' J Co.. Report SS Flower City,. Jpty Council ' The Corporation of the City of Brampton,, no on_ BRAMPTON CITY COUNCIL Date: May 28, 2014 File: Subject: Contact: F85.POL 2014 Development Charges
City of Brampton DEVELOPMENT CHARGES BACKGROUND STUDY AND DRAFT DEVELOPMENT CHARGE BY-LAWS. June 22 nd, :00pm
 City of Brampton DEVELOPMENT CHARGES BACKGROUND STUDY AND DRAFT DEVELOPMENT CHARGE BY-LAWS Public Meeting of Council June 22 nd, 2009 3:00pm Council Chambers Objectives of Development Charge Review Present
TOWN OF AURORA DEVELOPMENT CHARGE BACKGROUND STUDY AND PROPOSED BY-LAW OFFICE CONSOLIDATION MARCH 12, (As Amended April 8 th, 2014)
") TOWN OF AURORA DEVELOPMENT CHARGE BACKGROUND STUDY AND PROPOSED BY-LAW OFFICE CONSOLIDATION MARCH 12, 2014 (As Amended April 8 th, 2014) CONTENTS Page EXECUTIVE SUMMARY (i) 1. INTRODUCTION 1.1 Purpose
TOWN OF AURORA DEVELOPMENT CHARGE BACKGROUND STUDY AND PROPOSED BY-LAW OFFICE CONSOLIDATION MARCH 12, 2014 (As Amended April 8 th, 2014) CONTENTS Page EXECUTIVE SUMMARY (i) 1. INTRODUCTION 1.1 Purpose
CITY OF SAULT STE. MARIE 2016 DEVELOPMENT CHARGES BACKGROUND STUDY. Draft for Public Circulation and Comment
 CITY OF SAULT STE. MARIE 2016 DEVELOPMENT CHARGES BACKGROUND STUDY Draft for Public Circulation and Comment JUNE 8, 2016 CONTENTS Page 1. INTRODUCTION 1.1 Purpose of this Document 1-1 1.2 Development Charges
Report to: General Committee Meeting Date: December 5, 2017
 Report to: General Committee Meeting Date: December 5, 2017 SUBJECT: 2017 Development s Background Study PREPARED BY: Kevin Ross, Manager, Development Finance Ext. 2126 RECOMMENDATION: 1) THAT the report
Town of Oakville Development Charge Background Study. Consolidated Report. In association with
 Development Charge Background Study Consolidated Report This report consolidates the December 22,2017 Background Study, the February 8, 2018 Addendum 1 Report, and the February 23, 2018 Addendum 2 Report
CITY OF GUELPH DEVELOPMENT CHARGE BACKGROUND STUDY. Consolidated Report. Includes: Development Charge Background Study, Dated: November 1, 2013
 CITY OF GUELPH DEVELOPMENT CHARGE BACKGROUND STUDY Consolidated Report Includes: Development Charge Background Study, Dated: November 1, 2013 Addendum No.1 To City of Guelph Development Charge Background
HEMSON GROWTH FORECAST
 GROWTH FORECASTS 17 III GROWTH FORECAST This section provides the basis for the growth forecasts used in calculating the development charges and provides a summary of the forecast results. The growth forecast
City of Pickering 2017 Development Charges Background Study
 City of Pickering 2017 Development Charges Background Study Office Consolidation Incorporating the Background Study (October 5, 2017) as Amended and Approved by Council on December 11, 2017 Prepared January
5 Draft 2017 Development Charge Background Study and Proposed Bylaw
 Clause 5 in Report No. 3 of Committee of the Whole was adopted, without amendment, by the Council of The Regional Municipality of York at its meeting held on February 16, 2017. 5 Draft 2017 Development
Today we will discuss...
 City of Brantford 2019 Development Charges Study Public Information Centre #1 Friday, September 28 th, 2018 Today we will discuss... Background What are Development Charges? DCs in Brantford Development
2019 Development Charges Study Technical Stakeholder Consultation. Wednesday, November 21, 2018 Burnhamthorpe Community Centre
 2019 Development Charges Study Technical Stakeholder Consultation Wednesday, November 21, 2018 Burnhamthorpe Community Centre Today we will discuss... Introductions City DC Survey Results Overview of the
Background. Request for Decision. Proposed Changes to City's Development Charges By-Law and Rates. Recommendation. Presented: Tuesday, Apr 29, 2014
 Presented To: City Council Request for Decision Proposed Changes to City's Development Charges By-Law and Rates Presented: Tuesday, Apr 29, 2014 Report Date Wednesday, Apr 23, 2014 Type: Presentations
Table of Contents. Capital - 2
 CAPITAL OVERVIEW Table of Contents 2018-2020 Budget Summary CAP-3 2018 Funding Breakdown CAP-4 2018-2020 Development Charge Reserve Projections CAP-5 Asset Management CAP-6 2018 Cash Flow Projection CAP-8
REGIONAL DEVELOPMENT CHARGE BACKGROUND STUDY
 Executive Summary 2018 Development Charge Background Study March 27, 2018 Page 1. REGION OF DURHAM REGIONAL DEVELOPMENT CHARGE BACKGROUND STUDY Prepared by: THE REGIONAL MUNICIPALITY OF DURHAM AND WATSON
DEVELOPMENT CHARGES BACKGROUND STUDY UPDATE. General Committee May 1, 2017
 DEVELOPMENT CHARGES BACKGROUND STUDY UPDATE General Committee May 1, 2017 Agenda 1. Overview of Development Charge Act 2. Types of Development Charges 3. Calculation of Development Charges 4. Current Development
2014 Development Charges
 DEVELOPMENT FINANCE 2014 Development Charges Background Study Amended June 2014 City of London 2014 Development Charges Background Study TABLE OF CONTENTS CHAPTER 1 - EXECUTIVE SUMMARY... 1 CHAPTER 2
Hemson Growth Forecast / Planning Assumptions for Growth Scenarios Tested
 Hemson Growth Forecast / Planning Assumptions for Growth Scenarios Tested The overall method for the forecast is based on the approach and models used for the preparation of the forecasts in Schedule 3
Appendix 3. HEMSON C o n s u l t i n g L t d.
 Appendix 3 DEVELOPMENT CHARGES BACKGROUND STUDY City of Toronto ADDENDUM REPORT C o n s u l t i n g L t d. September 13, 2013 Appendix 3 TABLE OF CONTENTS I BACKGROUND... 1 II CHANGES TO JUNE DC BACKGROUND
City of Waterloo Development Charge Background Study
 City of Waterloo Development Charge Background Study September 29, 2017 Contents Page xecutive Summary... i 1. Introduction... 1-1 1.1 Purpose of this Document... 1-1 1.2 Summary of the Process... 1-1
2017 Development Charges Background Study
 REGION OF HALTON 2017 Development Charges Background Study FOR WATER, WASTEWATER, ROADS & GENERAL SERVICES DEVELOPMENT CHARGES December 14, 2016 EXECUTIVE SUMMARY TABLE OF CONTENTS Page (i) 1. INTRODUCTION
City of Cornwall Development Charges Background Study. Council Presentation
 City of Cornwall 2017 Development Charges Background Study Council Presentation June 12, 2017 Development Charges Purpose of Development Charges (D.C.) is to recover the capital costs associated with residential
City of Toronto 2018 Development Charges Bylaw Review. Statutory Public Meeting Executive Committee January 24, 2018
 City of Toronto 2018 Development Charges Bylaw Review Statutory Public Meeting Executive Committee January 24, 2018 Today we will discuss 1. Introduction 2. DC Review Process 3. DC Rate Calculation 4.
City of London Development Charges Background Study. April 2009
 City of London Development Charges Background Study April 2009 ii Table of Contents 1 CHAPTER 1 - EXECUTIVE SUMMARY...1 2 CHAPTER 2 - DEVELOPMENT CHARGES PURPOSE AND STUDY PROCESS...4 3 CHAPTER 3 - CALCULATION
Development Charges and Cost of Growth Analysis Town of Whitby Case Study Friday, September 22, 2017
 Development Charges and Cost of Growth Analysis Town of Whitby Case Study Friday, September 22, 2017 Craig Binning - Partner, Hemson Consulting Jennifer Hess - Financial Analyst, Town of Whitby Overview
LONG-TERM FINANCIAL MASTER PLAN. City of Brampton. HEMSON C o n s u l t i n g L t d.
 LONG-TERM FINANCIAL MASTER PLAN City of Brampton C o n s u l t i n g L t d. May 17, 2017 TABLE OF CONTENTS EXECUTIVE SUMMARY... 1 A. THE CITY S OVERALL FINANCIAL POSITION... 1 B. KEY DIRECTIONS TO ACHIEVE
CITY OF BRAMPTON Budget Highlights. As Approved by City Council on February 23, 2011
 CITY OF BRAMPTON 2011 Budget Highlights As Approved by City Council on February 23, 2011 EXEXCUTIVE SUMMARY The current economic climate, meeting provincial growth targets and other budget drivers places
CITY OF OTTAWA 2014 DEVELOPMENT CHARGES BACKGROUND STUDY
 CITY OF OTTAWA 2014 DEVELOPMENT CHARGES BACKGROUND STUDY OFFICE CONSOLIDATION INCORPORATING BACKGROUND STUDY (APRIL 28, 2014) AS AMENDED BY: THE MAY 12 ADDENDUM AND PLANNING COMMITTEE REPORT 70A AS APPROVED
Edward R. Sajecki Commissioner of Planning and Building
 Corporate Report Clerk s Files Originator s Files CD.03.MIS DATE: TO: FROM: SUBJECT: Chair and Members of Planning and Development Committee Meeting Date: January 12, 2009 Edward R. Sajecki Commissioner
CITY OF BRAMPTON COMPREHENSIVE ZONING BY-LAW REVIEW. Technical Paper #3 Minor Variances
 CITY OF BRAMPTON COMPREHENSIVE ZONING BY-LAW REVIEW Technical Paper #3 Minor Variances DRAFT MAY 2018 Table of Contents City of Brampton Comprehensive Zoning By-law Review 1 Introduction... 1 1.1 Background...
Development Charge Bylaw Directions
 Clause 8 in Report No. 17 of Committee of the Whole was adopted, without amendment, by the Council of The Regional Municipality of York at its meeting held on November 17, 2016. 8 Committee of the Whole
6 Draft 2018 Development Charge Background Study and Proposed Draft Bylaw Amendment
 Clause 6 in Report No. 3 of Committee of the Whole was adopted, without amendment, by the Council of The Regional Municipality of York at its meeting held on February 15, 2018. 6 Draft 2018 Development
TOWN OF AJAX 2013 DEVELOPMENT CHARGES BACKGROUND STUDY
 TOWN OF AJAX 2013 DEVELOPMENT CHARGES BACKGROUND STUDY JUNE 19, 2013 CONTENTS Page EXECUTIVE SUMMARY (i) 1. DEVELOPMENT CHARGES ACT BACKGROUND STUDY REQUIREMENTS 1.1 Introduction 1-1 1.2 Ajax Development
SECTION 20 FUTURE DEVELOPMENT (FD) ZONE
 ZONE") SECTION 20 FUTURE DEVELOPMENT (FD) ZONE No person shall within a Future Development (FD) Zone use any land or erect, alter or use any building or structure except in accordance with the following provisions:
SECTION 20 FUTURE DEVELOPMENT (FD) ZONE No person shall within a Future Development (FD) Zone use any land or erect, alter or use any building or structure except in accordance with the following provisions:
Development Charges Update
 5.2-1 Development Charges Update Growth Management Committee February 5th, 2015 5.2-2 Previous Growth Management Financial Presentations Studies undertaken with Watson & Associates to review growth financing
Budget. Quick. Reference. Guide
 Budget Quick Reference Guide Contents 1 Distribution of Tax Dollars 2 Long-term Budget Goals 3 Operating and Capital Budgets What s the Difference? Impact of Capital Budgets on Operating Budgets 7 Funding
2009 Human Services Budget Presentation to Council
 2009 Human Services Budget Presentation to Council Children s Services Housing Programs Ontario Works January 14, 2009 2009-01-15 1 Departmental Organizational Structure 2009-01-15 2 What We Do Mandate:
BUSINESS PLANS EXECUTIVE SUMMARY
 BUSINESS PLANS EXECUTIVE SUMMARY TABLE OF CONTENTS Message from the Treasurer Highlights Tax Bill Impact About Brampton Municipal Service Delivery Doing More with Less Strategic Plan Exec-3 Exec-4 Exec-6
COUNCIL CHAMBERS, CITY HALL SARNIA, ONTARIO
 SARNIA CITY COUNCIL April 12, 2010 3:30 p.m. COUNCIL CHAMBERS, CITY HALL SARNIA, ONTARIO Page SPECIAL MEETING AGENDA SPECIAL MEETING 3-28 1. BMA Municipal Study 2009 Presentation by Jim Bruzzese Page 1
Adjusted $ % Cumulative Change Change ($000) Actual Actual Budget Budget Budget Budget ' ' '18
 Actual Actual Budget Budget Budget Budget ' ' '18") Corporate Summary Tax-supported Operations Attachment 16-017O Adjusted $ % ($000) Actual Actual Budget Budget Budget Budget 2016 - '18 2015 - '18 2015 -'18 Boards & Commissions Economic Development Corporation
Corporate Summary Tax-supported Operations Attachment 16-017O Adjusted $ % ($000) Actual Actual Budget Budget Budget Budget 2016 - '18 2015 - '18 2015 -'18 Boards & Commissions Economic Development Corporation
CITY OF STRATFORD OFFICIAL PLAN REVIEW BACKGROUND REPORT DEMOGRAPHIC AND ECONOMIC PROFILE AND POPULATION AND HOUSING GROWTH FORECAST NOVEMBER 21, 2012
 CITY OF STRATFORD OFFICIAL PLAN REVIEW BACKGROUND REPORT DEMOGRAPHIC AND ECONOMIC PROFILE AND POPULATION AND HOUSING GROWTH FORECAST NOVEMBER 21, 2012 IN ASSOCIATION WITH: CONTENTS Page 1. INTRODUCTION
2017 DEVELOPMENT CHARGES AMENDMENT BACKGROUND STUDY: ROADS & RELATED SERVICES- TOWN-WIDE INFRASTRUCTURE. HEMSON C o n s u l t i n g L t d
 2017 DEVELOPMENT CHARGES AMENDMENT BACKGROUND STUDY: ROADS & RELATED SERVICES TOWNWIDE INFRASTRUCTURE C o n s u l t i n g L t d July 19, 2017 Table of Contents I PURPOSE OF DEVELOPMENT CHARGES AMENDMENT
Operating and Capital Budgets
 2018-2020 Operating and Capital Budgets Budget Committee Presentation Presented to Budget Committee November 27, 2017 Page 1 Page 1 OUTLINE The Journey Overview Teamwork and Organizational Transformation
Visit our Publications and Open Data Catalogue to find our complete inventory of our freely available information products.
 Welcome to Mississauga Data This report and other related documents can be found at www.mississauga.ca/data. Mississauga Data is the official City of Mississauga website that contains urban planning related
XH-2-1 BUDGET AMENDMENT: SPRINGDALE LIBRARY SITE AND. Dan Kraszewski, Senior Executive Director, Planning Design and
 BRAMPTON XH-2-1 Report City Council bmmpton.ca FIOWCF City The Corporation of the City of Brampton Date: September 11, 2013 File: C30(LIB)2013 BRAMPTON CITY COUNCIL pa-re. Septew&esti, 2oi3 Subject: Contact:
Budget Summary OPER-3. Residential Tax Bill Information. Municipal Price Index (MPI) Corporate Overview. Departmental Breakdown
 Corporate Overview. Departmental Breakdown") OPERATING OVERVIEW Table of Contents 2018-2020 Budget Summary OPER-3 Residential Tax Bill Information Municipal Price Index (MPI) Corporate Overview Departmental Breakdown Revenue Breakdown Expense Breakdown
OPERATING OVERVIEW Table of Contents 2018-2020 Budget Summary OPER-3 Residential Tax Bill Information Municipal Price Index (MPI) Corporate Overview Departmental Breakdown Revenue Breakdown Expense Breakdown
ASSET MANAGEMENT PLAN. HEMSON C o n s u l t i n g L t d. 30 Saint Patrick Street, Suite 1000 Toronto, ON, M5T 3A3
 ASSET MANAGEMENT PLAN C o n s u l t i n g L t d. 30 Saint Patrick Street, Suite 1000 Toronto, ON, M5T 3A3 March 2017 TABLE OF CONTENTS EXECUTIVE SUMMARY... 1 A. STATE OF THE LOCAL INFRASTRUCTURE... 1 B.
Region of Peel. Review of Growth Infrastructure Financing Strategy. Growth Management Committee
 Region of Peel Review of Growth Infrastructure Financing Strategy Growth Management Committee June 5, 2014 Review of Front-End Financing and Growth Infrastructure Financing Strategy Council adopted the
Reserves and Reserve Funds
 Reserves and Reserve Funds Table of Contents 1 Overview... 2 2 Forecast Changes... 4 2.1 Operating Reserves and Reserve Funds... 5 3 Capital Reserve Funds... 8 3.1 Capital Highlights... 9 3.2 10 Year Forecast
Committee of Council Budget December 6, 9 and 10, 2013
 2014 Budget Committee of Council Budget December 6, 9 and 10, 2013 AGENDA 1. Corporate Overview Budget Context Priorities, Opportunities and Challenges Development Outlook Budget Process 2. Financial Overview
City of Antioch Development Impact Fee Study
 Report City of Antioch Development Impact Fee Study Prepared for: City of Antioch Prepared by: Economic & Planning Systems, Inc. February 2014 EPS #20001 Table of Contents 1. INTRODUCTION AND RESULTS...
HACKBERRY HIDDEN COVE PUBLIC IMPROVEMENT DISTRICT NO. 2 SERVICE AND ASSESSMENT PLAN (UTILITY IMPROVEMENTS)
") HACKBERRY HIDDEN COVE PUBLIC IMPROVEMENT DISTRICT NO. 2 SERVICE AND ASSESSMENT PLAN (UTILITY IMPROVEMENTS) SEPTEMBER 15, 2009 HACKBERRY HIDDEN COVE PUBLIC IMPROVEMENT DISTRICT NO. 2 SERVICE AND ASSESSMENT
HACKBERRY HIDDEN COVE PUBLIC IMPROVEMENT DISTRICT NO. 2 SERVICE AND ASSESSMENT PLAN (UTILITY IMPROVEMENTS) SEPTEMBER 15, 2009 HACKBERRY HIDDEN COVE PUBLIC IMPROVEMENT DISTRICT NO. 2 SERVICE AND ASSESSMENT
Strategic Growth in the Rangeview Area Structure Plan
 2018 March 22 Page 1 of 8 EXECUTIVE SUMMARY Administration has received and reviewed an Outline Plan/Land Use (OP/LU) application within the Rangeview Area Structure Plan (ASP). The developer of these
TOWN OF MILTON LONG-TERM FISCAL IMPACT ASSESSMENT OF GROWTH Draft For Discussion Purposes
 TOWN OF MILTON LONG-TERM FISCAL IMPACT ASSESSMENT OF GROWTH 2011-2021 Draft For Discussion Purposes DECEMBER 6, 2010 CONTENTS Page 1. INTRODUCTION 1.1 Background 1-1 2. FORECAST POPULATION, HOUSING, AND
Supplementary Development Contributions Scheme - Cobh/Midleton - Blarney Suburban Rail Project
 Adopted by Council on 23 rd February, 2004. Supplementary Development Contributions Scheme - Cobh/Midleton - Blarney Suburban Rail Project Under Section 49 of the Planning & Development Act, 2000 Section
Glen Abbey Golf Club Redevelopment Municipal Financial Impact Study
 FINAL Report Glen Abbey Golf Club Redevelopment Municipal Financial Impact Study by IBI Group October 31, 2016 Table of Contents 1 Introduction... 1 1.1 Executive Summary... 1 1.2 Proposed Redevelopment
Region of Peel Property Tax Policy Handbook
 Region of Peel Property Tax Policy Handbook Finance Department July 2017 The handbook contains the following sections: Introduction This handbook has been prepared to provide elected municipal officials,
Development Charges in the City of Mississauga. A Revenue Tool to Fund Municipal Infrastructure and Services
 Development Charges in the City of Mississauga A Revenue Tool to Fund Municipal Infrastructure and Services Agenda Presentation 15 minutes Discussion 60 minutes 1 Our Future Mississauga Strategic Plan
The Corporation of the Town of Milton
 The Corporation of the Report To: From: Council Glen Cowan, Director Finance Date: October 30, 2017 Report No: Subject: Recommendation: CORS-062-17 Fiscal Impact Assessment for the Sustainable Halton Lands
Oran Park and Turner Road Precincts Section 94 Contributions Plan
 Oran Park and Turner Road Precincts Section 94 Contributions Plan Prepared for The Council of Camden Contents Page Number 1. Summary 1 1.1 Overview of this Plan 1 1.2 Works schedule and contribution rates
Retail Market Demand and Impact Analysis City of Elliot Lake, Ontario
 Retail Market Demand and Impact Analysis City of Elliot Lake, Ontario Prepared for: The City of Elliot Lake November 22, 2012 November 21, 2012 Mr. Rob De Bortoli CAO, Elliot Lake Elliot Lake City Hall
EX33.3. HEMSON C o n s u l t i n g L t d Development Charges Background Study
 EX33.3 Appendix 4 2018 Development Charges Background Study Addendum Report to the January 9, 2018 Development Charge Background Study C o n s u l t i n g L t d. April 6, 2018 Table of Contents DISCLAIMER...
Toukley District Development Contributions Plan No 6
 Toukley District Development Contributions Plan No 6 September 2013 Table of Contents Contents 1 Administration and Operation of this Plan 5 1.1 Introduction 5 1.2 Relationship to Other Plans 5 1.3 Area
Frequently Asked Questions
 Frequently Asked Questions Frequently Asked Questions If my home value goes up, does the City get more taxes? Where do my property taxes go? What is the difference between Regional and City services? How
Westwood Country Club Redevelopment
 Westwood Country Club Redevelopment Economic and Fiscal Impact March, 2014 Prepared for: Mensch Capital Partners Prepared By: Kent Gardner, Ph.D. Project Director 1 South Washington Street Suite 400 Rochester,
2018 Development Charges Background Study The Cost of Growth. Council Workshop #2
 Development Charges Background Study The Cost of Growth Council Workshop #2 June 27, 1 Agenda Review of development charges, legislated requirements and influencing factors City s DC study schedule and
Reserves & Reserve Funds Business Plan & 2016 Budget
 Reserves & Reserve Funds 2018 Business Plan & Budget Table of Contents Executive Summary of Reserves and Reserve Funds... 3 Overview... 4 Forecast Changes... 6 Operating Reserves and Reserve Funds... 7
TOWN OF HINESBURG FIRE PROTECTION IMPACT FEE ANALYSIS. Prepared By. Michael J. Munson, Ph.D., FAICP
 TOWN OF HINESBURG FIRE PROTECTION IMPACT FEE ANALYSIS Prepared By Michael J. Munson, Ph.D., FAICP September 23, 2009 I. INTRODUCTION: The Town of Hinesburg, Vermont, has recently updated its Town Plan
Operating and Capital Budgets
 2018-2020 Operating and Capital Budgets Council Presentation Presented to Special Council Meeting December 6, 2017 Page 1 Page 1 OUTLINE The Journey Overview Teamwork and Organizational Transformation
DEVELOPMENT CONTRIBUTION SCHEME. 23 rd of September, Limerick City Council Planning & Economic Development Department
 DEVELOPMENT CONTRIBUTION SCHEME 23 rd of September, 2013. Limerick City Council Planning & Economic Development Department Development Contribution Scheme 2013-2016 Section 48, Planning & Development Acts,
Big Chino Water Ranch Project Impact Analysis Prescott & Prescott Valley, Arizona
 Big Chino Water Ranch Project Impact Analysis Prescott & Prescott Valley, Arizona Prepared for: Central Arizona Partnership August 2008 Prepared by: 7505 East 6 th Avenue, Suite 100 Scottsdale, Arizona
Case Number File Number Appellant Neighbourhood and Legal Description PL101016* PL101036** PL101037***
 OMB Case No. PL101016 et al OMB File No.? ONTARIO MUNICIPAL BOARD IN THE MATTER OF subsection 22(7), subsection 34(11), and subsection 51(34) of the Planning Act, R.S.O. 1990, c. P.13, as amended from
City-Driven Major High Profile Projects Requiring 2006 Funding. January 2006
 City-Driven Major High Profile Projects Requiring 2006 Funding January 2006 For the Portfolio's complete 2006 workplan, refer to the Portfolio Capacity Analysis. WARD PROJECT New Project / Top-up Funding
3 YORK REGION 2031 POPULATION AND EMPLOYMENT FORECASTS
 3 YORK REGION 2031 POPULATION AND EMPLOYMENT FORECASTS The Planning and Economic Development Committee recommends: 1. Receipt of the presentation by Paul Bottomley, Manager, Growth Management Economy and
COUNTY COUNCIL FOR MONTGOMERY COUNTY, MARYLAND
 Bill No. 31-03 Concerning: Transportation Impact Tax - Amendments Revised: 10-27-03 Draft No. 4 Introduced: September 9, 2003 Enacted: October 28, 2003 Executive: Effective: March 1, 2004 Sunset Date:
Message from the Treasurer. Proposed Property Tax Increases. Municipal Service Delivery. Economic Profile. Development Outlook
 Executive Summary Table of Contents Message from the Treasurer Proposed Property Tax Increases Exec-3 Exec-4 About Brampton Brampton Facts Municipal Service Delivery Economic Profile Development Outlook
Gorokan District Development Contributions Plan 2013
 Gorokan District Development Contributions Plan 2013 September 2013 Table of Contents Contents Summary Schedules 1 1 Administration and Operation of this Plan 2 1.1 Name of this Plan 2 1.2 Area to which
Toronto and Region Conservation Authority - Additional Information for the Long Term Accommodation Project
 REPORT FOR ACTION Toronto and Region Conservation Authority - Additional Information for the Long Term Accommodation Project Date: February 14, 2017 To: City Council From: Deputy City Manager & Chief Financial
STANDARDS ESTABLISHING CRITERIA FOR THE APPROVAL OF FIRST NATION BORROWING LAWS, 2016
 STANDARDS ESTABLISHING CRITERIA FOR THE APPROVAL OF FIRST NATION BORROWING LAWS, 2016 [Consolidated to 2018-03-28] PART I PREAMBLE WHEREAS: A. Section 35 of the First Nations Fiscal Management Act gives
Development Charges Annual Report
 Report No: CS 2018-09 CORPORATE SERVICES Council Date: April 11, 2018 To: From: Warden and Members of County Council Director of Corporate Services Development Charges Annual Report - 2017 RECOMMENDATION
SKECHERS HERMOSA BEACH DESIGN CENTER & EXECUTIVE OFFICES
 SKECHERS HERMOSA BEACH DESIGN CENTER & EXECUTIVE OFFICES NET FISCAL IMPACT & ECONOMIC BENEFIT ANALYSIS HERMOSA BEACH, CA Prepared For: SKECHERS U.S.A., INC. Prepared By: KOSMONT COMPANIES 1601 N. Sepulveda
Canterbury Development Contributions Plan 2013
 Canterbury Development Contributions Plan 2013 Adopted by Council: 5 December 2013 Effective from: 17 December 2013 Jim Montague PSM GENERAL MANAGER City Planning Division Contents Page Number 1. Plan
Steering Committee Meeting #8. Development Charge & Impost Fee Background Study. Summary Notes
 Steering Committee Meeting #8 Development Charge & Impost Fee Background Study Summary Notes Steering Committee Meeting #8 was held on July 31 st, 2014 in the Councilor s Lounge, City Hall. The following
G 1-1. Parkland Dedication By law Review Proposed By law Amendments. Council Meeting May 22, Committee of Council Meeting December 2012
 G 1-1 Parkland Dedication By law Review Proposed By law Amendments Council Meeting May 22, 2013 Parkland Dedication By law 1. Background 2. Committee of Council Meeting December 2012 3. Development Industry
Market and Financial Inputs to Neighbourhood Centres Policy
 Appendix E of PB-01-17 Market and Financial Inputs to Neighbourhood Centres Policy November 2016 Prepared for: City of Burlington By: Table of Contents 1.0 Introduction... 1 1.1 Background... 1 1.2 Approach...
Region of Peel. BMO Canadian Fixed Income Conference. May 1 & 2, Spring
 Region of Peel BMO Canadian Fixed Income Conference May 1 & 2, 2018 Spring 2018 1 Meet the Region of Peel Table of Contents Who we are 2 Economy 5 Finances 14 Debt Issuance.. 27 Spring 2018 Who we are
Date:July 30, 2003 Board Members - Parks and Recreation General Manager - Parks and Recreation CHAMPLAIN HEIGHTS COMMUNITY CENTRE ADDITION
 Date:July 30, 2003 TO: FROM: SUBJECT: Board Members - Parks and Recreation General Manager - Parks and Recreation CHAMPLAIN HEIGHTS COMMUNITY CENTRE ADDITION RECOMMENDATION A) THAT the Board endorse a
Introduction to Development Charges (DCs)
") Introduction to Development Charges (DCs) Strategic Priorities and Policy Committee April 13 th, 2015 1 Agenda What are Development Charges & what do they pay for? DC rate setting process Payment of DCs
Introduction to Development Charges (DCs) Strategic Priorities and Policy Committee April 13 th, 2015 1 Agenda What are Development Charges & what do they pay for? DC rate setting process Payment of DCs
Municipal Study City of Greater Sudbury Comparison to Northern Municipalities
 Municipal Study 2013 City of Greater Sudbury Comparison to Northern Municipalities Presentation Provide an update on the 2013 Municipal Study 98 municipalities in the study Presentation focuses on Northern
Nith Peninsula, Brant County Fiscal Impact Study
 Fiscal Impact Study October 25, 2017 Fiscal Impact Study Prepared for: Losani Homes Prepared by: 33 Yonge Street Toronto Ontario M5E 1G4 Phone: (416) 641 9500 Fax: (416) 641 9501 economics@altusgroup.com