Vattenfall Q1 Results 2008
|
|
|
- Mark Potter
- 5 years ago
- Views:
Transcription

1 Vattenfall Q1 Results 2008 Presentations by Lars Josefsson, CEO and Jan Erik Back, CFO
2 Highlights Q Net sales increased 9.0% to SEK 45,404 million (41,644). EBIT increased slightly by 0.2% to SEK 11,426 million (11,399). Profit after tax decreased slightly by 0.7% to SEK 7,184 million (7,235). Net debt decreased by SEK 4,195 million to SEK 39,545 million compared with 31 December 2007.
3 Highlights Q Return on Net Assets was 16.2% LTM (FY 2007: 16.6%) - well above target 11%. Return on Equity was 17.0 % LTM (FY 2007: 17.6%) - well above target 15%.
4 Continued strong EBIT development 4 Quarterly figures, SEK million HEW consolidated Bewag consolidated GZE consolidated Danish assets consolidated Q Q Q Q Q Q Q Q Q Q Q Q Q Q Q Quarterly figures in SEK million, excluding items affecting comparability Last 12 month figures in SEK million, excluding items affecting comparability
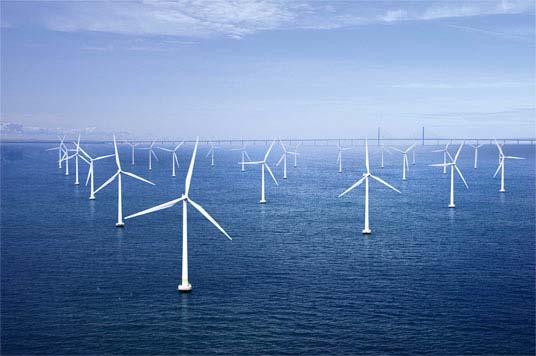
5 Slightly higher electricity generation output 5 Q1 2008: 46.4 TWh Q1 2007: 45.7 TWh % Hydro Nuclear Fossil Other Other = wind, biofuel, waste
6 Slightly lower heat sales due to mild winter 6 Q1 2008: 14.1 TWh Q1 2007: 14.4 TWh Nordic Central Europe

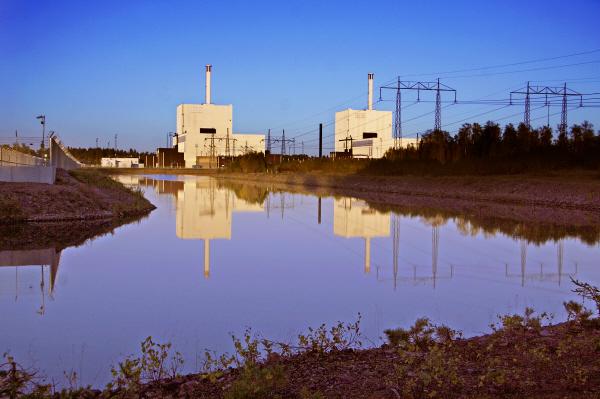
 Krümmel (1,346 MW) Brunsbüttel")
7 Nuclear update - Germany 7 Following the shutdowns in June 2007, the testing and renovations programme as well as the implementation of recommendations presented by the independent expert commission in September 2007, continue. The plants will remain shut down until these actions are fully completed. Re-start date still open. Q financial impact totals approximately EUR 150 million (SEK million) Krümmel (1,346 MW) Brunsbüttel (771 MW)
8 Nuclear update - Sweden 8 The incident on 25 July 2006 resulted in a comprehensive review of safety issues and the safety culture of all Vattenfall s nuclear power operations. An action programme based on regulatory requirements and self assessment was defined. All actions for 2006, 2007 and the first quarter of 2008 have been concluded. Among other things: A safety council has been established at Vattenfall Group level. A new managing director has been appointed at Forsmark (Feb. 2007). Independent external experts have conducted an in-depth review. A Chief Nuclear Officer has been appointed within Vattenfall (Feb. 2008). IAEA (the UN:s nuclear body) has carried out a so called OSART study. The preliminary report was presented in February IAEA noted that Forsmark meets international safety standards. Forsmark is on line and fully operational but is still under special oversight by SKI, the Swedish nuclear inspectorate.
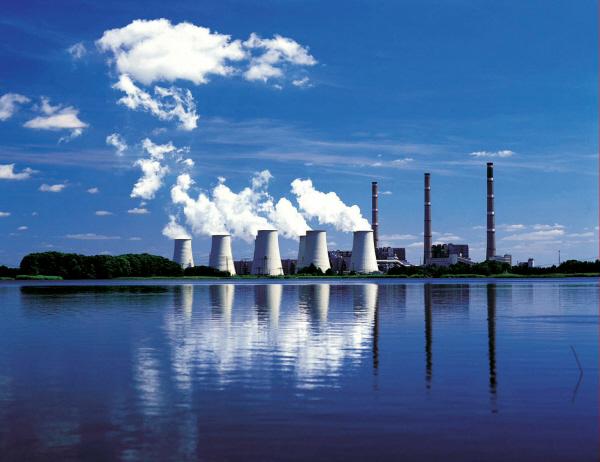
9 Moorburg CHP plant project 9 In November 2007 Vattenfall obtained a preliminary permit (a so called Vorzeitige Baugenehmigung ) to build Europe s technologically most advanced coal-fired CHP plant in Hamburg, Germany. At the same time Vattenfall signed an agreement with the State of Hamburg regarding additional environmental investments to further improve the environmental performance of the plant. Vattenfall began construction work and has already contracted EUR 1.3 billion. The plant will be built ready for CCS, which means that the CO2 emissions from the plant will be reduced to almost zero in the medium term. Due to the elections in Hamburg, the final environmental permits have been delayed. From Vattenfall s point of view, all necessary requirements for the needed emission licence for air emissions and water use for cooling purposes are being met. On 21 April Vattenfall took court action on the grounds of administrative inaction. Vattenfall considers its legal position to be sufficiently strong to obtain the necessary licence in the near future.
10 Gratifying development within Sales Germany 10 Product offers have been improved: Launch of Vattenfall Easy, a very competitively priced online product Nationwide offerings Large-scale dialogue with all customers as well as the general public Gratifying results: Customer departures have ceased Vattenfall has been ranked Best Electricity Supply Company by Germany s Institute for Service Quality (DISQ).
11 Continued good development within Sales Sweden 11 Vattenfall has exceeded one (1) million customers in the Nordic countries. Vattenfall s Swedish retail customer market share has grown from 13% to 15%. Customer satisfaction index has improved. Vattenfall s products are often referred to as being the best in the market. Vattenfall has launched source-specified electricity, i.e., customers can choose between nuclear, hydro or wind power. Several major, long-term, agreements with Swedish industrial customers have been signed.
12 Squeeze out completed in Germany 12 The squeeze out of minority shareholders (3.19%) in Vattenfall s listed German subsidiary Vattenfall Europe AG, initiated in August 2005, was completed on 21 April Vattenfall AB now directly and indirectly controls 100% of Vattenfall Europe AG. Trading of the shares on the German stock exchanges has been discontinued.
13 Financials Jan Erik Back, CFO
14 Consolidated income statement 14 Amounts in MSEK Q Q Change FY2007 LTM IFRS IFRS % Net sales 45,404 41, , ,399 Cost of products sold 31,269 27, , ,036 Gross profit 14,135 14, ,235 40,363 Operating profit (EBIT) 11,426 11, ,583 28,610 Operating profit, excl. IAC* 11,357 11, ,497 28,533 Financial income ,276 2,204 Financial expenses -2,072-1, ,926-7,517 Financial net -1, ,650-5,313 Profit before taxes 10,068 10, ,933 23,297 Taxes -2,884-3, ,247-2,662 Profit for the period 7,184 7, ,686 20,635 * IAC = items affecting comparability
15 Electricity price development Q1 15 Monthly Spot Average 85 Nord Pool (SYSEUR) EEX Declining spot prices but higher compared with Q jan-06 apr-06 jul-06 okt-06 jan-07 apr-07 jul-07 okt-07 jan-08 Daily Forward Closing Prices EUR/MWh Small movements in forward prices during Q jan-06 apr-06 jun-06 sep-06 dec-06 mar-07 jun-07 sep-07 dec-07 mar-08 ENOYR-09 EEXYR-09 ENOYR-10 EEXYR-10
16 Above normal hydrological balance 16 Nordic countries TWh System price Hydrologial balance SYSSEK/MWh
17 Hedging position as of 31 March % hedged of planned electricity generation (percentage values are rounded) Nordic Central Europe 100% 100% 90% 90% 80% 80% 70% 70% 60% 60% 50% 50% 40% 40% 30% 30% 20% 20% 10% 10% 0% remaining % remaining
18 Oil, coal, gas and CO 2 allowances USD EUR jan-06 apr-06 jul-06 okt-06 jan-07 apr-07 jul-07 okt-07 jan-08 apr-08 Oil (USD/bbl), Brent Front Month Coal (USD/t), API#2, Front Year Emission allowances CO2 (EUR/t), 2009 Gas (EUR/MWh), NBP, Front Year
19 EBIT Q vs Q SEK million Q Price Volume O&M Fuel Emission rights Other Q1 2008
20 EBIT Q vs Q secondary segments 20 SEK million Sales 342 VTS -103 Q Generation Heat Networks Markets Other Q1 2008
21 Financial targets and outcome 21 Key Ratio Targets Q Return on Equity (RoE) 15 % on average equity 17.0%* Return on Net Assets (RoNA, excl. IAC) Cash flow interest coverage after maintenance investments 11 % before tax (= 15 % RoE recalculated into the Groups RoNA requirement) times 16.1%* 5.2* Credit Rating Single A category rating A2/A- Stable outlook Dividend pay-out % 40.5 %** *Q figure = LTM **) Proposed dividend
22 Cash flow development Q4 Q1 Q2 Q3 Q4 Q1 Q2 Q3 Q4 Q1 Q2 Q3 Q4 Q1 Q2 Q3 Q4 Q1 Q2 Q3 Q4 Q1 Q2 Q3 Q4 Q1 Q2 Q3 Q4 Q1 Q2 Q3 Q4 Q Quarter/Year Free cash flow from operations - Rolling 4 quarter (1) Cash flow before financing activities - Rolling 4 quarter (1) Cash flow from operating activities minus reinvestments 1) Figures according to Sw GAAP until Q and according to IFRS from Q1 2005
23 Net debt development 23 SEK million Acquisition of Bewag and GZE shares Acquisition of Elsam shares Dividend paid Capital Securities SEK 9.3 billion Q Q Q Q Q Q Q Q Q Q Q Q Q Q Q4 2007

24 24 Questions and Answers
25 Back-up slides
26 Key data BG Nordic 26 Q1 Q1 % FY FY Amounts in SEK billion Change LTM Net sales External net sales * EBIT ** Net assets *** n.a Electr. generation, TWh Heat generation, TWh Employees **** n.a * Excl. intra group transactions ** Excl. items affecting comparability (IAC) *** At the end of the period **** Full time equivalents (FTE)
27 Key data BG Central Europe 27 Q1 Q1 % FY FY Amounts in SEK billion Change LTM Net sales External net sales * EBIT ** Net assets *** n.a Electr. generation, TWh Heat generation, TWh Employees **** n.a * Excl. intra group transactions ** Excl. items affecting comparability (IAC) *** At the end of the period **** Full time equivalents (FTE)
28 Consolidated balance sheet 28 Amounts in MSEK 31/3/08 31/3/07 Change 31/12/07 IFRS IFRS % Non-current assets 265, , ,864 Current assets 85,058 78, ,372 Total assets 350, , ,236 Equity 132, , ,132 Interest-bearing liabilitites 71,082 72, ,189 Interest-bearing provisions 56,446 50, ,250 Pension provisions 17,644 17, ,735 Deferred tax liabilities 24,302 30, ,704 Other non-interestbearing liabilitites 48,050 45, ,226 Total equity and liabilities 350, , ,236
29 Net asset development Q Q Q Q Q Q Q MSEK Acquisition of Bewag and GZE shares Acquisition of Elsam shares Consolidation of Danish assets Q Q Q Q Q Q Q Q2 2004
30 Consolidated cash flow statement 30 Amounts in MSEK Q Q Change FY 2007 LTM IFRS IFRS % Funds from operations (FFO) 11,828 12, ,049 33,671 Change in working capital -2,807-2, ,718-1,559 Cash Flow from operating activities 9,021 9, ,331 32,112 Investments -5,027-3, ,964-20,553 Divestments ,048 Cash and cash equivalents in aquired/divested companies Cash Flow from investing activities -4,697-3,233-18,037-19,501 Cash Flow before financing activities 4,324 6, ,294 12,611 Cash Flow from financing activities 6,237-2,802-18,662-9,623 Cash Flow for the period 10,561 3, ,368 2,988 Net debt at the end of the period -39,545-44, ,740-39,545
31 Return on equity 31 30% 25% Rolling 4-quarter IFRS excl IAC 20% 15% Rolling 4-quarter Sw GAAP excl IAC 10% 5% 0% Period Average 4-years (16 quarter) Sw. GAAP. IFRS from Q Excl. IAC Requirement 15%
32 Increased capex programme 32 SEK 173 bn ( was SEK 134 bn) Boxberg power plant (675 MW) SEK 107 bn (62%) SEK 11 bn (6%) SEK 55 bn (31%) ,2 Moorburg power plant (1,640 MW) Reichwalde mine Nuclear capacity upgrade Network improvements German and Nordic wind power Poland Nordic Germany Generation inc. Heat Networks Other Life-time extensions generation assets in Sweden and Germany
33 Break down of group liquidity 33 Amounts in SEK million As of March 31, 2008 Treasury Germany Poland Nordic Total % Cash and bank 1,912 1, , Investments 10,035 15, , Total 11,946 16, ,157 30, Unused committed credit facilities amount to 9,492 SEK million and other undrawn credit- and overdraft facilities amount to 11,831 SEK million.
34 Break down of group debt 34 Amounts in SEK million As of March 31, 2008 Treasury Germany Poland Nordic Total % Subordinated perpetual Capital Securities 9,267 9, MTN EMTN 34,017 34, Liabilities to assoc. companies 7,043 4,967 12, Liabilities to minority shareholders 50 5,845 5,895 8 Bank loans and others 1,460 5, ,886 9, Total 52,437 10, ,731 71,
35 Adjusted gross and net debt 35 SEK million Gross debt Present value of net pension obligations (incl actuarial gains/losses) Mining & environmental provisions 50% of Hybrid securities = Adjusted gross debt Cash & short term investments German nuclear "Solidarvereinbarung" Minority owner s share of German nuclear subisdiaries cash position = Adjusted cash & short term investments = Adjusted net debt 31 Mar Dec
36 Vattenfall debt maturity profile 36 SEK million Excluding loans from associated companies and minority owners March 31, 2008 March 31, 2007 Duration (years) 2,9 1) 3,3 Average time to maturity (years) 6,7 1) 6,5 Net debt (SEK bn) 39,5 44,8 1) Based on external debt. Excluding Capital Securities the duration is 2,2 years and average time to maturity 6,6 years.
37 CO 2 allowances EUR/tonne jan-07 apr-07 okt-07 jan-08 jul jan-06 apr-06 jul-06 okt-06
38 Group provisions (IFRS) March 2008 SEK 98,392 million 31 March 2007 SEK 98,354 million Pensions Nuclear Mining Taxes Other Personnel Legal
39 Key ratios 39 Key Ratios (% unless otherwise stated) Q Q LTM RoNA (1) RoE (1) Operating margin Pre-tax profit margin Cash Flow interest coverage after maintenance investments, times FFO/net debt (1) Equity/assets ratio Net Gearing - Net debt/equity Capitalisation - Net debt/net debt + equity ) Q value = LTM
Vattenfall Q2 Results 2008
 Vattenfall Q2 Results 2008 Presentations by Lars G. Josefsson, CEO and Jan Erik Back, CFO Main topics to be discussed 2 CEO Lars G. Josefsson: Sales & earnings Production volumes Nuclear update Moorburg
Vattenfall Q1 results 2009
 Vattenfall Q1 results 2009 Presentations by Lars G. Josefsson, CEO and Dag Andresen, CFO Agenda 2 CEO Lars G. Josefsson: Financial highlights Generation volumes Market and price development Other important
Vattenfall Q3 results 2009
 Vattenfall Q3 results 2009 Presentations by Lars G. Josefsson, CEO and Dag Andresen, CFO Agenda CEO Lars G. Josefsson: CFO Dag Andresen: Financial highlights Generation volumes Electricity price development
Vattenfall Full Year results 2009
 Vattenfall Full Year results 2009 Presentations by Lars G. Josefsson, CEO and Dag Andresen, CFO Agenda CEO Lars G. Josefsson: CFO Dag Andresen: 2009 highlights Financial highlights Generation volumes Electricity
Vattenfall Q2 results 2011
 Vattenfall Q2 results 2011 Øystein Løseth, CEO and Dag Andresen, CFO Conference Call, 28 July 2011 Business highlights German nuclear decision negatively impacts Vattenfall s Q2 result due to impairment
Vattenfall Q1 results 2010
 Vattenfall Q1 results 2010 Presentations by Øystein Løseth, CEO and Dag Andresen, CFO Agenda CEO Øystein Løseth: Financial highlights Generation volumes Market price development Important events CFO Dag
Vattenfall Full Year 2011 results
 Vattenfall Full Year 2011 results Øystein Løseth, CEO and Peter Smink, acting CFO Conference Call, 9 February 2012 Delivering according to strategy during a demanding year Cost-reduction programme Divestment
Vattenfall Investor Update
 Vattenfall Investor Update November 2008 Contents 2 Group Overview and Strategy Growth and Investments Funding and Liquidity Conclusion Appendices Group Overview and Strategy Group overview and key figures
Vattenfall Capital Markets Day 2006
 Vattenfall Capital Markets Day 2006 Financial Review Presentation by Matts Ekman CFO Gothenburg, 9 August 2006 Content 2 1. Q2 results 2006 & Gap analysis 2. Regulated vs competitive business 3. Capital
Vattenfall Q3 and 9M 2012 results
 Vattenfall Q3 and 9M 2012 results Øystein Løseth, CEO and Ingrid Bonde, CFO Conference Call, 30 October 2012 Q3 Highlights (1) Underlying operating profit SEK 1.3 bn below last year - 12% higher production
Vattenfall Q results
 Vattenfall Q1 2012 results Øystein Løseth, CEO and Peter Smink, acting CFO Press Conference, 3 May 2012 Successful first quarter continued consolidation Vattenfall continues to deliver on its strategy:
Vattenfall Q3 and 9M 2013 results
 Vattenfall Q3 and 9M 2013 results Øystein Løseth, CEO and Ingrid Bonde, CFO Conference call for analysts and investors, 29 October 2013 Q3 Highlights Underlying EBIT SEK 4.0 bn (4.5) - Higher costs for
Vattenfall Q2 and H1 results 2015
 Vattenfall Q2 and H1 results 2015 Magnus Hall, CEO and Ingrid Bonde, CFO Presentation 21 July 2015 Financial highlights SEK bn Q2 2015 Q2 2014 H1 2015 H1 2014 FY 2014 Net Sales 36.1 36.6 81.5 82.5 165.9
NINE- MONTH INTERIM REPORT 2006 JANUARY SEPTEMBER
 Research engineer in Vattenfall laboratory analysing boiler performance in the combustion process with an acid-based method. NINE- MONTH INTERIM REPORT 006 JANUARY SEPTEMBER Net sales rose 4. % to SEK
Vattenfall Capital Markets Day 2009
 Vattenfall Capital Markets Day 2009 Presentation by: Dag Andresen First Senior Executive Vice President Group CFO Amsterdam, 23 September 2009 Contents Financial targets and outcome Nuon acquisition Actions
Vattenfall Q2 results 2010
 Vattenfall Q2 results 21 Presentations by Øystein Løseth, CEO and Dag Andresen, CFO Conference call Highlights second quarter 21 Business and financial highlights Key financial figures SEK bn SEK bn Increased
SIX-MONTH INTERIM REPORT 2003
 SIX-MONTH INTERIM REPORT 2003 JANUARY-JUNE Operating profit during the first half of the year increased by 36 per cent to SEK 9,988 million (SEK 7,345 m) * Net profit during the first half of the year
Interim Report January March
 Interim Report January March 2013 Stable underlying operating profit despite challenging market conditions Net sales rose 1.4% to SEK 49,659 million (48,994) The underlying operating profit 1 was stable
Strong result for Vattenfall significant improvement in Germany
 YEAR-END REPORT, 19 FEBRUARY 2004 Strong result for Vattenfall significant improvement in Germany Net sales increased by 10.8 per cent to SEK 111,935 million (SEK 101,025 m) Operating profit increased
JANUARY-MARCH THREE-MONTH INTERIM REPORT 2003
 THREE-MONTH INTERIM REPORT 2003 JANUARY-MARCH Vattenfall stands for openness, accountability and effectiveness. A strong Vattenfall is a quarantee of a well-functioning competition on both the Nordic and
Interim Report January June 2014
 Interim Report January June 2014 April June 2014 Net sales amounted to SEK 36,575 million (38,308). The underlying operating profit 1 amounted to SEK 4,086 million (5,399). Operating profit amounted to
SIX-MONTH INTERIM REPORT 2004
 SIX-MONTH INTERIM REPORT 24 JANUARY-JUNE Net sales decreased by 2.4 per cent to SEK 57,71 million (58,498) Operating profit increased by 17.7 per cent to SEK 11,593 million (9,848) Net profit after tax
Interim Report January March 2015
 Interim Report January March 2015 January March 2015 Net sales of SEK 45,377 million (45,912) Underlying operating profit 1 of SEK 7,736 million (9,075) Operating profit of SEK 8,386 million (11,832) Profit
Vattenfall reports another set of strong annual accounts
 YEAR-END REPORT 18 FEBRUARY 2005 Vattenfall reports another set of strong annual accounts Net sales increased by 1.3 per cent to SEK 113,366 million (111,935) Operating profit increased by 28.2 per cent
3/10. REPORT JANUARY september 2010
 3/10 INTERIM REPORT JANUARY september 2010 Net sales decreased by 16.9% to SEK 37,665 million (45,346) during the third quarter, but increased by 12.9% for the ninemonth period, to SEK 158,035 million
SIX-MONTH INTERIM REPORT 2002 January June
 January June A dynamic and competitive Vattenfall is a guarantee for maintaining competition on the northern European power market. Lars G Josefsson President and Chief Executive Officer Comments by the
1/10. Interim report January march 2010
 Interim report January march 2010 1/10 Net sales rose 34.5% to SEK 70,657 million (52,528) Operating profit decreased by 21.3% to SEK 10,115 million (12,860) excluding items affecting comparability, operating
Interim Report January September 2014
 Interim Report January September 2014 July September 2014 Net sales of SEK 34,734 million (37,057). Underlying operating profit 1 of SEK 2,750 million (4,074). Operating profit of SEK -19,436 million (4,893).Operating
NINE-MONTH INTERIM REPORT 2002 January September
 January September Vattenfall s vision is to be a leading European energy company. Essentially, this means that in the short and long term, customers must view Vattenfall as the best supplier and as making
Interim Report. January June Stable second quarter
 Interim Report January June Stable second quarter Net sales amounted to SEK 36,703 million (40,443) for the second quarter and SEK 85,697 million (92,311) for the first half of the year. For continuing
For enquiries, please contact Lars G. Josefsson, President and CEO, tel
 3/09 INTERIM REPORT January september 2009 Net sales rose 22.5% during the third quarter, to SEK 45,346 million (37,016), and 19.0% for the ninemonth period, to SEK 140,002 million (117,679). Operating
Vattenfall at a glance
 Overview Vattenfall at a glance Vattenfall at a glance Vattenfall is one of Europe s largest generators of electricity and the largest producer of heat. Electricity generation and sales of heat amounted
FINANCIAL RESULTS Q CFO Irene Egset 4 th May 2017
 FINANCIAL RESULTS Q1 2017 CFO Irene Egset 4 th May 2017 Health, safety and environment TRI-rate 1 10 8 6 4 2 0 2014 2015 2016 2017 Health and safety - Quarterly injuries rate is down in Q1 - Continuously
Statkraft Investor Update. March 2014
 Statkraft Investor Update March 2014 Disclaimer This presentation has been prepared by, and the information contained herein (unless otherwise indicated) has been provided by Statkraft AS (the "Company").
Vattenfall Capital Markets Day 2009
 Vattenfall Capital Markets Day 2009 Presentation by: Stephen Asplin Head of Business Unit Trading Amsterdam, 23 September 2009 Contents Overview Business Unit Trading Business Unit Trading s role within
Fortum Corporation Interim report January June July 2014
 Fortum Corporation Interim report January June 2014 18 July 2014 Disclaimer This presentation does not constitute an invitation to underwrite, subscribe for, or otherwise acquire or dispose of any Fortum
Interim Report January September
 2011 Interim Report January September Contents Page CEO s message 1 Group 3 Electricity generation, sales of heat and gas 8 Wholesale price trend 9 The Group's operating segments 11 Consolidated income
INTERIM FINANCIAL REPORT FIRST NINE MONTHS 2013
 INTERIM FINANCIAL REPORT FIRST NINE MONTHS 2013 Moving Energy Forward 23 October 2013 Disclaimer Certain statements in this presentation are based on the beliefs of our management as well as assumptions
Profit the year of SEK -8,284 million (-13,543). Profit includes impairment losses of SEK 20,400 million, net.
. Profit includes impairment losses of SEK 20,400 million, net.") Year-end report 2014 January December 2014 Net sales of SEK 165,945 million (172,253). Underlying operating profit 1 of SEK 24,133 million (28,135). Operating profit of SEK -2,195 million (-6,218). Operating
Year-end report 2014 January December 2014 Net sales of SEK 165,945 million (172,253). Underlying operating profit 1 of SEK 24,133 million (28,135). Operating profit of SEK -2,195 million (-6,218). Operating
Interim report January-September Fortum Corporation 22 October 2015
 Interim report January-September 2015 Fortum Corporation 22 October 2015 Disclaimer This presentation does not constitute an invitation to underwrite, subscribe for, or otherwise acquire or dispose of
Best results ever YEAR-END REPORT 8 FEBRUARY sales increased by 13.9 % to SEK 129,158 million (113,366),
,") YEAR-END REPORT 8 FEBRUARY 2006 Best results ever Net sales increased by 3.9 % to SEK 29,58 million (3,366) Operating profit, excluding items affecting comparability increased by 28.0 % to SEK 24,744 million
YEAR-END REPORT 8 FEBRUARY 2006 Best results ever Net sales increased by 3.9 % to SEK 29,58 million (3,366) Operating profit, excluding items affecting comparability increased by 28.0 % to SEK 24,744 million
Year-end Report January December October December Net sales of SEK 164,510 million (165,945)
") Year-end Report 2015 January December 2015 Net sales of SEK 164,510 million (165,945) Underlying operating profit 1 of SEK 20,541 million (24,133) Operating profit of SEK -22,967 million (-2,195). Operating
Year-end Report 2015 January December 2015 Net sales of SEK 164,510 million (165,945) Underlying operating profit 1 of SEK 20,541 million (24,133) Operating profit of SEK -22,967 million (-2,195). Operating
Fortum Corporation Interim report January-March April 2010
 Fortum Corporation Interim report January-March 21 27 April 21 Disclaimer This presentation does not constitute an invitation to underwrite, subscribe for, or otherwise acquire or dispose of any Fortum
FINANCIAL RESULTS Q CEO Christian Rynning-Tønnesen CFO Irene Egset 26 April 2018
 FINANCIAL RESULTS Q1 2018 CEO Christian Rynning-Tønnesen CFO Irene Egset 26 April 2018 Health, safety and environment TRI-rate 1 10 8 6 4 2 0 2016 2017 2018 Health and safety - No serious injuries in Q1
Financial Statements Fortum Corporation 2 February 2017
 Financial Statements 2016 Fortum Corporation 2 February 2017 Disclaimer This presentation does not constitute an invitation to underwrite, subscribe for, or otherwise acquire or dispose of any Fortum shares.
Statkraft Investor Update. European Energy & Utilities Credit Conference 2013
 Statkraft Investor Update European Energy & Utilities Credit Conference 2013 Disclaimer This presentation has been prepared by, and the information contained herein (unless otherwise indicated) has been
Q Interim Report January March
 Q1 2012 Interim Report JanuaryMarch Content Page CEO s message 1 Group 2 Electricity generation, sales of heat and gas 9 Wholesale price trend 10 The Group s operating segments 11 Consolidated income statement
FINANCIAL RESULTS Q CEO Christian Rynning-Tønnesen CFO Irene Egset 26 October 2017
 FINANCIAL RESULTS Q3 2017 CEO Christian Rynning-Tønnesen CFO Irene Egset 26 October 2017 Health, safety and environment TRI-rate 1 10 8 6 4 2 0 2014 2015 2016 2017 Health and safety - One serious incident
Asset Optimisation and Trading
 Asset Optimisation and Trading Harald von Heyden Head of Business Division Asset Optimisation and Trading Stockholm, 21 September 211 Today s focus Organisation and key figures AOT comprises four business
Fortum Corporation Interim Report January-March April 2012
 Fortum Corporation Interim Report January-March 2012 26 April 2012 1 Disclaimer This presentation does not constitute an invitation to underwrite, subscribe for, or otherwise acquire or dispose of any
INTERIM REPORT JANUARY-MARCH 2017
 INTERIM REPORT JANUARY-MARCH 2017 Business highlights, January March 2017 High availability and production in Swedish nuclear Significant renewables growth following the full commissioning of Sandbank
Interim Report January March
 2011 Interim Report January March Contents Page CEO s message 1 Group 3 Electricity generation, sales of heat and gas 8 Wholesale price trend 9 The Group's operating segments 11 Consolidated income statement
FINANCIAL RESULTS Q4 2010
 FINANCIAL RESULTS Q4 2010 CEO CHRISTIAN RYNNING-TØNNESEN CFO STEIN DALE 17 FEBRUARY 2011 HIGHLIGHTS Q4 2010 Strong financial results driven by unusual cold and dry Nordic weather Underlying 1 pre-tax
Arise Windpower AB. Company presentation February 2013
 Arise Windpower AB Company presentation February 2013 Cautionary statement This document does not constitute or form part of any offer or invitation to sell or issue, or any solicitation of any offer to
Fortum Corporation Interim Report January-June 2008
 Fortum Corporation Interim Report January-June 2008 Fortum Corporation Interim Report January-June 2008 17 July 2008 at 9:00 Solid first half-year results Strong performance in Power Generation Comparable
YEAR -END REPORT 2009
 YEAR -END REPORT 2009 2009 Net sales rose 24.8% to SEK 205,407 million (164,549) Operating profit decreased by SEK 6.5% to SEK 27,938 million (29,895). Excluding items affecting comparability, operating
FINANCIALS MONTHS RESULTS. 7 November 2011
 FINANCIALS 211 9 MONTHS RESULTS 7 November 211 Disclaimer Certain statements in this presentation are based on the beliefs of our management as well as assumptions made by and information currently available
Nordic Market Report
 Nordic Market Report Status as of May 8 th, 17 1. SUMMARY The average spot price in April was 29.2 /MWh, down 1.2 /MWh from March and up 7.1 /MWh year-onyear. The average price in April in the period 1993
INTERIM REPORT JANUARY-SEPTEMBER 2017
 INTERIM REPORT JANUARY-SEPTEMBER 2017 Business highlights, July September 2017 Growth in onshore wind with investment decision for Wieringermeer (180 MW) and acquisition of a neighbouring project (115
Fortum Corporation Interim Report January June July 2009
 Fortum Corporation Interim Report January June 17 July Fortum Corporation Interim Report January June 17 July at 9:00 Solid first-half year results Comparable operating profit EUR 1,002 (984) million,
FINANCIAL RESULTS Q CEO Christian Rynning-Tønnesen CFO Irene Egset 25 October 2018
 FINANCIAL RESULTS Q3 2018 CEO Christian Rynning-Tønnesen CFO Irene Egset 25 October 2018 Health, safety and environment TRI-rate 1 7 6 5 4 3 2 1 0 2016 2017 2018 Health and safety - Two serious injuries
ANNEX 1: REPORT ON THE COMPANY S BUSINESS OPERATIONS AND ASSETS OF ČEZ, A. S. FOR Prague, June 12, 2015
 ANNEX 1: REPORT ON THE COMPANY S BUSINESS OPERATIONS AND ASSETS OF ČEZ, A. S. FOR Prague, June 12, 2015 - SUCCESSFUL YEAR DESPITE ONGOING UNCERTAINTY IN EUROPE S ENERGY SECTOR EBITDA CZK 72.5bn Adjusted
INTERIM REPORT JANUARY-JUNE 2017
 INTERIM REPORT JANUARY-JUNE 2017 Business highlights, January June 2017 Continued customer growth by more than 110,000 contracts Strengthened presence in UK through the acquisition of isupplyenergy Growth
Interim report January March 2018
 Interim report January March 2018 Business highlights, January March 2018 Higher total electricity generation as a result of increased hydro power generation Strong performance for sales operations Decrease
Statkraft AS Interim Report Q1/2018
 Statkraft AS Interim Report Q1/2018 Q1 Key figures NOK million 2018 2017 Change 2017 From income statement Gross operating revenues and other income 15 099 14 009 1 089 52 883 Net operating revenues and
- a leading energy company in the Nordic area. Investor Meetings
 - a leading energy company in the Nordic area Investor Meetings November 2004 Fortum's strategy Fortum focuses on the Nordic energy market as a platform for long-term profitable growth Create the leading
FULL YEAR REPORT, 2017 TELEPHONE/AUDIO CONFERENCE 8 FEBRUARY 2018, AT CET TOMMY ANDERSSON, PRESIDENT AND CEO HELENA WENNERSTRÖM, EVP AND CFO
 TELEPHONE/AUDIO CONFERENCE 8 FEBRUARY 2018, AT 15.30 CET TOMMY ANDERSSON, PRESIDENT AND CEO HELENA WENNERSTRÖM, EVP AND CFO DIRECT LINK AUDIOCAST: HTTPS://TV.STREAMFABRIKEN.COM/BULTEN Q4 2017 TELECONFERENCE:
YEAR-END REPORT 2017
 YEAR-END REPORT 2017 Business highlights, January December 2017 Increased customer base with over 360,000 contracts and expansion of decentralised solutions Full commissioning of the Sandbank offshore
Statkraft Investor Update Q3 2018
 Statkraft Investor Update Q3 2018 Disclaimer This presentation has been prepared by, and the information contained herein (unless otherwise indicated) has been provided by Statkraft AS (the "Company").
2009 Results Presentation. Warsaw, March 16, 2010
 2009 Results Presentation Warsaw, March 16, 2010 Summary Results Key Achievements Comments Successful IPO Largest IPO in Europe since May 2008 Very large investors oversubscription demonstrating good reception
Six-month Interim Report 2000 January June
 Six-month Interim Report 0 January June [ ] S I X - M O N T H I N T E R I M R E P O R T 0 0 0 Comments by the Chief Executive Vattenfall enhances the competitiveness, environment and quality of life of
CREATING VALUE FOR THE FUTURE
 ANNUAL REPORT 2006 CREATING VALUE FOR THE FUTURE VATTENFALL AT A GLANCE Vattenfall is Europe s fourth largest generator of electricity and the largest producer of heat. Consolidated sales in 2006 amounted
Credit Opinion: Vattenfall AB. Global Credit Research - 22 Dec Ratings. Vattenfall Treasury AB. Contacts. Key Indicators
 Credit Opinion: Vattenfall AB Global Credit Research - 22 Dec 2010 Stockholm, Sweden Ratings Category Moody's Rating Outlook Stable Issuer Rating Senior Unsecured Subordinate MTN (P)A3 Vattenfall Treasury
Interim report January September 2018
 Interim report January September 2018 Business highlights, July September 2018 Higher electricity generation as a result of higher availability in nuclear power Inauguration of European Offshore Wind Deployment
Year-end Report January-December, 2012
 Year-end Report January-December, 20 Lars Nyberg President and CEO Record-high Free cash flow during 20 Net sales SEK 4,898 million (4,804) Increased 1.2% in local currencies EBITDA* SEK 36,059 million
Year-End Report 2018
 Year-End Report 2018 Business highlights, January December 2018 Record high nuclear power generation City of Hamburg exercises its option to buy back Vattenfall s stake in district heating system Investment
Year-end report January December October December 2016
 Year-end report 2016 January December 2016 Net sales of SEK 152,667 million (164,510) for Total Vattenfall 1, of which SEK 139,208 million (143,576) for continuing operations Underlying operating profit
Lindab Group presentation Q3 2010
 lindab group presentation Lindab Group presentation Q3 2010 David Brodetsky, CEO Nils-Johan Andersson, CFO Agenda Highlights Group Business Areas Strategy Trends and outlook Q & A 2 Lindab Group Highlights
Positive trend in earnings and strong cash flow
 Positive trend in earnings and strong cash flow Presentation of the Q3/2017 result Martin Lindqvist, President & CEO Håkan Folin, CFO October 25, 2017 Agenda Q3/2017 and performance by division Financials
Interim Report January-June Fortum Corporation 20 July 2016
 Interim Report January-June 2016 Fortum Corporation 20 July 2016 Disclaimer This presentation does not constitute an invitation to underwrite, subscribe for, or otherwise acquire or dispose of any Fortum
Vattenfall 2001: Strong Growth and Improved Profit
 YEAR END REPORT FEBRUARY 22 2002 Vattenfall 2001: Strong Growth and Improved Profit Substantial improvement in profit, operating profit increased to SEK 10.0 billion (6.7) The return on capital employed,
Interim Report January September 2014
 Interim Report January September 2014 Johan Dennelind President & CEO Capital Markets Day summary 2018 2013 2014 2015 2016 2017 The New TeliaSonera Big changes Stabilize & shape Transform & perform Transform
Debt Investor Update Call. E.ON Cleaner & better energy. Dr. Marcus Schenck, CFO 24 November 2011
 Debt Investor Update Call E.ON Cleaner & better energy Dr. Marcus Schenck, CFO 24 November 2011 Agenda Update on strategy & operations Financial highlights 2 E.ON s strategy to address key challenges Investor
Improved margin and cash flow in Q1 2013
 2013-06-04 BofA Merrill Lynch Global Telecom & Media conference June 4, 2013 Per-Arne Blomquist President and CEO 1 Improved margin and cash flow in Q1 2013 Revenue growth impacted by reduced mobile interconnect
Financial Results 2018 Johan Torgeby, President & CEO. Telephone conference 30 January 2019
 Financial Results 2018 Johan Torgeby, President & CEO Telephone conference 30 January 2019 jan-17 apr-17 jul-17 okt-17 jan-18 apr-18 jul-18 okt-18 jan-17 apr-17 jul-17 okt-17 jan-18 apr-18 jul-18 okt-18
Investor breakfast meeting
 Annika Falkengren President & CEO Jan Erik Back CFO Investor breakfast meeting 17 August 20 1 Priorities for 20 Maintain flexibility & resilience Exploit core strengths Corporates in Nordics & Germany
A leading energy company in the Nordic area
 A leading energy company in the Nordic area Investor Meetings February, 2005 Fortum's strategy Fortum focuses on the Nordic energy market as a platform for long-term profitable growth Create the leading
Interim Report January-September Fortum Corporation 24 October 2018
 Interim Report January-September Fortum Corporation 24 October Low hydro volumes partly offset by higher prices Nordic power price volatile during the quarter, but significantly up from 2017 Low hydro
Statkraft AS Interim Report Q3/2018
 Statkraft AS Interim Report Q3/2018 Q3 Key figures Third quarter Year to date Year NOK million 2018 2017 Change 2018 2017 Change 2017 From income statement Gross operating revenues and other income 14
Interim report January June 2018
 Interim report January June 2018 Business highlights, April June 2018 Higher electricity generation as a result of increased hydro power generation Construction started on one of Sweden s largest wind
Vattenfall AB. Update to credit analysis. CREDIT OPINION 12 January Update
 CREDIT OPINION Vattenfall AB Update to credit analysis Update Summary Vattenfall AB (Vattenfall) s credit quality is supported by (1) the company s breadth and scale of operations; (2) the clean generation
Fortum Corporation Interim Report 1 January 30 June 2003
 Fortum Corporation Interim Report 1 January 30 June 2003 Fortum Corporation Interim Report 1 January 30 June 2003 Continued strong performance by Fortum - significant improvement in ongoing business The
Interim Report January-June, 2014
 Interim Report January-June, 2014 Johan Dennelind President and CEO All regions contribute to stable margin Group service revenues flat - net sales negatively impacted by Spain Underlying EBITDA maintained
Fortum Corporation Interim Report January-March April 2009
 Fortum Corporation Interim Report January-March 28 April Fortum Corporation Interim Report January-March 28 April at 9:00 A strong start for the year Comparable operating profit EUR 602 (581) million,
Fortum and Nordic power markets
 Fortum and Nordic power markets Mikael Lilius President and CEO, Fortum Corporation Enskilda Securities, Finnish Blue Chip Seminar 2005 Helsinki, 22 September 2005 Fortum's strategy Fortum focuses on the
Financial update. Juha Laaksonen. Chief Financial Officer, Fortum Corporation. Capital Markets Day
 Financial update Juha Laaksonen Chief Financial Officer, Fortum Corporation Capital Markets Day 29 November 2005 Disclaimer This presentation does not constitute an invitation to underwrite, subscribe
INTERIM REPORT JANUARY-MARCH 2011
 INTERIM REPORT JANUARY-MARCH 2011 SoliQ, a unique service concept for the Global Produce Supply Chain Billerud s subsidiary, Billerud Fresh Services, is now launching SoliQ, an optimised corrugated packaging
Investor presentation. Result
 Investor presentation Result 2010 Highlights Income Stable earnings from a diversified platform Provisions for credit losses Net credit losses back to pre-crisis levels Strategic alignment Strategic alignment
Infrastructure Finance
 www.moodys.com Credit Analysis Moody s Global Infrastructure Finance December 2009 Table of Contents: Corporate Profile 1 Management Strategy 2 Key Rating Considerations 3 Baseline Credit Assesment 3 Factor
Fortum in Russia. Tapio Kuula. Senior Vice President Fortum Corporation. Capital Markets Day
 Fortum in Russia Tapio Kuula Senior Vice President Fortum Corporation Capital Markets Day Stockholm, 4 June 2007 Disclaimer This presentation does not constitute an invitation to underwrite, subscribe