2009 Results Presentation. Warsaw, March 16, 2010
|
|
|
- Heather Stephens
- 6 years ago
- Views:
Transcription

1 2009 Results Presentation Warsaw, March 16, 2010
2 Summary Results Key Achievements Comments Successful IPO Largest IPO in Europe since May 2008 Very large investors oversubscription demonstrating good reception by investors Implementation of Management Strategic Plan Key milestones in the consolidation programme reached and execution on schedule Continued focus on execution of investment programme with budget strictly followed Foundations laid for further progress in nuclear program (shortlist of partners/ technologies/ localizations) In 2009, PGE s revenues have grown by 11%, from PLN 19.4bn in 2008 to PLN 21.6bn Strong Financial Results EBITDA increased by 37% from PLN 5.8bn in 2008 to PLN 8.0bn in 2009 Profit for the year increased by 62%, from PLN 2.7bn in 2008 to PLN 4.3bn in 2009 Net Profit (to equity) increased by 76%, from PLN 1.9bn in 2008 to PLN 3.4bn in
3 I. Update on Recent Developments 3
4 Strong Economic Fundamentals in Poland Support Performance GDP Growth: Resilience in 2009 and Outperformance in 2010 and % 0.0% (4.0)% (8.0)% 2.0% 3.1% 2.8% 1.7% 2.0% 1.8% 1.1% 1.5% 1.5% 0.9% Poland Source: Global Insight (4.0)% Czech Rep. (0.4%) (6.3)% (4.9)% (4.1)% Hungary Germany EU Key Takeaways Despite the crisis, Poland has maintained GDP growth and was the sole country in the EU with a positive numbers As proven by historical analysis, we expect future GDP growth to continue to support electricity demand (Polish electricity demand has been growing at a faster pace than EU electricity demand in the past 5 years) 2009 drop in demand was less dramatic than in other geographies and faster GDP growth pick up will support faster demand recovery GDP Growth 8% 6% 4% 2% 0% Favourable Electricity Demand Dynamics 5.3% Source: Global Insight 3.6% 2.4% 2.1% 6.3% 3.3% Electricity Demand Growth (Indexed; 2004=100) 6.8% % 5.0% Poland EU 27 Poland EU % 95 Polish Electricity Demand Recovering Faster Than in EU LTM (Y-o-Y Change) 20.0% 10.0% 0.0% (10.0)% (20.0)% (30.0)% Source: Cera Nov-08 Dec-08 Jan-09 Feb-09 Mar-09 Apr-09 May-09 Jun-09 Jul-09 Aug-09 Sep-09 Oct-09 Nov-09 Poland Czech Republic Germany EU


5 Strong Progress on Consolidation and Restructuring in a Challenging Year Targeted Group Structure Restructuring Programme Execution Delivering Results Non-core Asset Management Company PGE S.A. Parent / Holding Company and Wholesale Trading Business Management of Segment Companies Shared Services Center Conventional Nuclear Renewables Distribution Retail Sales Impact of Consolidation of Minorities September 2010 Current Shareholding Structure State Treasury - 85% Other shareholders 15% Targeted Group Structure State Treasury - Not less than 78.7% Employees - Not more than 7.5% Other shareholders - Not less than 13.9% Update on restructuring programme Process aims at improving operational efficiency and releasing additional savings Consolidation of key legal subsidiaries from over 40 to 6 prepared and applications filed with the courts Update on divestiture programme PGE management has started discussions with shareholders on the disposal of Polkomtel, process expected to progress significantly in 2010 Update on buy-out of minority stakes Buy-out of minorities in PGE Elektrownia Opole S.A. (16%), PGE KWB Turów S.A. (16%) and PGE ZEC Bydgoszcz S.A. resulted in increase of equity attributable to the PGE shareholders by PLN 257m Consolidation of subholding minorities to be completed till September 2010 Expected effects: Simplified structure Increased dividend payment capability Increased liquidity Less minorities for a cost of dilution 5
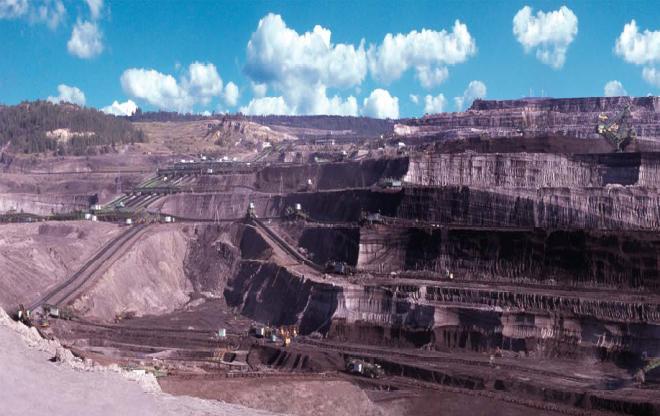
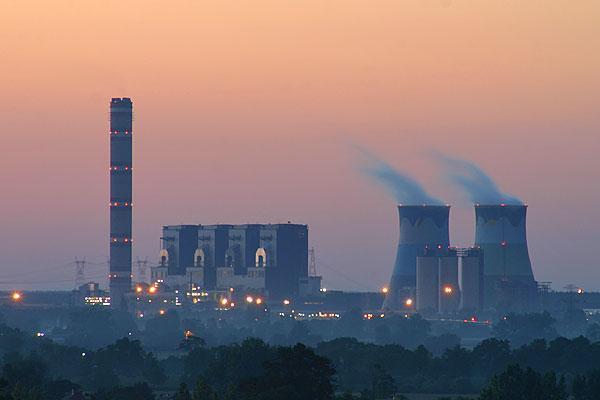
6 Continued Successful Deployment of Capital Positive Earnings Impact of Generation Capex Program Progress on Capex Programme by Business Total: PLN 3.7 bn Capex Plan Composition (2009 most significant positions) Mining&Generation PLN 2.5 bn Belchatow units 3-12 renovation PLN 0.7 bn Belchatow 858 MW construction PLN 0.6 bn Szczercow Mining Field opening PLN 0.3 bn Distribution PLN 1bn New connections to customers PLN 0.4bn Construction of network PLN 0.3bn Generation Portfolio Expansion Generation Portfolio Modernisation Nuclear Generation Opportunity Environmental Impact Mitigation Distribution Network Upgrade Substantial progress on Belchatow generation unit New mining field in Belchatow opened Tender procedure in Opole has started in 2009 Tender procedure in Turow to be opened in 2010 Modernisation of existing mining assets has begun in 2009, to progress further in 2010 Modernisation of generation units has been on track in 2009 Nuclear generation opportunity has been strategically analysed in 2009 Process of selection of partners and locations has began and is expected to be completed by end of 2010 Carbon capture and storage programme at Belchatow has progressed strongly PGE has agreed with European Union authorities on environmental grant for the project Investments in the upgrading of the distribution network have continued on schedule in 2009 Further network expansion investments as planned 6
7 II Company Financial Performance Overview 7
8 Strong Profitability and Growth in 2009 Year Ended 31 December (IFRS) PLNm Audited PLNm Audited EURm EURm Sales 19,409 21,623 5,519 4,997 Sales Ex-LTC 18,086 20,091 5,143 4,643 EBITDA 5,847 7,983 1,663 1,845 EBITDA margin 30.1% 36.9% 30.1% 36.9% EBITDA Ex-LTC 4,524 6,451 1,287 1,491 EBITDA Ex-LTC margin 25.0% 32.1% 25.0% 32.1% EBIT 3,262 5, ,235 EBIT margin 16.8% 24.7% 16.8% 24.7% Profit before tax 3,170 5, ,243 Profit for the year 2,670 4, ,002 Minority interest Net profit (to equity) 1,920 3, EUR/PLN average rate used: (2009), (2008); source: National Bank of Poland Adjustment of 2008 sales revenue due to change in consolidation principles i.e. more detailed identification of transaction with less significant capital group companies (2008 revenues lower by PLN 1.2 million than previously reported) Growth in revenues of 11.4% driven by favourable price trends in Poland in 2009 EBITDA margin has improved from 30.1% in 2008 to 36.9% in 2009 LTC compensation in 2009 of PLN1.5bn In 2009, EBITDA excluding LTC compensation has registered growth of 42.6% y-o-y and the EBITDA Ex- LTC margin has reached 32.1%, up from 25.0% in 2008 Part of LTC revenues under dispute with the regulator - in August 2009, PGE Group has appealed to the Competition Court on ERO decision 8
9 Analysis of EBITDA Composition and Development 2009 EBITDA: Segmental Contribution 2009 EBITDA Margin vs. Key Competitors PLNm % CEZ ,983 Fortum 1, , PGE Iberdrola 27.8 EDP 27.6 EDF 26.3 Mining & Generation Renewables Wholesale Distribution Retail Sales Others (incl. adj.) Total Vattenfall Enel y-o-y change +1, , % -12.5% % +4.7% % +24.8% +36.5% RWE Enea A2A 17.7 Increase in wholesale prices was the key factor Increase mainly due to base effect (higher provision created for dispute with contractor in 2008) and better results on CO 2 trade Higher sales revenues from business clients and increase in average prices for electricity improved the result GDF SUEZ EnBW E.ON Decrease mainly due to receivable write-off (PLN 22.5m) and lower volume of green certificates sold Higher return on capital approved in distribution tariff for 2009 was a key indicator of the growth Better result of telecommunication subsidiary (Exatel) Source: Company information, consensus estimates for A2A and Enea 9
10 Consolidated Balance Sheet Year Ended 31 December (IFRS) PLNm Audited PLNm Audited EURm EURm Shareholder equity 22,810 31,169 5,467 7,587 Minority interest 7,366 7,681 1,765 1,870 Non-current assets 40,701 41,964 9,755 10,214 Current assets 6,491 12,483 1,556 3,039 Total assets 47,192 54,448 11,311 13,253 Non-current liabilities 9,520 9,762 2,282 2,376 Following the IPO, PGE has further significantly expanded its shareholder equity base to give it a stable platform for future expansion Significant increase in cash position following IPO used as means of financing structure re-design Minor decrease in long-term debt level from PLN 4.5bn in 2008 down to PLN 4.1bn in 2009 Significant decrease in short-term debt as a result of repayment from PLN 3.0bn in 2008 to PLN 1.0bn in 2009 Current liabilities 7,497 5,836 1,797 1,420 Total equity and liabilities 47,192 54,448 11,311 13,253 EUR/PLN period end rate used: (2009), (2008); source: National Bank of Poland 10
11 III. Guidance 11
12 PGE Future Outlook Timeline Developments Continued economic recovery to support further electricity demand growth. Increase in generation expected. Positive impact from distribution RAB revaluation in 2010 Scope for operational improvements in distribution business Short Term (2010) LTC gap in revenues and EBITDA to be potentially compensated with non-core assets disposals Targeted completion of consolidation process Tender in Opole finished Tender in Turow opened Potential for identification of detailed efficiencies and savings Medium Term (2011/Onwards) New Belchatow generation unit online (ca. 6.2 TWh p.a.) Probable continued regulatory upside in distribution Further execution of planned investment programme in generation and distribution 12
13 IV. Back-up slides 13
14 EUR/MWh PLN/MWh Power Prices Still Supported by Shortage of Generation Supply/Demand Dynamics to Support Prices As older generation assets are decommissioned and demand continues to grow, Polish reserve margin is expected to decrease further, leading to supply shortage in Commissioning of new generation capacity post 2014, as prior to that new assets to primarily replace old generation assets Limited expansion of renewable capacity: PGE remains pioneer in renewables in Poland Demand-Supply Balance Expectation Tighten (a) Polish Wholesale Prices on the Rise, Trading in EUR-terms at a Discount to European (EUR/MWh) (b) Power supply and demand gap in Poland (GW) ,7 GW 36,8 GW UK (EUR) Germany (EUR) Poland (EUR) Poland (PLN) - right scale Jan/06 Jul/06 Jan/07 Jul/07 Jan/08 Jul/08 Jan/09 Jul/09 Jan/10 Available supply Average demand Peak demand (evening peaks) Source: (a) TSO 2008, Elmark; (b) Bloomberg, TGE, electricity spot baseload prices monthly av Jan-06 - Jan-10 14
 70% 30% 21,7 TWh (2008) Households 9,0 TWh 56.1 TWh (2008) Wholesale (excl.")
 Source: PGE Percentages shown represent share in sales to wholesale and retail customers Other business flows")
15 2009 Key business flows ILLUSTRATIVE Business Customers Retail Free market 21,0 TWh Generation 53.8 TWh 56% 30.0 TWh 30.6 TWh (2008) 70% 30% 21,7 TWh (2008) Households 9,0 TWh 56.1 TWh (2008) Wholesale (excl. LTCs) Regulated market 8,9 TWh (2008) 23.2 TWh 43% 22.8 TWh (2008) Source: PGE Percentages shown represent share in sales to wholesale and retail customers Other business flows incl. balancing market, foreign trade and own consumption are not shown Volumes shown after intra-group eliminations 15
16 Electricity generation by source [TWh] Lignite-fired power plants Coal-fired power plants Coal-fired CHPs Gas-fired CHPs Pump-storage Water Wind Coal-fired generation figure includes 0.6 TWh from biomass combustion (vs. 0.4 TWh in 2008) Decrease in production of electricity declined both in power plants using lignite and hard coal resulted mainly from: reductions forced by PSE Operator S.A. related to a smaller demand for electricity in the National Power System (reductions amounted to ca. 4%), modernization and recovery repair of the generating unit no 4 in Bełchatow and outage in Turow (Unit 4). 16


17 Ownership streamlining process ILLUSTRATIVE ONLY LEVEL I Parent Company (PGE) LEVEL II Subholding Companies (PGE GiE&PGE Energia) LEVEL III Operating Companies (Mines, Power Plants, Retail Companies) BEFORE AFTER STAGE I AFTER STAGE II 85% 15% 15% Conversion Merger Not less than 78.7% Not more than 7.5% Not less than 13.9% No Level II minorities Currently employees own up to 15% of shares in operating companies (mines, power plants and retail companies) and State Treasury owns 15% of shares in subholding companies. Employees are swapping their shares with State Treasury, which has no impact for existing shareholders of PGE. Than subholding companies will merge with the PGE and new shares will be issued for shareholders of acquired companies (i.e. employees). The minority share in PGE P&L and BS will be significantly decreased for a cost of dilution. After the operation, employees share in PGE capital will not exceed 7.5%. Stage I and II are ongoing and both are to finish till September Effects: simplification of the capital group structure increased dividend payment capability increased stock liquidity Under PGE control State Treasury Employees Employees swap their shares with State Treasury Parent merges with Level II companies Possibility of Stage III is under consideration PGE may buyout State Treasury from the operating companies. Other Shareholders 17
18 Calendar of IR events Corporate events Event Date Extraordinary General Meeting March 30, 2010 Publication of consolidated quarterly report for 1st quarter of year 2010 May 17, 2010 Publication of consolidated half-year report for 1st half of year 2010 August 31, 2010 Publication of consolidated quarterly report for 3rd quarter of year 2010 November 15, 2010 Meet us at the conferences Event Date Place Hosted by Institutional Investors Conference April 14-17, 2010 Zuers, Austria Raiffeisen Centrobank EMEA Conference April 26-27, 2010 London Morgan Stanley EMEA Conference April 28-29, 2010 New York Morgan Stanley WSE Conference May 20-21, 2010 London WSE, KBC Securities 18
19 Thank you Investor Relations Przemysław Wasilewski Tel: (+48 22) Fax: (+48 22) Mob: Anna Ryba Tel: (+48 22) Fax: (+48 22) Mob:
Q1-Q Results Nonaudited consolidated, in accordance with IFRS. Warsaw, November 16, 2009
 Q1-Q3 2009 Results Nonaudited consolidated, in accordance with IFRS Warsaw, November 16, 2009 Agenda I. Highlights and key events, recent developments Tomasz Zadroga, President & CEO II. Financial results
14 November Zespół Elektrowni Pątnów-Adamów-Konin SA 3Q 2016 Results
 14 November 2016 Zespół Elektrowni Pątnów-Adamów-Konin SA 3Q 2016 Results ZE PAK Group 9M 2016 Summary Key operational and financial data 9M 2016 Change y/y Sale of electricity (1) : 10.36 TWh -6.41% electricity
14 November Zespół Elektrowni Pątnów-Adamów-Konin SA. Third quarter 2017 Results
 14 November 2017 Zespół Elektrowni Pątnów-Adamów-Konin SA Third quarter 2017 Results ZE PAK Group 9M 2017 Summary Key operational and financial data 9M 2017 Change y/y Sale of electricity (1) : 8.78 TWh
Statkraft Investor Update. March 2014
 Statkraft Investor Update March 2014 Disclaimer This presentation has been prepared by, and the information contained herein (unless otherwise indicated) has been provided by Statkraft AS (the "Company").
24 September Zespół Elektrowni Pątnów-Adamów-Konin SA First half of 2018 results
 24 September 2018 Zespół Elektrowni Pątnów-Adamów-Konin SA First half of 2018 results ZE PAK SA Group 6M 2018 Summary Key operational and financial data 6M 2018 Change y/y Sale of electricity: 4.27 TWh
Statkraft Investor Update. European Energy & Utilities Credit Conference 2013
 Statkraft Investor Update European Energy & Utilities Credit Conference 2013 Disclaimer This presentation has been prepared by, and the information contained herein (unless otherwise indicated) has been
ANNEX 1: REPORT ON THE COMPANY S BUSINESS OPERATIONS AND ASSETS OF ČEZ, A. S. FOR Prague, June 12, 2015
 ANNEX 1: REPORT ON THE COMPANY S BUSINESS OPERATIONS AND ASSETS OF ČEZ, A. S. FOR Prague, June 12, 2015 - SUCCESSFUL YEAR DESPITE ONGOING UNCERTAINTY IN EUROPE S ENERGY SECTOR EBITDA CZK 72.5bn Adjusted
Vattenfall Q2 results 2011
 Vattenfall Q2 results 2011 Øystein Løseth, CEO and Dag Andresen, CFO Conference Call, 28 July 2011 Business highlights German nuclear decision negatively impacts Vattenfall s Q2 result due to impairment
RWE Company Presentation. As of March 2018
 RWE Company Presentation As of March 208 Disclaimer This document contains forward-looking statements. These statements are based on the current views, expectations, assumptions and information of the
Fortum intends to become a major shareholder in Uniper
 A powerful combination to drive European energy transition Fortum intends to become a major shareholder in Uniper 27 September 2017 Disclaimer This presentation is neither an offer to purchase, underwrite,
Vattenfall Full Year 2011 results
 Vattenfall Full Year 2011 results Øystein Løseth, CEO and Peter Smink, acting CFO Conference Call, 9 February 2012 Delivering according to strategy during a demanding year Cost-reduction programme Divestment
Vattenfall Full Year results 2009
 Vattenfall Full Year results 2009 Presentations by Lars G. Josefsson, CEO and Dag Andresen, CFO Agenda CEO Lars G. Josefsson: CFO Dag Andresen: 2009 highlights Financial highlights Generation volumes Electricity
ADMIE (IPTO) Holding S.A. 1H 17 earnings presentation September 2017
 Holding S.A. 1H 17 earnings presentation September 2017") ADMIE (IPTO) Holding S.A. 1H 17 earnings presentation September 2017 Disclaimer This document contains forward-looking statements that involve risks and uncertainties. These statements may generally, but
ADMIE (IPTO) Holding S.A. 1H 17 earnings presentation September 2017 Disclaimer This document contains forward-looking statements that involve risks and uncertainties. These statements may generally, but
Vattenfall Q results
 Vattenfall Q1 2012 results Øystein Løseth, CEO and Peter Smink, acting CFO Press Conference, 3 May 2012 Successful first quarter continued consolidation Vattenfall continues to deliver on its strategy:
Balance sheet strength enables growth and value creation
 Fortum - Power and heat company in the Nordic area, Russia, Poland and the Baltics Balance sheet strength enables growth and value creation Berenberg European Conference, Surrey 2 December 2014 Timo Karttinen,
Vattenfall Q3 and 9M 2012 results
 Vattenfall Q3 and 9M 2012 results Øystein Løseth, CEO and Ingrid Bonde, CFO Conference Call, 30 October 2012 Q3 Highlights (1) Underlying operating profit SEK 1.3 bn below last year - 12% higher production
WSE GROUP FINANCIAL RESULTS Q FEBRUARY
 WSE GROUP FINANCIAL RESULTS 24 FEBRUARY 2015-1- Introduction Paweł Tamborski, President of the WSE Management Board -2- In, We Reinforced WSE Group s Foundations Our activities in were aimed at strengthening
Tauron. In PLN mn e 2011e 2012e
 June 16, 2010 Utilities/Poland Tauron Not Rated pre IPO IPO Factsheet Maximum price for retail PLN 0.7 Maximum price for institutions Individual investors Final price Institutional investors n.a. 9 June
Investing in European Gas Markets: a Banker s Perspective
 Investing in European Gas Markets: a Banker s Perspective Julian Mylchreest Global Co-Head of Energy & Power, Investment Banking, Bank of America Merrill Lynch 23 th May 213 Financing Markets Dynamics
Electricity market in the. Simon-Erik Ollus Baltic Energy Forum, Vilnius 20 November 2014
 Electricity market in the Baltic Sea area today Simon-Erik Ollus Baltic Energy Forum, Vilnius 20 November 2014 Disclaimer This presentation does not constitute an invitation to underwrite, subscribe for,
Vattenfall Q1 Results 2008
 Vattenfall Q1 Results 2008 Presentations by Lars Josefsson, CEO and Jan Erik Back, CFO Highlights Q1 2008 2 Net sales increased 9.0% to SEK 45,404 million (41,644). EBIT increased slightly by 0.2% to SEK
RWE Company Presentation. As of May 2018
 RWE Company Presentation As of May 2018 Disclaimer This document contains forward-looking statements. These statements are based on the current views, expectations, assumptions and information of the management,
PRESS CONFERENCE ON CEZ GROUP 2010 FINANCIAL RESULTS
 PRESS CONFERENCE ON CEZ GROUP 2010 FINANCIAL RESULTS AUDITED CONSOLIDATED RESULTS PREPARED IN ACCORDANCE WITH THE INTERNATIONAL FINANCIAL REPORTING STANDARDS (IFRS) Prague, 28 February 2011 AGENDA Financial
9M 2017 results innogy SE 13 November 2017 Bernhard Günther CFO
 9M 2017 results innogy SE 13 November 2017 Bernhard Günther CFO Notice This document contains forward-looking statements. These statements are based on the current views, expectations, assumptions and
Vattenfall Q2 Results 2008
 Vattenfall Q2 Results 2008 Presentations by Lars G. Josefsson, CEO and Jan Erik Back, CFO Main topics to be discussed 2 CEO Lars G. Josefsson: Sales & earnings Production volumes Nuclear update Moorburg
RWE continues to reshape its future
 RWE continues to reshape its future Transforming RWE into a leading integrated renewable and conventional power generator Investor and Analyst Conference Call, 13 March 2018 Rolf Martin Schmitz Markus
Disciplined Growth Strong Dividends
 Disciplined Growth Strong Dividends Analyst and Investor Conference Fiscal Year 2004 Essen, 24 February 2005 Harry Roels Chief Executive Officer RWE AG Dr. Klaus Sturany Chief Financial Officer RWE AG
Poland s Economic Prospects
 Poland s Economic Prospects Unicredit Conference Warsaw, June 8, 11 Mark Allen Senior IMF Resident Representative for Central and Eastern Europe Recovery is driven by domestic demand Contributions to Real
PRESENTATION ON CEZ GROUP FINANCIAL RESULTS IN H1 2018
 PRESENTATION ON CEZ GROUP FINANCIAL RESULTS IN H1 2018 NON-AUDITED CONSOLIDATED RESULTS PREPARED IN ACCORDANCE WITH INTERNATIONAL FINANCIAL REPORTING STANDARDS (IFRS) August 7, 2018 CONTENTS Financial
FITCH AFFIRMS POLAND'S PGE AT 'BBB+'; OUTLOOK STABLE
 FITCH AFFIRMS POLAND'S PGE AT 'BBB+'; OUTLOOK STABLE Fitch Ratings-Warsaw/London-05 August 2016: Fitch Ratings has affirmed PGE Polska Grupa Energetyczna S.A.'s (PGE) Long-Term Foreign and Local Currency
Vattenfall Q1 results 2009
 Vattenfall Q1 results 2009 Presentations by Lars G. Josefsson, CEO and Dag Andresen, CFO Agenda 2 CEO Lars G. Josefsson: Financial highlights Generation volumes Market and price development Other important
TAURON Group s Q Financial Results. May 11, 2017
 TAURON Group s Q1 217 Financial Results May 11, 217 Q1 217 key data [PLN m] TAURON Group s Q1 217 results Q1 217 vs Q1 216 Sales revenue 4 59 1% EBITDA 1 185 36% Net profit* 64 98% CAPEX 636 (3)% Net debt/ebitda
Vattenfall Q1 results 2010
 Vattenfall Q1 results 2010 Presentations by Øystein Løseth, CEO and Dag Andresen, CFO Agenda CEO Øystein Løseth: Financial highlights Generation volumes Market price development Important events CFO Dag
Vattenfall Capital Markets Day 2006
 Vattenfall Capital Markets Day 2006 Financial Review Presentation by Matts Ekman CFO Gothenburg, 9 August 2006 Content 2 1. Q2 results 2006 & Gap analysis 2. Regulated vs competitive business 3. Capital
Vattenfall Q2 and H1 results 2015
 Vattenfall Q2 and H1 results 2015 Magnus Hall, CEO and Ingrid Bonde, CFO Presentation 21 July 2015 Financial highlights SEK bn Q2 2015 Q2 2014 H1 2015 H1 2014 FY 2014 Net Sales 36.1 36.6 81.5 82.5 165.9
Recurring EBITDA: 1,902m, -5% YoY 62% decline YoY of hydro production in Iberia: 42% below historical avg. in 1H17 vs.
 0 Recurring EBITDA: 1,902m, -5% YoY 62% decline YoY of hydro production in Iberia: 42% below historical avg. in vs. 68% above in Net Profit: 450m, -5% YoY Avg. cost of debt -40bp YoY, OPEX IV savings at
Sabancı Holding Q Earnings Presentation
 Sabancı Holding Q4 2017 Earnings Presentation Disclaimer 2 The information and opinions contained in this document have been compiled by Hacı Ömer Sabancı Holding A.Ş. ( Holding ) from sources believed
Transforming RWE and securing a sound financial base. (as of December 2016)
") Transforming RWE and securing a sound financial base (as of December 2016) Notice This document contains forward-looking statements. These statements are based on the current views, expectations, assumptions
Transforming RWE and securing a sound financial base (as of December 2016) Notice This document contains forward-looking statements. These statements are based on the current views, expectations, assumptions
Net debt of 15.1bn by Sep-17, -5% YTD Portfolio reshuffling (disposal of Naturgas & reinforecement in EDPR stake to 82.6%): - 1.
: - 1.") 0 EBITDA 3,269m, +13% YoY benefiting from gain on Naturgas disposal Recurring EBITDA (1) 2,711m, -4% YoY penalised by 52% decline YoY of hydro production in Iberia OPEX IV efficiency programme achieved
0 EBITDA 3,269m, +13% YoY benefiting from gain on Naturgas disposal Recurring EBITDA (1) 2,711m, -4% YoY penalised by 52% decline YoY of hydro production in Iberia OPEX IV efficiency programme achieved
- a leading energy company in the Nordic area. Investor Meetings
 - a leading energy company in the Nordic area Investor Meetings November 2004 Fortum's strategy Fortum focuses on the Nordic energy market as a platform for long-term profitable growth Create the leading
CONFERENCE CALL ON CEZ GROUP 2010 FINANCIAL RESULTS
 CONFERENCE CALL ON CEZ GROUP 2010 FINANCIAL RESULTS AUDITED CONSOLIDATED RESULTS PREPARED IN ACCORDANCE WITH THE INTERNATIONAL FINANCIAL REPORTING STANDARDS (IFRS) Prague, 28 February 2011 AGENDA Financial
H results. innogy SE 11 August 2017 Bernhard Günther CFO
 H1 2017 results innogy SE 11 August 2017 Bernhard Günther CFO Notice This document contains forward-looking statements. These statements are based on the current views, expectations, assumptions and information
COMPANY OVERVIEW. US$812mn. Largest Energy Generator in Chile 5,063MW 531 MW 100% 11 Years. US$2.2bn. BBB-/Baa3 66.7% of installed capacity
 INVESTOR DAY 2018 COMPANY OVERVIEW 5,063MW of installed capacity 531 MW Of fully funded capacity under construction US$812mn EBITDA LTM 1Q-2018 Largest Energy Generator in Chile 100% Of efficient generation
Vattenfall Q3 results 2009
 Vattenfall Q3 results 2009 Presentations by Lars G. Josefsson, CEO and Dag Andresen, CFO Agenda CEO Lars G. Josefsson: CFO Dag Andresen: Financial highlights Generation volumes Electricity price development
Fortum in Russia. Tapio Kuula. Senior Vice President Fortum Corporation. Capital Markets Day
 Fortum in Russia Tapio Kuula Senior Vice President Fortum Corporation Capital Markets Day Stockholm, 4 June 2007 Disclaimer This presentation does not constitute an invitation to underwrite, subscribe
Vattenfall Capital Markets Day 2009
 Vattenfall Capital Markets Day 2009 Presentation by: Dag Andresen First Senior Executive Vice President Group CFO Amsterdam, 23 September 2009 Contents Financial targets and outcome Nuon acquisition Actions
Q1-Q Results Presentation. Investor and Analyst Conference Call 14 November 2017
 Q-Q3 207 Results Presentation Investor and Analyst Conference Call 4 November 207 Markus Krebber Chief Financial Officer Gunhild Grieve Head of Investor Relations Disclaimer This document contains forward-looking
2017 Full Year Results and Outlook March 2018
 207 Full Year Results and Outlook 208 3 March 208 Disclaimer This document contains forward-looking statements. These statements are based on the current views, expectations, assumptions and information
LW BOGDANKA GROUP PRESENTATION OF Q AND Q1-Q RESULTS
 LW BOGDANKA GROUP PRESENTATION OF Q3 2013 AND Q1-Q3 2013 RESULTS www.lw.com.pl November 7th 2013 1 SPEAKERS Zbigniew Stopa President of the Management Board Roger de Bazelaire Vice-President of the Management
Fortum Corporation Supplying power for large scale businesses
 Fortum Corporation Supplying power for large scale businesses Ann Boije af Gennäs, Sales Manager, Origination Saara Rantanen, Originator, Origination Content I. Fortum s competitive edge as Power Counterparty
MANAGEMENT BOARD S REPORT ON THE ACTIVITIES OF KOGENERACJA S.A. AND KOGENERACJA GROUP
 MANAGEMENT BOARD S REPORT ON THE ACTIVITIES OF KOGENERACJA S.A. AND KOGENERACJA GROUP 2017 1 Table of contents I. Group profile... 5 1. Legal basis... 5 2. Group characteristics... 5 3. KOGENERACJA Group...
+0.6GW additions of wind and solar capacity Efficiency savings of 141m (26% above 2017 target for OPEX IV Programme)
") 0 EBITDA +6% at 3.99bn, benefiting from the gain on Naturgas disposal (+ 0.5bn one-offs) Recurring EBITDA -5% to 3.52bn, penalised by severe drought in Iberian peninsula (- 0.3bn) +0.6GW additions of wind
0 EBITDA +6% at 3.99bn, benefiting from the gain on Naturgas disposal (+ 0.5bn one-offs) Recurring EBITDA -5% to 3.52bn, penalised by severe drought in Iberian peninsula (- 0.3bn) +0.6GW additions of wind
FITCH REVISES TAURON'S OUTLOOK TO STABLE; AFFIRMS AT 'BBB'
 FITCH REVISES TAURON'S OUTLOOK TO STABLE; AFFIRMS AT 'BBB' Fitch Ratings-Warsaw/London-14 November 2016: Fitch Ratings has revised TAURON Polska Energia S.A.'s (Tauron) Outlook to Stable from Negative
CEZ GROUP Q1 - Q RESULTS NONAUDITED CONSOLIDATED RESULTS (IFRS)
") CEZ GROUP Q1 - Q3 2006 RESULTS NONAUDITED CONSOLIDATED RESULTS (IFRS) Prague, November 15, 2006 PROGRAM Financial results Petr Vobořil, CFO CEZ Group trading position and Power Generation at NPP Temelin
CEZ GROUP Q1 - Q3 2006 RESULTS NONAUDITED CONSOLIDATED RESULTS (IFRS) Prague, November 15, 2006 PROGRAM Financial results Petr Vobořil, CFO CEZ Group trading position and Power Generation at NPP Temelin
in Vattenfall Heat Poland S.A. 23 August 2011
 PGNiG to acquire 99.8% stake in Vattenfall Heat Poland S.A. 23 August 2011 PGNiG has signed preliminary SPA to acquire 99.8% stake in Vattenfall Heat Poland S.A. The Management Board of Polskie Górnictwo
Capturing a unique growth opportunity Fortum to acquire majority of Russian TGC-10
 Capturing a unique growth opportunity Fortum to acquire majority of Russian TGC-10 29 February 2008 Conference call Delivering growth and value creation Fortum to acquire a majority stake of 63-76% in
Investor Conference Call. Financial Year April 2014
 Investor Conference Call Financial Year 2013 24 April 2014 Agenda Presenter 1 2 Business Profile Regulatory Developments Dr. Jörg Bergmann Chief Financial Officer Open Grid Europe GmbH 3 Refinancing 4
RWE s Commodity Risk Management
 RWE Credit Day 2006 RWE s Commodity Risk Management Hans Bünting Vice President Group Risk Management RWE AG London, July 6, 2006 RWE s Commodity Risk Hedging Principles [1/2] As a matter of principle,
CONFERENCE CALL ON CEZ GROUP FINANCIAL RESULTS IN 2012
 CONFERENCE CALL ON CEZ GROUP FINANCIAL RESULTS IN 2012 AUDITED CONSOLIDATED RESULTS PREPARED IN ACCORDANCE WITH THE INTERNATIONAL FINANCIAL REPORTING STANDARDS (IFRS) Prague, 28 February 2013 AGENDA Financial
APIMEC Presentation August 2011
 APIMEC Presentation August 2011 Disclaimer This presentation may include forward-looking statements of future events or results according to regulations of the Brazilian and international securities and
Fixed Income Investor Update. innogy SE November 2016
 Fixed Income Investor Update innogy SE November 2016 innogy at a glance Financial review innogy s credit profile innogy at a glance Successful implementation of innogy carve-out and IPO Dec Jan Feb Mar
FINANCIAL RESULTS Q CFO Irene Egset 4 th May 2017
 FINANCIAL RESULTS Q1 2017 CFO Irene Egset 4 th May 2017 Health, safety and environment TRI-rate 1 10 8 6 4 2 0 2014 2015 2016 2017 Health and safety - Quarterly injuries rate is down in Q1 - Continuously
Debt Investor Update Call. E.ON Cleaner & better energy. Dr. Marcus Schenck, CFO 24 November 2011
 Debt Investor Update Call E.ON Cleaner & better energy Dr. Marcus Schenck, CFO 24 November 2011 Agenda Update on strategy & operations Financial highlights 2 E.ON s strategy to address key challenges Investor
Unipro PJSC 2016 Full year results
 Unipro PJSC 2016 Full year results 16 March 2017 2016 results stable operating earnings hit by a one off effect EBITDA 1,2 EBIT 1,2 Highlights 24.9bn 17.7bn 12M 2015 12M 2016 17.4bn 12M 2015 11.0bn 12M
INTERIM FINANCIAL REPORT FIRST NINE MONTHS 2013
 INTERIM FINANCIAL REPORT FIRST NINE MONTHS 2013 Moving Energy Forward 23 October 2013 Disclaimer Certain statements in this presentation are based on the beliefs of our management as well as assumptions
Focus on financial strength
 Focus on financial strength Bernhard Günther Chief Financial Officer Berenberg and Goldman Sachs Third Annual German Corporate Conference Munich, 23 September 2014 Forward Looking Statement This presentation
Capital Market Press Conference 2013 / Frankfurt, 5 December 2013
 Capital Market Press Conference 2013 / 2014 Frankfurt, 5 December 2013 Key financial figures of KfW Group (IFRS) 2013: Solid business performance, decreasing profit, very sound capital basis 2011 2012
PRESENTATION ON CEZ GROUP FINANCIAL RESULTS IN Q1 Q3 2018
 PRESENTATION ON CEZ GROUP FINANCIAL RESULTS IN Q1 Q3 2018 NON-AUDITED CONSOLIDATED RESULTS PREPARED IN ACCORDANCE WITH INTERNATIONAL FINANCIAL REPORTING STANDARDS (IFRS) November 8, 2018 A LITTLE ENERGY
RWE Company Presentation. As of August 2018
 RWE Company Presentation As of August 208 Disclaimer This document contains forward-looking statements. These statements are based on the current views, expectations, assumptions and information of the
Bank Handlowy w Warszawie S.A. Preliminary consolidated financial results for 2018
 Bank Handlowy w Warszawie S.A. Preliminary consolidated financial results for 20 February 14, 2019 www.citihandlowy.pl Bank Handlowy w Warszawie S.A. 20 Summary Financial data & profitability Treasury
Results 2Q18. August 2, 2018
 Results August 2, 2018 Highlights Indicators Var. x 2Q17 Operating Income (R$ MM) 42.8 +92.7% Operating Margin 1.8% +0.8 p.p. Net operating revenues: R$2.4 billion (+9.0% vs. 2Q17) ASK (BN) 10.7 +2.2%
Fortum in European and Russian power markets
 Fortum in European and Russian power markets Mikael Lilius President and CEO Fortum Corporation Fortum Investor/Analyst day 2006 27 November, London Disclaimer This presentation does not constitute an
Aviva Investors Poland S.A. GIPS Report. 31 st of July 2011
 Aviva Investors Poland S.A. GIPS Report 2011 31 st of July 2011 The Firm Aviva Investors Poland S.A... 3 The definition of the Firm... 3 Total firm assets... 3 Significant events... 3 Other information...
Financial markets impact on energy. Antonio Tognoli
 Financial markets impact on energy prices Antonio Tognoli Roma - December, 4th 2008 Identity crisis of the utilities sector so fa ar in 2008 Long-term Utilities sector relative performance Utilities sector
Recurring EBITDA +10% to 2,832m including 2% negative impact from ForEx
 0 Recurring EBITDA +10% to 2,832m including 2% negative impact from ForEx Recurring net profit +17% to 661m Net profit -16% to 615m (non recurring gain on Pecém in ) 2.0bn Tariff Deficit Sales in Regulatory
Consolidated financial results for 2Q 2018
 August 23 2018 Bank Handlowy w Warszawie S.A. Consolidated financial results for 2Q 2018 www.citihandlowy.pl Bank Handlowy w Warszawie S.A. 1 2Q 2018 summary Financial results Net profit with double-digit
VERBUND AG,
 VERBUND Full year results Vienna 05/03/2014 Paradigm shift in the European electricity market Strong expansion of electricity generation (new renewable and conventional power plants) and decrease of electricity
GDF SUEZ Energy France Business line. Henri Ducré
 GDF SUEZ Energy France Business line Henri Ducré Key business figures * Leading positions in gas and electricity in France 1 st gas supplier 2 nd producer and supplier of electricity 1 st player in the
Presentation of IPOPEMA Securities S.A.
 Presentation of IPOPEMA Securities S.A. November 2012 IPOPEMA Group Sales & Trading Investment Banking Funds Asset Management Business Advisory IPOPEMA Securities IPOPEMA TFI IPOPEMA AM IPOPEMA BC Shares
Structure of new financing of Polsat Group
 Structure of new financing of Polsat Group September 22 nd, 2015 Cyfrowy Polsat S.A. Capital Group Disclaimer This presentation includes 'forward-looking statements'. All statements other than statements
ENERGA Group's financial results 9M #EnergaWyniki
 ENERGA Group's financial results 9M 2018 @EnergaSA #EnergaWyniki 8 November 2018 Energa Group after Q3 2018 Over 40 000 new clients connected to the distribution network Stable Group's results after 9
PORR s VIEW: Vienna Main Railway Station. Q of PORR AG SOLID BASE FOR GROWTH Investor Presentation
 PORR s VIEW: Vienna Main Railway Station Q3 2015 of PORR AG SOLID BASE FOR GROWTH Investor Presentation Disclaimer This presentation was prepared by PORR AG (the "Company") solely for use at investors
-3% Recurring +5% -16% Recurring EBITDA (1) : 1,740m Sound underlying growth in Brazil & renewables
 : 1,740m Sound underlying growth in Brazil & renewables") Recurring EBITDA (1) : 1,740m Sound underlying growth in Brazil & renewables -6% Forex impact on BRL and USD depreciation vs. Euro Hydro recovery YoY in Iberia and strong opex performance YoY -3% Recurring
Recurring EBITDA (1) : 1,740m Sound underlying growth in Brazil & renewables -6% Forex impact on BRL and USD depreciation vs. Euro Hydro recovery YoY in Iberia and strong opex performance YoY -3% Recurring
Public Power Corporation SA. Financial Results Athens, March 30, 2010
 Public Power Corporation SA Financial Results 2009 Athens, March 30, 2010 1 Agenda Financial Results George Angelopoulos, CFO Business Update & 2010 Outlook Arthouros Zervos, Chairman and CEO 2 Financial
CONFERENCE CALL ON CEZ GROUP FINANCIAL RESULTS IN Q1 Q3 2015
 CONFERENCE CALL ON CEZ GROUP FINANCIAL RESULTS IN Q1 Q3 2015 Non-audited consolidated results prepared in accordance with the International Financial Reporting Standards (IFRS) (quarterly report pursuant
Vattenfall Q3 and 9M 2013 results
 Vattenfall Q3 and 9M 2013 results Øystein Løseth, CEO and Ingrid Bonde, CFO Conference call for analysts and investors, 29 October 2013 Q3 Highlights Underlying EBIT SEK 4.0 bn (4.5) - Higher costs for
Gazprom. Consolidated 2008 IFRS Financial Results Presentation
 Gazprom Consolidated 2008 IFRS Financial Results Presentation Disclaimers This presentation has been prepared by OJSC Gazprom (the Company ), and comprises the slides for a presentation to investors concerning
CONTENT. 01 Highlights. 02 Portfolio Performance. 03 Optimisation of Financing Structure. 04 FY 2017 Results. 05 Outlook FY
 CONTENT 01 Highlights 02 Portfolio Performance 03 Optimisation of Financing Structure 04 FY 2017 Results 05 Outlook FY 2017 2 IMMOFINANZ RESTRUCTURING 5/2015 12/2017 Sale of logistics asset class - focus
Bank Handlowy w Warszawie S.A.
 Bank Handlowy w Warszawie S.A. Consolidated financial results for 1Q 2018 May 11 2018 www.citihandlowy.pl Bank Handlowy w Warszawie S.A. 1Q 2018 summary Robust beginning of the year Strong net profit increase:
Picture new turbines/ products/ flagship product. H Performance Update Investors and analysts presentation
 Picture new turbines/ products/ flagship product H1 2017 Performance Update Investors and analysts presentation Senvion S.A. August 11, 2017 Disclaimer This presentation (the Presentation ) has been prepared
Bank Handlowy w Warszawie S.A. Preliminary consolidated financial results for 2017
 Bank Handlowy w Warszawie S.A. Preliminary consolidated financial results for 2017 February 14th, 2018 www.citihandlowy.pl Bank Handlowy w Warszawie S.A. 2017 Summary Increasing profit on customer business
Inflation projection of Narodowy Bank Polski based on the NECMOD model
 Economic Institute Inflation projection of Narodowy Bank Polski based on the NECMOD model Warsaw / 9 March Inflation projection of the NBP based on the NECMOD model Outline: Introduction Changes between
The Way Forward Mikael Lilius President and CEO Capital Markets Day
 The Way Forward Mikael Lilius President and CEO Capital Markets Day June 17, 2004 Fortum's strategy Fortum focuses on the Nordic energy market as a platform for long-term profitable growth Create the leading
Fortum Corporation Interim Report January-March April 2012
 Fortum Corporation Interim Report January-March 2012 26 April 2012 1 Disclaimer This presentation does not constitute an invitation to underwrite, subscribe for, or otherwise acquire or dispose of any
Enel Américas Enel Américas 2018 Analyst Update Meeting
 Enel Américas Enel Américas 2018 Analyst Update Meeting Paolo Pallotti CFO Enel Américas Enel Américas Overview Enel Américas overview 1 Enel Américas is Latin America s largest private power company Colombia
Investor Conference Call FY March 2018»
 Investor Conference Call FY 22 March 2018» Thomas Kusterer, Chief Financial Officer Ingo Peter Voigt, Head of Finance, M&A and Investor Relations Earnings turnaround achieved in Adjusted EBITDA in bn turnaround
Investor Presentation. Cover slide (same as IR cover)
") Investor Presentation Cover slide (same as IR cover) Contents Eskom at a glance Financial review Operational review Design-to-Cost RCA High Court Decision Funding overview Progress on the new build programme
Investor Presentation Cover slide (same as IR cover) Contents Eskom at a glance Financial review Operational review Design-to-Cost RCA High Court Decision Funding overview Progress on the new build programme
Half Year Results 6 Months Ended 30 June July 2018
 Half Year Results 6 Months Ended 30 June 2018 24 July 2018 Agenda Operations and Business Review Will Gardiner, CEO Financial Review Den Jones, Interim CFO Delivering the Strategy Will Gardiner, CEO 2
The financial crisis and generation investment
 The financial crisis and generation investment Jonathan Mirrlees-Black 12 December 2008 Jonathan Mirrlees-Black +44 20 7039 9402 jmirrlees-black@exanebnpparibas.com A selection of Ideas Team publications
E.ON Debt Investor Update Call. Cleaner & better energy. Dr. Marcus Schenck, CFO May 21, 2012
 E.ON Debt Investor Update Call Cleaner & better energy Dr. Marcus Schenck, CFO May 21, 2012 Agenda Update on strategy Financial update 1 Key drivers of E.ON s transformation Five key drivers 1 Divest non-core