Implications of Federal Budget Problem Crop Management Conference November 30, 2011 Hilton Garden Inn, Columbia
|
|
|
- Dale Oliver
- 6 years ago
- Views:
Transcription
1 Implications of Federal Budget Problem Crop Management Conference November 30, 2011 Hilton Garden Inn, Columbia Ron Plain D. Howard Doane Professor Dept Ag & Applied Economics University of Missouri-Columbia
2 Federal Budget Problem 1. What is the budget problem? 2. What are the causes? A. Slow economic growth B. People are living longer C. Baby boomers starting to retire D. Huge government debt 3. How bad is it? 4. What can be done?
3
4 Federal Budget Problem 1. What is the budget problem? 2. How bad is it? 3. What are the causes? A. Slow economic growth B. People are living longer C. Baby boomers starting to retire D. Huge government debt 4. What can be done?
5 Billion $ Federal Budget Surplus, , , , , , , ,000-1,100,000-1,300,000-1,500,000-1,700,000 Source: Office of Management and Budget
6 Federal Surplus/Deficit, Source: St Louis Federal Reserve Bank
7 Tillion $ Federal Debt Held by the Public, President s Budget, February
8 Billion $ Federal Receipts & Outlays, CBO Estimate of Federal Budget, March Receipts Outlays
9 Billion $ Federal Surplus, CBO Estimate of Federal Budget, March , , , , , , ,000-1,100,000-1,300,000-1,500,000-1,700,000 Actual Forecast
10 Billion $ Federal Surplus, CBO Estimate of Federal Budget, March , , , , , , ,000-1,100,000-1,300,000-1,500,000-1,700,000 Why the sharp improvement in next 3 years? End of Bush era tax cuts End of stimulus spending End of Iragi & Afghan wars Stronger economy Actual Forecast

11 Sources: CBO and U.S. Statistical Abstract
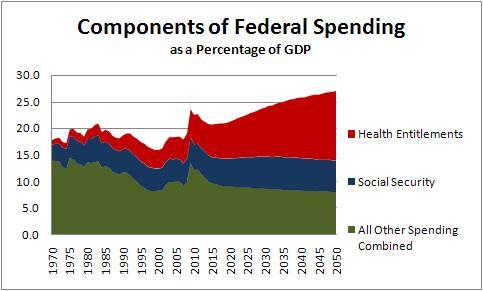
12 Billion $ Federal Surplus, CBO Estimate of Federal Budget, March , , , , , , ,000-1,100,000-1,300,000-1,500,000-1,700,000 Why does the deficit get worse after 2015? Baby boomers retirement pushes down tax revenue and drives up the cost of Social Security and Medicare Actual Forecast
13
14 Billion $ Federal Surplus, CBO Estimate of Federal Budget, March , , , , , , ,000-1,100,000-1,300,000-1,500,000-1,700,000 The federal government plans to pay its bills by borrowing more and more money. As long as someone will loan the government enough money, they can pay their bills. Actual Forecast
15 Federal Deficit March vs August
16 Billion $ Federal Receipts & Outlays, CBO Estimate of Federal Budget, August Receipts Outlays
17 Billion $ Federal Surplus, CBO Estimate of Federal Budget, August , , , , , , ,000-1,100,000-1,300,000-1,500,000-1,700,000 Actual Forecast
18 Billion $ 300, , , , , , ,000-1,100,000-1,300,000-1,500,000-1,700,000 Federal Surplus, Congressional Budget Office, 2011 March August
19 Federal Deficit Why is August deficit forecast smaller than March forecast? April FY2011 Budget
20
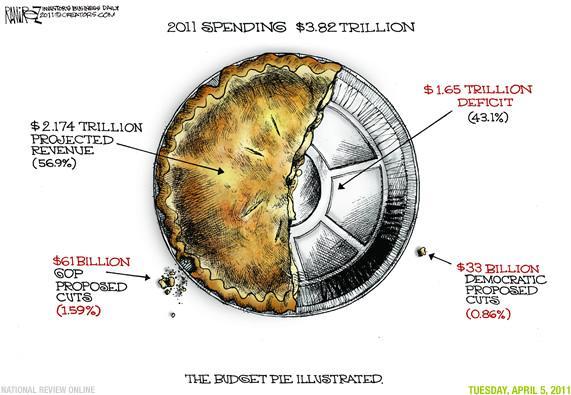
21 President s Budget for FY2012 Year Receipts Outlays Deficit billions of dollars , , , , , , , , , In March, the republican-controlled house passed legislation to cut 2011 spending by $61 billion to $3, billion leaving a 2011 deficit of $1, billion. Senate democrats called those cuts draconian mean spirited senseless and unrealistic.
22 April 2011 Budget Cuts Senate plan: cut spending by $33 billion House plan: cut spending by $61 billion Polls showed the public was in favor of a compromise Congress voted to cut spending by $38.5 billion In the 8 days preceding the deal, the federal debt grew by $54.1 billion, from $ to $ Actual reduction in 2011spending less than $0.3 billion
23 Is Congress Serious? Why S&P Downgraded the US: U.S. Tax revenue: $2,170,000,000,000 Federal budget: $3,820,000,000,000 New debt: $ 1,650,000,000,000 National debt: $14,271,000,000,000 Recent [April] budget cut: $ 38,500,000,000 Let s remove 8 zeros and pretend it s a household budget: Annual family income: $21,700 Money the family spent: $38,200 New debt on the credit card: $16,500 Outstanding balance on the credit card: $142,710 Budget cuts: $385
24 Federal Deficit Why is August deficit forecast smaller than March forecast? April FY2011 Budget August Budget Control Act Expectation of a stronger economy
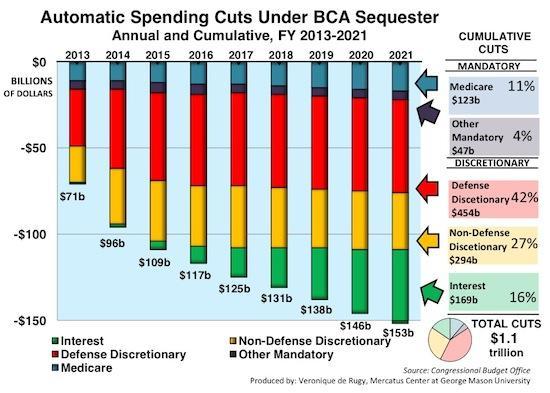
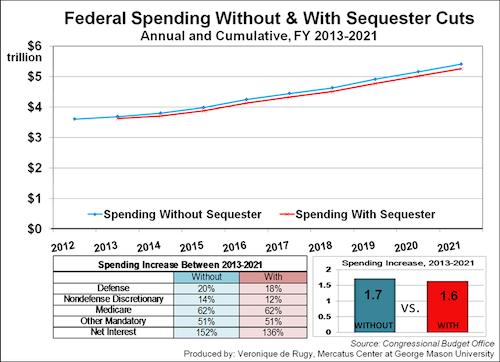
25 Budget Control Act of 2011 Calls for $2.1 Trillion of spending cuts over $0.9 Trillion in discretionary cuts $1.2 Trillion from super committee
26 Budget Control Act of 2011 If super committee does nothing, automatic cuts of $1.2 Trillion to start 1/15/12. Discretionary spending 10% (2013) to 8.5% (2021) cuts in defense ($454 B) 7.8% (2013) to 5.5% (2021) cuts in non-defense ($294 B) Mandatory spending Medicare cuts of $123 Billion less $31 Billion 7.8% (2013) to 5.5% (2021) cuts in non-defense ($47 B) Debt service savings of $169 Billion
27
28 Federal Deficit So the problem is being solved? Only on paper Congress has passed legislation calling for unspecified future cuts There have been almost no actual current cuts
29
30 Federal Deficit OMB & CBO deficit forecasts are based on current law Current law includes some tax increases and budget cuts that almost no one believes will happen
31
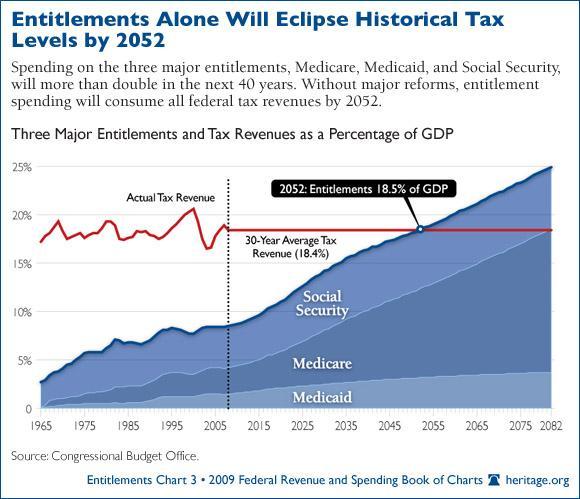
32 Unfunded Federal Obligations $ 6.36 trillion public debt $18.69 trillion Social Security $33.18 trillion - Medicare $ 3.47 trillion military retirement $ 1.85 trillion civil service retirement $ 0.25 trillion - other $63.8 trillion - total Source: USA Today 5/29/09 Equals $546,668 per household
33 Federal Deficit Forecast vs Actual

34 Federal Government Revenues and Expenditures, Billions of Dollars Source: Congressional Budget Office
35
36
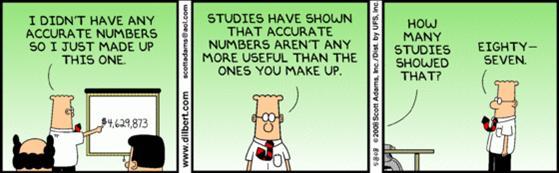
37 Federal Deficit In January 2001, CBO s 10 year forecast was for a surplus of $5.6 trillion. The actual for those 10 years was a deficit of $6.2 trillion. CBO missed by $11.8 trillion
38
39 Federal Budget Problem 1. What is the problem? 2. How bad is it? 3. What are the causes? A. Slow economic growth B. People are living longer C. Baby boomers starting to retire D. Huge government debt 4. What can be done?
40 Why so large a deficit? It is easier to get re-elected by cutting taxes and spending money than by raising taxes and saving money
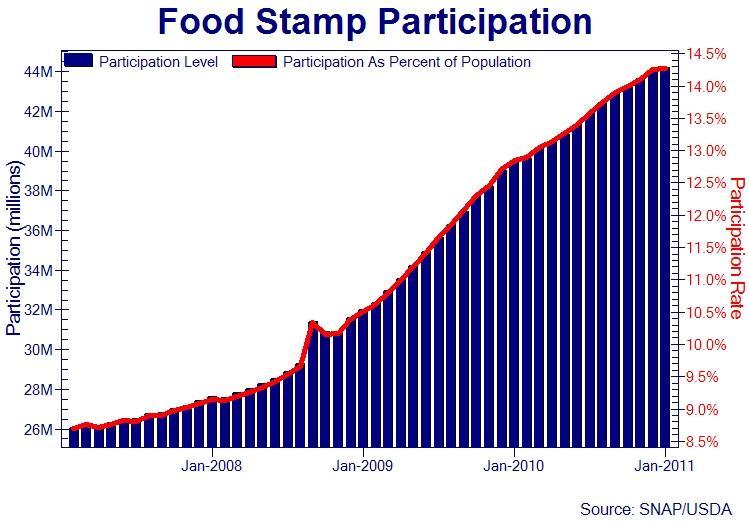
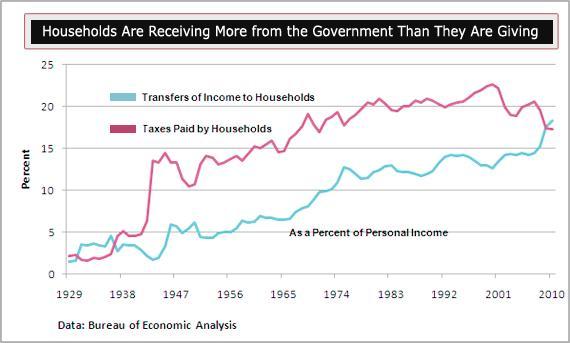
41 Americans on the Dole 46.5 million Americans: Social Security 42.6 million Americans: Medicare 42.4 million Americans: Medicaid 36.1 million Americans: food stamps 12.4 million Americans: housing subsidies Source: Census Bureau for 2009
42
43
44 In Democracy in America, Alexis de Tocqueville said, Democracy in America is doomed when the people learn to vote themselves money from the public trough.
45 Federal Budget Problem 1. What is the problem? 2. How bad is it? 3. What is the cause? A. Slow economic growth B. People are living longer C. Baby boomers starting to retire D. Huge government debt 4. What can be done?
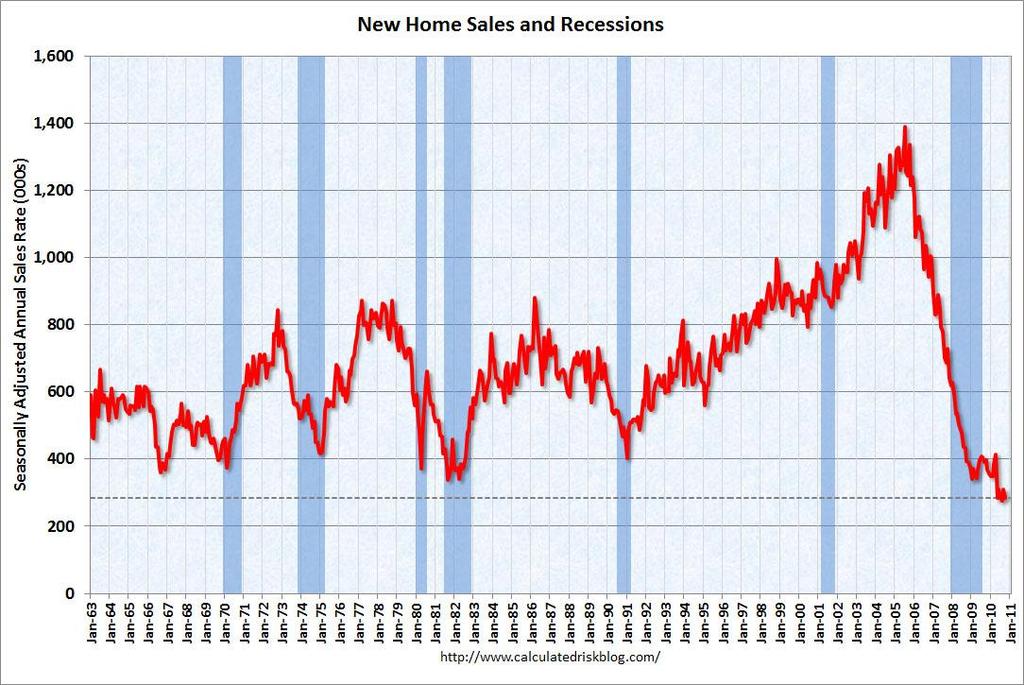
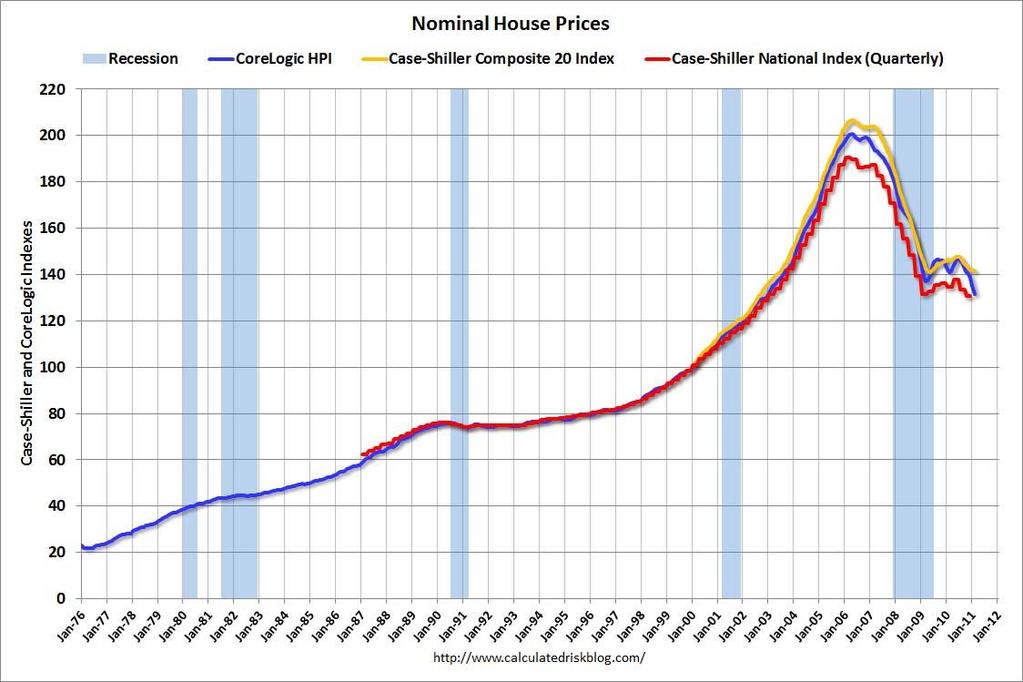
46 The Great Recession
47 U.S. Gross Domestic Product,
48
49
50
51 Percent Change Growth in Real GDP Source: U.S. Commerce Department

52 U.S. Employment, Source: St Louis Federal Reserve Bank
53 Percent Change in Real GDP from Previous Year Seasonally Adjusted, Annual Rate, Source: U.S. Department of Commerce, Bureau of Economic Analysis
54 Percent Change in Real GDP from Previous Year Seasonally Adjusted, Annual Rate, Source: U.S. Department of Commerce, Bureau of Economic Analysis
55 Percent Change in Real GDP from Previous Year Seasonally Adjusted, Annual Rate, Why the slowing in growth? Increasing governmental regulation Source: U.S. Department of Commerce, Bureau of Economic Analysis
56 Percent U.S. Unemployment Rate, Seasonally Adjusted, Source: Bureau of Labor Statistics

57 U.S. Unemployment Duration, Source: St Louis Federal Reserve Bank
58 When the private sector fails, the solution is more government. When the government fails, the solution is more government.
59 Federal Budget Problem 1. What is the problem? 2. How bad is it? 3. What is the cause? A. Slow economic growth B. People are living longer C. Baby boomers starting to retire D. Huge government debt 4. What can be done?
60 Social Security s Troubles The ratio of workers to retirees keep declining Life expectancy keeps increasing FDR signed the Social Security Act on 8/14/35 Regular monthly payments began in January 1940 In 1940, a U.S. 20 year old male was expected to live to age Collect Social Security for 2.76 years In 1970, a U.S. 20 year old male was expected to live to age Collect Social Security for 5.45 years In 2001, a U.S. 20 year old male was expected to live to age 76.0 Collect Social Security for 11.0 years In 2009, a U.S. 20 year old male was expected to live to age 76.7 Collect Social Security for 11.7 years

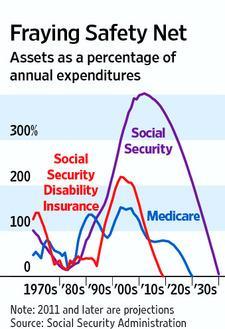
61 Data from the federal budget, historical tables, table 4.1, as deflated
62
63
64 Social Security & Medicare Trust Funds Since workers pay and retirees collect, SS & Medicare ran a cash flow surplus when started. The surplus funds were deposited in trust funds to pay future obligations.
65
66 Social Security & Medicare Trust Funds Rather than just leaving the trust fund monies in a non-earning account, the money was invested to earn interest, i.e. it was loaned to the federal government.
67 Social Security & Medicare Trust Funds These trust funds are similar to a couple who decided to put $300 each month into a tin box to pay for their new-born child s college education. Whenever they ran short of money to pay their bills, they took money out of the tin box and replaced it with an IOU. The child will soon be graduating high school and they have a tin box full of IOUs to pay for college.
68 Social Security pays out more money each month than it collects in taxes. This is depleting the trust fund which is projected to be emptied by After that there will be sufficient revenue to pay 77% of scheduled benefits. Source: Businessweek, 5/13/11
69 Medicare pays out more money each month than it collects in taxes. This is depleting the trust fund which is projected to be emptied by After that there will be sufficient revenue to pay 90% of scheduled benefits. Source: Businessweek, 5/13/11
70 Federal Budget Problem 1. What is the problem? 2. How bad is it? 3. What is the cause? A. Slow economic growth B. People are living longer C. Baby boomers starting to retire D. Huge government debt 4. What can be done?
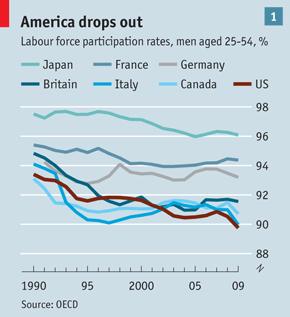
71 Labor Force Participation Rate,
72
73 Federal Budget Problem 1. What is the problem? 2. How bad is it? 3. What is the cause? A. Slow economic growth B. People are living longer C. Baby boomers starting to retire D. Huge government debt 4. What can be done?
74 Billion $ Federal Surplus, CBO Estimate of President s Budget, March , , , , , , ,000-1,100,000-1,300,000-1,500,000-1,700,000
75 Tillion $ Federal Debt Held by the Public, President s Budget, February
76 Is the U.S. Government Bankrupt? The U.S. government is like a wealthy man with lots of grandchildren to whom he has promised many, many things He has enough wealth to pay off his banker, but not enough to deliver on all the promises to his grandchildren
77 Interest rate

78 Source: New York Times Nov 23, 2009
79 U.S. Treasury Securities Outstanding, Billion $ Bills Notes Bonds TIPS Source: U.S. Treasury
80 U.S. Treasury Securities Bills mature in 1 year or less Notes mature in 1 to 10 years Bonds mature in 20 to 30 years TIPS (Treasury Inflation Protected Securities) mature in 5, 10 or 30 years
81 Faster economic growth will bring higher inflation and higher interest rates
82 Percent Change in CPI from Year Ago, Seasonally Adjusted, monthly, Source: U.S. Bureau of Labor Statistics

83 3-Month Rate,
84 Million $ Federal Interest Payments, President s Budget, February ,400,000 1,200,000 1,000, , , , ,000 0 Total Net
85
86 Government can t balance a checkbook. I know finance math. I do it for a living. And when I look at the numbers involved here, it makes my head swim.... It doesn t work. No matter how hard you wish, no matter how hard you hope, no matter how much compassion you can fit in your stupid compassionate heart, no matter how much you happen to like some program that helps somebody do something wonderful math never lies and interest never sleeps. Caring don t pay the bills. - Larry Correia
87 Federal Budget Problem 1. What is the problem? 2. How bad is it? 3. What is the cause? A. Slow economic growth B. People are living longer C. Baby boomers starting to retire D. Huge government debt 4. What can be done?
88 What can be done? 1. Kick the can down the road 2. Print money 3. Raise taxes 4. Cut spending 5. All of the above
89 Waiting to deal with the budget problem only makes the problem worse, but it benefits: Those who will die first Those who will no longer be in leadership roles when painful cuts are made
90 What can be done? 1. Kick the can down the road 2. Print money 3. Raise taxes 4. Cut spending 5. All of the above
91
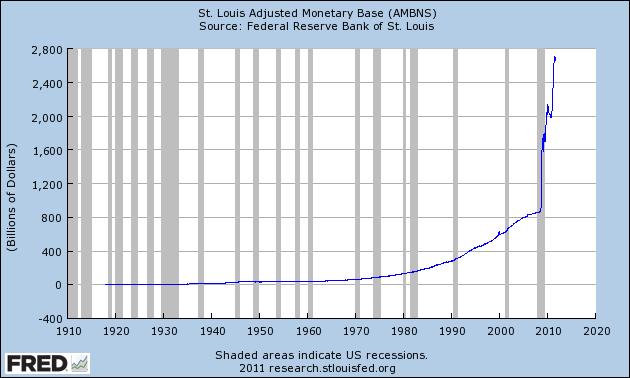
92 Billion $ St Louis Adjusted Monetary Base Source: St Louis Federal Reserve Bank

93
94 If you owe the bank $5 thousand you can t pay back, you have a problem. If you owe the bank $5 million you can t pay back, the bank has a problem.
95 What can be done? 1. Kick the can down the road 2. Print money 3. Raise taxes 4. Cut spending 5. All of the above
96
97
98
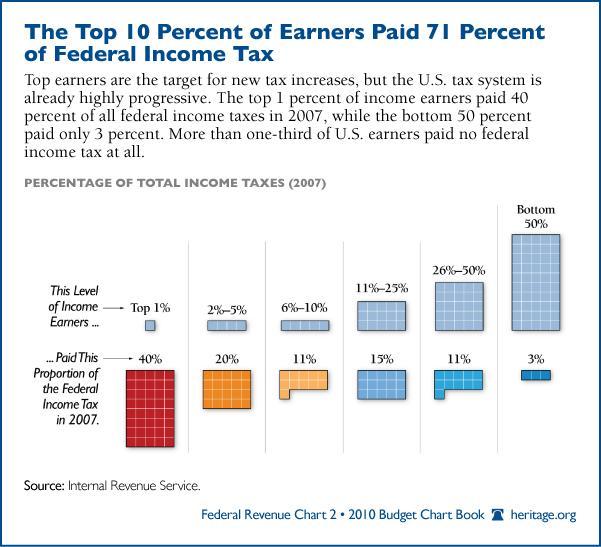
99 Why doesn t the government just raise tax rates on the rich to reduce the deficit?
100
101 Top 10% Share of Federal Taxes U.S. 45.1% Slovakia 32.0% Italy 42.2% Germany 31.2% Ireland 39.1% Luxembourg 30.3% U.K. 38.6% Japan 28.5% Australia 36.8% Austria 28.5% New Zealand 35.9% Poland 28.3% Canada 35.8% France 28.0% Netherlands 35.2% Korea 27.4% Czech Republic 34.3% Finland 32.3% Source: Tax Foundation, 2011 Average for the 24 nations in the OECD is 31.6%
102 Top 10% Share of Income Italy 35.8% Australia 28.6% Poland 33.9% Japan 28.1% U.S. 33.5% Slovakia 28.0% U.K. 32.3% Netherlands 27.5% Ireland 30.9% Belgium 27.1% New Zealand 30.3% Finland 26.9% Czech Republic 29.4% Sweden 26.6% Canada 29.3% Luxembourg 26.4% Germany 29.2% Norway 28.9% Source: Tax Foundation, 2011 Average for the 24 nations in the OECD is 28.4%
103 Ratio: Taxes to Income of Top 10% U.S Korea 1.17 Australia 1.29 Luxembourg 1.15 Netherlands 1.28 Slovakia 1.14 Ireland 1.26 Austria 1.10 Canada 1.22 France 1.10 U.K Germany 1.07 Finland 1.20 Denmark 1.02 New Zealand 1.19 Japan 1.01 Italy 1.18 Czech Republic 1.17 Source: Tax Foundation, 2011 Average for the 24 nations in the OECD is 1.11
104
105
106 What can be done? 1. Kick the can down the road 2. Print money 3. Raise taxes 4. Cut spending 5. All of the above
107
108
109
110
111 What can be done? 1. Kick the can down the road 2. Print money 3. Raise taxes 4. Cut spending 5. All of the above
112 Implications for Agriculture
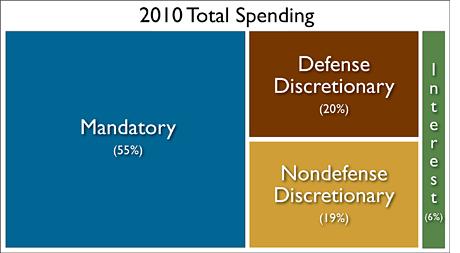
113 2010 Federal Spending 3.7% USDA 96.3% Other 2010 US Spending: $3,456 Billion
114 2010 USDA Spending 79% Mandatory 21% Discretionary 2010 USDA Spending: $129 Billion
115 2010 USDA Mandatory Spending 84% Food & Nutrition 12% CCC 4% Crop Insurance 2% NRCS 1% Ag Marketing Serv 1% Forestry 2010 USDA Mandatory Spending: $103 Billion
116 2010 USDA Discretionary Spending 16% Commodities 11% Rural Development 20% Forestry Service 4% Conservation 29% Food & Nutrition 10% Research 8% Marketing & Reg 2% Central Administration 2010 USDA Discretionary Spending: $27 Billion
117 USDA/NASS Reports Eliminated 1. July Cattle Inventory report 2. Annual report on farm numbers, land in farms and livestock operations 3. Catfish and Trout reports 4. Annual Floriculture report 5. Annual Sheep and Goat report 6. Chemical Use reports less often 7. Annual Bee and Honey report 8. Nursery report
118 Shrinking the deficit ag cuts The bio-diesel tax credit ends 12/31/11 The ethanol credit ends 12/31/11 Fixed payments are hard to defend Crop insurance subsidies are huge CRP idles needed land
119 Interest rates
120 Percent Federal Funds Rate, monthly average, Source: Board of Governors, Federal Reserve System
121 Percent Bank Prime Loan Rate, monthly average, Source: Board of Governors, Federal Reserve System
122 30 Year Mortgage Rate,
123 $/acre U.S. Farm Real Estate Values, * USDA/NASS Year *Includes all land, buildings, and dwellings on farms.
124 $/acre Missouri Farmland Values, * USDA/NASS Year *Value of all farm land and buildings. Actual 6% Trend
125 $/acre Missouri Farmland Values, * USDA/NASS At the start of 2011, Missouri land values were $292/acre above trend. Actual 6% Trend Year *Value of all farm land and buildings.
126 Land $ NFI Billion $ $3,000 $2,500 $2,000 $1,500 $1,000 $500 $0 Missouri Land Prices & U.S. Net Farm Income, Land $ NFI lag $100 $90 $80 $70 $60 $50 $40 $30 $20 $10 $0

127 U.S. Dollar Exchange Rate Index
128 Dow Jones Industrial Average
129 The greatest threat to America as we know it is the unending expansion of our own government.
130 Questions?
Deficit Day to Bankruptcy Day
 Deficit Day to Bankruptcy Day April 2014 copies of this presentation can be found at Jan 1 Dec 31 Deficit Day! How much government spending do people fund with their tax dollars? Top 1% 56 days 2% to 5%
Chapter 12 Government and Fiscal Policy
 [2] Alan Greenspan, New challenges for monetary policy, speech delivered before a symposium sponsored by the Federal Reserve Bank of Kansas City in Jackson Hole, Wyoming, on August 27, 1999. Mr. Greenspan
CBO s Current Law Projections
 The Debt Challenge CBO s Current Law Projections in trillions $25.0 Debt Held By The Public* 100% $20.0 73% 77% 90% 80% $15.0 58% 70% 60% $10.0 36% $11.3 $12.5 $14.5 50% 40% 30% $5.0 $5.0 20% 10% $0.0
TAX POLICY CENTER BRIEFING BOOK. Background. Q. What are the sources of revenue for the federal government?
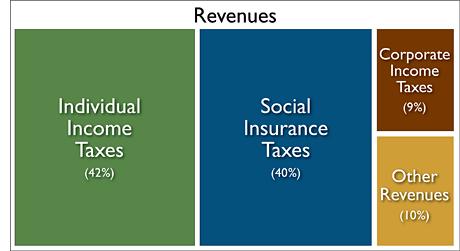
 What are the sources of revenue for the federal government? FEDERAL BUDGET 1/4 Q. What are the sources of revenue for the federal government? A. About 48 percent of federal revenue comes from individual
Post-Election Fiscal Drama in the United States: A Real Cliffhanger. Jay K. Rosengard, Kennedy School of Government, Harvard University
 Post-Election Fiscal Drama in the United States: A Real Cliffhanger Jay K. Rosengard, Kennedy School of Government, Harvard University 1 2010 Canon Institute Presentation The Global Economic Crisis: Mitigating
The Outlook for the U.S. Economy and the Policies of the New President
 The Outlook for the U.S. Economy and the Policies of the New President Jason Furman Senior Fellow, PIIE SNS/SHOF Finance Panel Stockholm June 12, 2017 Peterson Institute for International Economics 1750
Political Developments & The 2017 Tax Cut and Jobs Act
 Political Developments & The 2017 Tax Cut and Jobs Act Moderator Elizabeth Creager, AT&T Assistant Vice President for Tax Panelists Rohit Kumar, PwC Principal & Tax Policy Services Leader Jon Lieber, PwC
American healthcare: How do we measure up?
 American healthcare: How do we measure up? December 2009 September 2009 Lauren Damme Economic Growth Program Next Social Contract Initiative The U.S. is one of the only industrialized nations in the world
American healthcare: How do we measure up?
 American healthcare: How do we measure up? December 2009 September 2009 Lauren Damme Economic Growth Program Next Social Contract Initiative The U.S. is one of the only industrialized nations in the world
CHARTS MAY 23, 2017 WASHINGTON, D.C.
 CHARTS MAY 23, 2017 WASHINGTON, D.C. Peterson Foundation charts are available online and are free to use without modification for educational and editorial use, with credit to the Peter G. Peterson Foundation
Health Care in Crisis
 Health Care in Crisis The Economic Imperative for Health Care Reform James Kvaal and Ben Furnas February 19, 2009 1 Center for American Progress Health Care in Crisis U.S. spends twice as much per capita
CHARTS MAY 10, 2018 WASHINGTON, D.C.
 CHARTS MAY 10, 2018 WASHINGTON, D.C. Peterson Foundation charts are available online and are free to use without modification for educational and editorial use, with credit to the Peter G. Peterson Foundation
Chapter 10 GOVERNMENT SPENDING
 Chapter 10 GOVERNMENT SPENDING SECTION I THE ECONOMICS OF GOVERNMENT SPENDING Total Government Spending in 2003 was $ 3,000,000,000,000 For every man, woman, and child (per capita) $ 10,300 Spending in
The Case for Fundamental Tax Reform: Overview of the Current Tax System
 The Case for Fundamental Tax Reform: Overview of the Current Tax System Sources of Federal Receipts Projected for 2016 Excise Taxes 2.9% Estate & Gift Taxes 0.6% Corporate Income Taxes 9.8% Other Taxes
Selected Charts on the Long-Term Fiscal Challenges of the United States
 Selected Charts on the Long-Term Fiscal Challenges of the United States December 213 Debt Held by the Public U.S. debt is on an unsustainable path under many scenarios 2 175 15 Percentage of GDP Actual
The Lost Decade. Debt Hits 60 Percent of GDP This Year 12 Years Sooner. CBO With Policy, January CBO With Policy, December 2007
 The Lost Decade Public Debt as Percent of GDP 100 90 80 70 60 50 40 30 20 Debt Hits 60 Percent of GDP This Year 12 Years Sooner CBO With Policy, January 2010 CBO With Policy, December 2007 1980 1985 1990
N11/3/ECONO/SP2/ENG/TZ0/XX ECONOMICS STANDARD LEVEL PAPER 2. Tuesday 15 November 2011 (morning) 2 hours INSTRUCTIONS TO CANDIDATES
 2 hours INSTRUCTIONS TO CANDIDATES") 88115113 ECONOMICS STANDARD LEVEL PAPER 2 Tuesday 15 November 2011 (morning) 2 hours INSTRUCTIONS TO CANDIDATES Do not open this examination paper until instructed to do so. Answer three questions. Use
88115113 ECONOMICS STANDARD LEVEL PAPER 2 Tuesday 15 November 2011 (morning) 2 hours INSTRUCTIONS TO CANDIDATES Do not open this examination paper until instructed to do so. Answer three questions. Use
Commercial Consumerism. Jeffrey Gundlach Chief Executive Officer Chief Investment Officer
 Commercial Consumerism Jeffrey Gundlach Chief Executive Officer Chief Investment Officer June 23, 2010 Domestic Credit Market Debt as % of Gross Domestic Product 1929-2009 400% 350% Year 1 FDR Year 1 BHO
Household Financial Wealth By Selected Country
 Household Financial Wealth By Selected Country US$ Trillions 60 50-37% Indicates Projected Shortfall 40 30 20 Extrapolation of Historical Growth 2003-24 Projection (Based on Demographic Trends) -47% -34%
Saving, Investment, and the Financial System. Premium PowerPoint Slides by Ron Cronovich, Updated by Vance Ginn
 C H A P T E R 26 Saving, Investment, and the Financial System Economics P R I N C I P L E S O F N. Gregory Mankiw Premium PowerPoint Slides by Ron Cronovich, Updated by Vance Ginn 2009 South-Western, a
Economic Update. Don Bruce Research Professor Boyd Center for Business and Economic Research. January 2019
 Economic Update Don Bruce Research Professor Boyd Center for Business and Economic Research January 2019 January 2019 http://cber.haslam.utk.edu/erg/erg2019.pdf http://cber.haslam.utk.edu/ 2 National Economy
Balancing the U.S. Budget. Professor Kevin Mumford August 6, 2012
 Balancing the U.S. Budget Professor Kevin Mumford August 6, 12 Presentation Ground Rules No Normative Analysis I will try to answer what happened? or what would happen if? questions Normative questions
Income, pensions, spending and wealth
 CHAPTER 18 Income, pensions, spending and wealth After four years of growth, the median after-tax income for Canadian families of two or more people remained virtually stable in 2008 at $63,900. The level
THE LONG-TERM SUSTAINABILITY OF PUBLIC FINANCE IN JAPAN. Yukihiro Oshika *
 THE LONG-TERM SUSTAINABILITY OF PUBLIC FINANCE IN JAPAN Yukihiro Oshika * Introduction Compared to other advanced countries, the public finance of Japan is in the worst position in terms of debt level.
Tax Cuts and Jobs Act of 2017 and Your Taxes. James Nordin, DPA Adjunct Professor Golden Gate University
 Tax Cuts and Jobs Act of 2017 and Your Taxes James Nordin, DPA Adjunct Professor Golden Gate University Context Income Taxes are Single Largest Revenue Source for Federal Government Historically, a Progressive
Nuts & Bolts of Corporate Tax Reform
 Nuts & Bolts of Corporate Tax Reform July 19, 2013 Presentation for the Alliance for a Just Society Steve Wamhoff, Citizens for Tax Justice The Work of Citizens for Tax Justice (CTJ) on Federal Tax Policy
Approach to Employment Injury (EI) compensation benefits in the EU and OECD
 compensation benefits in the EU and OECD") Approach to (EI) compensation benefits in the EU and OECD The benefits of protection can be divided in three main groups. The cash benefits include disability pensions, survivor's pensions and other short-
Approach to (EI) compensation benefits in the EU and OECD The benefits of protection can be divided in three main groups. The cash benefits include disability pensions, survivor's pensions and other short-
Corrigendum. OECD Pensions Outlook 2012 DOI: ISBN (print) ISBN (PDF) OECD 2012
 ISBN (PDF) OECD 2012") OECD Pensions Outlook 2012 DOI: http://dx.doi.org/9789264169401-en ISBN 978-92-64-16939-5 (print) ISBN 978-92-64-16940-1 (PDF) OECD 2012 Corrigendum Page 21: Figure 1.1. Average annual real net investment
OECD Pensions Outlook 2012 DOI: http://dx.doi.org/9789264169401-en ISBN 978-92-64-16939-5 (print) ISBN 978-92-64-16940-1 (PDF) OECD 2012 Corrigendum Page 21: Figure 1.1. Average annual real net investment
Financial Implications of an Ageing Population
 Financial Implications of an Ageing Population Presentation to Aged & Community Care Victoria s State Congress and Trade Exhibition Saul Eslake Chief Economist ANZ Flemington Racecourse Melbourne 25 th
C W S S u m m i t. Dambisa Moyo 16 May 2012 London
 2 0 1 2 C W S S u m m i t Dambisa Moyo 16 May 2012 London Table of Contents I Global Labour Market Picture II Six Labour Market Drivers III The Challenges Ahead 2 Global unemployment (millions) Unemployment
CRS Report for Congress
 CRS Report for Congress Received through the CRS Web Order Code RS22032 Updated May 23, 2005 Foreign Aid: Understanding Data Used to Compare Donors Summary Larry Nowels Specialist in Foreign Affairs Foreign
Budget repair and the changing size of Australia s government. Crawford Australian Leadership Forum John Daley, Grattan Institute June 2016
 Budget repair and the changing size of Australia s government Crawford Australian Leadership Forum John Daley, Grattan Institute June 2016 Commonwealth expenditure is high relative to history; revenue
Statistical annex. Sources and definitions
 Statistical annex Sources and definitions Most of the statistics shown in these tables can be found as well in several other (paper or electronic) publications or references, as follows: the annual edition
RECESSION AND RECOVERY IN NEBRASKA AND THE U.S.
 RECESSION AND RECOVERY IN NEBRASKA AND THE U.S. Alison Felix Senior Economist Federal Reserve Bank of Kansas City The views expressed are those of the presenter and do not necessarily reflect the positions
Understanding and Beating. Joan Entmacher National Women s Law Center June 7, 2011
 Understanding and Beating Joan Entmacher National Women s Law Center June 7, 2011 Budget perplexed? Debt limit? Global spending cap? Balanced budget amendment? Mandatory spending? Discretionary spending?
Old Dominion University 2013 National Economic Outlook
 Old Dominion University 2013 National Economic Outlook January 30, 2013 Professor Vinod Agarwal Professor Mohammad Najand Professor Gary A. Wagner www.odu.edu/forecasting 1 Presentation Outline 2012 Scorecard
AS A SHARE OF THE ECONOMY AND THE BUDGET, U.S. DEVELOPMENT AND HUMANITARIAN AID WOULD DROP TO POST-WWII LOWS IN 2002.
 820 First Street, NE, Suite 510, Washington, DC 20002 Tel: 202-408-1080 Fax: 202-408-1056 center@cbpp.org http://www.cbpp.org June 18, 2001 AS A SHARE OF THE ECONOMY AND THE BUDGET, U.S. DEVELOPMENT AND
The current state of the Japanese Economy and mid- to long-term challenges it faces
 The current state of the Japanese Economy and mid- to long-term challenges it faces July 2, 2008 Atsushi NAKAJIMA, Chief Economist. 1. Recent developments and outlook on the Japanese economy (1) The rise
Fiscal Policy & Colored Animals
 Fiscal Policy & Colored Animals Eric M. Leeper Department of Economics, Indiana University September 2010 College of Arts & Sciences Alumni Event The Message If we allow the The Message to distract us
A Washington Forecast for Advisors and Investors
 A Washington Forecast for Advisors and Investors May 24, 2011 by Robert Huebscher Only entitlement reform can bridge the federal deficit, and your clients should prepare for changes to Medicare and Social
THE PRESIDENT S BUDGET REQUEST FOR FY 2013
 National Priorities Project s Data for Democracy Webinar Series The President s FY2013 Budget Request March 2012 Slide #1 THE PRESIDENT S BUDGET REQUEST FOR FY 2013 In this webinar, we will discuss: The
Outlook Overview: OECD Countries UN LINK Conference, Bangkok October, 2009
 Outlook Overview: OECD Countries UN LINK Conference, Bangkok 26 28 October, 2009 Dave Turner OECD, Economics Department OECD Outlook: Outline 1. Recovery underway but will probably be slow 2. Risks and
Sources of Government Revenue in the OECD, 2016
 FISCAL FACT No. 517 July, 2016 Sources of Government Revenue in the OECD, 2016 By Kyle Pomerleau Director of Federal Projects Kevin Adams Research Assistant Key Findings OECD countries rely heavily on
working paper President Obama s First Budget By Veronique de Rugy No March 2009
 No. 09-05 March 2009 working paper President Obama s First Budget By Veronique de Rugy The ideas presented in this research are the author s and do not represent official positions of the Mercatus Center
Tom Weisskopf talk on U.S. AUSTERITY POLICIES (Ann Arbor, MI, 4/23/2013)
") Tom Weisskopf talk on U.S. AUSTERITY POLICIES (Ann Arbor, MI, 4/23/2013) 0. Introduction: an onslaught of fiscal and debt struggles over the past 3 years 2010: The National Commission on Fiscal Responsibility
Tom Weisskopf talk on U.S. AUSTERITY POLICIES (Ann Arbor, MI, 4/23/2013) 0. Introduction: an onslaught of fiscal and debt struggles over the past 3 years 2010: The National Commission on Fiscal Responsibility
Macroeconomic scenarios for skill demand and supply projections, including dealing with the recession
 Alphametrics (AM) Alphametrics Ltd Macroeconomic scenarios for skill demand and supply projections, including dealing with the recession Paper presented at Skillsnet technical workshop on: Forecasting
PENSIONS IN OECD COUNTRIES: INDICATORS AND DEVELOPMENTS
 PENSIONS IN OECD COUNTRIES: INDICATORS AND DEVELOPMENTS Marius Lüske Directorate for Employment, Labour and Social Affairs, OECD Lisbon, 28.09.2018 Marius.LUSKE@oecd.org www.oecd.org/els OUTLINE Talk based
Sources of Government Revenue in the OECD, 2014
 FISCAL FACT Nov. 2014 No. 443 Sources of Government Revenue in the OECD, 2014 By Kyle Pomerleau Economist Key Findings OECD countries rely heavily on consumption taxes, such as the value added tax, and
Short run prospects in Europe and the United States
 Short run prospects in Europe and the United States Olivier Blanchard September 2003 Strong hope in Europe that the US expansion is gaining strength, and will take Europe out of its slump. Half right,
Fiscal Challenges for State and Federal Governments
 Fiscal Challenges for State and Federal Governments Robert C. Pozen Senior Lecturer, Harvard Business School Senior Fellow, Brookings Institution Agenda Fiscal Crisis in State and Local Governments Outlook
Federal Spending to Top a Record $4 Trillion in FY2017
 Federal Spending to Top a Record $4 Trillion in FY2017 July 11, 2017 by Gary Halbert of Halbert Wealth Management 1. June Unemployment Report Was Better Than Expected 2. Federal Spending to Blow Through
The Global Financial Crisis and the Return of the Nordic Model?
 The Global Financial Crisis and the Return of the Nordic Model? Lars Calmfors Embassy of Denmark and the Swedish Institute of International Affairs 18 November Topics 1. The global economic crisis 2. Globalisation
Ways to increase employment
 Ways to increase employment Iceland Luxembourg Spain Canada Italy Norway Denmark Germany Portugal Ireland Japan Belgium Switzerland Austria Slovenia United States New Zealand Finland France Netherlands
Fiscal Policy: Government Spending &Taxation
 Lecture Notes for Chapter 1 of Macroeconomics: An Introduction Fiscal Policy: Government Spending &Taxation Copyright 1999-28 by Charles R. Nelson 2/28/8 In this chapter we will discuss - What is Fiscal
Fiscal Policy in Japan
 Fiscal Policy in Japan - Issues and Future Directions- June 10th, 2015 Ministry of Finance General Government Gross Debt and Financial Balances (International Comparison) (%) 240 210 General Government
WikiLeaks Document Release
 WikiLeaks Document Release February 2, 2009 Congressional Research Service Report RL34073 Productivity and National Standards of Living Brian W. Cashell, Government and Finance Division July 5, 2007 Abstract.
Social Expenditure in Japan: Trends and Backgrounds
 Social Expenditure in Japan: Trends and Backgrounds Junko Takezawa The 9th Social Experts Meeting the Center Mark Hotel in Seoul (28 29 October 2014) Presentation Outline 1. Trends in Social Expenditure
The State of the Economy 2017
 The State of the Economy 2017 Comments by Dennis W. Jansen Professor of Economics and Jordan Professor of Public Policy, Texas A&M University Real GDP or Aggregate Output The Great Recession Largest decline
Understanding the Federal Budget 1
 Understanding the Federal Budget 1 "For in the end, a budget is more than simply numbers on a page. It is a measure of how well we are living up to our obligations to ourselves and one another." --From
Mandatory Spending Since 1962
 D. Andrew Austin Analyst in Economic Policy Mindy R. Levit Analyst in Public Finance February 16, 2010 Congressional Research Service CRS Report for Congress Prepared for Members and Committees of Congress
Ageing and employment policies: Ireland
 Ageing and employment policies: Ireland John Martin 1 Director for Employment, Labour and Social Affairs, OECD FÁS Annual Labour Market Conference, Dublin, 5 December 2005 OECD has carried out a major
Basic information. Tax-to-GDP ratio Date: 29 November 2010
 Federal Department of Finance FDF Federal Finance Administration FFA Basic information Date: 29 November 2010 Tax-to-GDP ratio 2010 The tax-to-gdp ratio is the sum of all taxes and public levies in relation
U.S. National Security Budgets in Context. Cindy Williams Principal Research Scientist
 U.S. National Security Budgets in Context Cindy Williams Principal Research Scientist 1 Overview of Discussion U.S. budget for national defense National defense budget in perspective Total U.S. federal
Initial assessment of the Federal Budget
 Initial assessment of the 27-8 8 Federal Budget ANZ Budget Night dinner Saul Eslake with the assistance of Riki Polygenis & Amber Rabinov 8 th th May 27 1 The economic and political context 2 World economy
Can America Govern Itself? Deficits, Debt, and Delay
 Can America Govern Itself? Deficits, Debt, and Delay Ron Haskins Senior Fellow, The Brookings Institution Senior Consultant, The Annie E. Casey Foundation Brookings Mountain West University of Nevada,
The Budget Deficit of the United States and the Current Account Deficits of the Eurozone Latin Countries
 (Ackermann) Remarks at dinner honoring Joe Ackermann October 25, 2012 Martin Feldstein The Budget Deficit of the United States and the Current Account Deficits of the Eurozone Latin Countries Thank you.
Statistical Annex ANNEX
 ISBN 92-64-02384-4 OECD Employment Outlook Boosting Jobs and Incomes OECD 2006 ANNEX Statistical Annex Sources and definitions Most of the statistics shown in these tables can be found as well in three
COVERAGE OF PRIVATE PENSION SYSTEMS AND MAIN TRENDS IN THE PENSIONS INDUSTRY IN THE OECD
 COVERAGE OF PRIVATE PENSION SYSTEMS AND MAIN TRENDS IN THE PENSIONS INDUSTRY IN THE OECD Fafo Pension Forum Oslo, 16 November 2012 Stéphanie Payet OECD Financial Affairs Division Structure of the Presentation
Day of Reckoning Delayed
 ' TM First Quarter 1999 Day of Reckoning Delayed Economic Growth Postpones Social Security Losses by One Year Once again, the U.S. economy has turned in an unexpectedly strong performance. Gross domestic
Annuities: a private solution to longevity risk
 Annuities: a private solution to longevity risk Product & Knowledge Fair 2007 Rüschlikon 30 March 2007 Thomas Hess Head of Economic Research & Consulting Veronica Scotti Client Solutions Need for private
Investing for our Future Welfare. Peter Whiteford, ANU
 Investing for our Future Welfare Peter Whiteford, ANU Investing for our future welfare Presentation to Jobs Australia National Conference, Canberra, 20 October 2016 Peter Whiteford, Crawford School of
Burden of Taxation: International Comparisons
 Burden of Taxation: International Comparisons Standard Note: SN/EP/3235 Last updated: 15 October 2008 Author: Bryn Morgan Economic Policy & Statistics Section This note presents data comparing the national
FARM BILL UPDATE WHAT CAN WISCONSIN EXPECT?
 FARM BILL UPDATE WHAT CAN WISCONSIN EXPECT? Paul D. Mitchell Agricultural and Applied Economics University of Wisconsin, Madison, WI, USA Farm Management Update for Ag Professionals Kimberly, WI September
10% 10% 15% 15% Caseload: WE. 15% Caseload: SS 10% 10% 15%
 Percentchangeincaseload 15% 10% 5% 0% 5% 10% 15% Caseload: AO 0 1 2 3 4 5 Percentchangein caseload 15% 10% 5% 0% 5% 10% 15% Caseload: NC 0 1 2 3 4 5 Years Years Percentchangein caseload 15% 10% 5% 0% 5%
8-Jun-06 Personal Income Top Marginal Tax Rate,
 8-Jun-06 Personal Income Top Marginal Tax Rate, 1975-2005 2005 2000 1999 1998 1997 1996 1995 1994 1993 1992 1991 1990 1989 1988 Australia 47% 47% 47% 47% 47% 47% 47% 47% 47% 47% 47% 48% 49% 49% Austria
Economics Chapters Duke Unit III Measuring Economic Performance
 Economics Chapters 12-16 Duke Unit III Measuring Economic Performance Chapter 12 Section 1 (Pgs. 301-308) Gross Domestic Product (GDP)- 1. What is the difference between final goods and services as opposed
AN ANALYSIS OF THE RECENT DETERIORATION IN THE FISCAL CONDITION OF THE U.S. GOVERNMENT
 September 2004 AN ANALYSIS OF THE RECENT DETERIORATION IN THE FISCAL CONDITION OF THE U.S. GOVERNMENT Per Capita Net Federal Debt 1998 to 2004* (Actual Debt Compared to CBO January 2001 Forecast) $16,000
Assessing Developments and Prospects in the Australian Welfare State
 Assessing Developments and Prospects in the Australian Welfare State Presentation to OECD,16 November, 2016 Peter Whiteford, Crawford School of Public Policy https://socialpolicy.crawford.anu.edu.au/ peter.whiteford@anu.edu.au
U.S. Debt Tops $20 Trillion - Stocks Soar To Record Highs
 U.S. Debt Tops $20 Trillion - Stocks Soar To Record Highs September 20, 2017 by Gary Halbert of Halbert Wealth Management 1. National Debt Tops $20 Trillion, Equal to 107% of GDP 2. Debt Held by the Public
U.S. Chamber of Commerce Economic Outlook
 U.S. Chamber of Commerce Economic Outlook December 211 Economic Policy Division Real GDP Outlook Percent Change, Annual Rate 2 1 1 - -1 197 197 198 198 199 199 2 2 21 U.S. GDP Actual and Potential Quarterly,
DEFICITS AND DEBT Macroeconomics in Context (Goodwin, et al.)
") Chapter 16 DEFICITS AND DEBT Macroeconomics in Context (Goodwin, et al.) Chapter Overview This chapter expands on the material from Chapter 10, from a less theoretical and more applied perspective. It
Chapter 16 DEFICITS AND DEBT Macroeconomics in Context (Goodwin, et al.) Chapter Overview This chapter expands on the material from Chapter 10, from a less theoretical and more applied perspective. It
Basic information. Tax-to-GDP ratio Date: 24 October 2012
 Federal Department of Finance FDF Federal Finance Administration FFA Basic information Date: 24 October 2012 Tax-to-GDP ratio 2011 The tax-to-gdp ratio is the sum of all taxes and social security levies
DEFICITS AND DEBT Macroeconomics in Context (Goodwin, et al.)
") Chapter 16 DEFICITS AND DEBT Macroeconomics in Context (Goodwin, et al.) Chapter Overview This chapter expands on the material from Chapter 10, from a less theoretical and more applied perspective. It
Chapter 16 DEFICITS AND DEBT Macroeconomics in Context (Goodwin, et al.) Chapter Overview This chapter expands on the material from Chapter 10, from a less theoretical and more applied perspective. It
Households capital available for renovation
 Households capital available for Methodical note Copenhagen Economics, 22 February 207 The task at hand has been twofold: firstly, we were to calculate an estimate of households average capital available
Understanding the National Debt and the Debt Ceiling
 Understanding the National Debt and the Debt Ceiling Introduction On September 8, 2017, Congress passed and President Trump signed into law a temporary suspension of the national debt limit (also known
Fiscal Policy in Japan
 Fiscal Policy in Japan - Issues and Future Directions - Introduction 1.Social security benefits have been increasing every year due to the aging population. 2.With these situations, the public finance
Tax and Revenue Decisions Facing Congress and the President
 Tax and Revenue Decisions Facing Congress and the President Presented for Ecumenical Advocacy Days, March 24, 2012 Steve Wamhoff Citizens for Tax Justice Citizens for Tax Justice is a non-profit organization
Globalization, Inequality, and Tax Justice
 Globalization, Inequality, and Tax Justice Gabriel Zucman (UC Berkeley) November 2017 How can we make globalization and tax justice compatible? One of the most pressing policy questions of our time: Globalization
Growth in OECD Unit Labour Costs slows to 0.4% in the third quarter of 2016
 Growth in OECD Unit Labour Costs slows to.4% in the third quarter of 26 Growth in unit labour costs (ULCs) in the OECD area slowed to.4% in the third quarter of 26 (compared with.6% in the previous quarter)
Is Government the Problem or the Solution to U.S. Labor Market Challenges?
 Is Government the Problem or the Solution to U.S. Labor Market Challenges? Jason Furman Harvard Kennedy School & Peterson Institute for International Economics Federal Reserve Bank of Minneapolis Minneapolis,
When Debt Pushes Back
 IN-D EPTH A NALYSIS OF THE FIXED I NCOME MARKETS George Rusnak, CFA Co-Head of Global Fixed Income Strategy When Debt Pushes Back February 22, 2018 Key takeaways» The rising U.S. federal debt burden now
2. Overall, do you approve or disapprove of the way Barack Obama is handling his job as president? Do you approve/disapprove strongly or somewhat?
 ALLSTATE/NATIONAL JOURNAL HEARTLAND MONITOR POLL X National Sample of 1000 ADULTS AGE 18+ (Margin of Error = +/-3.1% in 95 out of 100 cases) Conducted September 28 th - October 2 nd, 2011 Via Landline
NATIONAL S ECONOMIC ROAD TEST JANUARY 2013 DAVID PARKER, LABOUR FINANCE SPOKESPERSON
 NATIONAL S ECONOMIC ROAD TEST JANUARY 2013 DAVID PARKER, LABOUR FINANCE SPOKESPERSON 1 TABLE OF CONTENTS NATIONAL - MANAGING OUR DECLINE...3 AVERAGE ANNUAL ECONOMIC GROWTH: 1935-2012...3 UNEMPLOYMENT...5
Australian welfare spending trends: past changes and future drivers Brotherhood of St Laurence lunchtime seminar
 Australian welfare spending trends: past changes and future drivers Brotherhood of St Laurence lunchtime seminar John Daley CEO, Grattan Institute 8 August 213 Overview Stable overall spending conceals
Budget repair and the size of Australia s government. Melbourne Economic Forum John Daley, Grattan Institute December 2015
 Budget repair and the size of Australia s government Melbourne Economic Forum John Daley, Grattan Institute December 2015 Budget repair and the size of Australia s government Attitudes to the best approach
1994- Consumer prices
 Experiences in Japan: Case of Inflation Indexed Bonds Yukinobu Kitamura Hitotsubashi University 30 January 2009 First Inflation Indexed Bonds issued in 1742, Massachusetts, USA Global Markets for Inflation
Pension Reforms Revisited Asta Zviniene Sr. Social Protection Specialist Human Development Department Europe and Central Asia Region World Bank
 Pension Reforms Revisited Asta Zviniene Sr. Social Protection Specialist Human Development Department Europe and Central Asia Region World Bank All Countries in the Europe and Central Asia Region Have
Sources of Government Revenue in the OECD, 2017
 FISCAL FACT No. 558 Aug. 2017 Sources of Government Revenue in the OECD, 2017 Amir El-Sibaie Analyst Key Findings: OECD countries rely heavily on consumption taxes, such as the value-added tax, and social
CANADA EUROPEAN UNION
 THE EUROPEAN UNION S PROFILE Economic Indicators Gross domestic product (GDP) at purchasing power parity (PPP): US$20.3 trillion (2016) GDP per capita at PPP: US$39,600 (2016) Population: 511.5 million
THE SEARCH FOR FISCAL SPACE AND THE NEW CHALLENGES TO BUDGETING. 34 th annual meeting of Senior Budget Officials Paris, 3-4 June, 2013
 THE SEARCH FOR FISCAL SPACE AND THE NEW CHALLENGES TO BUDGETING 34 th annual meeting of Senior Budget Officials Paris, 3-4 June, 2013 The overwhelming pressure of fiscal consolidation RPF 2012: 25 out