Economic Competitiveness in the 21 st Century. Port Commerce and Urban Land Use:
|
|
|
- Bridget Jordan
- 6 years ago
- Views:
Transcription


1 Port Commerce and Urban Land Use: Economic Competitiveness in the 21 st Century Adam Davidson, MCP Dr. Jonathan Peters The City University of New York The CUNY Graduate School Dr. Richard Flanagan The College of Staten Island Dr. Cameron Gordon The University of Canberra CMTS/TRB Diagnosing the Maritime Transportation System Conference June 26-28, 2012 Washington, D.C.


2 This research was an outgrowth of a public policy paper sponsored by The Brooklyn Waterfront Research Center based at the New York City College of Technology. The BWRC supports Research, Education and Public Outreach related to waterfront issues in the Borough of Brooklyn.
3 Presentation Overview Existing Conditions SWOT Contested Spaces Policies Questions: Is there room for the maritime industry in Brooklyn? Is the maritime industry still needed in Brooklyn? Why? Brooklyn is part of a large city with an extensive waterfront and storied maritime history Changes in shipping practices led to a disfavor of facilities After years of disinvestment, the waterfront is becoming recognized for its recreational use


4 Old Version


5 The Brooklyn Waterfront Brooklyn is the Coolest City on the Planet: A Nightlife Guide Don't take that as a knock on Manhattan, which is doing just fine. But for the first time since, well, ever, you can spend every New York minute of your trip on the far side of the East River and never feel like you're missing out.
6

7
8 EXISTING CONDITIONS


9
10 A post (?) manufacturing economy In the mid 19th to the first part of the 20th century, Brooklyn developed a number of manufacturing centers and activities including: Ship Building & Repair Chemicals & Dyes Manufacturing That base of jobs remains in some areas, with new growth in housing occurring in many traditional areas of industrial activity.
11 NY City Job Distribution 2003 Number of employees, % DISTRIBUTION WITHIN BOROUGHS BRONX KINGS NEW YORK QUEENS RICHMOND Total Share Total 100% 100% 100% 100% 100% 100% Forestry., Fishing 0% 0% 0% 0% 0% 0% Mining 0% 0% 0% 0% 0% 0% Utilities 1% 2% 0% 1% 1% 1% Construction 4% 5% 2% 9% 8% 3% Manufacturing 3% 8% 2% 8% 2% 4% Wholesale trade 4% 6% 6% 6% 2% 5% Retail trade 8% 12% 6% 11% 18% 8% Transportation & warehousing 2% 3% 1% 13% 5% 3% Information 2% 2% 8% 2% 3% 6% Finance & insurance 1% 4% 16% 3% 4% 11% Real estate & rental & leasing 3% 3% 3% 3% 2% 3% Professional, scientific & technical services 2% 3% 13% 3% 4% 9% Management of companies & enterprises 1% 1% 5% 1% 1% 4% Admin, support, waste mgt, remediation se 4% 5% 7% 5% 6% 6% Educational services 5% 5% 5% 3% 5% 5% Health care and social assistance 54% 32% 11% 20% 27% 19% Arts, entertainment & recreation 1% 1% 3% 1% 1% 2% Accommodation & food services 4% 5% 7% 6% 8% 6% Other services (except public administratio 3% 5% 5% 6% 5% 5% Unclassified establishments 0% 0% 0% 0% 0% 0% 100% 100% 100% 100% 100%
12 But Brooklyn is Short of Jobs LF = 1,055,400 Jobs = 454,096

13 Patchwork of Development The Waterfront has mostly old building stock pockmarked with new luxury development

14 The Brooklyn Waterfront is a major zone for Jobs in the County North & South Brooklyn is key

15


16 Waterfront Changes Columbia St Waterfront ~1982 Brooklyn Bridge Park

17 Brooklyn Bridge Park, Pier 1 Today

18 Container Port Red Hook, Brooklyn

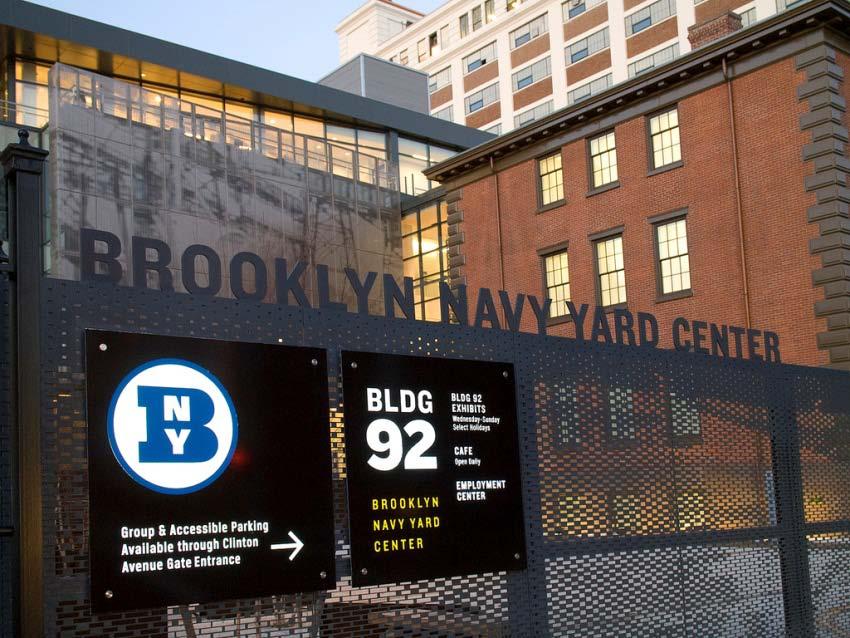
19 Brooklyn Navy Yard 6 Graving Docks 3 Inactive
 Manufacturing Williamsburg,")
20 The Edge Domino Sugar Factory Converted Lofts Utilities/ (vacant) Manufacturing Williamsburg, Brooklyn

21 SWOT
22 Strengths Brooklyn Access to a large population 8 million on Long Island (Brooklyn, Queens, Nassau, Suffolk) East of Hudson (NYC, New England) Naturally large waterfront 520 Miles in NYC Historical land use patterns supportive of maritime-based industry Maritime Generally good paying jobs. Has strong fundamental demand for their services and products. Brooklyn and Staten Island are home to many of the back office operations of the maritime sector in New York City.


23 Weaknesses Brooklyn Limited space for expansion Complicated Zoning Tolling costs for points west Capacity Maritime Significant decline Low labor force needs

24

25
26 Opportunities Brooklyn Access to a large population Underutilized maritime facilities Worker attraction quality of life Maritime Generally good paying jobs Has a very mixed relationship with Regional, State and National Government.
27 Threats Brooklyn Costs Competing residential demand Continual growth in size of ships Maritime Maritime sector Has a very mixed relationship with Regional, State and National Government. LULU

28 Westerhaven- 712 TEU (Launched 2000) Brooklyn Port Commerce of Today 300 to 600 Foot Ships Boxes Vessel type: Gross tonnage: Summer DWT: Length: Beam: Draught: Cargo 7,541 tons 8,430 tons 127 m 20 m 6.6 m

29 CMA CGM L ETOILE TEU (Launched 2010) Vessel type: Gross tonnage: Summer DWT: Length: Beam: Draught: Cargo tons tons 210 m 30.2 m M

30 MOL Innovation 4434 TEU Now APL Tourmaline (Launched 1996) NY/NJ Port Commerce of Today 900 Foot Ships Boxes Vessel type: Gross tonnage: Summer DWT: Length: Beam: Draught: Container Ship 52,086 tons 60,323 tons 293 m 31 m 11.6 m

31 Emma Maersk 14,777 TEU (Launched 2006) Vessel type: Gross tonnage: Summer DWT: Length: Beam: Draught: Container Ship 170,794 tons 156,907 tons 398 m 56 m 11.5 m


32 NY/NJ Port Commerce of Tomorrow 1300 Foot Ships Boxes

33

34 Singapore Port 1200 Acres
35 CONTESTED SPACES

36 Land-side Space Needed for Large-Ship Operations

37 Red Hook Transitioning from this

38 to this: IKEA Parking Lot

39

40

41

42 POLICY
43 Options If we want container ships then we should prepare for the next round of ship technology not what we currently handle either in Brooklyn or in Port Newark/Port Elizabeth. If we want Maritime support/back-office than we need to preserve key assets and prepare to accommodate individual large ships If we want residential/entertainment than we let the highbidder/market and neighborhood concerns take precedence
44 Economic Impacts The creation of new jobs in the transportation sector would have a macroeconomic multiplier effect on the regional economy. That impact can be estimated using Census Bureau Economic Analysis Multipliers for the particular industry. The general range is times the initial job creation as the total impact.
45 Brooklyn Shipbuilding and Water Support Jobs Today 414 Jobs in these sectors Peak (1940 s) Over 10,000 Jobs Macro Effect Roughly 2-3 times initial job impact or 30,000 jobs at peak related to shipbuilding and water support jobs. Historical Changes Loss of Brooklyn Navy Yard as federal facility. Loss of historic shipyard facilities.
46 Port of New York Graving Yards Location Name Status Length Width Active Constructed (Feet) Feet Brooklyn Navy Yard #1 Active Brooklyn Navy Yard #2 Inactive 660? Brooklyn Navy Yard #3 Inactive 450? Brooklyn Navy Yard #4 Inactive 720? Brooklyn Navy Yard #5 Active 1, , Brooklyn Navy Yard #6 Active 1, , IKEA Red Hook - Filled In Total Active Total Graving Linear Feet 4,906 2,464 Percentage Active - Brooklyn 50.2% New Jersey GMD Bayonne - Active 1,092 1,

47 Is Brooklyn Competitive? In 2009, the $71.5 million dollar - five year contract for maintenance of the Staten Island Ferry was won by a firm in Norfork, Virginia. this represents the loss of $180 million dollars in economic activity from NY region GMD Shipyards at the Brooklyn Navy Yard was only 1.35% higher Due to the use of 50% federal funding for the maintenance contract, national bidding was required. Need for regional industries to be truly nationally competitive.
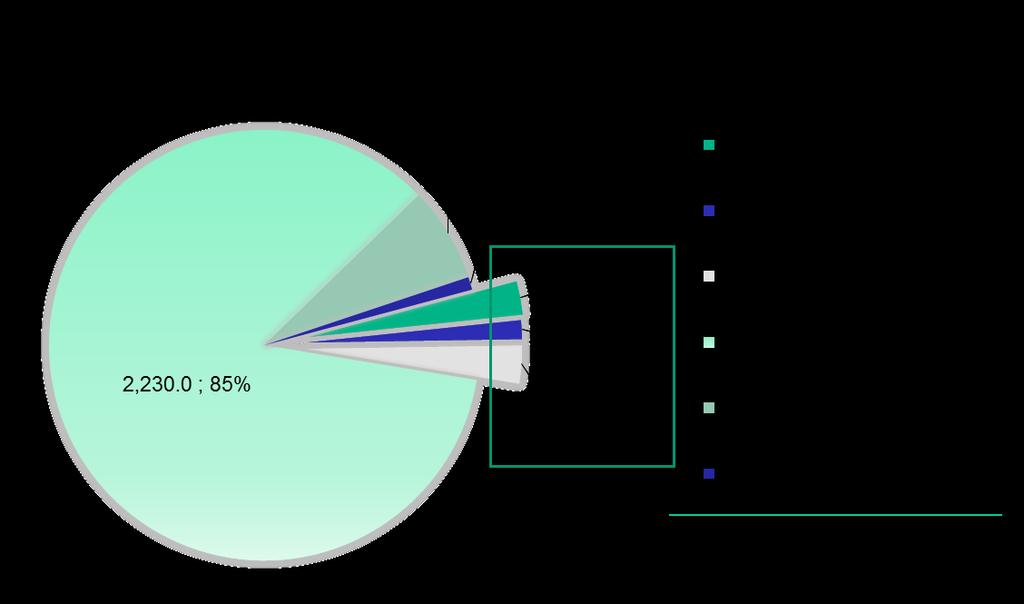
48 Area: Kings County, New York Industry: Ship Building + Water Support Owner: Private Size: All establishment sizes Type: Employees & Total Wages Annual Year Employees Average Total Wages Wage 2010 $ 414 $18,871,380 45,583 Weekly Average Wage $ Kings 449,961 $ 24,017,118,336 $ 53,376 $ 1, Transport 0.09% 0.08% 85.4% 85.4% Multiplier Total Maritime 1,242 $ 56,614,140 $ 136,749 Impact - Kings Navy Yard Peak 10,000 $ 455,830,435 Macro Effect 30,000 $ 1,367,491,304


49 Harmonious Usage?
50 What can be done? Nothing? Let the invisible hand reign? No. There are public policies which can help restore balance to the region s economic growth and development. Infrastructure investments, especially in transportation Coordinated and systematic economic development policies Institutional reforms leading to more equalization of powers and finances across the region. Improved land-use policy Coordination across all policy areas and policy-making bodies.
51 What are the Barriers? Deciding on what issues need to be addressed? Infrastructure? Taxes? Region Development Assistance? Tolls? Congestion? No decision is a decision. Inaction is action.
52 Are there Metrics? Incident Value Value of asset while in use Systemic Value Value to system in robustness/resilience Freight Environment Jobs Congestion Quality of Life Substitution Value What are your alternatives? No decision is a decision. Inaction is action.
Reference Point May 2015
 T. Rowe Price Defined Contribution Plan Data As of December 31, Insights It s evident participants are taking advantage of the loan feature in 401(k) plans. Currently, one-fourth of participants who can
Economic Overview New York
 Report created on October 20, 2015 Economic Overview Created using: Contact: Lisa.Montiel@suny.edu DEMOGRAPHIC PROFILE...3 EMPLOYMENT TRENDS...5 UNEMPLOYMENT RATE...5 WAGE TRENDS...6 COST OF LIVING INDEX...6
The Economic Impact of 9/11 on the New York City Region
 The Economic Impact of 9/11 on the New York City Region Overview Regional Economic Models Inc. (REMI) has developed this comprehensive study evaluating the economic impact of 9/11 on the air industry and
Old Dominion University 2016 Regional Economic Forecast. Strome College of Business
 Old Dominion University 2016 Regional Economic Forecast January 27, 2016 Professor Vinod Agarwal Director, Economic Forecasting Project Strome College of Business www.odu.edu/forecasting 1 Presentation
Community Colleges of Spokane
 Community Colleges of Spokane 501 N Riverpoint Blvd Spokane, Washington 99217 Economy Overview CCS Northern Service Area Economic Modeling Specialists International www.economicmodeling.com Page 1/14 Report
Draft Environmental Impact Statement. Appendix G Economic Analysis Report
 Draft Environmental Impact Statement Appendix G Economic Analysis Report Appendix G Economic Analysis Report Economic Analyses in Support of Environmental Impact Statement Carolina Crossroads I-20/26/126
SKECHERS HERMOSA BEACH DESIGN CENTER & EXECUTIVE OFFICES
 SKECHERS HERMOSA BEACH DESIGN CENTER & EXECUTIVE OFFICES NET FISCAL IMPACT & ECONOMIC BENEFIT ANALYSIS HERMOSA BEACH, CA Prepared For: SKECHERS U.S.A., INC. Prepared By: KOSMONT COMPANIES 1601 N. Sepulveda
Camden Industrial. Minneapolis neighborhood profile. About this area. Trends in the area. Neighborhood in Minneapolis.
 Minneapolis neighborhood profile October 2011 Camden Industrial About this area The Camden Industrial neighborhood is bordered by 48th Avenue North, the Mississippi River, Dowling Avenue North, Washington
Michigan Economic Development Corporation
 Michigan Economic Development Corporation 300 N. Washington Square, Lower Level Lansing, Michigan 48913 888.522.0103 Economy Overview MEDC Region 5 East Central Michigan Economic Modeling Specialists International
The Economic Base of Sandoval County, NM. PREPARED BY: The Office of Policy Analysis at Arrowhead Center, New Mexico State University.
 The Economic Base of Sandoval County, NM PREPARED BY: The Office of Policy Analysis at Arrowhead Center, New Mexico State University DATE: July 2015 The Economic Base of Sandoval County, New Mexico Introduction
The Economic Base of Sandoval County, NM. PREPARED BY: The Office of Policy Analysis at Arrowhead Center, New Mexico State University.
 The Economic Base of Sandoval County, NM PREPARED BY: The Office of Policy Analysis at Arrowhead Center, New Mexico State University DATE: July 2016 The Economic Base of Sandoval County, New Mexico Introduction
Economic Overview Long Island
 Report created on October 20, 2015 Economic Overview Long Island Created using: Contact: Lisa.Montiel@suny.edu DEMOGRAPHIC PROFILE...3 EMPLOYMENT TRENDS...5 UNEMPLOYMENT RATE...5 WAGE TRENDS...6 COST OF
VOLUME FINANCE HOUSING COMMERCIAL REAL ESTATE EMPLOYMENT TRANSIT & TOURISM
 VOLUME 4 2018 EMPLOYMENT FINANCE HOUSING COMMERCIAL REAL ESTATE TRANSIT & TOURISM Published April 2018 VOLUME 4 2018 HIGHLIGHTS Unemployment in New York City remained at a record low in March 2018 Median
University of Minnesota
 neighborhood profile October 2011 About this area The University neighborhood is bordered by 11th Avenue Southeast, University Avenue, 15th Avenue Southeast, the railroad tracks, Oak Street, and the Mississippi
A. INTRODUCTION B. METHODOLOGY
 Chapter 14: Economic Conditions A. INTRODUCTION This chapter evaluates potential effects that the Proposed Project may have on economic conditions. The chapter provides a profile of the current population
EMPLOYMENT COST INDEX MARCH 2011
 Transmission of material in this release is embargoed until 8:30 a.m. (EDT) Friday, April 29, USDL-11-0586 Technical information: Media contact: (202) 691-6199 NCSinfo@bls.gov www.bls.gov/ect (202) 691-5902
PUBLIC DISCLOSURE. October 10, 2006 COMMUNITY REINVESTMENT ACT PERFORMANCE EVALUATION. BPD BANK RSSD No
 PUBLIC DISCLOSURE October 10, 2006 COMMUNITY REINVESTMENT ACT PERFORMANCE EVALUATION BPD BANK RSSD No. 66015 90 BROAD STREET NEW YORK, NEW YORK 10004 Federal Reserve Bank of New York 33 Liberty Street
Economic Impact of The NYC Food Processing and Distribution Center Development Project Prepared for: New York City Regional Center
 Economic Impact of The NYC Food Processing and Distribution Center Development Project Prepared for: New York City Regional Center Prepared by: Michael K. Evans Evans, Carroll & Associates, Inc. 2785 NW
Benchmark Avenue, Fort Myers, FL 33905
 Available October 2017 Benchmark Industrial For Lease 1681-1687 Benchmark Avenue, Fort Myers, FL 33905 Listing ID: 30132311 Status: Active Property Type: Industrial For Lease Industrial Type: Flex Space,
CHAPTER 6. The Economic Contribution of Hospitals
 CHAPTER 6 The Economic Contribution of Hospitals Chart 6.1: National Health Expenditures as a Percentage of Gross Domestic Product and Breakdown of National Health Expenditures, 2014 U.S. GDP 2014 $3.03
B C G H 3 NAIC Group Code Insurer Group Name 3 Total 2016 Policyholder Surplus 4 4 Total 2016 TRIP-Eligible DEP (all lines) Affiliations Page 1 of 19
 Affiliations Page 1 of 19") OMB No. 155257 Expiration: TERRORISM RISK INSURANCE PROGRAM 218 DATA CALL: INSURER (NONSMALL) GROUPS OR COMPANIES INSURER GROUP AFFILIATIONS B C G H 3 NAIC Group Code Insurer Group Name 3 Total 216 Policyholder
OMB No. 155257 Expiration: TERRORISM RISK INSURANCE PROGRAM 218 DATA CALL: INSURER (NONSMALL) GROUPS OR COMPANIES INSURER GROUP AFFILIATIONS B C G H 3 NAIC Group Code Insurer Group Name 3 Total 216 Policyholder
SEPTEMBER 2017 EMPLOYMENT HOUSING REAL ESTATE TRANSIT & TOURISM
 EMPLOYMENT FINANCE HOUSING COMMERCIAL REAL ESTATE TRANSIT & TOURISM HIGHLIGHTS The private sector experienced job losses after three record-setting months of growth Economic expansion accelerated to the
The Economic Base of Curry County, NM. PREPARED BY: The Office of Policy Analysis at Arrowhead Center, New Mexico State University.
 The Economic Base of Curry County, NM PREPARED BY: The Office of Policy Analysis at Arrowhead Center, New Mexico State University DATE: July 2016 The Economic Base of Curry County, New Mexico Introduction
Economic Overview Long Island
 Report created on August 29, 2017 Economic Overview Long Island Contact: Lisa.Montiel@suny.edu DEMOGRAPHIC PROFILE... 3 EMPLOYMENT TRENDS... 5 UNEMPLOYMENT RATE... 5 WAGE TRENDS... 6 COST OF LIVING INDEX...
The Economic Base of San Miguel County, NM. PREPARED BY: The Office of Policy Analysis at Arrowhead Center, New Mexico State University
 The Economic Base of San Miguel County, NM PREPARED BY: The Office of Policy Analysis at Arrowhead Center, New Mexico State University DATE: July 2015 The Economic Base of San Miguel County, New Mexico
The Economic Base of Curry County, NM. PREPARED BY: The Office of Policy Analysis at Arrowhead Center, New Mexico State University.
 The Economic Base of Curry County, NM PREPARED BY: The Office of Policy Analysis at Arrowhead Center, New Mexico State University DATE: July 2015 The Economic Base of Curry County, New Mexico Introduction
Mid - City Industrial
 Minneapolis neighborhood profile October 2011 Mid - City Industrial About this area The Mid-City Industrial neighborhood is bordered by I- 35W, Highway 280, East Hennepin Avenue, and Winter Street Northeast.
2365 Reynolds Ave, North Las Vegas, NV 89030
 10% Down $77 psf 7,072' Medical Office Elevator & Gray Shell 2365 Reynolds Ave, North Las Vegas, NV 89030 Listing ID: 29944110 Status: Active Property Type: Office For Sale Office Type: Business Park,
Small Businesses in Broward There are 33,400 small businesses in Broward County, which provide 135,000 jobs and have a combined payroll of $4 billion.
 Planning Services Division February 2006 Number 43 Small Businesses in Broward There are 33,400 small businesses in Broward County, which provide 135,000 jobs and have a combined payroll of $4 billion.
The Economic Base of Valencia County, NM. PREPARED BY: The Office of Policy Analysis at Arrowhead Center, New Mexico State University.
 The Economic Base of Valencia County, NM PREPARED BY: The Office of Policy Analysis at Arrowhead Center, New Mexico State University DATE: July 2017 DATE: September 2013 The Economic Base of Valencia County,
Shingle Creek. Minneapolis neighborhood profile. About this area. Trends in the area. Neighborhood in Minneapolis. October 2011
 neighborhood profile October 2011 About this area The neighborhood is bordered by 53rd Avenue North, Humboldt Avenue North, 49th Avenue North, and Xerxes Avenue North. It is home to Olson Middle School.
Rhode Island. A publication of the Labor Market Information Unit
 Rhode Island Employment & Wage Analysis 2012 A publication of the Labor Market Information Unit Summary of Findings The annual Rhode Island Employment and Wage Analysis report highlights Rhode Island s
Economic Overview Prince William/Manassas. October 23, 2017
 Economic Overview Prince William/Manassas October 23, 2017 DEMOGRAPHIC PROFILE... 3 EMPLOYMENT TRENDS... 5 UNEMPLOYMENT RATE... 5 WAGE TRENDS... 6 COST OF LIVING INDEX... 6 INDUSTRY SNAPSHOT... 7 OCCUPATION
The Economic Base of Quay County, NM. PREPARED BY: The Office of Policy Analysis at Arrowhead Center, New Mexico State University.
 The Economic Base of Quay County, NM PREPARED BY: The Office of Policy Analysis at Arrowhead Center, New Mexico State University DATE: July 2015 The Economic Base of Quay County, New Mexico Introduction
Economic Overview Fairfax / Falls Church. October 23, 2017
 Economic Overview Fairfax / Falls Church October 23, 2017 DEMOGRAPHIC PROFILE... 3 EMPLOYMENT TRENDS... 5 UNEMPLOYMENT RATE... 5 WAGE TRENDS... 6 COST OF LIVING INDEX... 6 INDUSTRY SNAPSHOT... 7 OCCUPATION
David Muessel, Managing Director Brian T. Leary, Managing Partner
 David Muessel, Managing Director dmuessel@cpexre.com 718-687-4217 Brian T. Leary, Managing Partner bleary@cpexre.com 718-687-4200 New York City 5-Borough Study: Office Sales, 2004-2010 Issue: 3, Summer
2415 Reynolds Ave, North Las Vegas, NV 89030
 7,221' *Reynolds Medical Center* Gray Shell w/ Elevator 89030 2415 Reynolds Ave, North Las Vegas, NV 89030 Listing ID: 29944098 Status: Active Property Type: Office For Sale (also listed as Special Purpose)
The Economic Base of Doña Ana County, NM. PREPARED BY: The Office of Policy Analysis at Arrowhead Center, New Mexico State University.
 The Economic Base of Doña Ana County, NM PREPARED BY: The Office of Policy Analysis at Arrowhead Center, New Mexico State University DATE: July 2017 The Economic Base of Doña Ana County, New Mexico Introduction
2465 Reynolds Ave, North Las Vegas, NV 89030
 12,020' Reynolds Medical & Attorney Build-Out Elevator 89030 2465 Reynolds Ave, North Las Vegas, NV 89030 Listing ID: 29944111 Status: Active Property Type: Office For Sale (also listed as Special Purpose)
City of Utica Central Industrial Corridor ReVITALization Plan Appendix A. Socio-Economic Profile
 City of Utica Central Industrial Corridor ReVITALization Plan Appendix A. Socio-Economic Profile Population Graphic 1 City of Utica Population Change: 1960-2010 Since the 1960s, the population of Utica
Urban Action Agenda Community Profiles COVER TO GO HERE. City of Beacon
 Urban Action Agenda Community Profiles COVER TO GO HERE City of Beacon COMMUNITY OVERVIEW MAP POPULATION & DEMOGRAPHICS Population Basics 2,212 Population (2015) Population Change 2. since 2000 0.5 Square
Cost Estimates for Alternative Tax Exemptions for Some HDFC Coops
 MEMORANDUM Date: December 3, 2015 To: From: Subject: George Sweeting Geoffrey Propheter Cost Estimates for Alternative Tax Exemptions for Some HDFC Coops Introduction The Task Force on City-Owned Property
The Economic Base of Bernalillo County, NM. PREPARED BY: The Office of Policy Analysis at Arrowhead Center, New Mexico State University
 The Economic Base of Bernalillo County, NM PREPARED BY: The Office of Policy Analysis at Arrowhead Center, New Mexico State University DATE: July 2017 The Economic Base of Bernalillo County, New Mexico
The Economic Base of Eddy County, NM. PREPARED BY: The Office of Policy Analysis at Arrowhead Center, New Mexico State University.
 The Economic Base of Eddy County, NM PREPARED BY: The Office of Policy Analysis at Arrowhead Center, New Mexico State University DATE: July 2013 The Economic Base of Eddy County, New Mexico Introduction
Michigan Economic Development Corporation
 Michigan Economic Development Corporation 300 N. Washington Square, Lower Level Lansing, Michigan 48913 888.522.0103 Economy Overview MEDC Region 2 Northwest Michigan Economic Modeling Specialists International
Metropolitan Transportation Authority Proposed Capital Program
 Metropolitan Transportation Authority Proposed 2008-2013 Capital Program Thomas P. DiNapoli New York State Comptroller Kenneth B. Bleiwas Deputy Comptroller Report 11-2008 March 2008 The proposed capital
OCTOBER 2017 EMPLOYMENT HOUSING REAL ESTATE TRANSIT & TOURISM
 EMPLOYMENT FINANCE HOUSING COMMERCIAL REAL ESTATE TRANSIT & TOURISM HIGHLIGHTS Wages increased in September, reversing August declines Consumer spending rose in amid rising wages New residential construction
The Economic Base of Bernalillo County, NM. PREPARED BY: The Office of Policy Analysis at Arrowhead Center, New Mexico State University
 The Economic Base of Bernalillo County, NM PREPARED BY: The Office of Policy Analysis at Arrowhead Center, New Mexico State University DATE: July 2016 The Economic Base of Bernalillo County, New Mexico
Insolvency Statistics in Canada. September 2015
 Insolvency Statistics in Canada September 2015 List of Tables Table 1: Total Insolvencies... 1 Table 2: Insolvencies Filed by Consumers... 2 Table 3: Insolvencies Filed by Businesses... 3 Table 4: Insolvencies
Attachment 1 Harbourfront Centre Map
 Attachment 1 Harbourfront Centre Map Funding: Attachment 2 City of Toronto Support for Harbourfront Centre (2007 2017) Type Annual Amount Comment Capital Allocation No allocation in 2016 as all funding
ECONOMIC ASSESSMENT OF THE BROOKLYN ECONOMY 2017 UPDATE. Submitted by
 ECONOMIC ASSESSMENT OF THE BROOKLYN ECONOMY 2017 UPDATE Submitted by January 2018 Welcome to the Brooklyn Chamber of Commerce s third annual borough wide economic analysis. The Brooklyn Chamber commissioned
Economic Overview Capital District
 August 29, 2017 Economic Overview Capital District Contact: Lisa.Montiel@suny.edu DEMOGRAPHIC PROFILE... 3 EMPLOYMENT TRENDS... 5 UNEMPLOYMENT RATE... 5 WAGE TRENDS... 6 COST OF LIVING INDEX... 6 INDUSTRY
Michigan Economic Development Corporation
 Michigan Economic Development Corporation 300 N. Washington Square, Lower Level Lansing, Michigan 48913 888.522.0103 Economy Overview MEDC Region 3 Northeast Michigan Economic Modeling Specialists International
Preliminary Findings on Innovation District in San Diego
 Preliminary Findings on Innovation District in San Diego Working Package No. 3: S3: Social Innovation and Territorial Milieu Laura Biancuzzo/Luana Parisi PAU unit School of Public Affairs Multidisciplinary
U.S. CAPITAL SPENDING PATTERNS
 Billions of current dollars 2010 Capital Spending Report: U.S. CAPITAL SPENDING PATTERNS 1999-2008 Data in this report are from the Census Bureau s Annual Capital Expenditures Survey (ACES), which collects
The Local Economic Impact of Short Term Rentals in Galveston, Texas
 The Local Economic Impact of Short Term Rentals in Galveston, Texas TXP, Inc. 1310 South 1st Street #105 Austin, Texas 78704 www.txp.com Overview Short term rentals (STR) are an increasingly popular lodging
RESEARCH BRIEF. The State of Industry: County Business Patterns Show Changing Economic Landscape
 RESEARCH BRIEF The : County Business Patterns Show Changing Economic Landscape HARRISBURG The release of the 2015 County Business Patterns from the U.S. Census allows for an opportunity to assess both
For more information on Equalization Rates, see
 Home s The study looks at local tax burdens for homes with 2004 market values of $272,000, $377,000 and $586,000. These are our estimates of the values of homes at the 2 5th, 50 th and 75th percentiles
Economic Overview Loudoun County, Virginia. October 23, 2017
 Economic Overview October 23, 2017 DEMOGRAPHIC PROFILE... 3 EMPLOYMENT TRENDS... 5 UNEMPLOYMENT RATE... 5 WAGE TRENDS... 6 COST OF LIVING INDEX... 6 INDUSTRY SNAPSHOT... 7 OCCUPATION SNAPSHOT... 9 INDUSTRY
METRO COMPARISONS AUSTIN, LOS ANGELES, NEW YORK & SAN FRANCISCO
 METRO COMPARISONS AUSTIN, LOS ANGELES, NEW YORK & SAN FRANCISCO Austin Chamber of Commerce 535 East 5th Street Austin, Texas 78701 Ph. 512.478.9383 austinchamber.com LOS ANGLES, NEW YORK & SAN FRANCISCO
REGIONAL SNAPSHOT. Northern Shenandoah Valley Regional Partnership (NSVRP), Virginia
, Virginia") REGIONAL SNAPSHOT Northern Shenandoah Valley Regional Partnership (NSVRP), Virginia Table of contents 01 Overview 04 Labor force 02 Demography 05 Industry and occupation 03 Human capital 01 overview Northern
REGIONAL SNAPSHOT Northern Shenandoah Valley Regional Partnership (NSVRP), Virginia Table of contents 01 Overview 04 Labor force 02 Demography 05 Industry and occupation 03 Human capital 01 overview Northern
The Economic Base of San Juan County, NM. PREPARED BY: The Office of Policy Analysis at Arrowhead Center, New Mexico State University.
 The Economic Base of San Juan County, NM PREPARED BY: The Office of Policy Analysis at Arrowhead Center, New Mexico State University DATE: July 2015 The Economic Base of San Juan County, New Mexico Introduction
The Economic Base of the Albuquerque, NM, Metropolitan Statistical Area
 The Economic Base of the Albuquerque, NM, Metropolitan Statistical Area PREPARED BY: The Office of Policy Analysis at Arrowhead Center, New Mexico State University DATE: July 2015 The Economic Base of
Description of the Sample and Limitations of the Data
 Section 3 Description of the Sample and Limitations of the Data T his section describes the 2008 Corporate sample design, sample selection, data capture, data cleaning, and data completion. The techniques
American Community Survey 5-Year Estimates
 DP03 SELECTED ECONOMIC CHARACTERISTICS 2012-2016 American Community Survey 5-Year Estimates Supporting documentation on code lists, subject definitions, data accuracy, and statistical testing can be found
American Community Survey 5-Year Estimates
 DP03 SELECTED ECONOMIC CHARACTERISTICS 2012-2016 American Community Survey 5-Year Estimates Supporting documentation on code lists, subject definitions, data accuracy, and statistical testing can be found
American Community Survey 5-Year Estimates
 DP03 SELECTED ECONOMIC CHARACTERISTICS 2012-2016 American Community Survey 5-Year Estimates Supporting documentation on code lists, subject definitions, data accuracy, and statistical testing can be found
American Community Survey 5-Year Estimates
 DP03 SELECTED ECONOMIC CHARACTERISTICS 2012-2016 American Community Survey 5-Year Estimates Supporting documentation on code lists, subject definitions, data accuracy, and statistical testing can be found
American Community Survey 5-Year Estimates
 DP03 SELECTED ECONOMIC CHARACTERISTICS 2012-2016 American Community Survey 5-Year Estimates Supporting documentation on code lists, subject definitions, data accuracy, and statistical testing can be found
American Community Survey 5-Year Estimates
 DP03 SELECTED ECONOMIC CHARACTERISTICS 2012-2016 American Community Survey 5-Year Estimates Supporting documentation on code lists, subject definitions, data accuracy, and statistical testing can be found
American Community Survey 5-Year Estimates
 DP03 SELECTED ECONOMIC CHARACTERISTICS 2012-2016 American Community Survey 5-Year Estimates Supporting documentation on code lists, subject definitions, data accuracy, and statistical testing can be found
American Community Survey 5-Year Estimates
 DP03 SELECTED ECONOMIC CHARACTERISTICS 2012-2016 American Community Survey 5-Year Estimates Supporting documentation on code lists, subject definitions, data accuracy, and statistical testing can be found
American Community Survey 5-Year Estimates
 DP03 SELECTED ECONOMIC CHARACTERISTICS 2012-2016 American Community Survey 5-Year Estimates Supporting documentation on code lists, subject definitions, data accuracy, and statistical testing can be found
American Community Survey 5-Year Estimates
 DP03 SELECTED ECONOMIC CHARACTERISTICS 2012-2016 American Community Survey 5-Year Estimates Supporting documentation on code lists, subject definitions, data accuracy, and statistical testing can be found
American Community Survey 5-Year Estimates
 DP03 SELECTED ECONOMIC CHARACTERISTICS 2012-2016 American Community Survey 5-Year Estimates Supporting documentation on code lists, subject definitions, data accuracy, and statistical testing can be found
American Community Survey 5-Year Estimates
 DP03 SELECTED ECONOMIC CHARACTERISTICS 2012-2016 American Community Survey 5-Year Estimates Supporting documentation on code lists, subject definitions, data accuracy, and statistical testing can be found
American Community Survey 5-Year Estimates
 DP03 SELECTED ECONOMIC CHARACTERISTICS 2012-2016 American Community Survey 5-Year Estimates Supporting documentation on code lists, subject definitions, data accuracy, and statistical testing can be found
American Community Survey 5-Year Estimates
 DP03 SELECTED ECONOMIC CHARACTERISTICS 2012-2016 American Community Survey 5-Year Estimates Supporting documentation on code lists, subject definitions, data accuracy, and statistical testing can be found
American Community Survey 5-Year Estimates
 DP03 SELECTED ECONOMIC CHARACTERISTICS 2012-2016 American Community Survey 5-Year Estimates Supporting documentation on code lists, subject definitions, data accuracy, and statistical testing can be found
American Community Survey 5-Year Estimates
 DP03 SELECTED ECONOMIC CHARACTERISTICS 2012-2016 American Community Survey 5-Year Estimates Supporting documentation on code lists, subject definitions, data accuracy, and statistical testing can be found
American Community Survey 5-Year Estimates
 DP03 SELECTED ECONOMIC CHARACTERISTICS 2012-2016 American Community Survey 5-Year Estimates Supporting documentation on code lists, subject definitions, data accuracy, and statistical testing can be found
American Community Survey 5-Year Estimates
 DP03 SELECTED ECONOMIC CHARACTERISTICS 2012-2016 American Community Survey 5-Year Estimates Supporting documentation on code lists, subject definitions, data accuracy, and statistical testing can be found
American Community Survey 5-Year Estimates
 DP03 SELECTED ECONOMIC CHARACTERISTICS 2012-2016 American Community Survey 5-Year Estimates Supporting documentation on code lists, subject definitions, data accuracy, and statistical testing can be found
American Community Survey 5-Year Estimates
 DP03 SELECTED ECONOMIC CHARACTERISTICS 2012-2016 American Community Survey 5-Year Estimates Supporting documentation on code lists, subject definitions, data accuracy, and statistical testing can be found
American Community Survey 5-Year Estimates
 DP03 SELECTED ECONOMIC CHARACTERISTICS 2012-2016 American Community Survey 5-Year Estimates Supporting documentation on code lists, subject definitions, data accuracy, and statistical testing can be found
American Community Survey 5-Year Estimates
 DP03 SELECTED ECONOMIC CHARACTERISTICS 2012-2016 American Community Survey 5-Year Estimates Supporting documentation on code lists, subject definitions, data accuracy, and statistical testing can be found
American Community Survey 5-Year Estimates
 DP03 SELECTED ECONOMIC CHARACTERISTICS 2012-2016 American Community Survey 5-Year Estimates Supporting documentation on code lists, subject definitions, data accuracy, and statistical testing can be found
American Community Survey 5-Year Estimates
 DP03 SELECTED ECONOMIC CHARACTERISTICS 2012-2016 American Community Survey 5-Year Estimates Supporting documentation on code lists, subject definitions, data accuracy, and statistical testing can be found
American Community Survey 5-Year Estimates
 DP03 SELECTED ECONOMIC CHARACTERISTICS 2012-2016 American Community Survey 5-Year Estimates Supporting documentation on code lists, subject definitions, data accuracy, and statistical testing can be found
American Community Survey 5-Year Estimates
 DP03 SELECTED ECONOMIC CHARACTERISTICS 2012-2016 American Community Survey 5-Year Estimates Supporting documentation on code lists, subject definitions, data accuracy, and statistical testing can be found
Insolvency Statistics in Canada. April 2013
 Insolvency Statistics in Canada April 2013 List of Tables Table 1: Total Insolvencies... 1 Table 2: Insolvencies Filed by Consumers... 2 Table 3: Insolvencies Filed by Businesses... 3 Table 4: Insolvencies
Economic Overview Marlboro County Labor Shed. June 29, 2016
 Economic Overview Marlboro County Labor June 29, 2016 DEMOGRAPHIC PROFILE...3 EMPLOYMENT TRENDS...5 UNEMPLOYMENT RATE...5 WAGE TRENDS...6 COST OF LIVING INDEX...6 INDUSTRY SNAPSHOT...7 OCCUPATION SNAPSHOT...9
White Pine County Economic Overview
 Economic Overview Population (2016) 10,105 Jobs (2016) 4,597 Average Earnings (2016) $65,033 Unemployed (2/2016) 229 GRP (2014) $996,944,330 Exports (2014) $1,789,478,088 Imports (2014) $1,181,738,119
Economic Overview City of Tyler, TX. January 8, 2018
 Economic Overview City of Tyler, TX January 8, 2018 DEMOGRAPHIC PROFILE...3 EMPLOYMENT TRENDS...5 WAGE TRENDS...5 COST OF LIVING INDEX...6 INDUSTRY SNAPSHOT...7 OCCUPATION SNAPSHOT...9 INDUSTRY CLUSTERS...
The Economic Base of the Albuquerque, NM, Metropolitan Statistical Area
 The Economic Base of the Albuquerque, NM, Metropolitan Statistical Area PREPARED BY: The Office of Policy Analysis at Arrowhead Center, New Mexico State University DATE: July 2016 The Economic Base of
BROWARD COUNTY LABOR FORCE
 BROWARD COUNTY LABOR FORCE Broward County s has a workforce of 978,000 people, including 54,000 self-employed. Twenty-three percent of residents commute to a job outside Broward County and five percent
1208 S Eastern Ave, Las Vegas, NV 89104
 Office Medical Veterinarin Signage Frontage Visibility 89104 1208 S Eastern Ave, Las Vegas, NV 89104 Listing ID: 30138546 Status: Active Property Type: Office For Lease Office Type: Governmental, High-Tech
SELECTED ECONOMIC CHARACTERISTICS American Community Survey 5-Year Estimates
 DP03 SELECTED ECONOMIC CHARACTERISTICS 2008-2012 American Community Survey 5-Year Estimates Supporting documentation on code lists, subject definitions, data accuracy, and statistical testing can be found
The Port of Tampa is:
 . Master Plan 2008 The TPA TPA is an independent special district created by the Florida Legislature It is governed by a Board of Commissioners consisting of members appointed by the Governor of Florida,
VOLUME FINANCE HOUSING COMMERCIAL REAL ESTATE EMPLOYMENT TRANSIT & TOURISM
 VOLUME 3 2018 EMPLOYMENT FINANCE HOUSING COMMERCIAL REAL ESTATE TRANSIT & TOURISM Published March 2018 VOLUME 3 2018 HIGHLIGHTS Unemployment in New York City fell to a record low in February 2018 NYC-based