How Will a $15 Minimum Wage Affect Employment in California?*
|
|
|
- Job Cox
- 6 years ago
- Views:
Transcription
1 How Will a $15 Minimum Wage Affect Employment in California?* February 2018 William E. Even Raymond E. Glos Professor of Economics Miami University Oxford, OH evenwe@muohio.edu (513) David A. Macpherson E.M. Stevens Professor of Economics Trinity University One Trinity Place San Antonio, TX dmacpher@trinity.edu (210) Abstract This study uses employment data on California county-industry pairs (CIPs) between 1990 and 2016 to test whether minimum wage increases caused employment growth to slow most in the CIPS with a large share of low wage workers. Evidence supports the hypothesis and we use the estimates to simulate the effect of the current law which will gradually increase the minimum wage to $15.00 in The simulations suggest that the $15.00 minimum could cause a loss of approximately 400,000 jobs in California. Approximately one-half of the job loss is projected to occur in two industries: accommodation and food services, and retail. While the most populated counties of California are expected to incur the largest employment loss in terms of the number of workers, the smaller counties generally experience a larger percentage point loss in employment due to the lower wages and the greater number of workers that would be affected by the minimum wage hike. * Employment Policies Institute provided funding for this research. Conflicts of Interest: The authors declare that they have no conflict of interest. Keywords: minimum wage; employment; California; labor demand; JEL: J23; J30; J38
2 1 Introduction Since 1980, the state of California has passed several minimum wage laws that increased the minimum wage beyond the federal level. Some would suggest that a higher minimum wage could be justified in California because of its relatively high cost of living compared to the typical state. On the other hand, one might be concerned about whether the higher minimum wage in California causes job loss for low skilled workers, and whether the effects differ in the cities where the cost of living and wages are relatively high as compared to rural areas or less expensive cities. This study examines the effect of California s state minimum wage laws since It tests for an effect of a higher minimum wage by examining whether a minimum wage increase is associated with a slowdown in employment growth in county-industry pairs (CIPs) with a greater share of low wage workers. Relying on several different empirical models, our analysis finds that the minimum wage increases that occurred in California over time caused a reduction in employment. Our study simulates the effect of the current law that is scheduled to raise the minimum wage to $15.00 by The simulations suggest that the $15.00 minimum could cause a loss of about 400,000 jobs in California 1. The job loss is not spread evenly. Approximately one-half of the job loss is projected to be in two industries: accommodation and food services, and retail trade. While the most populated counties of California are expected to incur the largest employment loss regarding the number of workers, the smaller counties experience a larger percentage point loss in employment due to the lower wages and the greater number of workers that would be affected by the minimum wage hike. 1 This estimate does not include the job loss in rural areas not included in our analysis.
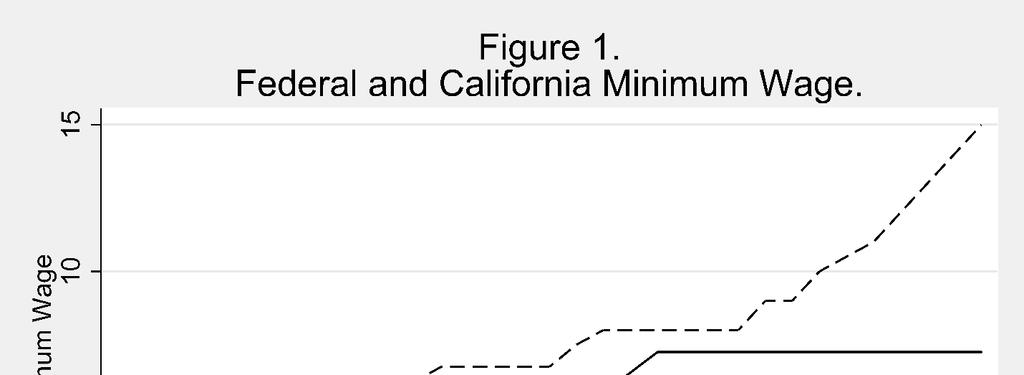
3 2 The Minimum Wage History for the State of California Figure 1 provides a comparison of the federal and California minimum wage from 1990 through For 2018 through 2022, the minimum wages are based on legislation passed as of July The figure shows that beginning in 2001, California began a practice of increasing its minimum wage at a faster rate than mandated by federal law. In 2001, the California minimum exceeded the federal minimum by $1.10 ($6.25 versus $5.15). The gap between the California and federal minimum fluctuated since 2000 as both the state and federal minimum wages increased. As of 2017, California s $10.50 minimum is second only to the $11.00 minimum in the states of Washington and Massachusetts. Moreover, under current law, California s will increase its minimum wage to $15.00 by 2022 while the federal minimum is scheduled to remain at $7.25. If current laws remain in effect, this will make California the first state to have a minimum of $15 and will lead to the largest gap between a state and federal minimum wage in the history of the U.S. 2 This study uses the California experience between 1994 and 2016 as a way to gauge the effect of the upcoming increases in the minimum wage on employment in California. While numerous studies have examined the effect of minimum wage hikes on employment [see Neumark and Washer (2008)l; Congressional Budget Office (2014); and Neumark (2015) for a review of such studies], our study is unique in two ways. First, we focus entirely on the employment experience in California. The labor market in California differs from many other states because of the mixture of rural and urban counties, the mixture of industries, and the large 2 Several cities will have a $15 minimum wage prior to 2022, including Seattle, Los Angeles, San Francisco, New York City, and Washington D.C.
4 3 differences in the cost of living and wages across counties. Second, unlike much of the recent research that estimates the effect of minimum wage hikes by comparing employment trends across states that differ regarding their minimum wage laws, we compare employment growth across county-industry pairs (CIPs) within California to determine the effects. That is, we obtain a measure of the extent to which the minimum wage should be binding in each CIP and test whether a minimum wage increase slows employment growth most where the minimum wage binds the most. The Data To test for differences in employment growth across CIPs, we use data from the Quarterly Census of Employment and Wages (QCEW) between 1990 and the second quarter of The QCEW data provides a quarterly count of employment and payroll reported by employers and covers 98 percent of U.S. jobs. The quarterly counts are available at the county, state, and national levels by industry. The data provide a complete tabulation of employment and total payroll for workers covered by either state or federal unemployment insurance programs. We restrict our analysis to private sector employers. Self-employed workers are not included in the QCEW data. Our analysis of employment trends uses employment by county for each 2-digit NAICS industry. We convert to annual employment measures by averaging across the quarterly employment counts to remove seasonality in the data. Since employment counts are masked for confidentiality reasons when a given county-industry pair (CIP) has a low level of employment, we restrict our analysis to those CIPs that have employment reported in every quarter between 1990 and 2016.
5 4 For our analysis, we need a measure of how much the minimum wage binds in each CIP. The QCEW reports total payroll and the number of workers. Given this aggregate level of data and the lack of information on hours worked, the QCEW earnings data is not suitable for estimating the share of workers earning a wage close to the minimum. To obtain an estimate, we use the Current Population Survey Outgoing Rotation Groups files between 1996 and We estimate the percentage of workers in an industry that we define as low wage workers which we define as anyone earning no more than between $0.25 below the state minimum (in nominal dollars) and $1 above (in 1990 dollars). Unfortunately, the CPS identifies only 31 of the 58 California counties and our analysis is thus restricted to this subset. To help improve the accuracy of our wage estimate for a CIP, we drop any county that contains a city minimum wage law that causes its minimum wage to differ from the California state minimum wage and simultaneously differ within the county. 4 While San Francisco has a minimum wage above the state level, this is a county-wide minimum wage so we include it in our analysis. To assure that our wage estimates for a CIP are reasonably accurate, we exclude any CIP with less than 200 observations on wages in the CPS sample. The sample also excludes any CIP that has incomplete employment data over the sample period. These tend to be relatively small CIPs because the QCEW masks employment counts when there is a concern that disclosing the CIP employment count could reveal too much information about a specific establishment. We also exclude any county when the total employment for the included industries covered less than 3 We choose a starting date of 1996 for the CPS data because the counties identified in the CPS changed in We also had to map census codes for industry to match those in the QCEW and account for the fact that industry codes changed in both the CPS and QCEW over time. 4 This restriction results in Alameda, Contra Costa, and Santa Clara counties being dropped from the sample. The largest cities in these counties are Oakland, Concord, and San Jose, respectively.
6 5 one-half of private sector employment in the county in Finally, we eliminate any CIP that shows more than a 25 percent change in employment between years. Such changes are clear outliers in the data and may reflect changes in reporting behavior by a firm that has multiple establishments. 5 Table 1 provides a list of the 24 counties that fit our requirements for inclusion along with the employment level in each county. In total, there are 11.2 million private sector wage and salary workers in the 24 counties included. Because we drop CIPs that have missing data on employment in any year between 1994 and 2016, we lose some CIPs. Nevertheless, 90.5 percent of the private sector employment in these 24 counties is covered in our sample, and it represents 72.0 percent of statewide private sector wage and salary employment. While a large share of employment is included in our sample, the exclusion restrictions admittedly result in small rural counties being underrepresented since data is more likely to be suppressed when employment counts are low. Table 2 provides a list of the industries that we include in the sample, the number of counties with adequate employment data for each industry, and the share of state-wide employment covered in our sample. The industries that are included in our sample employed 13.8 million workers in California in Our sample includes 73.7% of statewide employment in these industries. The industries with the highest share of state-wide employment covered by our sample are those that have sufficient data to be covered by a large number of counties. 5 The Bureau of Labor Statistics points out that, in the QCEW, large month-to-month changes in employment could reflect changes in employer reporting practices at the beginning of a new calendar year. For example, an employer might have multiple locations in the state may report as a single corporation. In a subsequent reporting period, the company may change their method of reporting leading to a large change in employment. This issue is discussed on the BLS website at
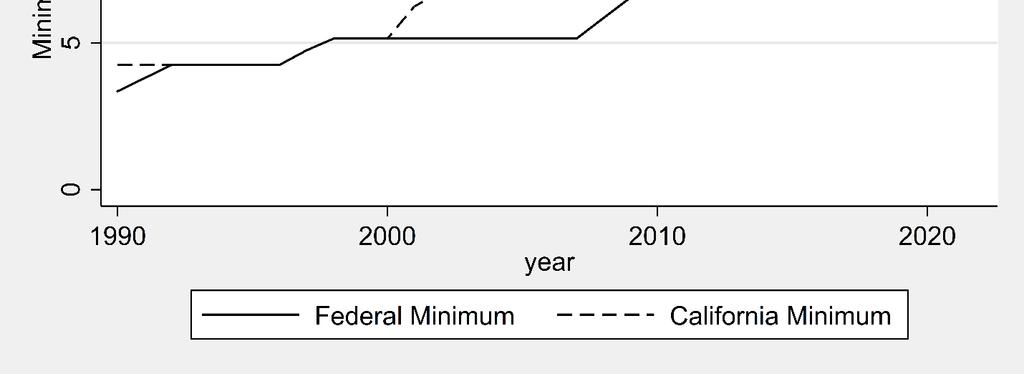
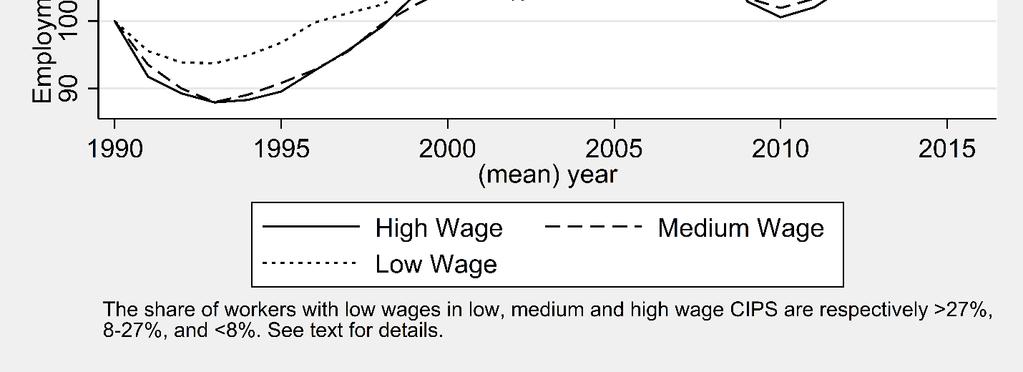
7 6 Figure 2 describes the variation in the share of workers earning low wages across CIPs. For each industry, the figure shows the minimum, maximum, and average share of workers with low wages across counties. The two industries with the largest share of low wage workers are accommodation and food services (55% low wage) and agriculture, forestry, fishing and hunting (46 percent low wage). At the other extreme, the two industries with the lowest share of workers earning low wages are utilities, and finance and insurance (both at 5 percent). Within a given industry, there is a substantial variation in the share of workers earning low wages across counties. For example, in accommodation and food services, the share ranges from 36 to 74 percent; in agriculture, the range is from 24 to 61 percent. As a result, the extent to which a minimum wage increase binds will vary substantially across both counties and industries. Empirical Approach Our empirical approach for determining the effect of the California minimum wage hikes uses regression analysis to determine whether increases in the state minimum wages cause employment to rise more slowly in CIPs where the minimum wage binds more and affects more workers. To provide some context for the analysis, Figure 3 provides an illustration of employment trends for low, medium, and high wage CIPs. The split between the three wage levels is based on the percentage of workers earning low wages. The CIPs in the bottom quartile in terms of the fraction of workers earning low wages (i.e., less than 8% earning low wages) are classified as high wage CIPs. Those in the top quartile of the distribution -- with more than 27% of workers
8 7 earning low wages --are classified as low wage CIPs. The CIPs that are neither in the top or bottom quartile (i.e., between 8 and 27% earning low wages) are classified as medium wage industries. The employment measure is an index set to 100 in Based on the information provided, employment since 1990 grew by 37, 18, and 15 percent in low, medium, and high wage CIPS since This evidence alone might lead one to erroneously conclude that California s minimum wage increases have not slowed (and perhaps increased) employment in low wage industries. Such a conclusion would be inappropriate since other economic factors may have caused the employment trends to differ across high, medium and low wage CIPs. For example, there may be economic forces at work (such as import competition, technical change [Baily and Bosworth (2014); Autor and Dorn (2013)] that cause industries to grow at different rates. For example, increased import competition and technological change have led to declines in U.S. manufacturing employment [Autor et al. (2013, 2015); Pierce and Schott (2016)]. In our data, manufacturing is always either a high or medium wage industry in all counties. In no county is manufacturing a low wage industry. Consequently, import competition and/or technological may have caused employment growth to slow in high and medium wage industries. A failure to account for such industry-specific trends would lead to a misinterpretation of the data. Another important factor that needs to be considered in comparing employment growth across CIPs is that some counties are growing at a faster rate than others. More rapid growth in low-wage counties (e.g., rural counties) could lead to a higher rate of employment growth in the low-wage CIPs.
9 8 Given that many factors other than the minimum wage can cause employment growth to differ across CIPs, we use regression methods to control for these factors and attempt to isolate the effect of minimum wage increases on employment. In our first empirical specification, we assume that a change in the minimum wage will lead to a change in the level of employment at the time of passage and control for other factors that would influence employment such as county-specific unemployment rates, time trends, and fixed effects. The identifying assumptions implicit in each model depends on the specific controls included. In the first specification, we estimate 1 lmin urate The subscript i indexes county, j indexes industry, and t is year. The coefficient of interest is that measures the effect of the natural log of the minimum wage (lminit) interacted with the fraction of workers earning low wages in CIP ij (low_wageij ) The expectation is that minimum wages will have a larger negative employment effect in the industries that employ a larger share of low wage workers and thus, we expect to be negative. The validity of the estimates of the minimum wage effect hinges on the model s ability to control for other factors that influence employment in each CIP. This specification controls for several different types of variables that might have an employment effect. First, cyclical effects are controlled for by the county-specific unemployment rate (urateit). Note also that the model allows the cyclicality of employment ( to differ across industries. For example, during a recession, employment in health services tends to fall less than that in manufacturing since health
10 9 spending is less cyclical. The year-specific time effects ( capture the effect of any year specific shock that has a common effect across all CIPs. The model also includes countyspecific time trends (, and industry-specific time trends (. County-specific time trends capture the effect of, for example, differential population growth across counties. Industryspecific time trends capture the effect of factors that are causing employment in a given industry to share a common trend across all counties. For example, increased import competition may cause employment in manufacturing to gradually fall across all counties. The CIP-specific effects ( capture the effect of variables influencing employment that are fixed over time in a CIP. For example, differences in population, geography, or natural resources might cause a specific industry to have unusually high or low employment in a county over time. For example, being located near an interstate highway system might lead to more employment in transportation; fertile land could lead agricultural employment to be high. While this model contains only two observable variables as controls, it controls for unobserved factors that lead to a county-specific time trend, industry-specific time trend, or a CIP-specific fixed effect. We also consider models that include more flexibility in terms of controlling for unobservables. While these models are less restrictive and less likely to result in biased estimates of the minimum wage effect, they come at the expense of introducing more collinearity between the control variables and the variable of interest (lmin * low_wage) which may reduce the precision of our estimated coefficient of interest. In the extreme, if we add a year specific fixed effect for each CIP, there would be perfect collinearity between our variable of interest (lmin * low_wage) and the fixed effects and it would be impossible to identify any effect of the minimum wage on employment.
11 10 In the second model, we replace county-specific time trends with county-specific year effects. County-specific year effects capture the effect of any year-specific shock to a county that affects employment in all industries. This model provides more flexibility than the countyspecific time trends in our first specification. In the third model, we adjust the second model by dropping industry-specific time trends and replace them with CIP-specific time trends. This model allows, for example, a different time trend for manufacturing in each county. In the final model, we include both industry-specific and county-specific year effects, in addition to CIP specific fixed effects. Table 3 presents estimates of our four specifications of the empirical model. The standard errors are corrected for clustering by CIP. The models are estimated with weighting by CIP employment levels. In all four specifications, there is a statistically significant (at.01 level) negative effect of minimum wages that is greatest in low wage industries. The range of estimated effects of lmin* low_wage across the four specifications is from to The standard error of the estimated coefficient is largest in the final model, but this is also the model where the estimated effect of the minimum is greatest. An important concern with any empirical model is its robustness. We tested the model s robustness to several changes. First, we examined whether the model s results were being driven by outliers in the data. To find outliers, we examined whether the coefficients changed sharply by eliminating any given CIP, industry, or county. We discovered that manufacturing in Los Angeles (LA) County had an especially strong impact on the estimated effect of the minimum in some specifications. More careful examination of the data revealed that manufacturing in LA county had a more rapid downward trend than any other county in the state, that it was also the county with the highest share of low-wage workers in manufacturing, and is the county with the
12 11 highest level of manufacturing employment. The combination of these facts causes the estimated effect of the minimum wage to be less negative when LA county manufacturing is removed from the data. Since we are uncomfortable with LA manufacturing having such a large effect on the estimates, we also present results with LA county manufacturing removed from the data. The coefficient estimates are substantially reduced in three of the four specifications, remain negative in all four specifications, but become statistically insignificant (at the.10 level) in the fourth specification which arguably has the highest degree of collinearity. In specification 3, the exclusion of LA manufacturing has little effect on the estimated minimum wage effect. This result is to be expected since this specification allows for a CIP specific time trend which allows LA manufacturing to have a different time trend than the manufacturing industries in other counties. As a second check for robustness, we considered different start dates for the estimation. As noted by Neumark et al. (2014), the estimate of time trends can be sensitive to the endpoints in the data and can significantly alter the estimated effect of a minimum wage particularly if the endpoints include a point where the economy is in recession and the sample period is short. In our case, we have 27 years of data and the economy is not in recession in Nevertheless, we considered the sensitivity of our results to alternative start dates. The results (available in appendix table A2) indicate that of the 12 different sets of estimates (four regression specifications times three different starting points), all 12 of the coefficient estimates are negative, and 11 of the 12 are statistically significant at the.05 level. It is worth noting that the statistically insignificant results only occur when the start year is pushed to This is the shortest sample period considered and also eliminates a very large increase in the minimum wage that occurred in 1998.
13 12 If LA county manufacturing is removed from the sample due to its unusually large influence on some of the estimates, all 12 coefficient estimates remain negative though they achieve statistical significance (at the.05 level) in only 7 of the 12 models. The first two specifications (which have less flexibility and less collinearity) are, however, much more stable across all variations considered whether LA county manufacturing is excluded or the starting year is varied. This finding is not surprising as the third and fourth specifications have more collinearity (and flexibility in fitting in the data) and this makes results more sensitive to changes in the data sample. As yet another test of robustness, we consider the methodology proposed by Meer and West (2016). Their method was designed to address the possibility that a change in the minimum wage would affect the rate of growth in employment instead of a shift in the intercept. The Meer-West approach is to use long-differences to estimate the effect of minimum wage hikes. The specification is 2 lmin low_wage Where is a difference operator. For example, is the r-period change in logemployment that occurs between period (t-r) and t. We estimate this long difference corresponding to the four specifications in our earlier regression models, keeping in mind that when differencing across time, for example, CIP-specific fixed effects difference out of the model. Similarly, when differencing across time, an industry-specific time trend becomes an industry-specific fixed effect, and a county-specific time trend becomes a county-specific fixed effect.
14 13 The estimates of the Meer-West model are in table 4. The estimated models correspond to the time-differenced versions of the four specifications in our earlier analysis of employment levels. In the first four specifications, all observations are included and we present results for the 5-year time difference. In all four specifications, the coefficient estimates imply a statistically significant (at.01 level) negative effect of minimum wage increases on employment growth. We also considered shorter and longer time differences. For most specifications considered, the effects were statistically significant for both shorter and longer time differences. 6 Time-differenced models were also estimated with LA county manufacturing excluded. These are shown in the lower panel of table 4 for a five-year time difference. The first three specifications all yield statistically significant negative minimum wage effects, though the fourth specification is statistically insignificant at the.10 level with a coefficient that is less than onehalf of that found in the other three specifications. Finally, to assure that the minimum wage effects estimated are not capturing some omitted factor, we examine whether leading and lagging values of the minimum explain employment. If leading values explain employment, one might be concerned that the model is capturing a spurious relationship between the minimum and employment levels. Alternatively, it might be that employers begin reducing low wage employment in anticipation of the minimum wage rising. Table 5 provides estimates of the same models used in table 3, but adds a one year lead and lag of lmin* low_wage to the model. In the model including all CIPs, the lagged value of the minimum wage has a statistically significant negative effect for all four specifications, the contemporaneous minimum wage is never statistically significant, and the leading value is never 6 The one exception was the fourth specification where the results were statistically significant only for time differences of 5 years or more.
15 14 statistically significant at the.05 level. 7 When the LA county manufacturing CIP is excluded, the lagged minimum is significant at.05 level in all four models. The leading and contemporaneous effects of the minimum are small and never significant at the.05 level. In review, we have considered numerous regression models to estimate the effect of minimum wage increases on employment. We find some evidence that the negative effects of the minimum wage are much larger with the inclusion of the LA county manufacturing CIP. Nevertheless, after excluding this CIP, most specifications still yield statistically significant (but smaller) negative effects. The most sensitive specifications tend to be those with the most collinearity which leads to less identifying variation in the minimum wage variable. The results are fairly similar in magnitude whether we use employment levels or time-difference the data. We also find little evidence that leading values of the minimum wage explain changes in employment. While we consider the results quite robust to alternative specifications, we think it is important to note that, given the high degree of flexibility (and thus collinearity) in the models, the estimates can be fairly sensitive to changes in controls and/or time periods. Nevertheless, we believe that the bulk of the evidence points toward substantial negative effects of California minimum wage increases on employment particularly in low wage industries. We turn to the size of these effects in the next section. To put our range of estimated minimum wage employment effects in perspective, a coefficient of -1 on lmin* low_wage implies that, in an industry where 50% of the workers are paid within $1 of the minimum wage (in 1990 dollars), a 10% increase in the minimum causes a 5% decrease in employment. For the average CIP in our sample, the proportion of workers 7 The leading value is statistically significant at the.10 level in one of the four specifications.
16 15 with low wages is.21. As a consequence, our estimated coefficient of from our preferred specification (2) with LA county manufacturing excluded implies that a 10% increase in the minimum wage reduces employment in the average industry by 1.9%. This translates into a minimum wage elasticity of for all workers. Other studies find a wide range of estimated minimum wage elasticities. For example, the CBO (2014) reports a range of 0 to for teenagers, and 0 to for adults. Meer and West (2016) report a minimum wage elasticity of -.08 for all workers. More recently, Jardim et al. (2017) summarize a series of studies for the restaurant industry with elasticities ranging from 0.02 to -0.24, though they argue that most previous studies underestimate the elasticities and that the restaurant industry may have a lower elasticity than others. Their analysis of the 2016 Seattle Washington minimum wage increase estimates a minimum wage elasticity of to for all workers. 8 Overall, our estimated elasticity of for all workers fits within the bounds of earlier studies. It is important to note, however, that these elasticities are not entirely comparable because the studies differ regarding the industries examined, the size of the minimum wage hike, and the fraction of workers impacted by the minimum wage increase. Simulations of Employment Loss from a $15 Minimum Wage California s minimum wage is scheduled to rise from $10.50 in 2017 to $11.00 in 2018, and then increase $1 per year until it reaches $15 in In this section, we use our earlier econometric estimates to simulate how many jobs would be lost as a result of this increase. To 8 While the range of elasticities is to for all workers, this translates into an elasticity -2.7 to -3.5 for workers who are directly affected by the minimum wage.
17 16 perform the simulation, we estimate the effect of switching to $15 in the 2016 labor market. Since wages will grow over time, we convert the 2022 minimum of $15 into 2016 dollars by assuming that prices will grow at 2.2% per year, which is consistent with the CBO forecast for 2016 to We then use the second specification from table 3 that excluded the LA county manufacturing sector to simulate employment loss. This is accomplished by estimating the change in the log of employment that would occur if the minimum wage is increased from the 2016 value of $10.00 (except in San Francisco county where it was $12.25 until July 2016). We then convert the estimated change in log-employment into the change in the level of employment. The results of this simulation are presented by industry in table 6. In total, we estimate that raising the minimum wage to $12.88 (the real equivalent of $15 in 2022) will result in a loss of 398,228 jobs in the CIPs included in our sample. This represents 4.1% of the employment in the included CIPs. As a percentage of employment, the estimated job loss is greatest in the two industries with the largest share of low-wage workers agriculture, forestry and fishing; and accommodation and food services. In these industries, we project 10.7 and 9.5 percent of jobs will be eliminated as a result of a $15 minimum. The size of the predicted job loss is greatest in accommodation and food services (123,000) and retail trade (77,000). These two industries account for half of the predicted job loss in our sample of CIPs. These simulations are based on what we consider to be the most robust and parsimonious regression model. As we noted, however, the empirical estimates are somewhat sensitive to the types of controls included and the starting point for the sample period. In all, we estimated 24 different specifications of the employment regression (4 different sets of controls x 3 different 9 Congressional Budget Office,
18 17 starting years x 2 samples that either include or exclude LA county manufacturing). Averaging across these 24 different specifications results in a slightly larger job loss of 445,000. Summary and Conclusions This study uses California employment data from 1990 through 2016 to test whether the state s minimum wage increases over the past 25 years have led to the loss of low-wage jobs. Our empirical approach identifies the effects of minimum wage increases by comparing the evolution of employment across county-industry pairs (CIPs). We find fairly robust evidence that, when the minimum wage increases, employment growth is slowed in low-wage relative to high-wage CIPs. While our models are parsimonious in terms of our ability to control for observed economic conditions, our models allow for a variety of different types of fixed effects and/or time trends that control for any common shocks that impact all industries across counties, or all industries within a county. We also examined the data for outliers that might have unusually large effects on our estimates. Across a wide range of specifications, we find statistically significant negative effects of the California minimum wage increases on employment growth particularly in low-wage industries. We admit, however, that if we expand the list of controls to the point of having a highly saturated model, the estimates become statistically insignificant. We do not view these insignificant results as evidence against a minimum wage effect. Rather, we believe that if an empirical model includes large numbers of fixed effects there is too much collinearity in the model and too little identifying variation left to identify the effect of minimum wage movements. Our preferred estimates, which exclude Los Angeles county manufacturing as an outlier, suggest that a 10% increase in the minimum wage would lead to a 4.5% reduction in
19 18 employment in an industry if one-half of its workers earn low-wages. We use these estimates to simulate the number of jobs that would be lost for the CIPs included in our sample if the minimum wage is increased to $15 in Our results suggest that approximately 400,000 jobs would be lost in the CIPs included in our sample. This represents about a 4.1% reduction in employment. Approximately one-half of the job loss occurs in accommodations and food services, and retail trade. While our model provides fairly convincing evidence that minimum wage increases cause job loss, it s important to note that it is based on historical data and that the models assume that the only factor that determines the response of an industry to a minimum wage hike is its share of low wage workers. In reality, the response elasticities of firms to minimum wage hikes will depend on factors such as their ability to replace labor with capital, or labor s share of the firm s total cost. The easier it is to substitute capital for labor and the more labor intensive the firm is, the greater the expected response to a change in the minimum wage. Moreover, a firm s ability to pass on the cost of a minimum wage hike may vary over time as new technologies are developed. As a result, our estimates should be considered with some caution given the simplifying assumptions of our model. Nevertheless, we feel that our estimates of job loss are consistent with the employment loss associated with previous minimum wage increases in California.
20 19 References. Autor, DH, and Dorn, D (2013) The growth of low-skill service jobs and the polarization of the US labor market. American Economic Review 103(5): Autor, DH, Dorn, D, and Hanson, GH (2013) The China Syndrome: local labor market effects of import competition in the United States. American Economic Review 103 (6): (2015) Untangling trade and technology: evidence from local labor markets. The Economic Journal 125 (584): Baily, MN, and Bosworth, BP (2014) U.S. manufacturing: understanding its past and its potential future. The Journal of Economic Perspectives 28(1): 3-25 Congressional Budget Office (2014) The effects of a minimum-wage increase on employment and family income. Congressional Budget Office, Washington DC. Jardim, E, Long, MC, Plotnick, R, Inwegen, EV, Vigdor, J, and Wething, H (2017) Minimum wage increases, wages, and low-wage employment: evidence from Seattle. NBER Working Paper Number 23552, June Pierce, JR, and Schott, PK (2016) The surprisingly swift decline of US manufacturing employment. American Economic Review 106 (7): Meer, J, and West, J (2016) Effects of the minimum wage on employment dynamics. Journal of Human Resources 51(2): Neumark, D (2015) The effects of minimum wages on employment. FRBSF Economic Letter December 21, , Salas, JMI, and Wascher, W (2014) Revisiting the minimum wageemployment debate: throwing out the baby with the bathwater? Industrial and Labor Relations Review 67(3): , and Wascher, W (2008) Minimum wages. Cambridge, MA: MIT Press.
21 20
22 21
23 22
24 23 Table 1. Counties Included in Analysis. County County FIPS Code 2016 Employment Covered by Industries with complete data Total County Employment in 2016 Share of 2016 employment covered in data. for Butte 7 51,800 64, % El Dorado 17 21,196 42, % Fresno , , % Kern , , % Los Angeles 37 3,665,722 3,756, % Merced 47 32,320 57, % Monterey , , % Orange 59 1,352,394 1,397, % Placer 61 89, , % Riverside , , % Sacramento , , % San Bernardino , , % San Diego 73 1,085,212 1,167, % San Francisco , , % San Joaquin , , % San Luis Obispo 79 82,302 93, % San Mateo , , % Santa Barbara , , % Solano 95 44, , % Sonoma , , % Stanislaus , , % Tulare , , % Ventura , , % Yolo ,136 67, % All Included Counties 10,165,508 11,235, % California 14,126, %
25 24 Table 2. Industries Covered in Analysis. 1 Industry NAICS Code Number of Counties 2016 Covered Employment Total Average share of county employment in 2016 Covered Employment Share of State Employment Total 2016 State Employment Total Agriculture, Forestry, Fishing and , % 408,690 Hunting 11.2% Utilities , % 25.03% 58,578 Construction , % 50.85% 752,044 Manufacturing , % 74.98% 1,291,140 Wholesale Trade , % 69.82% 713,060 Retail Trade ,342, % 81.46% 1,647,523 Transportation and Warehousing , % 61.25% 496,663 Information , % 54.12% 515,558 Finance and Insurance , % 77.48% 537,898 Real Estate and Rental and Leasing , % 80.47% 272,963 Administrative and Support and Waste Management and Remediation Services ,621, % 71.48% 2,268,315 Educational Services , % 70.83% 307,270 Health Care and Social Assistance ,155, % 80.97% 2,661,619 Arts, Entertainment, and Recreation , % 73.90% 292,972 Accommodation and Food Services ,294, % 82.38% 1,571,030 Total 10,165, % 13,795, Employment counts are for the counties included in the analysis. See table 1 for list of counties data is based on January through June of 2016 data.
26 25 Table 3. Estimates of Employment Effects of Minimum Wage Increase. a All Observations (1) (2) (3) (4) Log(minimum wage)* Low wage share b *** *** *** *** (0.315) (0.345) (0.177) (0.549) Observations 6,345 6,345 6,345 6,345 Number of county-industry groups Within Group R Overall Adjusted R Excluding Los Angeles Manufacturing (1) (2) (3) (4) Log(minimum wage)* Low wage share b *** *** *** (0.299) (0.325) (0.174) (0.545) Observations 6,318 6,318 6,318 6,318 Number of county-industry groups Within Group R Overall Adjusted R Year Effects? Yes No No No County-Specific Effects? Yes No No No County-Specific Year Effects? No Yes Yes Yes County-Industry Specific No No Yes No Time Tend? Industry-Specific Year No No No Yes Effects? Industry-Specific Time Yes Yes No No Trend? Industry-Specific Unemployment Rate Effects? Yes Yes Yes No
27 26 Table 4. Estimated Effects of Minimum Wage on Employment Growth with Year Effects a All Observations (1) (2) (3) (4) (lmin * low wage share) b *** *** *** ** (0.201) (0.198) (0.214) (0.433) Observations 4,935 4,935 4,935 4,935 Number of county/industry cells Overall R Excluding Los Angeles Manufacturing (lmin * low wage share) b *** *** *** (0.208) (0.201) (0.208) (0.419) Observations 4,914 4,914 4,914 4,914 Number of county/industry cells Overall R Year Effects? Yes No No No County-Specific Effects? Yes No No No Industry-Specific Effects? Yes Yes No No Industry-Specific Unemployment Yes Yes Yes No Rate Effects? County-Specific Year Effects? No Yes Yes Yes County-Industry Effects? No No Yes No Industry-Specific Year Effects? No No No Yes a Dependent variable is five year change in log(employment). The sample is restricted to years 1996 forward. The sample is restricted to counties and industries described earlier. Standard errors are in parentheses and based on standard errors corrected for clustering by CIP. *, **, and *** indicate significance levels of.1,.05 and.01, respectively. b Low wage share is the percentage of workers in the county-industry cell earning between $0.25 less than the minimum wage and less than or equal to $1 in $1990 above the minimum wage. The change operator represents a 5-year time difference.
28 27 Table 5. Estimates of Employment Effects of Minimum Wage Increase with Leads and Lags. a All Observations (1) (2) (3) (4) Log(minimum wage)* Low wage share (t+1) * (0.404) (0.439) (0.227) (0.581) Log(minimum wage)* Low wage share(t) b (0.254) (0.278) (0.108) (0.485) Log(minimum wage)* Low wage share (t-1) *** *** *** *** (0.294) (0.303) (0.218) (0.522) Observations 6,345 6,345 6,345 6,345 Number of county-industry groups Within Group R Overall Adjusted R Excluding Los Angeles Manufacturing (1) (2) (3) (4) Log(minimum wage)* Low wage share (t+1) (0.405) (0.428) (0.216) (0.484) Log(minimum wage)* Low wage share(t) b * (0.251) (0.267) (0.108) (0.478) Log(minimum wage)* Low wage share (t-1) ** ** *** ** (0.298) (0.299) (0.215) (0.582) Observations 6,318 6,318 6,318 6,318 Number of county-industry groups Within Group R Overall Adjusted R Year Effects? Yes No No No County-Specific Effects? Yes No No No County-Specific Year Effects? No Yes Yes Yes County-Industry Specific Time Tend? No No Yes No Industry-Specific Year Effects? No No No Yes Industry-Specific Time Trend? Yes Yes No No Industry-Specific Unempl. Rate Effects? Yes Yes Yes No a Sample is restricted to counties and industries described earlier. Standard errors are in parentheses and based on standard errors corrected for clustering by CIP. *, **, and *** indicate significance levels of.1,.05 and.01, respectively. b Low wage share is the percentage of workers in the county-industry cell earning between $0.25 less than the minimum wage and less than or equal to $1 in $1990 above the minimum wage.
29 28 Table 6. Changes in Employment by Industry. a NAICS Code Levels Job loss from $15 minimum Covered Employment in 2016 Percent Job loss from $15 minimum Agriculture, Forestry, Fishing and Hunting 11-25, , % Utilities , % Construction 23-7, , % Manufacturing , , % Wholesale Trade 42-15, , % Retail Trade ,529 1,342, % Transportation and Warehousing , , % Information 51-4, , % Finance and Insurance 52-3, , % Real Estate and Rental and Leasing 53-4, , % Administrative and Support and Waste Management -40,823 1,621, % and Remediation Services 56 Educational Services 61-4, , % Health Care and Social Assistance 62-58,702 2,155, % Arts, Entertainment, and Recreation 71-10, , % Accommodation and Food Services ,850 1,294, % Total -398,228 9,805, % a The simulated job loss assumes an increase in the minimum wage to $15.00 in 2022 dollars (or $12.88 in 2016 dollars). The employment levels simulations are based on the Table 3 model excluding Los Angeles manufacturing with countyspecific year effects, industry-specific time trends, and industry-specific unemployment rate effects. The job loss projections are for the CIPs included in our sample.
30 29 Appendix Table A1. Federal and California State Minimum Wage Year Federal Minimum Wage California Minimum Wage a 1939 $0.25 $ $0.40 $ $0.40 $ $0.40 $ $0.40 $ $0.40 $ $0.40 $ $0.40 $ $0.40 $ $0.40 $ $0.40 $ $0.75 $ $0.75 $ $0.75 $ $0.75 $ $0.75 $ $0.75 $ $0.75 $ $1.00 $ $1.00 $ $1.00 $ $1.00 $ $1.00 $ $1.15 $ $1.15 $ $1.15 $ $1.15 $ $1.15 $ $1.15 $ $1.40 $ $1.60 $ $1.60 $ $1.60 $ $1.60 $ $1.60 $ $1.60 $ $2.10 $ $2.30 $ $2.30 $ $2.65 $ $2.90 $ $3.10 $ $3.35 $ $3.35 $ $3.35 $ $3.35 $3.35
31 30 Appendix Table A1. Federal and California State Minimum Wage 1985 $3.35 $ $3.35 $ $3.35 $ $3.35 $ $3.35 $ $3.35 $ $3.80 $ $4.25 $ $4.25 $ $4.25 $ $4.25 $ $4.25 $ $4.75 $ $5.15 $ $5.15 $ $5.15 $ $5.15 $ $5.15 $ $5.15 $ $5.15 $ $5.15 $ $5.15 $ $5.15 $ $5.85 $ $6.55 $ $7.25 $ $7.25 $ $7.25 $ $7.25 $ $7.25 $ $7.25 $ $7.25 $ $7.25 $ $7.25 $ $7.25 $ $7.25 $ $7.25 $ $7.25 $15.00 a Between January 2017 and January 2023, California state law has a lower minimum wage for employers with 25 employers or less.
32 31 Appendix Table A2. Estimates of Employment Effects of Minimum Wage Increase by Start Year. a All Observations (1) (2) (3) (4) Log(min wage)* Low wage share b *** *** *** *** (0.315) (0.345) (0.177) (0.549) Observations 6,345 6,345 6,345 6,345 Number of CIPS Within Group R Log(minimum wage)* Low wage share b All Observations *** *** *** ** (0.263) (0.292) (0.174) (0.570) Observations 5,170 5,170 5,170 5,170 Number of CIPS Within Group R All Observations Log(min wage)* Low wage share b *** ** ** (0.301) (0.363) (0.206) (0.729) Observations 3,995 3,995 3,995 3,995 Number of CIPS Within Group R Year Effects? Yes No No No County-Specific Fixed Effects? Yes No No No County-Specific Year Effects? No Yes Yes Yes County-Industry Specific Time No No Yes No Tend? Industry-Specific Year Effects? No No No Yes Industry-Specific Time Trend? Yes Yes No No Industry-Specific Unemployment Rate Effects? Yes Yes Yes No
33 32 Appendix Table A2 (continued). Estimates of Employment Effects of Minimum Wage Increase by Start Year. a Excluding Los Angeles Manufacturing, (1) (2) (3) (4) Log(min wage)* Low wage share b *** *** *** (0.299) (0.325) (0.174) (0.545) Observations 6,318 6,318 6,318 6,318 Number of CIPs Within Group R Excluding Los Angeles Manufacturing, Log(minimum wage)* Low wage share b *** *** *** (0.259) (0.277) (0.174) (0.583) Observations 5,148 5,148 5,148 5,148 Number of CIPS Within Group R Excluding Los Angeles Manufacturing, Log(minimum wage)* Low wage share b *** * (0.285) (0.301) (0.200) (0.703) Observations 3,978 3,978 3,978 3,978 Number of county-industry groups Within Group R Year Effects? Yes No No No County-Specific Effects? Yes No No No County-Specific Year Effects? No Yes Yes Yes County-Industry Specific Time No No Yes No Tend? Industry-Specific Year Effects? No No No Yes Industry-Specific Time Trend? Yes Yes No No Industry-Specific Unemployment Rate Effects? Yes Yes Yes No a Sample is restricted to counties and industries described earlier. Standard errors are in parentheses and corrected for clustering by CIP. *, **, and *** indicate significance levels of.1,.05 and.01, respectively. b Low wage share is the percentage of workers in the county-industry cell earning between $0.25 less than the minimum wage and less than or equal to $1 (in 1990 dollars) above the minimum wage.
California Tax Credit Allocation Committee Low Income Housing Tax Credits. Lisa Vergolini Deputy Director
 California Tax Credit Allocation Committee Low Income Housing Tax Credits Lisa Vergolini Deputy Director LOW INCOME HOUSING TAX CREDIT Created by the Tax Reform Act of 1986 Section 42 of the Internal Revenue
Enrollment Statistics Northern Counties Region 1
 Enrollment Statistics Northern Counties Region 1 Alpine, Amador, Butte, Calaveras, Colusa, Del Norte, Glenn, Humboldt, Lake, Lassen, Mendocino, Modoc, Nevada, Plumas, Shasta, Sierra, Siskiyou, Sutter,
> 801 to 1600 OJT Hours. 1st Semester. Addt'l Wage or Approved ERISA Plan. 1 Alameda $30.08 $19.55 $2.00 $8.53 $33.69 $21.90 $2.00 $9.
 > 0 to 800 OJT Hours > 801 to 1600 OJT Hours 50% Approved ERISA 56% 1 Alameda $30.08 $19.55 $2.00 $8.53 $33.69 $21.90 $2.00 $9.79 2 Alpine $24.17 $15.71 $2.00 $6.46 $27.07 $17.60 $2.00 $7.47 3 Amador $24.17
May 2016 The Impact of a $15 Minimum Wage in Cleveland, Ohio
 May 2016 The Impact of a $15 Minimum Wage in Cleveland, Ohio An Analysis Using Congressional Budget Office Methodology About the Ohio Restaurant Association The Ohio Restaurant Association (ORA), founded
California s Unemployment Rate Increases To 10.5 Percent
 From Pat Henning, Director, California Employment Development Department Note: EDD is now opening its call center phone lines from 10 am to 2 pm on Saturdays beginning March 21 in continued response to
DEDUCTIONS EFFECTIVE DECEMBER 1, NOVEMBER 30, MONTHLY PREMIUM
 CALPERS S BAY AREA REGION S REPRESENTED BY IAFF LOCAL 1230 DEDUCTIONS EFFECTIVE DECEMBER 1, 2016 - NOVEMBER 30, CONTRA COSTA HEALTH PLAN $783.46 $682.10 $101.36 $1,566.92 $1,364.19 $202.73 $2,037.00 $1,773.46
The full Lost Dollars, Empty Plates report (including statewide data) is available at:
 is available at:") Lost Dollars, Empty Plates The full Lost Dollars, Empty Plates report (including statewide data) is available at: http://cfpa.net/lost-dollars-empty-plates-2014. Contact: Tia Shimada at tia@cfpa.net or
Lost Dollars, Empty Plates The full Lost Dollars, Empty Plates report (including statewide data) is available at: http://cfpa.net/lost-dollars-empty-plates-2014. Contact: Tia Shimada at tia@cfpa.net or
The Employment Impact of a Comprehensive Living Wage Law
 The Employment Impact of a Comprehensive Living Wage Law Evidence From California July 1999 The Employment Policies Institute The Employment Impact of a Comprehensive Living Wage Law: Evidence From California
Lost Dollars, Empty Plates. The Impact of Food Stamp Participation on State and Local Economies
 Lost Dollars, Empty Plates The Impact of Food Stamp Participation on State and Local Economies Tia Shimada November 2009 California Food Policy Advocates California Food Policy Advocates (CFPA) is a statewide
November 21, Fadel Lawandy Director of the Hoag Center for Real Estate and Finance (714)
") T Chapman University A. Gary Anderson Center for Economic Research FOR RELEASE: November 21, 2017 CONTACT: James Doti, Ph.D. President Emeritus and Donald Bren Distinguished Chair of Business and Economics
T Chapman University A. Gary Anderson Center for Economic Research FOR RELEASE: November 21, 2017 CONTACT: James Doti, Ph.D. President Emeritus and Donald Bren Distinguished Chair of Business and Economics
APPLICATION FOR CREDIT
 PO BOX 19340, SEATTLE, WA 98109-1340 800.562.5515 SALALCU.ORG REV 2/16 APPLICATION FOR CREDIT Dealer: Rate: % Term: months USA PATRIOT ACT IMPORTANT INFORMATION ABOUT PROCEDURES FOR OPENING A NEW ACCOUNT.
SJ JUMBO PROGRAM. Single Family, PUD, Detached/Attached Condo with Loan Score >720. Attached Condo with Loan Score <720 Min.
 SJ JUMBO PROGRAM Primary Residence Purchase and Rate/Term Refinance Fixed rate (15- to 30-year) ARMs (5/1, 7/1, and 10/1 LIBOR ARMs) Single Family, PUD, Detached/Attached Condo with Loan Score >720 Attached
2-50 Small Group BeneFits Monthly Rates
 2-50 2-50 Small Group Monthly Rates Updated Rates - Complete rates for health, dental *, vision and life products, including our newest plans Offered by Anthem Blue Cross: Offered by Anthem Blue Cross
Catholic Charities of California Poverty Data by County within Diocese within California July 2013
 Catholic Charities of California Poverty Data by within Diocese within California July 2013 The tables below provide the following data for each county in California, grouped by local Catholic Charities
POLICY BRIEF. The Employment Effects of Eliminating the Tip Credit in Michigan
 The Employment Effects of Eliminating the Tip Credit in Michigan Technical Analysis By: William Even Raymond E. Glos Professor of Economics Miami University David Macpherson E.M. Stevens Professor of Economics
Superior Court of California, County of Monterey PUBLIC NOTICE
 Superior Court of California, County of Monterey PUBLIC NOTICE SUPERIOR COURT OF CALIFORNIA COUNTY OF MONTEREY 240 Church Street Salinas, CA 93901 www.monterey.courts.ca.gov (831) 775-5400 Hon. Lydia M.
Effects of the 1998 California Minimum Wage Increase
 Effects of the 1998 California Minimum Wage Increase David A. Macpherson Florida State University March 1998 The Employment Policies Institute is a nonprofit research organization dedicated to studying
April The Impact of a $15 Minimum Wage on Kansas City
 April 2015 The Impact of a $15 Minimum Wage on Kansas City ABOUT THE MISSOURI RESTAURANT ASSOCIATION The Missouri Restaurant Association (MRA) is a statewide trade association representing over 1,500 member
COUNTY EMPLOYMENT AND WAGES IN CALIFORNIA - FOURTH QUARTER 2012
 WEST INFORMATION OFFICE San Francisco, Calif. For release Tuesday, July 30, 2013 13-1536-SAN Technical information: (415) 625-2283 BLSinfoSF@bls.gov www.bls.gov/ro9 Media contact: (415) 625-2270 COUNTY
California $ Monthly Rent Affordable to Selected Income Levels Compared with Two-Bedroom FMR
 In California, the Fair Market Rent () for a two-bedroom apartment is $,. In order to afford this level of and utilities without paying more than 0% of income on housing a household must earn $, monthly
Since 2008, California has experienced
 July 2013 Health Policy Brief The Effects of the Great Recession on Health Insurance: Changes in the Uninsured Population from 2007 to 2009 Shana Alex Lavarreda, Sophie Snyder, and E. Richard Brown SUMMARY:
THE COST COUNTING. The Impact of an $8.25 New Jersey Minimum Wage on State and Local Government. William Even Miami University
 William Even Miami University David Macpherson Trinity University October 2013 COUNTING THE COST The Impact of an $8.25 New Jersey Minimum Wage on State and Local Government Minimum Wages Employment Policies
Blue Shield Medicare Supplement plan rates
 Questions: 916-682-1117 Blue Shield Medicare Supplement plan rates Blue Shield of California rates effective: October 1, 2018 OPPORTUNITIES FOR ADDITIONAL SAVINGS Welcome to Medicare Rate Savings New to
FORECLOSURE NOTICES SOAR, FORECLOSURE SALES DROP
 FORECLOSURE NOTICES SOAR, FORECLOSURE SALES DROP Government Intervention Continues to Play Havoc in Foreclosure Market Discovery Bay, CA, April 14, 2009 ForeclosureRadar (www.foreclosureradar.com), the
2-50 Small Group EmployeeChoice Monthly Rates
 2-50 Choice 2-50 Small Group Choice Monthly Rates Updated Rates Effective January 1, 2010 Complete rates for health, dental, vision and life products, including our newest plans BCABR1016CEN Rev. 10/09
Under the Patient Protection and Affordable
 October 2018 ACA Reduces Racial/Ethnic Disparities in Health Coverage Differences in the uninsured rate between white, African American, and Asian/Pacific Islander Californians have been eliminated; however,
The U.S. and California A Bifurcated Recovery
 Sonoma County State of The County Conference The U.S. and California A Bifurcated Recovery Jerry Nickelsburg Senior Economist and Lecturer UCLA Anderson Forecast January 13, 2012 1 The U.S. Economy Main
CRISIS TEEN EMPLOYMENT. The Effects of the Federal Minimum Wage Increases on Teen Employment THE. William E. Even Miami University
 THE William E. Even Miami University David A. Macpherson Trinity University July 2010 TEEN EMPLOYMENT CRISIS The Effects of the 2007-2009 Federal Minimum Wage Increases on Teen Employment Employment Policies
Section 5. Trends in Public Health Insurance Programs
 Section 5 Trends in Public Health Insurance Programs Medicaid Enrollment Medicaid is the nation s major public health insurance program for low-income Americans. The program is administered by each state
SAN LORENZO VALLEY WATER DISTRICT SUMMARY OF RESERVE FUNDS TARGET FUND LEVELS 6/30/2015 (*)
") SAN LORENZO VALLEY WATER DISTRICT SUMMARY OF RESERVE FUNDS TARGET S 6/30/2015 (*) RESERVE FUND TARGET FUND LEVEL 6/30/2010 6/30/2011 6/30/2012 6/30/2013 6/30/2014 6/30/2015 Working Capital Reserve Fund
SAN LORENZO VALLEY WATER DISTRICT SUMMARY OF RESERVE FUNDS TARGET S 6/30/2015 (*) RESERVE FUND TARGET FUND LEVEL 6/30/2010 6/30/2011 6/30/2012 6/30/2013 6/30/2014 6/30/2015 Working Capital Reserve Fund
You are being provided with the background, explanation, and instructions for the Reciprocal Self-Certification Form (PERS-CASD 801).
.") California Public Employees Retirement System P.O. Box 942709 Sacramento, CA 94229-2709 888 CalPERS (or 888-225-7377) TTY: (877) 249-7442 Fax: (916) 795-4166 www.calpers.ca.gov Employer Account Management
California Public Employees Retirement System P.O. Box 942709 Sacramento, CA 94229-2709 888 CalPERS (or 888-225-7377) TTY: (877) 249-7442 Fax: (916) 795-4166 www.calpers.ca.gov Employer Account Management
These allocations are based on the best information available at this time.
 STATE OF CALIFORNIA DIANE WOODRUFF, CHANCELLOR (INTERIM) CALIFORNIA COMMUNITY COLLEGES CHANCELLOR S OFFICE 1102 Q STREET SACRAMENTO, CA 95811-6549 (916) 445-8752 HTTP://WWW.CCCCO.EDU To: From: County Auditors
California Public Employees Retirement System 888 CalPERS 888 Employer Account Management Division
 Employer Account Management Division Dear Member, You are being provided with the background, explanation, and instructions for the Reciprocal Self-Certification Form (PERS-EAMD 801). Reciprocity among
Health Policy Research Brief
 Health Policy Research Brief February 2011 Two-Thirds of California s Seven Million Uninsured May Obtain Coverage Under Health Care Reform Shana Alex Lavarreda and Livier Cabezas S U M M A R Y: Almost
December 22, 2017 EMPLOYMENT DEVELOPMENT DEPARTMENT
 State of California EMPLOYMENT DEVELOPMENT DEPARTMENT Daniel Schneider 1949 Avenida del Oro, Suite 106 760/414-3509 Oceanside, CA 92056 IMMEDIATE RELEASE EL CENTRO METROPOLITAN STATISTICAL AREA (MSA) (Imperial
what is Reciprocity? what are the benefits of reciprocity?
 what is Reciprocity? Reciprocity is an arrangement that allows you to link your current retirement benefits with another California public retirement system. It enables you to preserve and enhance your
California Foreclosure Starts Second-Lowest Since Early 2006
 For immediate release Business editors/real estate writers California Foreclosure Starts Second-Lowest Since Early 2006 La Jolla, CA. The number of California homeowners entering the foreclosure process
RECIPROCITY INFORMATION BOOKLET
 RECIPROCITY INFORMATION BOOKLET SAN JOAQUIN COUNTY EMPLOYEES RETIREMENT ASSOCIATION 6 SO. EL DORADO STREET SUITE 400 STOCKTON, CA 95202 PHONE (209) 468-2163 FAX (209) 468-0480 January 2005 This is intended
California Public Employees Retirement System 888 CalPERS 888 Employer Account Management Division
 California Public Employees Retirement System P.O. Box 942709 Sacramento, CA 94229-2709 888 CalPERS (or 888-225-7377) TTY: (877) 249-7442 Fax: (916) 795-4166 www.calpers.ca.gov Employer Account Management
California Economic Overview Fall 2013
 California Economic Overview Fall 2013 Presented by Jon Haveman, Ph.D. Marin Economic Forum Contents Key Findings 3 California Outperforms Nation Normally 4 California Returns 5 Real Estate is Hot in California
The North Bay Economy 2014: Continued Growth, Needs
 The North Bay Economy 2014: Continued Growth, Needs Rohnert Park, CA February 19, 2014 Robert Eyler, Ph.D. Professor, Department of Economics Director, Center for Regional Economic Analysis Sonoma State
QDP Certification Application for Plan Year 2019 Attachment C1 Current & Projected Enrollment
 QDP Certification Application for Plan Year 2019 Attachment C1 Current & Projected Enrollment Please provide the following for each product (DHMO/DPPO) in the individual market: 1 Effectuated Enrollment
Children s Dental Insurance Plan Rates 2014
 Children s Dental Insurance Plan Rates 2014 June 25, 2013 About Covered California TM Covered California is charged with creating a new insurance marketplace in which individuals and small businesses can
According to the U.S. Geological
 Estimating economic losses in the Bay Area from a magnitude-6.9 earthquake Data from the BLS Quarterly Census of Employment and Wages are used to analyze potential business and economic losses resulting
Property Taxes: Why Some Local Governments Get More Than Others
 Policy Brief Property Taxes: Why Some Local Governments Get More Than Others SUMMARY Some cities, counties, schools and other local governments receive more property taxes than others. The extent of this
Since 2014, California implemented multiple program changes and expansions, bringing millions of uninsured Californians into coverage, including:
 Fact Sheet Revised and updated* April 25, 2018 California fully embraced the federal Affordable Care Act (ACA) with dramatic results. California s uninsured rate is currently at just 7 percent overall
CCIP Year-end Webinar
 CCIP Year-end Webinar 2016-17 Audio call-in #: 1-855-212-0212 Pass Code: 572-732-837 For technical assistance call Rita Edmunds at 415-494-4656 IMAGE Write your question in the chat/question box in the
Briefing on National Mortgage Risk Index and Other Risk Measures
 Briefing on National Mortgage Risk Index and Other Risk Measures Edward Pinto and Stephen Oliner AEI International Center on Housing Risk HousingRisk.org March 24, 2014 1 Key Takeaways from Today s Briefing
3. Employee personal information Last name: First name: MI: Male Female
 (For enrollment, sections 1, 3 and 8 are required. For waivers, only section 7 is required. All medical plans include pediatric dental and vision coverage.) Employer name: Effective date: Employer group
Superior Court of California, County of San Bernardino PUBLIC NOTICE
 Superior of California, County of San Bernardino PUBLIC NOTICE SUPERIOR COURT OF CALIFORNIA COUNTY OF SAN BERNARDINO 247 West Third Street, 11 th Floor San Bernardino, Ca 92415-0302 www.sb-court.org 909-708-8747
FIELD RESEARCH CORPORATION
 FIELD RESEARCH CORPORATION FOUNDED IN 1945 BY MERVIN FIELD 61 California Street San Francisco, California 9418 415-392-5763 Tabulations from a Field Poll Survey of California Registered Voters About the
CALIFORNIA FORECLOSURE FILINGS DROP
 CALIFORNIA FORECLOSURE FILINGS DROP Foreclosures HAMPered by Making Home Affordable Program Discovery Bay, CA, September 15, 2009 ForeclosureRadar (www.foreclosureradar.com), the only website that tracks
Medicare Supplement Outline of Coverage
 Medicare Supplement Outline of Coverage Plans A, F & N Anthem Blue Cross California 2017 This booklet includes premium rates, Medicare deductibles, copays and maximum out-of-pocket costs. Call toll-free
California Travel Impacts by County, p
 California Travel Impacts by County, 1992-2015p April 2016 A Joint Marketing Venture of Visit California and the Governor s Office of Business Development (GO-Biz) PREPARED BY Dean Runyan Associates, Inc.
Blue Shield Medicare Supplement plan rate schedule
 Blue Shield Medicare Supplement plan rate schedule Blue Shield of California rates effective: January 1, 2018 blueshieldca.com Blue Shield of California Medicare Supplement plans Please take a few minutes
Blue Shield Medicare Supplement plan rate schedule
 Blue Shield Medicare Supplement plan rate schedule Blue Shield of California rates effective: April 1, 2018 blueshieldca.com Blue Shield of California Medicare Supplement plans Please take a few minutes
Progress and Postulates: Seeds of Opportunity in Tehama County and the North State Corning, CA April 23, 2013
 Progress and Postulates: Seeds of Opportunity in Tehama County and the North State Corning, CA April 23, 2013 Robert Eyler, PhD Frank Howard Allen Research Scholar and Professor, Economics Director, Executive
Raising the Minimum Wage in California. Ken Jacobs UC Berkeley Center for Labor Research and Education Policy Insights 2016 March 9, 2016
 Raising the Minimum Wage in California Ken Jacobs UC Berkeley Center for Labor Research and Education Policy Insights 2016 March 9, 2016 Real wages have fallen for the bottom half of the workforce 40%
1. Health plan information (All medical plans include pediatric dental and vision coverage.)
") To be completed by employer Employer name: Requested effective date: Employer group number (medical): Employee eligibility date (new hire only): Same as hired date Other: Important: Please print all sections
To be completed by employer Employer name: Requested effective date: Employer group number (medical): Employee eligibility date (new hire only): Same as hired date Other: Important: Please print all sections
Capitol Association Plans PO Box , Sacramento, CA Phone: Fax:
 Capitol Association Plans PO Box 214190, Sacramento, CA 95821 Phone: 916.944.1707 Fax: 866.334.5346 E-mail: caps@capsplans.com Thank you for your interest in the California Veterinary Medical Association
Effects of the Oregon Minimum Wage Increase
 Effects of the 1998-1999 Oregon Minimum Wage Increase David A. Macpherson Florida State University May 1998 PAGE 2 Executive Summary Based upon an analysis of Labor Department data, Dr. David Macpherson
Perspectives on State and Local Finance in California: Surveys of City Officials and Residents
 Occasional Papers Perspectives on State and Local Finance in California: Surveys of City Officials and Residents Mark Baldassare Christopher Hoene Presented at the League of California Cities annual conference,
The Effect of Tip Credits on Earnings and Employment in the U.S. Restaurant Industry
 DISCUSSION PAPER SERIES IZA DP No. 7092 The Effect of Tip Credits on Earnings and Employment in the U.S. Restaurant Industry William E. Even David A. Macpherson December 2012 Forschungsinstitut zur Zukunft
The Economic Outlook
 The Economic Outlook 5th Annual Meyers Research: Housing Market Outlook April 18, 2018 Robert A. Kleinhenz, Ph.D. Economist/Executive Director of Research LLC Outline U.S. Economy State Economy So Cal/Local
WAGES AND FRINGES SCHEDULE 2-A
 WAGES AND FRINGES SCHEDULE 2-A The following rates are in effect within the following Local Union jurisdictions: Local 234, Monterey, San Benito, and Santa Cruz Counties; Local 332, Santa Clara County;
FMG TRUCKING CLAIMS EMERGENCY RESPONSE TEAM
 FMG TRUCKING CLAIMS EMERGENCY RESPONSE TEAM First in All Your Trucking, Garage and Warehouse Needs, Including Accident Litigation, Insurance Disputes, Freight Loss or Damage Claims, Environmental Claims,
Income Inequality and the Safety Net in California Technical Appendices
 Income Inequality and the Safety Net in California Technical Appendices CONTENTS Appendix A: Data Sources 2 Appendix B: Methodology 4 Appendix C: Detailed Estimates 7 Sarah Bohn and Caroline Danielson
Hoover Institution Golden State Poll Fieldwork by YouGov April 14-28, List of Tables
 List of Tables 1. Confidence in job mobility................................................................ 2 2. Homeownership..................................................................... 3 3.
TECHNICAL APPENDIX AND REFERENCES FOR $15.00 MINIMUM WAGE PETITION
 TECHNICAL APPENDIX AND REFERENCES FOR $15.00 MINIMUM WAGE PETITION By Jeannette Wicks-Lim and Robert Pollin Department of Economics and Political Economy Research Institute (PERI) University of Massachusetts-Amherst
Odyssey efileca Overview Santa Barbara Attorneys and Legal Professionals
 Odyssey efileca Overview Santa Barbara Attorneys and Legal Professionals POWERED BY TYLER TECHNOLOGIES Agenda 2 Agenda 3 Odyssey efileca E-Filing manager for the Santa Barbara Superior Court Multi-court
Full Time Faculty Salary Comparisons in California Community Colleges
 MA No Experience - Step 1 beginning salary MA, 5 years experience - Step 6 Rank at MA, 5 years experience Allan Hancock Joint $ 55,422 33 $ 65,508 43 Antelope Valley $ 53,118 47 $ 65,034 45 Barstow $ 53,259
2017 California Hospitals Workers Compensation Benchmarking Report
 2017 California Hospitals Workers Compensation Benchmarking Report Table of Contents Executive Summary... 3 Definitions... 5 Overall results... 6 California Hospital Profiles... 9 Sources... 14 2017 Workers
California Mental Health Services Authority FINANCE COMMITTEE TELECONFERENCE AGENDA
 California Mental Health Services Authority FINANCE COMMITTEE TELECONFERENCE AGENDA May 7, 2018 3:00 p.m. 4:00 p.m. Dial-in Number: 916-233-1968 Access Code: 3043 Colusa County Department of Behavioral
California Travel Impacts by County, p
 California Travel Impacts by County, 1992-2016p May 2017 A Joint Marketing Venture of Visit California and the Governor s Office of Business Development (GO-Biz) PREPARED BY Dean Runyan Associates, Inc.
Family Dental Plans and Rates for 2015
 Family Dental Plans and Rates for 2015 August 20, 2014 updated Aug. 26, 2014 About Covered California TM Covered California is the state s marketplace for the federal Patient Protection and Affordable
Impact of Riverboat Gambling on the Business Climate in Lake County, Indiana
 Impact of Riverboat Gambling on the Business Climate in Lake County, Indiana Authors: Seth B. Payton Laura Littlepage Center for Urban Policy and the Environment Indiana University-Purdue University Indianapolis
THE IMPACT OF MINIMUM WAGE INCREASES BETWEEN 2007 AND 2009 ON TEEN EMPLOYMENT
 THE IMPACT OF MINIMUM WAGE INCREASES BETWEEN 2007 AND 2009 ON TEEN EMPLOYMENT A Thesis submitted to the Faculty of the Graduate School of Arts and Sciences of Georgetown University in partial fulfillment
Online Appendices for Effects of the Minimum Wage on Employment Dynamics
 Online Appendices for Effects of the Minimum Wage on Employment Dynamics Jonathan Meer Texas A&M University and NBER Jeremy West Massachusetts Institute of Technology Journal of Human Resources Author
OREGON MUTUAL INSURANCE COMPANY COMMERCIAL LINES MANUAL DIVISION FOUR FARM RULES
 SECTION I GENERAL 2. REFERRALS TO COMPANY Paragraph 2. is replaced by the following: Refer to company for: A. Any applicable rating plan modification. Refer to Rating Plan Rule 3. for applicable modifications.
Medicare Supplement Outline of Coverage
 OOC_MS_CA-T_AFIBFGN_NTM (17)(Rev 09-2017)-201718rates September 27, 2017 1:39 PM Medicare Supplement Outline of Coverage s A, F, Innovative F, G & N Anthem Blue Cross California 2018 This booklet includes
Lake Tahoe Basin Census Trends Report
 Lake Tahoe Basin Census Trends Report 1990-2000-2010 Prepared August 2013 Contents Page Executive Summary 1 Findings 1 Definitions 3 Section 1. Demographics 4 Population 4 Age 6 Race 6 Housing 10 Tenancy
System Failure: California s Loophole- Ridden Commercial Property Tax May 2010
 System Failure: California s Loophole- Ridden Commercial Property Tax May 2010 Report prepared by the California Tax Reform Association (CTRA), in collaboration with the Alliance of Californians for Community
Health Policy Research Report
 Health Policy Research Report Revised: August 2007 What Does It Take for a Family to Afford to Pay for Health Care? David Carroll, Dylan H. Roby, Jean Ross, Michael Snavely, E. Richard Brown, and Gerald
General Agent Guide. Commercial. Your comprehensive resource for selling Small Group 2.0. Small Business Group
 Commercial Small Business Group Health Net of California, Inc. and Health Net Life Insurance Company (Health Net) General Agent Guide Your comprehensive resource for selling Small Group 2.0 Effective July
Geography of Child Poverty in California Technical Appendices
 Geography of Child Poverty in California Technical Appendices CONTENTS Appendix A. Data and Methodology 2 Table A1 4 Table A2 5 Table A3 6 Table A4 7 Appendix B. Detailed Tables and Supplementary Figures
System Failure: California s Loophole- Ridden Commercial Property Tax May 2010
 System Failure: California s Loophole- Ridden Commercial Property Tax May 2010 Report prepared by the California Tax Reform Association (CTRA), in collaboration with the Alliance of Californians for Community
The US and California Economic Outlook
 Regional Economic Forum April 25, 2018 The US and California Economic Outlook Robert A. Kleinhenz, Ph.D. Economist/Executive Director of Research LLC Outline U.S. Economy State & Region Conclusion/Looking
Outlook 2018: IE and Southern California So Cal Economic Summit Corona Chamber of Commerce March 29, 2018
 Outlook 2018: IE and Southern California 2018 So Cal Economic Summit Corona Chamber of Commerce March 29, 2018 Robert A. Kleinhenz, Ph.D. Economist/Exec Director of Research UCR Business Forecast Outline
Gender Differences in the Labor Market Effects of the Dollar
 Gender Differences in the Labor Market Effects of the Dollar Linda Goldberg and Joseph Tracy Federal Reserve Bank of New York and NBER April 2001 Abstract Although the dollar has been shown to influence
Medicare Supplement Outline of Coverage
 OOC_MS_CA-T_AFIBFGN_NTM (17)(Rev 09-2017)-201718rates September 27, 2017 1:39 PM Medicare Supplement Outline of Coverage s A, F, Innovative F, G & N Anthem Blue Cross California 2018 This booklet includes
Medicare Supplement Outline of Coverage. Plans A, F, Innovative F, G & N Anthem Blue Cross California 2018
 OOC_MS_CA-T_AFIBFGN_NTM_AOOC002M(7)(Rev -207)-208rates November 2, 207 8:54 PM Medicare Supplement Outline of Coverage s A, F, Innovative F, G & N Anthem Blue Cross California 208 This booklet includes
The World of. Trauma. Cumulative. Claims. Enter Report
 The World of Cumulative Trauma Claims Enter Report P. 2 Table of Contents Area 1: Claim Reporting Patterns 1. Percent of Indemnity Claims that are CT 2. Percent of Claims Unreported 3. Number of Years
CENTER FOR BUSINESS AND POLICY RESEARCH. May California & Metro UNIVERSITY OF THE PACIFIC EBERHARDT SCHOOL OF BUSINESS
 CENTER FOR BUSINESS AND POLICY RESEARCH May 2017 California & Metro UNIVERSITY OF THE PACIFIC EBERHARDT SCHOOL OF BUSINESS CENTER FOR BUSINESS AND POLICY RESEARCH Del Norte Siskiyou Modoc Humboldt Trinity
Financing Your Climate Action Plan Green California Summit Joe Livaich Regional Director
 Financing Your Climate Action Plan Green California Summit 2015 Joe Livaich Regional Director Solar Reaches the Tipping Point Even at $10 a barrel, oil can t match solar on cost. National Bank of Abu Dhabi,
SACRAMENTO LOCAL AGENCY FORMATION COMMISSION 1112 I Street #100 Sacramento, California (916) April 7, 2004
 April 7, 2004") SACRAMENTO LOCAL AGENCY FORMATION COMMISSION 1112 I Street #100 Sacramento, California 95814 (916) 874-6458 April 7, 2004 TO: FROM: RE: Sacramento Local Agency Formation Commission Peter Brundage, LAFCo
SACRAMENTO LOCAL AGENCY FORMATION COMMISSION 1112 I Street #100 Sacramento, California 95814 (916) 874-6458 April 7, 2004 TO: FROM: RE: Sacramento Local Agency Formation Commission Peter Brundage, LAFCo
APPENDIX B ISSUES IN TABULATION CLAIM EXPENDITURES AND IDENTIFYING UNIQUE CLAIMANTS
 APPENDIX B ISSUES IN TABULATION CLAIM EXPENDITURES AND IDENTIFYING UNIQUE CLAIMANTS Two characteristics of the Medi-Cal claims data were examined to understand their implications for the study analysis.
Lost Dollars, Empty Plates
 Lost Dollars, Empty Plates The Impact of CalFresh Participation on State and Local Economies Tia Shimada February 2013 California Food Policy Advocates (CFPA) is a statewide public policy and advocacy
BUSINESS FORECASTING CENTER. May California & Metro UNIVERSITY OF THE PACIFIC EBERHARDT SCHOOL OF BUSINESS
 BUSINESS FORECASTING CENTER May 2014 California & Metro UNIVERSITY OF THE PACIFIC EBERHARDT SCHOOL OF BUSINESS BUSINESS FORECASTING CENTER SPONSORED BY Del Norte Siskiyou Modoc We would like to recognize
2015 Outline of Medicare Supplement Coverage Cover Page (1 of 2) Plans A, F & N
 Plans A, F & N") Steve Shorr Insurance - Authorized Agent - 30.59.335 For more information and to very the latest details Anthem Blue Cross Administrative Office: P.O. Box 9063, Oxnard, CA 9303-9063 Toll Free Telephone
Steve Shorr Insurance - Authorized Agent - 30.59.335 For more information and to very the latest details Anthem Blue Cross Administrative Office: P.O. Box 9063, Oxnard, CA 9303-9063 Toll Free Telephone
ESTIMATES OF DEFERRED-ACTION ELIGIBLE POPULATIONS IN CALIFORNIA COUNTIES
 ESTIMATES OF DEFERRED-ACTION ELIGIBLE POPULATIONS IN CALIFORNIA COUNTIES For Grantmakers Concerned with Immigrants and Refugees California Funders Convening December 4, 2014 Acknowledgments James Bachmeier