Varma s Interim Report 1 January 30 June Varma s Interim Report 1 January 30 June 2017
|
|
|
- Ernest Tyler
- 6 years ago
- Views:
Transcription

1 Varma s Interim Report 1 January 30 June 2017

2 Strong result as economy recovers Solvency capital, 11.2 bn Market value of investments, 45.0 bn Return on investments 4.7%
3 Investment returns Investments yielded a return of EUR 2.0 billion * * 1-6/2016 return on investment was -0.3 % The average nominal return on investments over ten years is approx. 4.2%, calculated in accordance with the recommendations issued by TELA.

4 The value of Varma s investments reached a new record of EUR 45 billion
5 Investment return trend 1 6/2017


6 Since 2009, the cumulative return on Varma s investments is 78.2%, i.e billion Post-financial-crisis recovery has been reflected in investments for some time European sovereign debt crisis ECB begins quantitative easing Commodity prices plummet

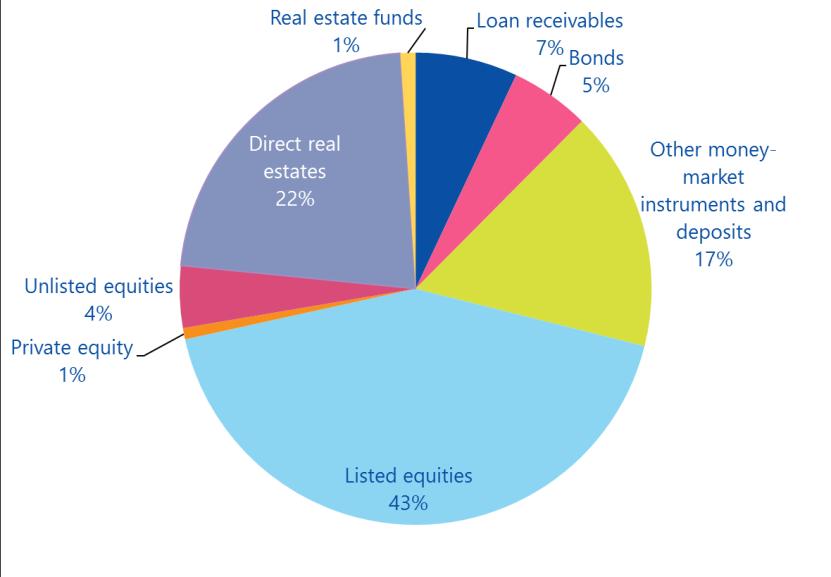
7 Composition of the investment result
8 Investments classified according to risk 30-June June December Market value Market value Market value Market Value Risk position Risk position Risk position 1-6/ / / m Return Return Return MWR MWR MWR Vola- mill. % mill. % mill. % mill. % % % % tility Fixed-income investments 1 17, , , , Loan receivables 1, , , , Bonds 12, , , , Public bonds 4, , , , Other bonds 7, , , , Other money-market instruments and deposits 4, , , , Equity investments 17, , , , Listed equities 13, , , , Private equity 2, , , , Unlisted equities 1, , Real estate investments 3, , , , Direct real estates 2, , , , Real estate funds Other investments 6, , , , Hedge funds 6, , , , Commodities Other investments Total investments 44, , , , Impact of derivatives 7, , Investment allocation at fair value 44, , , , The modified duration for all the bonds is 4.1. The open currency position is 21.7% of the market value of the investments. 1 Includes accrued interest
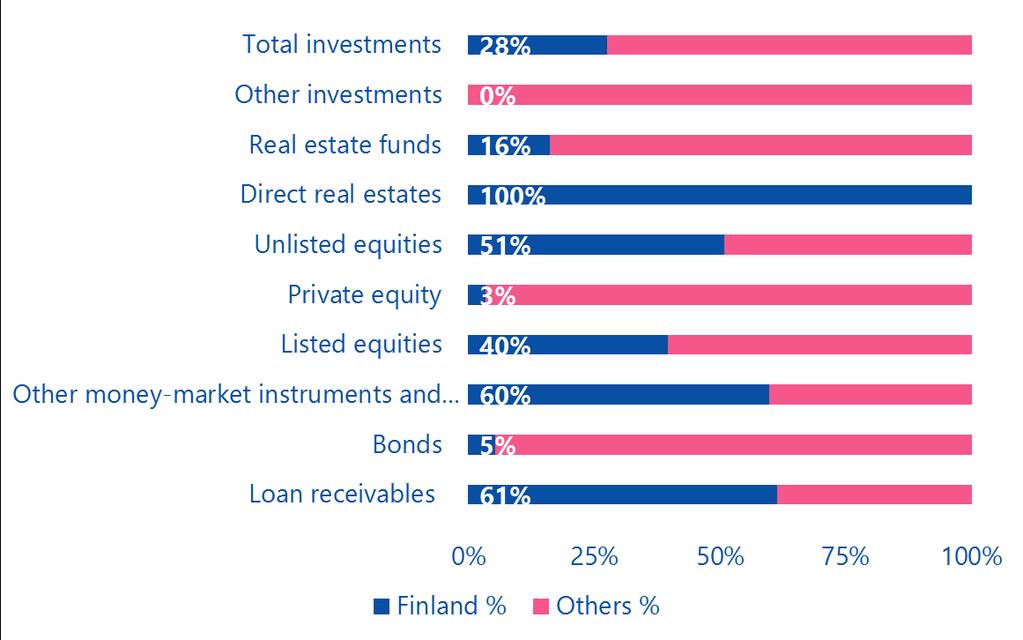
9 Investments in Finland 28%, 12.7 bn
10 Investment returns for Varma and the markets % Varma Finnish equities European equities US equities Euro government bonds Euro corporate bonds 06/ Average nominal return 5 years years Since 1999 * Average real return 5 years years Since 1999 * * Varma, as it is today, was founded in mid-1998, so comparison data earlier than 1999 is not available. Finnish equities = OMX Helsinki Cap Index European equities = Stoxx 600 Total Return Index EUR US equities= S&P500 Total Return Index Euro government bonds = IBOXX Eurozone EUR (Total Return) Euro corporate bonds = IBOXX Corporate Overall Performance Index EUR (Total Return)
. Solvency capital was on a sustainable level, i.e. 1.7 (2.0) times the solvency limit.")
11 Solvency very strong Solvency capital was EUR 11.2 billion at the end of June (10.2 bn on 1 Jan), and per cent in relation to the technical provisions (130.9% on 1 Jan). Solvency capital was on a sustainable level, i.e. 1.7 (2.0) times the solvency limit. The figures are in line with the legislation in effect at the time.
12 Key figures 6/2017 6/ Premiums written, million 2,444 2,324 4,675 Pensions paid, million ¹) 2,752 2,680 5,345 TyEL-insured 500, , ,890 YEL insurance policies 35,470 36,450 36,000 Pensioners 342, , ,100 Investments, million 44,989 41,242 42,852 Return on investment, million 2, ,953 Return on investment, % Total result, million 1, Loading profit, million Operating expenses as % of loading component Technical provisions, million 35,601 33,392 33,501 Solvency capital, million 11,234 9,136 10,199 Solvency ratio % 2) Solvency capital/solvency limit Average number of personnel, Parent Company ) 2) Before the reduction of received clearing of pay-as-you-go (PAYG) pensions Pension assets in relation to the technical provisions under 11 of the Ministry of Social Affairs and Health s decree governing pension institutions (614/2008). All years are presented in the new format.

13 Latest developments for customers Pensions paid 2.8 bn Pensioners 342,000 Insured employees and entrepreneurs 536,000

14 Latest developments for customers Development of digital services continues. A software robot was taken into use in pension services, freeing up personnel to focus on more demanding expert and customer work. Varma made 13,300 new pension decisions up 17%. Cost-effectiveness at a good level. Varma used 75%, or 50 million, of the assets reserved to cover operating expenses for that purpose. The result of the TyEL transfer round that ended in June was EUR 2.3 million. We published new workability management contracts between 1 April and 30 June 2017.

15 Responsibility

16 Varma s CSR focus areas Responsibility for Varma employees Cost-effective use of funds Open and pro-active communication Ethical and transparent business Responsibility in investment operations Mitigating climate change Securing solvency High-quality implementation of pension provision Promoting workability and longer careers


17 CSR actions in the first half of 2017 Responsibility reflected in share ownership policy Our share ownership policy transparently outlines our principles and expectations as a shareholder Responsibility included as a new part of the policy: we require companies, e.g., to comply with international norms and to report on the impacts of climate change on their business European leader in sustainable equities Varma in top 6 in WWF survey on how well equity portfolios are aligned with the Paris Climate Agreement Varma has excluded investments in coal mines and in energy companies who rely on coal for more than 1/3 of their electricity production 5,000 new solar panels, 250 charging stations for green cars Varma will 7 build solar power systems at several of its properties around Finland, including its head office Charging of electric and hybrid cars possible at 250 spaces in the company s Salmisaari parking facility

18 Current economic issues

19 Current economic issues The global economy appears to be recovering on a large scale. Finland has finally made it on board the global economic recovery. Growth is strong and steady and is boosted by exports, private consumption and investments. We still need to see stronger growth in employment. The strengthened economic growth has not yet significantly improved the labour market situation.
20
Interim Report January-June August 2018 Varma s Interim Report 1 January 30 June 2018
 Interim Report January-June 2018 New record in the value of Varma s investments, 1.7% return in H1 Solvency capital, Market value of investments, Return on investments 11.4 bn 46.4 bn 1.7% Value of Varma
Varma s Financial Statement 2016
 Varma s Financial Statement 2016 15 February 2017 2016 a stable and strong year Solvency capital, 10.2 bn Market value of investments, 42.9 bn Return on investments 4.7% People insured and pensioners 870,000
Varma's Financial Statements 1 January 31 March April 2018 Varma s Interim Report 1 January 31 March 2018
 Varma's Financial Statements 1 January 31 March 2018 1 Strong solvency and diversification offered protection in market turmoil Solvency capital, 11.1 bn Market value of investments, 45.7 bn Return on
Varma s Interim Report 1 January 31 March Varma s Interim Report 1 January 31 March 2017
 Varma s Interim Report 1 January 31 March 2017 Good first quarter for Varma Solvency capital, 10.8 bn Market value of investments, 44.4 bn Return on investments 2.7% Value of investments grew to EUR 44.4
Varma s Interim Report 1 January 30 June 2017
 1 (11) Varma s Interim Report 1 January 30 June 2017 The comparison figures in parentheses are from 30 June 2016, unless otherwise indicated. Total result amounted to EUR 1,051 ( 733) million. The half-year
Varma s Interim Report 1 January 30 September 2017
 1 (9) Varma s Interim Report 1 January 30 September 2017 The comparison figures in parentheses are from 30 September 2016, unless otherwise indicated. Total result amounted to EUR 1,262 (234) million.
Varma s Interim Report 1 January 30 June 2016
 Varma s Interim Report 1 January 30 June 2016 The comparison figures in parentheses are from 30 June 2015 unless otherwise indicated. Total result amounted to EUR 733 (700) million. The three-month return
Varma s Interim Report 1 January 30 September 2016
 1 (8) Varma s Interim Report 1 January 30 September 2016 The comparison figures in parentheses are from 30 September 2015 unless otherwise indicated. Total result amounted to EUR 234 ( 745) million. The
Varma s interim report 1 January 30 September 2018
 1 (9) Varma s interim report 1 January 30 September 2018 The comparison figures in parentheses are from 30 September 2017, unless otherwise indicated. Total result stood at EUR 108 (1,262) million. The
FINANCIAL STATEMENTS February 2014
 FINANCIAL STATEMENTS 213 27 February 214 1 ILMARINEN S KEY FIGURES FOR 213 Return on investments 9.8 per cent Value of investment assets: EUR 32.3 billion Solvency capital: EUR 7.1 billion Solvency ratio:
FINANCIAL STATEMENTS 2017
 FINANCIAL STATEMENTS 2017 Elo Mutual Pension Insurance Company Pro forma figures are the combined figures of Pension Fennia and LocalTapiola Pension Company. ELO S YEAR 2017 Elo reached the best result
Elo Interim Report 1 January 30 September 2018
 Elo Interim Report 1 January 30 September 2018 The comparison figures in brackets are figures for 30 September 2017. Elo s return on investments was 2.2%. The market value of Elo s investments was EUR
ILMARINEN S INTERIM REPORT
 ILMARINEN S INTERIM REPORT 1 JANUARY TO 30 SEPTEMBER 2017 GOOD INVESTMENT RESULT BOOSTS SOLVENCY JANUARY SEPTEMBER FINANCIAL PERFORMANCE IN BRIEF: In January September, Ilmarinen s investment portfolio
ILMARINEN S INTERIM REPORT Q2 / Press conference 23 August 2012 Harri Sailas, President and CEO
 ILMARINEN S INTERIM REPORT Q2 / 2012 Press conference 23 August 2012 Harri Sailas, President and CEO KEY OBSERVATIONS SINCE JANUARY 2012 Moderate return on investments 3.3 per cent Long-term real return
Elo Mutual Pension Insurance Company Financial statements for 2014
 Elo Mutual Pension Insurance Company Financial statements for 2014 Key indicators Pro forma 31.12.2014 31.12.2013 31.12.2013 Company size Premiums written, EUR million 3,022.9 1,602.7 2,929.0 Pensions
ANNUAL AND CSR REPORT
 ANNUAL AND CSR REPORT CONTENTS 4 4 6 The year President and CEO s Review The year in brief 8 Strategy and operating environment 12 Responsible Varma 15 15 18 20 Responsibility for pension assets Strong
ANNUAL AND CSR REPORT 2017
 ANNUAL AND CSR REPORT 2017 FOR CONTENTS 4 The year 2017 4 President and CEOʼs Review 6 The year in brief 8 Strategy and goals 11 Operating environment 15 Responsible Varma 18 Responsibility for pension
ILMARINEN S INTERIM REPORT
 ILMARINEN S INTERIM REPORT 1 JANUARY 30 JUNE 2018 RETURN ON INVESTMENTS 1.1%, INTEGRATION PROCEEDED AS PLANNED JANUARY JUNE FINANCIAL PERFORMANCE IN BRIEF: In January June, the return on Ilmarinen s investment
Board of Directors Report 2013
 Board of Directors Report 213 A look back at 213 Despite an uncertain economy and investment climate, Veritas s investments yielded well during 213. Especially the favourable development in the share markets
Responsibility at Varma. Varma s Corporate Social Responsibility Programme 2017
 Responsibility at Varma 1 Vision. Responsibility is part of Varma s daily operations. We actively communicate what CSR means to us and how our responsible operations show in society. We continuously develop
REPORT ON OPERATIONS AND FINANCIAL STATEMENTS 2013
 REPORT ON OPERATIONS AND FINANCIAL STATEMENTS 2013 26 February 2014 Porkkalankatu 1, FI-00018 Ilmarinen Tel. +358 10 284 11 www.ilmarinen.fi 1. ECONOMIC DEVELOPMENT The weak performance of Finland s economy
Economic Outlook. Global And Finnish. Technology Industries In Finland Turnover and orders picking up s. 5. Economic Outlook
 Economic Outlook Technology Industries of Finland 2 217 Global And Finnish Economic Outlook Broad-Based Global Economic Growth s. 3 Technology Industries In Finland Turnover and orders picking up s. 5
REPORT ON OPERATIONS AND FINANCIAL STATEMENTS 2016
 REPORT ON OPERATIONS AND FINANCIAL STATEMENTS 2016 Ilmarinen Porkkalankatu 1, Helsinki FI-00018 Helsinki Porkkalagatan 1, Helsingfors Puh / Tfn / Tel +358 10 284 11 www.ilmarinen.fi 1 REPORT ON OPERATIONS
Report of the Board of Directors 2017
 15.2.2018 1/15 Report of the Board of Directors 2017 The economic operating environment The Finnish economy grew faster than expected in the financial year 2017. The broad-based recovery of the economy
REPORT ON OPERATIONS AND FINANCIAL STATE- MENTS 2017
 REPORT ON OPERATIONS AND FINANCIAL STATE- MENTS 2017 Ilmarinen Porkkalankatu 1, Helsinki FI-00018 Helsinki Porkkalagatan 1, Helsingfors Puh / Tfn / Tel +358 10 284 11 www.ilmarinen.fi 1 REPORT ON OPERATIONS
BNP PARIBAS ASSET MANAGEMENT
 BNP PARIBAS ASSET MANAGEMENT Snakes and Ladders After playing snakes and ladders for the whole of 2017, the Euro Stoxx index (SX5E) made a new two-year high this week. The recent rally in the eurozone
Economic Outlook. Technology Industries In Finland Orders up since early autumn 2016 pg. 5
 Economic Outlook Technology Industries of Finland 1 217 Global And Finnish Economic Outlook Economic outlook is brightening up, but uncertainty persists pg. 3 Technology Industries In Finland Orders up
Main Indicators for the Finnish Economy
 BANK OF FINLAND Monetary Policy and Research - Financial Markets and Statistics Main Indicators for the Finnish Economy 1/7 19 Dec 7 Main Indicators for the Finnish Economy is produced jointly by the Monetary
AKTIA BANK PLC INTERIM REPORT 1-3/2014
 AKTIA BANK PLC INTERIM REPORT 1-3/2014 Strong Net commission income, Expenses down 4% Operating profit was EUR 16.4 (19.5) million. Net commission income was up 11% but NII down to EUR 25.4 (30.1) million.
Insolvency forecasts. Economic Research August 2017
 Insolvency forecasts Economic Research August 2017 Summary We present our new insolvency forecasting model which offers a broader scope of macroeconomic developments to better predict insolvency developments.
People s livelihood is at the heart of Ilmarinen s business. In the end, it is all about our client companies employees. Securing their pensions is
 ilmarinen IN 2010 People s livelihood is at the heart of Ilmarinen s business. In the end, it is all about our client companies employees. Securing their pensions is the reason for Ilmarinen s existence.
Main Indicators for the Finnish Economy
 BANK OF FINLAND Monetary Policy and Research - Financial Markets and Statistics Main Indicators for the Finnish Economy 11/1 1 November 1 1 November 1 Monetary Policy and Research - Financial Markets and
Main Indicators for the Finnish Economy
 BANK OF FINLAND Monetary Policy and Research - Financial Markets and Statistics Main Indicators for the Finnish Economy /1 3 August 1 3 August 1 Monetary Policy and Research - Financial Markets and Statistics
DESIGNING INVESTMENT GRADE POLICIES: LESSONS FROM EXPERIENCE WITH LOW-CARBON, CLIMATE-RESILIENT INVESTMENT
 DESIGNING INVESTMENT GRADE POLICIES: LESSONS FROM EXPERIENCE WITH LOW-CARBON, CLIMATE-RESILIENT INVESTMENT Robert Youngman Team Leader, Green Finance and Investment ENV/CBW OECD-WWC-Netherlands Roundtable
INTERIM REPORT 5 NOVEMBER 2015
 Q3 INTERIM REPORT JANUARY SEPTEMBER 2015 5 NOVEMBER 2015 Contents 3 Summary 5 Third quarter 2015 in brief 6 Change in reporting practices as of 1 January 2016 7 Business areas 7 P&C insurance 10 Associated
Medium-term. forecast. Update Q4
 Medium-term forecast Update Q4 2017 Published by: Národná banka Slovenska Address: Národná banka Slovenska Imricha Karvaša 1 813 25 Bratislava Slovakia Contact: info@nbs.sk http://www.nbs.sk Discussed
ILMARINEN JANUARY MARCH Press Conference 29 April 2016
 ILMARINEN JANUARY MARCH 2016 Press Conference 29 April 2016 1 Q1/2016: RETURN ON INVESTMENTS Timo Ritakallio, President and CEO 2 INVESTMENT RETURN DEPRESSED BY DECLINE IN SHARE PRICES January March 2016
Economic Outlook. Technology Industries In Finland Growth of new orders and tender requests stalled s. 4
 Economic Outlook Technology Industries of Finland 4 218 Global And Finnish Economic Outlook Growth continues to slow down s. 3 Technology Industries In Finland Growth of new orders and tender requests
TYEL CONTRIBUTION GUIDE FOR LARGE-SCALE EMPLOYERS 2018 TYEL CONTRIBUTION GUIDE FOR LARGE-SCALE EMPLOYERS 2018
 LARGE-SCALE EMPLOYERS 2018 LARGE-SCALE EMPLOYERS 2018 01 The different components of the TYEL insurance contribution and their use are explained below. The old-age pension component is used for financing
New information since the October 2011 Monetary Policy Report (3/11) 1
 1") Meeting 14 March 2012 New information since the October 2011 Monetary Policy Report (3/11) 1 International economy According to preliminary figures, GDP for Norway s main trading partners fell by 0.2 percent
Meeting 14 March 2012 New information since the October 2011 Monetary Policy Report (3/11) 1 International economy According to preliminary figures, GDP for Norway s main trading partners fell by 0.2 percent
Main Indicators for the Finnish Economy
 BANK OF FINLAND Monetary Policy and Research - Financial Markets and Statistics Main Indicators for the Finnish Economy 1/9 1 Jan 9 Main Indicators for the Finnish Economy is produced jointly by the Monetary
Interim Report 1 Jan 30 Jun August 2008 Kari Inkinen, President and CEO Robert Öhman, CFO
 Interim Report 1 Jan 30 Jun 2008 7 August 2008 Kari Inkinen, President and CEO Robert Öhman, CFO Financial review Market overview Operational review Business areas Appendix 2 Financial review Market overview
Inflation projection of Narodowy Bank Polski based on the NECMOD model
 Economic Institute Inflation projection of Narodowy Bank Polski based on the NECMOD model Warsaw / 9 March Inflation projection of the NBP based on the NECMOD model Outline: Introduction Changes between
1 UK outlook: Equities remain vulnerable to ongoing political uncertainty. 2 Fixed income: The bond markets are waiting for interest rates to rise
 UK outlook: Equities remain vulnerable to ongoing political uncertainty Fixed income: The bond markets are waiting for interest rates to rise 3 When bad news is good news: The eurozone has received its
The Unemployment Insurance Fund s result for the financial year 2016 showed a surplus
 Unemployment Insurance Fund Financial Statement Release 21 March 2017 at 11:00 Unemployment Insurance Fund s (TVR) Financial Statement Release for 2016 The Unemployment Insurance Fund s result for the
Recent Economic Developments
 REPUBLIC OF INDONESIA Recent Economic Developments January, 2010 Published by Investors Relations Unit Republic of Indonesia Address Bank Indonesia International Directorate Investor Relations Unit Sjafruddin
EXEL COMPOSITES PLC INTERIM REPORT at 9.00 a.m. 1 (13)
") EXEL COMPOSITES PLC INTERIM REPORT 23.10. at 9.00 a.m. 1 (13) Exel Composites Plc s Interim Report for January 1 September 30, Q3 in brief - Net sales were 18.0 MEUR (Q3/: 19.0 MEUR) - Operating profit
EXEL COMPOSITES PLC INTERIM REPORT 23.10. at 9.00 a.m. 1 (13) Exel Composites Plc s Interim Report for January 1 September 30, Q3 in brief - Net sales were 18.0 MEUR (Q3/: 19.0 MEUR) - Operating profit
TYEL CONTRIBUTION AND WORK CAPACITY GO HAND IN HAND 3
 LARGE EMPLOYER S TYEL CONTRIBUTION 2019 1 CONTENTS TYEL CONTRIBUTION AND WORK CAPACITY GO HAND IN HAND 3 COMPONENTS OF YOUR TYEL CONTRIBUTION 4 Employees also contribute 5 As a large employer you belong
Group Key figures (IFRS), MEUR 4-6/ / / / /2016
, MEUR 4-6/ / / / /2016") 1 (9) Destia s Half year financial report January June 2017 DESTIA S OPERATING RESULT CONTINUES TO DEVELOP FAVOURABLY Revenue was MEUR 191.9 (200.1). The operating result improved year-on-year, to MEUR
1 (9) Destia s Half year financial report January June 2017 DESTIA S OPERATING RESULT CONTINUES TO DEVELOP FAVOURABLY Revenue was MEUR 191.9 (200.1). The operating result improved year-on-year, to MEUR
Vítor Constâncio ECB Vice-President. Fragmentation and Rebalancing in the euro area
 Vítor Constâncio ECB Vice-President Fragmentation and Rebalancing in the euro area Joint EC-ECB Conference on Financial Integration Brussels, 25 April 2013 Introduction Rubric In the first half of 2012,
Monthly Market Snapshot
 ly Market Snapshot NOVEMBER 2016 The ly Market Snapshot publication provides commentary on the global economy and the performance of financial markets Key insights Equity markets recovered in November
Assessing Capital Markets Union
 6 Assessing Capital Markets Union Quarterly Assessment by Paul Richards Summary It is too early to make an assessment of Capital Markets Union, but not too early to give a market view of the tests by which
Atria Group 1 January 30 June 2018
 1 Firstname Surname / Presentation title Atria Group 1 January 30 June 2018 Q2 Q2 H1 H1 Net sales 359.1 368.4 704.6 701.0 1,436.2 EBIT 5.4 10.0 8.8 11.2 40.9 EBIT % 1.5 % 2.7 % 1.3 % 1.6 % 2.8 % Adjusted
CapMan alternative asset manager in the Nordic region and Russia
 CapMan alternative asset manager in the Nordic region and Russia Annual General Meeting 2010 Heikki Westerlund, CEO, CapMan Plc 30 March 2010 CapMan update Market environment Contents Financials 2009 2
Economic Outlook. Global And Finnish. Technology Industries In Finland Significant growth in the value of orders due to ship orders s.
 Economic Outlook Technology Industries of Finland 1 218 Global And Finnish Economic Outlook Good global economic outlook s. 3 Technology Industries In Finland Significant growth in the value of orders
REPORT OF THE BOARD OF DIRECTORS AND FINANCIAL STATEMENTS
 REPORT OF THE BOARD OF DIRECTORS AND FINANCIAL STATEMENTS Contents 3 Report of the Board of Directors 3 The economic operating environment 4 Earnings-related pension system 5 Varma s financial trends 6
Debt Investor Presentation
 Debt Investor Presentation OP-Pohjola Group and issuing entities Pohjola Bank plc and OP Mortgage Bank www.pohjola.com > Investor Relations > Debt Investors 2 Contents OP-Pohjola Group in Brief 3 Finnish
MACRO INVESTMENT OUTLOOK
 MACRO INVESTMENT OUTLOOK AUGUST 18 INVESTMENT STRATEGY AND DYNAMIC MARKETS TEAM, MULTI ASSET GROUP GLOBAL SHARES CONSTRAINED BY TRADE WAR FEARS BUT AUSTRALIAN SHARES RELATIVELY RESILIENT 5 Australia -
Pohjola Bank plc Interim Report for 1 January 30 June 2010
 Pohjola Bank plc s Interim Report for 1 January 1 Pohjola Bank plc Company Release, 4 August, 8.00 am Release category: Interim Report Pohjola Bank plc Interim Report for 1 January January June Year on
Asset Allocation Monthly
 For professional investors Asset Allocation Monthly December 2015 Joost van Leenders, CFA, Chief economist, Multi Asset Solutions joost.vanleenders@bnpparibas.com +31 20 527 5126 SUMMARY INVESTMENT CLIMATE
Financial Statements Release 1 January 31 December 2016
 THE MORTGAGE SOCIETY OF FINLAND Financial Statements Release 1 January 31 December 2016 The Audited Financial Statements 2016 will be released on 1 March 2017 The 2016 Annual Report will be published on
Pohjola Bank plc s Financial Statements Bulletin for 1 January 31 December 2014
 Pohjola Bank plc s Financial Statements Bulletin for 1 January ember 2014 Pohjola Bank plc Stock Exchange Release 5 February 2015 at 8.00 am Financial Statements Bulletin Pohjola Group in 2014 1) Consolidated
Contents. Sampo Group Interim Report January September Contents. Summary 3
 Contents Contents Summary 3 THIRD quarter 2013 in brief 4 Business areas 5 P&C insurance 5 Associated company Nordea Bank Ab 8 Life insurance 10 Holding 12 Other developments 13 Personnel 13 Remuneration
2015 Draft Budgetary Plan
 2015 Draft Budgetary Plan Corrected for technical errors, 7 November 2014 26c/2014 Economic outlook and economic policy 2015 Draft Budgetary Plan Ministry of Finance publications 26c/2014 Economic outlook
Outlook to Finnish Economy
 Member of the Board Marja Nykänen Bank of Finland Outlook to Finnish Economy Estonia / Finland 200 seminar, Tallinn 1.11.2017 Unrestricted 1 Finland has gone through an extraordinary decade Country specific
STATEMENT. Evaluation of the fair value of Sponda Plc s investment properties on 31 December 2009
 STATEMENT Evaluation of the fair value of Sponda Plc s investment properties on 31 December 2009 0 1 EVALUATION OF THE FAIR VALUE OF SPONDA PLC S INVESTMENT PROPERTIES Sponda Plc conducts its own quarterly
The euro area economy: an update Euro Challenge November 2016
 The euro area economy: an update Euro Challenge November 2016 Delegation of the European Union to the United States www.euro-challenge.org What this presentation will cover A. Update on the economic situation
Morgan Stanley Financial Services Conference
 Morgan Stanley Financial Services Conference Group CEO and President, Björn Wahlroos April 1 st, 2009 Sampo Group s History The 21st century in Sampo Group has been reflected by several structural changes.
KESKO ROADSHOW CEO MIKKO HELANDER Q4/2015
 KESKO ROADSHOW CEO MIKKO HELANDER Q4/2015 KESKO TODAY ROLLING 12 MO Net sales 8,780m Operating profit* 247m Personnel 21,812 Shareholders 38,853 Market capitalisation 3.1bn (Sep 30, 2015) * excl. non-recurring
Interim Report 3 rd quarter 2012 Nordea Bank Norge Group
 Interim Report 3 rd quarter 2012 Nordea Bank Norge Group Nordea s vision is to be a Great European bank, acknowledged for its people, creating superior value for customers and shareholders. We are making
Finnish Industry Investment Ltd
 Finnish Industry Investment Ltd Consolidated financial statements 2018 Table of contents Financial statements Page Consolidated statement of comprehensive income 3 Consolidated statement of financial position
Participate in the Digital Transformation of India
 Participate in the Digital Transformation of India DATE OF ALLOTMENT December 28, 2015 BENCHMARK S&P BSE IT TRI FUND SIZE Rs.111.56 (Rs. in Cr.) MONTHLY AVERAGE AUM Rs.90.94 (Rs. in Cr.) EXIT LOAD: 0.25%
Varma s responsible investment policy
 responsible investment policy Contents Varma s responsible investment policy for hedge investments 2 Varma s hedge investment portfolio 2 Assessing the fund management company 2 Hedge fund 3 Investments
Interim report Q1 May 3, 2018
 Interim report Q1 May 3, 2018 1 Agenda Highlights of Q1/2018 January-March Segments Mail, Parcel and Logistics Services Itella Russia OpusCapita Outlook 2 Highlights of Q1/2018 3 January-March in a nutshell
Sampo Capital Markets Day London, 07 September Heikki Ilkka Nordea Group CFO
 Sampo Capital Markets Day London, 07 September 2017 Heikki Ilkka Nordea Group CFO Nordea in brief The largest financial services group in the Nordics Household market position #1 Corporate & Institutional
RESPONSIBLE INVESTMENT GOVERNMENT PENSION FUND GLOBAL DEPUTY GOVERNOR EGIL MATSEN
 RESPONSIBLE INVESTMENT GOVERNMENT PENSION FUND GLOBAL DEPUTY GOVERNOR EGIL MATSEN 7 MARCH 2017 The GPFG A financial investor with a unique set of characteristics Size Intergenerational investment horizon
Economic Outlook. Global And Finnish. Technology Industries In Finland Economic uncertainty has not had a major impact yet p. 5.
 Economic Outlook Technology Industries of 1 219 Global And Finnish Economic Outlook Uncertainty dims growth outlook p. 3 Technology Industries In Economic uncertainty has not had a major impact yet p.
Supplementary Financial Information Sampo Group. January - March 2009
 Supplementary Financial Information Sampo Group January - March 2009 Sampo Group in January March 2009 Sampo Group s profit before taxes amounted to EUR 169 million (142). EPS amounted to EUR 0.23 (0.18),
February market performance. Index. Index. Global economies
 March 2016 Global equity markets continued to correct through February but stage an early March recovery Oil prices staged a strong recovery from mid-february up 37% China economic data continued to consolidate
IFRS. Lifetime Performance. Financial information for 2004 according to IFRS standards
 IFRS Lifetime Performance Financial information for 2004 according to IFRS standards Wärtsilä s financial information for 2004 according to IFRS standards Wärtsilä Corporation has adopted the International
Financial Results for the Fiscal Year Ended March 31, 2012
 May 25, 2012 Financial Results for the Fiscal Year Ended March 31, 2012 Nippon Life Insurance Company (the Company or the Parent Company ; President: Yoshinobu Tsutsui) announces financial results for
What is the economic outlook for OECD countries?
 What is the economic outlook for OECD countries? An interim assessment Paris, 3 rd September 2009 11h00 Paris time Jørgen Elmeskov Acting Head of Economics Department Corporate bond spreads have come down
Financial Statements. Data. 1 Statutory Financial Statements 102
 Data 2 Financial Statements 1 Statutory Financial Statements 102 Balance Sheets 102 Statements of Operations 104 Statements of Changes in Net Assets 105 Statements of Cash Flows 107 Notes to Financial
OVERVIEW OF THE MACRO-ECONOMIC SITUATION IN TUNISIA. October 2015
 OVERVIEW OF THE MACRO-ECONOMIC SITUATION IN TUNISIA October 2015 Trend in the main macro-economic indicators 2007 2008 2009 2010 2011 2012 2013 2014 2015* Growth 6.3 4.5 3.1 3.2-1.9 3.9 2.4 2.3 1.0 Unemployment
Supplementary Financial Information Sampo Group. January - June 2009
 Supplementary Financial Information Sampo Group January - June 2009 Sampo Group in January June 2009 Sampo Group s profit before taxes amounted to EUR 433 million (422). EPS amounted to EUR 0.61 (0.60),
27 th Year of Publication. A monthly publication from South Indian Bank. To kindle interest in economic affairs... To empower the student community...
 Experience Next Generation Banking A monthly publication from South Indian Bank To kindle interest in economic affairs... To empower the student community... www.southindianbank.com Student s corner ho2099@sib.co.in
Unemployment Insurance Fund
 Unemployment Insurance Fund INTERIM REPORT 1 January 30 June 2017 Contents 1. Interim Report 1 Jan. 30 June 2017 3 1.1 Financial development 3 1.2 Managing Director s review 3 1.3 Operational environment
VIKING LINE'S INTERIM REPORT FOR THE PERIOD JANUARY - JUNE 2015
 1 of 11 21/8/ 10:40 µµ Source: Viking Line August 20, 02:00 ET VIKING LINE'S INTERIM REPORT FOR THE PERIOD JANUARY - JUNE Mariehamn, -08-20 08:00 CEST (GLOBE NEWSWIRE) -- Viking Line Abp INTERIM REPORT
Interim Report January-September. Revenue increased clearly
 Interim Report January-September Revenue increased clearly ETTEPLAN OYJ INTERIM REPORT OCTOBER 29, 2015, AT 2:00 PM ETTEPLAN Q3: REVENUE INCREASED CLEARLY Review period July-September 2015 The Group s
METSÄ BOARD CORPORATION INTERIM REPORT Q3/2015
 Page 1/29 METSÄ BOARD CORPORATION INTERIM REPORT Q3/2015 Page 2/29 METSÄ BOARD CORPORATION S OPERATING RESULT EXCLUDING NON-RECURRING ITEMS FOR JANUARY SEPTEMBER 2015 WAS EUR 144.8 MILLION RESULT FOR JANUARY
The case for infrastructure debt Infrastructure white paper series: Part 1. December 2017
 The case for infrastructure debt Infrastructure white paper series: Part 1 December 2017 2 Introduction to our infrastructure series Investors can access the infrastructure asset class in a number of ways:
Endowment Funds Performance (Year ending June 30 th, 2014)
") Endowment Funds Performance (Year ending June 30 th, 2014) prepared for Investment Subcommittee (Note: all returns and values are expressed in Canadian Dollars- CAD s) 1 Quarterly Market Overview Equity
Endowment Funds Performance (Year ending June 30 th, 2014) prepared for Investment Subcommittee (Note: all returns and values are expressed in Canadian Dollars- CAD s) 1 Quarterly Market Overview Equity
SAVINGS SÄÄSTÖPANKKIRYHMÄN
 SAVINGS SÄÄSTÖPANKKIRYHMÄN BANKS GROUP'S Half- Puolivuosikatsaus year Report 1 January-30 1.1.-30.6.2016 June 2016 SAVINGS BANKS GROUP'S HALF-YEAR REPORT 1 JANUARY-30 JUNE 2016 Table of contents Savings
Innovation Window. Technology Transfer Fund(s) / Accelerator Fund(s). The financial instrument(s) must be established as a closed-end fund.
 / Accelerator Fund(s). The financial instrument(s) must be established as a closed-end fund.") Innovation Window The Innovation Window of the Greek ESIF FoF follows and is complementary to the creation of the newly established Hellenic Foundation for Research and Innovation (ELIDEK) by the General
Innovation Window The Innovation Window of the Greek ESIF FoF follows and is complementary to the creation of the newly established Hellenic Foundation for Research and Innovation (ELIDEK) by the General
Municipality Finance Plc Financial Statements Bulletin
 14 February 2018, at 4:00 p.m. Municipality Finance Plc Financial Statements Bulletin 1 JANUARY 31 DECEMBER 2017 2017 in Brief The Group s net interest income grew by 10.9% year-on-year, totalling EUR
Financial Results for the Fiscal Year Ended March 31, 2016
 May 13, 2016 Financial Results for the Fiscal Year Ended March 31, 2016 The Dai-ichi Life Insurance Company, Limited (the "Company" or the "Parent Company"; President: Koichiro Watanabe) announces its
FINANCIAL STATEMENTS Timo Ritakallio, President and CEO Press Conference 19 Ferbuary 2016
 FINANCIAL STATEMENTS 2015 Timo Ritakallio, President and CEO Press Conference 19 Ferbuary 2016 1 ILMARINEN TAKES CARE OF THE PENSION COVER OF CLOSE TO 900,000 FINNS 500,500 employees 38 400 companies 61
FINANCIAL RESULTS 2018
 FINANCIAL RESULTS 2018 C E O J U H A N I E L O M A A 14 F E B R U A R Y 2019 AGENDA Taaleri in brief Financial results in 2018 Key figures Segment information Wealth Management Financing Energy Other Results,
Finland's Balance of Payments. Preliminary Review 2007
 Finland's Balance of Payments Preliminary Review 27 1 Current account, 198 27 1 Credit Net - -1 198 198 199 199 2 2 Current transfers Income Services Goods Curent account, net Debit Bank of Finland Financial
WULFF GROUP PLC S HALF-YEAR FINANCIAL REPORT FOR JANUARY 1 JUNE 30, 2017
 WULFF GROUP PLC HALF-YEAR FINANCIAL REPORT August 3, 2017 at 9:00 A.M. WULFF GROUP PLC S HALF-YEAR FINANCIAL REPORT FOR JANUARY 1 JUNE 30, 2017 Net sales declined and profitability decreased the outlook