Varma's Financial Statements 1 January 31 March April 2018 Varma s Interim Report 1 January 31 March 2018
|
|
|
- Oscar Owen
- 5 years ago
- Views:
Transcription

1 Varma's Financial Statements 1 January 31 March

2 Strong solvency and diversification offered protection in market turmoil Solvency capital, 11.1 bn Market value of investments, 45.7 bn Return on investments -0,4% 2

3 Value of investments EUR 45.7 billion 3
4 Investment returns Market volatility increased in the early part of the year, slightly lowering the return on Varma s investments. The average nominal return on investments over ten years is approx. 4.8 %, calculated in accordance with the recommendations issued by TELA. In 1-3/2017 return on investment was 2.7%. 4

5 Since the financial crisis, Varma s investments have yielded 82.9%, i.e. EUR 21.3 billion 5
6 Investments classified according to risk 31-March December / / / m Market value Market value Return Return Return Market Value Risk position Market Value Risk position MWR MWR MWR Vola- mill. % mill. % mill. % mill. % % % % tility Fixed-income investments 1 13, , , , Loan receivables 1, , , , Bonds 9, , , , Public bonds 4, , , , Other bonds 5, , , , Other money-market instruments and deposits 1, , , Equity investments 20, , , , Listed equities 16, , , , Private equity 3, , , , Unlisted equities , , Real estate investments 3, , , , Direct real estates 2, , , , Real estate funds Other investments 7, , , , Hedge funds 7, , , , Commodities Other investments 9 0 1, Total investments 45, , , , Impact of derivatives 2, Investment allocation at fair value 45, , , , The modified duration for all the bonds is 1.8. The open currency position is 28.5% of the market value of the investments. Includes accrued interest 6
7 Investment returns for Varma and the markets % Varma Finnish equities European equities US equities Euro government bonds Euro corporate bonds 3/ Average nominal return 5 years years Since 1999 * Average real return 5 years years Since 1999 * * Varma, as it is today, was founded in mid-1998, so comparison data earlier than 1999 is not available. Finnish equities = OMX Helsinki Cap Index European equities = Stoxx 600 Total Return Index EUR US equities= S&P500 Total Return Index Euro government bonds = IBOXX Eurozone EUR (Total Return) Euro corporate bonds = IBOXX Corporate Overall Performance Index EUR (Total Return) 7
8 Total result by quarter 8

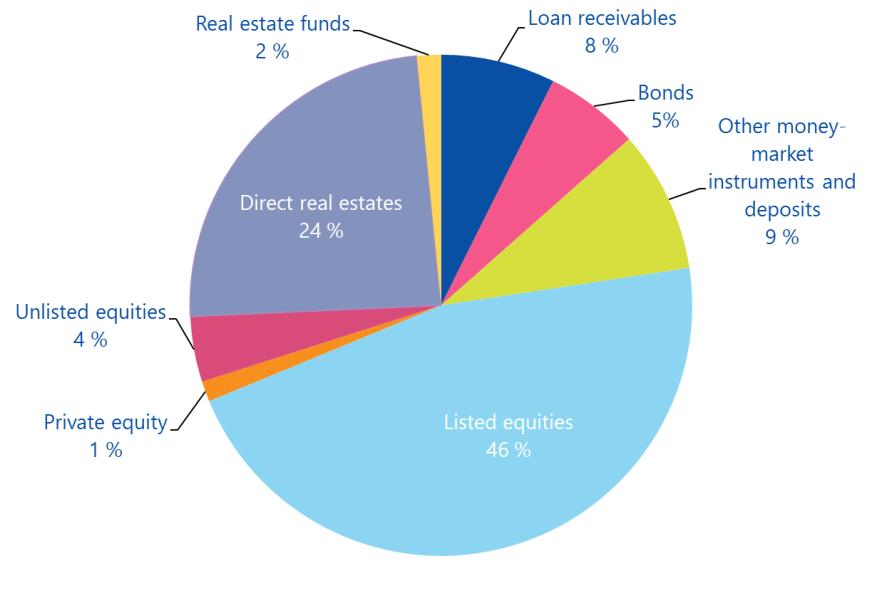
9 Investment allocation 9
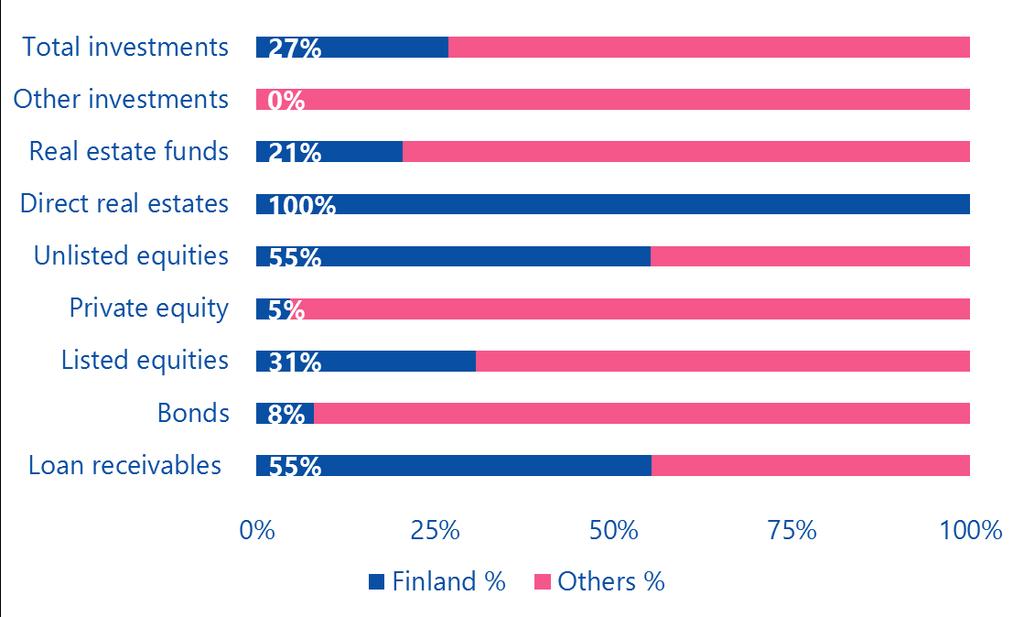
10 Investments in Finland 27%, 11.4 bn 10
11 Geographical distribution of investments 11

12 Geographical distribution of listed equities 12

13 Strong solvency offered protection against market fluctuations 13

14 Solvency remained strong 14

15 Loading profit We handle the implementation of pension provision efficiently. Loading profit, generated through efficient operations, and strong solvency have an impact on the bonuses paid to our clients. 15

16 Latest developments for customers 16

17 Insured employees and entrepreneurs 544,000 Pensioners 342,000 Pensions paid 1.33 bn 17

18 Old-age pension applications down 25% from previous year Pension applications are processed faster with the help of robotics Compared to the corresponding period last year Old-age pension applications fell 25% due to the rise in the retirement age. The popularity of partial old-age pension levelled off after the peak in A few years-of-service pension applications were received. Rehabilitation applications were up 22%. The number of new disability pension applications increased, a few dozen of which are estimated to have been submitted due to the so-called active model for unemployment security. Pension applications were processed faster than the previous year and the average in the sector. Software robotics and automation are used in the processing of applications. 18


19 We are preparing for the Incomes Register The Incomes Register is an electronic database to be introduced nationwide in 2019 that includes information about wages, pensions and benefits at the individual level. Employers report all earnings paid to employees to the Incomes Register. Co-operation The Incomes Register is a key project of the Finnish Government. Its success is also strategically important for Varma. Varma's experts have been actively involved in the different planning groups of the project. System changes Varma has planned and tested the system changes required by the Incomes Register. At the same time, systems and related processes will be revamped. New operating models Varma's experts are training customers and its own personnel in preparation for the change. Events and webinars are being arranged throughout the year. 19

20 CSR Topics 20

21 Responsible Varma ETHICAL AND TRANSPARENT BUSINESS We develop the responsibility of our business operations, e.g. in customer work and the supply chain. COST-EFFECTIVE USE OF FUNDS We take care of our customers earnings-related pension cover efficiently. OPEN AND PRO-ACTIVE COMMUNICATION We openly and pro-actively disclose information about our operations. Our use of pension assets is transparent. RESPONSIBILITY FOR VARMA EMPLOYEES We take care of Varma employees well-being at work and develop an inspiring work culture based on equality. Varma secures pensions Securing solvency We make profitable and secure investments. Strong solvency helps to secure pensions. RESPONSIBILITY IN INVESTMENT OPERATIONS Responsibility is an integral part of our investment decisions and ownership policy. High-quality implementation of pension provision Dealing with Varma is smooth, and customers receive decisions without delays. MITIGATING CLIMATE CHANGE We are reducing the CO 2 footprint of our investments and operations. Promoting workability and longer careers Our workability management and rehabilitation services prevent disability and lower disability costs. 21


22 Responsibility in Q1/2018 Strength in numbers Responsibility reporting CSR actions in 2018 Varma joined the following investor initiatives PRI Oil and Gas Engagement Access to Medicine index TCFD (Task Force on Climate-Related Financial Disclosures) We published a GRI-standard-compliant CSR Report for The Report of the Board of Directors also included an account of nonfinancial information. This year s areas of development responsible customer work further development of responsible investment in different asset classes equality and non-discrimination at Varma updating the CSR programme 22

23 Current economic issues 23

24 Current economic issues Strong economic growth continued, but uncertainty increased in Q1 The escalating trade war and strong stimulus in the US caused concerns Finland s E.g. trade war economic growth is expected to continue Rising employment rate is vital 24
25
Interim Report January-June August 2018 Varma s Interim Report 1 January 30 June 2018
 Interim Report January-June 2018 New record in the value of Varma s investments, 1.7% return in H1 Solvency capital, Market value of investments, Return on investments 11.4 bn 46.4 bn 1.7% Value of Varma
Varma s Interim Report 1 January 31 March Varma s Interim Report 1 January 31 March 2017
 Varma s Interim Report 1 January 31 March 2017 Good first quarter for Varma Solvency capital, 10.8 bn Market value of investments, 44.4 bn Return on investments 2.7% Value of investments grew to EUR 44.4
Varma s Interim Report 1 January 30 June Varma s Interim Report 1 January 30 June 2017
 Varma s Interim Report 1 January 30 June 2017 Strong result as economy recovers Solvency capital, 11.2 bn Market value of investments, 45.0 bn Return on investments 4.7% Investment returns 2008 2017 Investments
Varma s Financial Statement 2016
 Varma s Financial Statement 2016 15 February 2017 2016 a stable and strong year Solvency capital, 10.2 bn Market value of investments, 42.9 bn Return on investments 4.7% People insured and pensioners 870,000
Responsibility at Varma. Varma s Corporate Social Responsibility Programme 2017
 Responsibility at Varma 1 Vision. Responsibility is part of Varma s daily operations. We actively communicate what CSR means to us and how our responsible operations show in society. We continuously develop
Varma s Interim Report 1 January 30 September 2017
 1 (9) Varma s Interim Report 1 January 30 September 2017 The comparison figures in parentheses are from 30 September 2016, unless otherwise indicated. Total result amounted to EUR 1,262 (234) million.
Varma s Interim Report 1 January 30 June 2016
 Varma s Interim Report 1 January 30 June 2016 The comparison figures in parentheses are from 30 June 2015 unless otherwise indicated. Total result amounted to EUR 733 (700) million. The three-month return
Varma s Interim Report 1 January 30 September 2016
 1 (8) Varma s Interim Report 1 January 30 September 2016 The comparison figures in parentheses are from 30 September 2015 unless otherwise indicated. Total result amounted to EUR 234 ( 745) million. The
Varma s Interim Report 1 January 30 June 2017
 1 (11) Varma s Interim Report 1 January 30 June 2017 The comparison figures in parentheses are from 30 June 2016, unless otherwise indicated. Total result amounted to EUR 1,051 ( 733) million. The half-year
Varma s interim report 1 January 30 September 2018
 1 (9) Varma s interim report 1 January 30 September 2018 The comparison figures in parentheses are from 30 September 2017, unless otherwise indicated. Total result stood at EUR 108 (1,262) million. The
FINANCIAL STATEMENTS February 2014
 FINANCIAL STATEMENTS 213 27 February 214 1 ILMARINEN S KEY FIGURES FOR 213 Return on investments 9.8 per cent Value of investment assets: EUR 32.3 billion Solvency capital: EUR 7.1 billion Solvency ratio:
ANNUAL AND CSR REPORT
 ANNUAL AND CSR REPORT CONTENTS 4 4 6 The year President and CEO s Review The year in brief 8 Strategy and operating environment 12 Responsible Varma 15 15 18 20 Responsibility for pension assets Strong
Elo Mutual Pension Insurance Company Financial statements for 2014
 Elo Mutual Pension Insurance Company Financial statements for 2014 Key indicators Pro forma 31.12.2014 31.12.2013 31.12.2013 Company size Premiums written, EUR million 3,022.9 1,602.7 2,929.0 Pensions
ANNUAL AND CSR REPORT 2017
 ANNUAL AND CSR REPORT 2017 FOR CONTENTS 4 The year 2017 4 President and CEOʼs Review 6 The year in brief 8 Strategy and goals 11 Operating environment 15 Responsible Varma 18 Responsibility for pension
Elo Interim Report 1 January 30 September 2018
 Elo Interim Report 1 January 30 September 2018 The comparison figures in brackets are figures for 30 September 2017. Elo s return on investments was 2.2%. The market value of Elo s investments was EUR
ILMARINEN S INTERIM REPORT
 ILMARINEN S INTERIM REPORT 1 JANUARY 30 JUNE 2018 RETURN ON INVESTMENTS 1.1%, INTEGRATION PROCEEDED AS PLANNED JANUARY JUNE FINANCIAL PERFORMANCE IN BRIEF: In January June, the return on Ilmarinen s investment
FINANCIAL STATEMENTS Timo Ritakallio, President and CEO Press Conference 19 Ferbuary 2016
 FINANCIAL STATEMENTS 2015 Timo Ritakallio, President and CEO Press Conference 19 Ferbuary 2016 1 ILMARINEN TAKES CARE OF THE PENSION COVER OF CLOSE TO 900,000 FINNS 500,500 employees 38 400 companies 61
ILMARINEN S INTERIM REPORT
 ILMARINEN S INTERIM REPORT 1 JANUARY TO 30 SEPTEMBER 2017 GOOD INVESTMENT RESULT BOOSTS SOLVENCY JANUARY SEPTEMBER FINANCIAL PERFORMANCE IN BRIEF: In January September, Ilmarinen s investment portfolio
FINANCIAL STATEMENTS 2017
 FINANCIAL STATEMENTS 2017 Elo Mutual Pension Insurance Company Pro forma figures are the combined figures of Pension Fennia and LocalTapiola Pension Company. ELO S YEAR 2017 Elo reached the best result
REPORT ON OPERATIONS AND FINANCIAL STATE- MENTS 2017
 REPORT ON OPERATIONS AND FINANCIAL STATE- MENTS 2017 Ilmarinen Porkkalankatu 1, Helsinki FI-00018 Helsinki Porkkalagatan 1, Helsingfors Puh / Tfn / Tel +358 10 284 11 www.ilmarinen.fi 1 REPORT ON OPERATIONS
Report of the Board of Directors 2017
 15.2.2018 1/15 Report of the Board of Directors 2017 The economic operating environment The Finnish economy grew faster than expected in the financial year 2017. The broad-based recovery of the economy
ILMARINEN S INTERIM REPORT Q2 / Press conference 23 August 2012 Harri Sailas, President and CEO
 ILMARINEN S INTERIM REPORT Q2 / 2012 Press conference 23 August 2012 Harri Sailas, President and CEO KEY OBSERVATIONS SINCE JANUARY 2012 Moderate return on investments 3.3 per cent Long-term real return
Report of the Board of Directors 2018
 15 February 2019 1/15 Report of the Board of Directors 2018 The economic operating environment The economic year 2018 ended in a climate of restlessness Risks in the economic operating environment intensified
ILMARINEN JANUARY MARCH Press Conference 29 April 2016
 ILMARINEN JANUARY MARCH 2016 Press Conference 29 April 2016 1 Q1/2016: RETURN ON INVESTMENTS Timo Ritakallio, President and CEO 2 INVESTMENT RETURN DEPRESSED BY DECLINE IN SHARE PRICES January March 2016
Economic Outlook. Global And Finnish. Technology Industries In Finland Significant growth in the value of orders due to ship orders s.
 Economic Outlook Technology Industries of Finland 1 218 Global And Finnish Economic Outlook Good global economic outlook s. 3 Technology Industries In Finland Significant growth in the value of orders
REPORT OF THE BOARD OF DIRECTORS AND FINANCIAL STATEMENTS
 REPORT OF THE BOARD OF DIRECTORS AND FINANCIAL STATEMENTS Contents 3 Report of the Board of Directors 3 The economic operating environment 4 Earnings-related pension system 5 Varma s financial trends 6
Skanska. Building profitable growth
 Skanska Building profitable growth 1 We are Skanska 2 Skanska Investment Story Skanska is a world leader Construction and Project Development Focused on selected home markets in the Nordics, other European
Investment assets totalled EUR billion at the end of 2016 return for the past 20 years 4.3 per cent in real terms
 1/13 Investment assets totalled EUR 188.5 billion at the end of 2016 return for the past 20 years 4.3 per cent in real terms At the end of 2016, the total net amount of assets put into funds by earnings-related
Board of Directors Report 2013
 Board of Directors Report 213 A look back at 213 Despite an uncertain economy and investment climate, Veritas s investments yielded well during 213. Especially the favourable development in the share markets
Building for the future
 Building for the future Sanford C. Bernstein Pan-European Strategic Decisions Conference 18 September 2014 Christian Clausen, President and Group CEO Disclaimer This presentation contains forward-looking
People s livelihood is at the heart of Ilmarinen s business. In the end, it is all about our client companies employees. Securing their pensions is
 ilmarinen IN 2010 People s livelihood is at the heart of Ilmarinen s business. In the end, it is all about our client companies employees. Securing their pensions is the reason for Ilmarinen s existence.
CapMan alternative asset manager in the Nordic region and Russia
 CapMan alternative asset manager in the Nordic region and Russia Annual General Meeting 2010 Heikki Westerlund, CEO, CapMan Plc 30 March 2010 CapMan update Market environment Contents Financials 2009 2
IFRS. Lifetime Performance. Financial information for 2004 according to IFRS standards
 IFRS Lifetime Performance Financial information for 2004 according to IFRS standards Wärtsilä s financial information for 2004 according to IFRS standards Wärtsilä Corporation has adopted the International
Church Pension Fund s Guidelines for Responsible Investing
 Church Pension Fund s Guidelines for Responsible Investing Approved by the Board of the Church Pension Fund on 17 June 2014 Content 1 Introduction... 3 2 The Church Pension Fund as an investor... 3 3 The
Economic Outlook. Technology Industries In Finland Orders up since early autumn 2016 pg. 5
 Economic Outlook Technology Industries of Finland 1 217 Global And Finnish Economic Outlook Economic outlook is brightening up, but uncertainty persists pg. 3 Technology Industries In Finland Orders up
Finland's Balance of Payments. Preliminary Review 2007
 Finland's Balance of Payments Preliminary Review 27 1 Current account, 198 27 1 Credit Net - -1 198 198 199 199 2 2 Current transfers Income Services Goods Curent account, net Debit Bank of Finland Financial
Varma s responsible investment policy
 responsible investment policy Contents Varma s responsible investment policy for hedge investments 2 Varma s hedge investment portfolio 2 Assessing the fund management company 2 Hedge fund 3 Investments
Supplementary Financial Information Sampo Group. January-December 2010
 Supplementary Financial Information Sampo Group January-December 2010 Disclaimer This presentation may contain forward-looking statements that reflect management s current views with respect to certain
Municipality Finance Plc Financial Statements Bulletin
 9 February 2016 at 2 p.m. Municipality Finance Plc Financial Statements Bulletin 1 January 31 December 2015 2015 in Brief: The Group s net operating profit amounted to EUR 151.8 million (2014: EUR 144.2
AKTIA BANK PLC INTERIM REPORT 1-3/2014
 AKTIA BANK PLC INTERIM REPORT 1-3/2014 Strong Net commission income, Expenses down 4% Operating profit was EUR 16.4 (19.5) million. Net commission income was up 11% but NII down to EUR 25.4 (30.1) million.
BNP PARIBAS ASSET MANAGEMENT
 BNP PARIBAS ASSET MANAGEMENT Snakes and Ladders After playing snakes and ladders for the whole of 2017, the Euro Stoxx index (SX5E) made a new two-year high this week. The recent rally in the eurozone
COSME Financial Instruments for SMEs
 COSME Financial Instruments for SMEs Helsinki, 5 February 2015 Directorate-General for Internal Market, Industry, Entrepreneurship and SMEs (DG GROW) Unit F3: SME Access to Finance Astrid Bartels (Policy
REPORT ON OPERATIONS AND FINANCIAL STATEMENTS 2013
 REPORT ON OPERATIONS AND FINANCIAL STATEMENTS 2013 26 February 2014 Porkkalankatu 1, FI-00018 Ilmarinen Tel. +358 10 284 11 www.ilmarinen.fi 1. ECONOMIC DEVELOPMENT The weak performance of Finland s economy
EVLI EUROPEAN HIGH YIELD FUND
 EVLI EUROPEAN HIGH YIELD FUND FUND-SPECIFIC RULES The fund rules consist of fund-specific rules and common rules based on the UCITS IV Directive. 1 The Fund The name of the mutual fund will be Sijoitusrahasto
Adapting to Changes in Life Expectancy in the Finnish Earnings-Related
 Adapting to Changes in Life Expectancy in the Finnish Earnings-Related Pension Scheme Mikko Sankala Finnish Centre for Pensions mikko.sankala@etk.fi FI-00065 ELÄKETURVAKESKUS Finland Kaarlo Reipas Finnish
Skanska. Building profitable growth
 Skanska Building profitable growth 1 We are Skanska 2 Skanska Investment Story Skanska is a world leader Construction and Project Development Focused on selected home markets in the Nordics, other European
Green Bonds. Mumbai, January 2017 Senior Adviser Harald Francke Lund
 Green Bonds Mumbai, January 2017 Senior Adviser Harald Francke Lund Scientific basis Mitigation & costs Independent non-profit climate change research center International agreements & policy instruments
Supplementary Financial Information Sampo Group. January - March 2009
 Supplementary Financial Information Sampo Group January - March 2009 Sampo Group in January March 2009 Sampo Group s profit before taxes amounted to EUR 169 million (142). EPS amounted to EUR 0.23 (0.18),
Sampo Capital Markets Day London, 07 September Heikki Ilkka Nordea Group CFO
 Sampo Capital Markets Day London, 07 September 2017 Heikki Ilkka Nordea Group CFO Nordea in brief The largest financial services group in the Nordics Household market position #1 Corporate & Institutional
Finnish Industry Investment Ltd
 Finnish Industry Investment Ltd Consolidated financial statements 2018 Table of contents Financial statements Page Consolidated statement of comprehensive income 3 Consolidated statement of financial position
Annual report Content. Acting CEO and Managing Director s review of Report of the Board of Directors Administration
 2013 ANNUAL REPORT Annual report 2013 Content Acting CEO and Managing Director s review of 2013 2 Report of the Board of Directors 2013 4 Administration 2013 21 2 Acting CEO and Managing Director s review
Supplementary Financial Information Sampo Group. January - June 2009
 Supplementary Financial Information Sampo Group January - June 2009 Sampo Group in January June 2009 Sampo Group s profit before taxes amounted to EUR 433 million (422). EPS amounted to EUR 0.61 (0.60),
Pohjola Bank plc Financial Statements Bulletin for 1 January 31 December 2015
 Pohjola Bank plc Stock Exchange Release, 4 February 2016 at 09.00 am EET Financial Statements Bulletin Pohjola Bank plc Financial Statements Bulletin for 1 January 31 December 2015 Consolidated earnings
Economic Outlook. Global And Finnish. Technology Industries In Finland Turnover and orders picking up s. 5. Economic Outlook
 Economic Outlook Technology Industries of Finland 2 217 Global And Finnish Economic Outlook Broad-Based Global Economic Growth s. 3 Technology Industries In Finland Turnover and orders picking up s. 5
INTERIM REPORT 5 NOVEMBER 2015
 Q3 INTERIM REPORT JANUARY SEPTEMBER 2015 5 NOVEMBER 2015 Contents 3 Summary 5 Third quarter 2015 in brief 6 Change in reporting practices as of 1 January 2016 7 Business areas 7 P&C insurance 10 Associated
Pohjola Bank plc Interim Report for 1 January 30 June 2010
 Pohjola Bank plc s Interim Report for 1 January 1 Pohjola Bank plc Company Release, 4 August, 8.00 am Release category: Interim Report Pohjola Bank plc Interim Report for 1 January January June Year on
Finland's Balance of Payments. Annual Review 2007
 Finland's Balance of Payments Annual Review 27 Direct investment, stock 1998 27 9 8 7 6 5 4 3 2 1 1998 1999 2 21 22 23 24 25 26 27 In Finland (LHS) Abroad (LHS) In Finland, of GDP (RHS) Abroad, of GDP
Pohjola Bank plc s Interim report for 1 January 30 June 2014
 Pohjola Bank plc s Interim report for 1 January 30 June 2014 Pohjola Bank plc Stock exchange release 6 August 2014, 8.00 am Interim Report Pohjola Group Performance for January June 1) Consolidated earnings
Economic Outlook. Technology Industries In Finland Growth of new orders and tender requests stalled s. 4
 Economic Outlook Technology Industries of Finland 4 218 Global And Finnish Economic Outlook Growth continues to slow down s. 3 Technology Industries In Finland Growth of new orders and tender requests
NEI Investments Corporate Social Responsibility Report 2009
 NEI Investments Corporate Social Responsibility Report 2009 2 The Global Reporting Initiative The Global Reporting Initiative (GRI) has pioneered the development of the world s most widely-used sustainability
The Unemployment Insurance Fund s result for the financial year 2016 showed a surplus
 Unemployment Insurance Fund Financial Statement Release 21 March 2017 at 11:00 Unemployment Insurance Fund s (TVR) Financial Statement Release for 2016 The Unemployment Insurance Fund s result for the
REPORT ON OPERATIONS AND FINANCIAL STATEMENTS 2016
 REPORT ON OPERATIONS AND FINANCIAL STATEMENTS 2016 Ilmarinen Porkkalankatu 1, Helsinki FI-00018 Helsinki Porkkalagatan 1, Helsingfors Puh / Tfn / Tel +358 10 284 11 www.ilmarinen.fi 1 REPORT ON OPERATIONS
VERITAS PENSION INSURANCE ANNUAL ACCOUNTS 2014
 VERITAS PENSION INSURANCE ANNUAL ACCOUNTS 2014 Contents 2 7 Board of Directors Report 2014 8 Profit and Loss Account 9 10 Balance Sheet 11 Notes to the Profit and Loss Account 12 13 Notes to the Balance
Annual report Content. Review of 2012, CEO and Managing Director Merja Ailus 2 Report of the Board of Directors Administration
 2012 annual report Annual report 2012 Content Review of 2012, CEO and Managing Director Merja Ailus 2 Report of the Board of Directors 2012 4 Administration 2012 17 2 Review of 2012, CEO and Managing Director
NEST quarterly investment report
 NEST quarterly investment report July to September 2015 Fund facts Total size of assets under management 0.56bn Annual management charge/total expense ratio 0.3% Contribution charge 1.8% Pricing basis
TITLE SLIDE IS IN SENTENCE CASE. GREEN BACKGROUND.
 TITLE SLIDE IS IN SENTENCE CASE. GREEN BACKGROUND. BANK OF AMERICA MERRILL LYNCH CEO CONFERENCE António Horta-Osório 00 Month 0000 Presenters Name 29 September 2015 AGENDA A differentiated business model
EU Benchmarks Regulation and Market Impact as of 1 January 2018
 EU Benchmarks Regulation and Market Impact as of 1 January 2018 The new EU Benchmarks Regulation (BMR) was published in June 2016 and most rules will apply as of 1 January 2018. The BMR introduces new
Financial statement release, Jan-Dec 2016
 Financial statement release, Jan-Dec 2016 1 (15) Tulikivi Corporation Financial statements release 1 12/2016: Profitability improves, higher net sales in Finland 8 February 2017 at 1 p.m. - The Tulikivi
Half year financial report, 1-6/2016
 Half year financial report, 1-6/2016 1 (14) Tulikivi Corporation Half year financial report 1-6/2016: Net sales at last year s level, operational efficiency measures progress as planned 4 August 2016 at
Nordea Mortgage Bank Covered Bonds Investor presentation Q3 2017
 Nordea Mortgage Bank Covered Bonds Investor presentation Nordea Mortgage Bank Plc overview 100% owned subsidiary of Nordea Bank AB - the largest Nordic financial institution Operates as a mortgage credit
Interim Report, 1-3/2016
 rim Report, 1-3/2016 1 (14) Tulikivi Corporation rim report 1 3/2016: Net sales at last year s level, operational efficiency measures progress as planned 28 April 2016, at 1.00 p.m. - The Tulikivi Group
Combating the black economy seen as paramount at VVO
 Interim Report 1 January - 31 March 2012 Combating the black economy seen as paramount at VVO The black economy is one of the greatest challenges in the real estate and construction sector. At VVO, combating
Financial Statement Release Jan Dec 2015
 Financial Statement Release Jan Dec 2015 1 (15) Tulikivi Corporation Financial Statement Release 1 12/2015: Sales continued to be low, operational efficiency measures progressed as planned 5 February 2016
Age friendly goods and services an opportunity for social and economic development (Warsaw, October 2012)
") Age friendly goods and services an opportunity for social and economic development (Warsaw, 29-30 October 2012) Approach to active ageing for the next period 1 Marta Koucká Ministry of Labour and Social
Age friendly goods and services an opportunity for social and economic development (Warsaw, 29-30 October 2012) Approach to active ageing for the next period 1 Marta Koucká Ministry of Labour and Social
STRENGTHEN LEADING FRANCHISES
 STRENGTHEN LEADING FRANCHISES GLOBAL BANKING AND INVESTOR SOLUTIONS DIDIER VALET THE CURRENT CHALLENGES IN OUR ENVIRONMENT CREATE OPPORTUNITIES FOR 5 MAJOR EVOLUTIONS 1 2 3 Strengthened eurozone Changing
TYEL CONTRIBUTION AND WORK CAPACITY GO HAND IN HAND 3
 LARGE EMPLOYER S TYEL CONTRIBUTION 2018 1 CONTENTS TYEL CONTRIBUTION AND WORK CAPACITY GO HAND IN HAND 3 COMPONENTS OF YOUR TYEL CONTRIBUTION 5 Employees also contribute 5 As a large employer you belong
Financial Results for the Fiscal Year Ended March 31, 2015
 May 15, 2015 Financial Results for the Fiscal Year Ended March 31, 2015 The Dai-ichi Life Insurance Company, Limited (the "Company" or the "Parent Company"; President: Koichiro Watanabe) announces its
STATEMENT. Evaluation of the fair value of Sponda Plc s investment properties on 31 December 2009
 STATEMENT Evaluation of the fair value of Sponda Plc s investment properties on 31 December 2009 0 1 EVALUATION OF THE FAIR VALUE OF SPONDA PLC S INVESTMENT PROPERTIES Sponda Plc conducts its own quarterly
Focus on Opportunity. Regulatory Administration and Compliance Support Services For Hedge Funds and Private Equity Funds
 Focus on Opportunity Regulatory Administration and Compliance Support Services For Hedge Funds and Private Equity Funds The Dodd-Frank Wall Street Reform and Consumer Protection Act was signed into law
New strategy well under way, operating profit up in the second quarter
 Interim Report Q2 2015 2 STOCKMANN S INTERIM REPORT Q2 2015 STOCKMANN plc, Interim Report 29.4.2015 at 8.00 EET New strategy well under way, operating profit up in the second quarter April-June 2015: Consolidated
DANFOSS LAUNCHES A VOLUNTARY RECOMMENDED PUBLIC TENDER OFFER FOR ALL SHARES IN VACON 12 September 2014
 DANFOSS LAUNCHES A VOLUNTARY RECOMMENDED PUBLIC TENDER OFFER FOR ALL SHARES IN VACON 12 September 2014 PRESENTERS Panu Routila Chairman of the Board of Directors of Vacon Plc Niels B. Christiansen President
Financial. Statements
 Financial Statements 2015 Contents Report of the Board of Directors 1 Income statement 4 Balance sheet 5 Cash flow statement 7 Notes to the financial statements 8 Auditor s report 16 RAO Nordic Oy +358
Bayer Annual Report To our Stockholders Investor Information. Jan Feb Mar Apr May June July Aug Sep Oct Nov Dec
 Bayer Annual Report 2015 39 Performance of Bayer Stock in 2015 [Graphic 2.1] (Indexed; 100 = Xetra closing price on December 31, 2014; source: Bloomberg) 130 120 110 100 90 80 Jan Feb Mar Apr May June
Interim Report for January June 2009
 1 (7) Interim Report for January June 2009 Market overview The global economic downturn has significantly decreased the demand for Itella s services. In Finland, the logistic and mail volumes saw a sharp
2.5% SEK 3.3bn. SEK338bn. SEK 8.5bn. Return after expenses. into the pension system. Net assets. Net investment income
 Interim Report 2018 Vasakronan s real estate stock is valued at approximately SEK 130 billion and is owned jointly by the four AP Funds, AP1 AP4. Return after expenses 2.5% SEK 3.3bn into the pension system
MEAE guidelines and other publications 14/2017. OECD Guidelines for Multinational Enterprises - In Brief
 MEAE guidelines and other publications 14/2017 OECD Guidelines for Multinational Enterprises - In Brief Ministry of Economic Affairs and Employment Labour and Trade Department P.O. Box 32, FI-00023 Government,
Ecommerce logistics. L&G Ecommerce Logistics UCITS ETF. Part of the disruptive technology thematics range
 Intended for professional clients only. Ecommerce logistics L&G Ecommerce Logistics UCITS ETF Part of the disruptive technology thematics range Ecommerce logistics L&G Ecommerce Logistics UCITS ETF Key
1 UK outlook: Equities remain vulnerable to ongoing political uncertainty. 2 Fixed income: The bond markets are waiting for interest rates to rise
 UK outlook: Equities remain vulnerable to ongoing political uncertainty Fixed income: The bond markets are waiting for interest rates to rise 3 When bad news is good news: The eurozone has received its
Financial Results for the Fiscal Year Ended March 31, 2016
 May 13, 2016 Financial Results for the Fiscal Year Ended March 31, 2016 The Dai-ichi Life Insurance Company, Limited (the "Company" or the "Parent Company"; President: Koichiro Watanabe) announces its
Press Briefing on Capital Markets Activities Frankfurt, 13 December 2011
 Press Briefing on Capital Markets Activities 2011-2012 Frankfurt, 13 December 2011 Successfull Year 2011 (Figures as of 30.09.2011) High demand for KfW promotional funding Commitments of 52.9 bn EUR in
Economic situation and outlook
 Economic situation and outlook 2/215 ELECTRONICS AND ELECTROTECHNICAL INDUSTRY MECHANICAL ENGINEERING METALS INDUSTRY CONSULTING ENGINEERING INFORMATION TECHNOLOGY Global and Finnish Economic Outlook Divergence
Moving Forward to Better Serve Our Members. Last Five / Next Five Britt Harris, Chief Investment Officer
 Moving Forward to Better Serve Our Members Last Five / Next Five Britt Harris, Chief Investment Officer TRS IMD: Last Five Years As of 9/30/01 Last 5-Years Target Return 9.% 8.0% Risk 5.9% 11.0% Inflation
The Realdania Investment Strategy April 2016
 The Realdania Investment Strategy 2016-2019 April 2016 nv nv Introduction Realdania is a philanthropic association working to improve the quality of life and benefit the common good by improving the built
Vaisala Oyj Stock Exchange Release at (8)
") Vaisala Oyj Stock Exchange Release 08.08.2005 at 13.50 1(8) Interim Report 1.1.2005-30.6.2005 (6 months) - Net sales: EUR 81.9 million (EUR 80.8 million in 1-6/2004). - Operating profit: EUR 8.5 (8.6)
Vaisala Oyj Stock Exchange Release 08.08.2005 at 13.50 1(8) Interim Report 1.1.2005-30.6.2005 (6 months) - Net sales: EUR 81.9 million (EUR 80.8 million in 1-6/2004). - Operating profit: EUR 8.5 (8.6)
Municipality Finance Plc Financial Statements Bulletin
 14 February 2018, at 4:00 p.m. Municipality Finance Plc Financial Statements Bulletin 1 JANUARY 31 DECEMBER 2017 2017 in Brief The Group s net interest income grew by 10.9% year-on-year, totalling EUR
Changes to the corporate structure of Danske Bank
 Changes to the corporate structure of Danske Bank Danske Bank Plc will be merged to its Danish parent company Danske Bank A/S. The company to be merged: Danske Bank Plc Business ID: 1730744-7 Address:
POP Bank Group HALF-YEAR FINANCIAL REPORT
 POP Bank Group HALF-YEAR FINANCIAL REPORT 1 January 30 June 2017 CONTENT CEO S REVIEW... 3 Operating environment... 5 POP Bank Group and amalgamation of POP Banks... 5 Key events during the first half
Pohjola Bank plc s Financial Statements Bulletin for 1 January 31 December 2014
 Pohjola Bank plc s Financial Statements Bulletin for 1 January ember 2014 Pohjola Bank plc Stock Exchange Release 5 February 2015 at 8.00 am Financial Statements Bulletin Pohjola Group in 2014 1) Consolidated
Securing Pensions
 Annual Report 2001 Securing Pensions Contents 3 Varma-Sampo in brief 4 CEO S review 6 Electronic services grow 10 Challenging year for investment operations 14 We bear a great social responsibility 16
Main Indicators for the Finnish Economy
 BANK OF FINLAND Monetary Policy and Research - Financial Markets and Statistics Main Indicators for the Finnish Economy 11/1 1 November 1 1 November 1 Monetary Policy and Research - Financial Markets and