Accommodation and Food Services Sector Profile for the Lake Charles RLMA
|
|
|
- Emerald Wilkins
- 6 years ago
- Views:
Transcription

1 Food Services Sector Profile for the Lake Charles RLMA The Labor Market information (LMI) division of Research and Statistics helps provide information on various sectors in the regional economy. Reports and tables presented here can be accessed through our website at Data has been provided at the parish level where possible. Employment and Wage Trends 4th Quarter 2015 for the Food Services Sector by Parish This report is based on quarterly tax returns from all employers covered by unemployment insurance. Average Establishments by industry, Average Employment by Industry and total wages that employers have paid in the quarter are presented in the following tables. Average Establishments The table below illustrates the number of firms that are in the Food Services Sector in each of the six Lake Charles parishes. Share of the number of establishments in the Food Services Sector to all establishments in the parish provides information on the size of the sector. Of the 22 industry sectors, Food Services sector makes up o 7.79% of the Industrial make up in the Lake Charles RLMA o 8.31% in Allen Parish o 5.11% in Beauregard Parish o 8.55% in Calcasieu Parish o 1.58% in Cameron Parish o 5.42% in Jefferson Davis Parish o 8.67% in Vernon Parish 1 P age

2 Number of Establishments by Parish Parish Avg. Establishments Food Services Sector Industry Percent Food Services Sector Related Establishments Total Avg. Establishments All Industries Region % 8,022 Allen % 421 Beauregard % 705 Calcasieu % 5,003 Cameron % 190 Jefferson Davis % 757 Vernon % P age
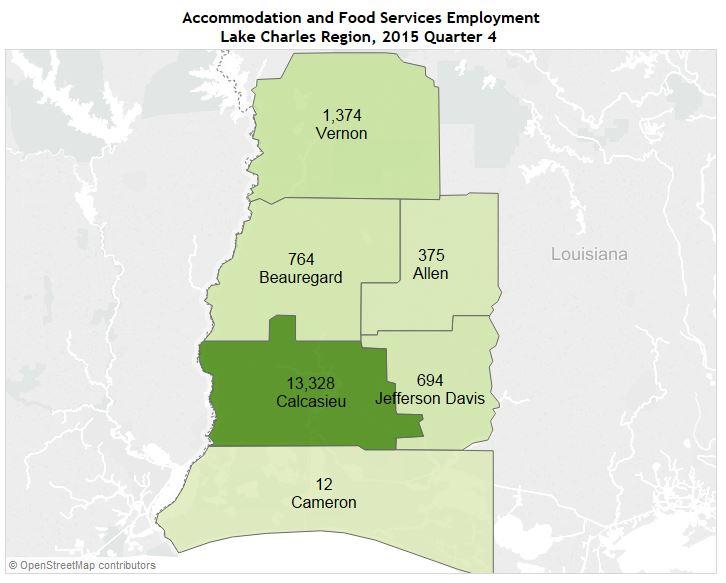
3 Average Employment The number of people employed in the specific sector illustrates the number of skilled workforce employed in that sector. Of the 22 Industry sectors Food Services sector employs o 12.65% of employment in the Lake Charles RLMA o 4.80% in Allen Parish o 8.67% in Beauregard Parish o 14.16% in St. James Parish o 0.16% in Cameron Parish o 8.03% in Jefferson Davis Parish o 10.18% in Vernon Parish Parish Number Employed by Parish Avg. Employment Food Services Industry Percent Food Services Related Employment Avg. Employment All Industries Region 5 17, % 140,144 Allen % 7,815 Beauregard % 8,808 Calcasieu 13, % 94,105 Cameron % 7,547 Jefferson Davis % 8,641 Vernon 1, % 13,228 3 P age
4 4 P age
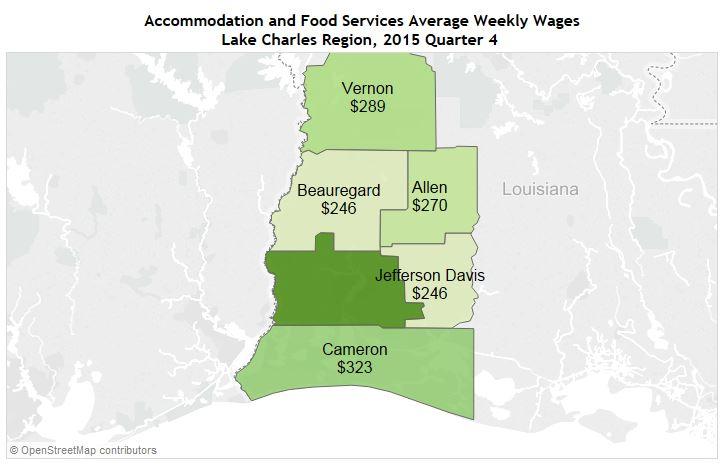
5 Total Wages Wages earned by people in the Food Services sector defines the contribution of the industry into the local economy. In the fourth quarter of 2015 Food Services Industry has contributed o Over 87 million dollars in wages for the Lake Charles RLMA o Over 1.3 million dollars in wages for Allen Parish o Over 2.4 million dollars in wages for Beauregard Parish o Over 76.0 million dollars in wages for Calcasieu Parish o Over 50.3 thousand dollars in wages for Cameron Parish o Over 2.2 million dollars in wages for Jefferson Davis Parish o Over 5.1 million dollars in wages for Vernon Parish Parish Total Wages Food Services Industry Total Wages by Parish Total Wages All Industry Percent Food Services Related Wages Avg. Weekly Wage Region 5 $87,240,665 $1,696,837, % $1,813 Allen $1,314,345 $69,096, % $270 Beauregard $2,447,565 $86,859, % $246 Calcasieu $76,038,962 $1,177,797, % $439 Cameron $50,350 $159,916, % $323 Jefferson Davis $2,222,366 $78,634, % $246 Vernon $5,167,077 $124,533, % $289 5 P age
6 6 P age
7 Job Openings in the Lake Charles RLMA 5 by Industry Sector in the Last Year Number of current job openings in Lake Charles shows the current demand for workforce in the region. The table below breaks down the number of job openings posted by employers in the Lake Charles by Industry. 5% percent of all job postings in the Lake Charles were in the sector Food Services Industry Sector Description Job Openings by Industry Total Job Openings Percent Job Openings of Total Food Services 582 5% Admin., Support, Waste Mgmt., Remediation 2,549 23% Agriculture, Forestry, Fishing & Hunting 487 4% Arts, Entertainment, and Recreation 459 4% Construction 407 4% Education Services 51 0% Finance and Insurance 677 6% Health Care and Social Assistance 1,087 10% Information 92 1% Local Government, Exc. Education, Hospitals 200 2% Manufacturing (31 33) 1,214 11% Manufacturing (31 33) 134 1% Manufacturing (31 33) 453 4% Mining 43 0% Other Services (except Public Admin.) 56 1% Professional Scientific & Technical Svc 830 7% Public Administration 87 1% Real Estate and Rental and Leasing 93 1% Retail Trade (44 & 45) 136 1% Retail Trade (44 & 45) 373 3% Supersectors and Totals 65 1% Transportation and Warehousing (48 & 49) 72 1% Transportation and Warehousing (48 & 49) 273 2% Utilities 475 4% Wholesale Trade 250 2% 11,145 7 P age
8 Region 5: 2016 Projected Employment by Industry 1 The Short term Industry forecasts developed by the Louisiana Workforce commission in conjunction with driver firms across Louisiana suggest that employment in the Food Services Industry is poised to grow by 8.0% in Region 5. Short Term Projections to 2016 NAICS Base Year 2016 Projected Employment Industry Sectors CODE Employment Employment Change Percent Change Food Services 72 12,330 13, % Accommodation 721 3,995 4, % Food services and drinking places 722 8,335 8, % Region 5: 2022 Projected Employment by Industry The long term Industry forecasts developed by the Louisiana Workforce commission in conjunction with driver firms across Louisiana suggest that employment in the Food Services Industry is poised to grow by 20.3% in Region 5. Long Term Projections to 2022 NAICS Base Year Projected 2022 Employment Industry Sectors CODE Employment Employment Change Percent Change Food 72 12,330 14,833 2, % Services Accommodation 721 3,995 5,076 1, % Food services and drinking places 722 8,335 9,757 1, % 1 Lake Charles Regional projections do not include Vernon Parish 8 P age
9 Region 5: Projections to 2022 of the High Demand Occupations by Most Significant Source of Education or Training 2 High demand occupations by the most significant education level and training are compiled using the long term projections for each region and the underlying staffing pattern for each Industry. The tables below show the most common occupations by education level the Food Services Industry requires sorted by total Annual openings. Region 5 Top Food Services Occupations for Bachelor s Degree Star Rating Bachelor s Degree Growing Occupations 1 Annual Mean Hourly Openings 2 Entry Level Wage General and Operations Managers 60 $20.87 Accountants and Auditors 40 $18.02 Sales Managers 10 $21.18 Chief Executives 0 $63.17 Region 5 Top Food Services Occupations for Associate s Degree Star Rating Associate s Degree Growing Occupations 1 Annual Openings 2 Mean Hourly Entry Level Wage Administrative Services Managers 10 $16.18 Food Service Managers 0 $14.30 Region 5 Top Food Services Occupations for Postsecondary Non Degree Award Postsecondary Annual Mean Hourly Star Rating Non Degree Award Growing Occupations 1 Openings 2 Entry Level Wage First Line Supervisors of Retail Sales Workers 50 $10.57 Insurance Claims and Policy Processing Clerks 10 $10.45 Shipping, Receiving, and Traffic Clerks 10 $8.70 Chefs and Head Cooks 0 $ Lake Charles Regional projections do not include Vernon Parish 9 P age
10 Region 5 Top Food Services Occupations for High School Equivalent Degree Star Rating High School Equivalent Degree Growing Occupations 1 Annual Openings 2 Mean Hourly Entry Level Wage Light Truck or Delivery Services Drivers 20 $8.14 Purchasing Agents, Except Wholesale, Retail, and Farm Products 10 $13.73 Executive Secretaries and Executive Administrative Assistants 10 $12.37 Payroll and Timekeeping Clerks 10 $12.24 First Line Supervisors of Housekeeping and Janitorial Workers 10 $10.05 First Line Supervisors of Food Preparation and Serving Workers 50 $9.31 First Line Supervisors of Personal Service Workers 10 $9.92 Social and Human Service Assistants 10 $8.25 Gaming Cage Workers 10 $9.60 Region 5 Top Food Services Occupations for Less Than High School Degree Star Mean Hourly Less Than High School Degree Annual Rating Growing Occupations 1 Openings 2 Entry Level Wage Laborers and Freight, Stock, and Material Movers, Hand 110 $8.07 Waiters and Waitresses 150 $7.61 Bartenders 40 $7.62 Dining Room and Cafeteria Attendants and Bartender Helpers 20 $7.54 Bakers 10 $ P age
11 Turnover Rates of the Food Services Industry, Lake Charles MSA % 23.6% 20.0% 16.4% 15.0% 10.0% 9.2% 9.3% 5.0% 0.0% 2010 Q Q Q Q Q Q Q Q Q Q Q Q Q Q Q Q Q Q1 Food Services All NAICS Sectors Average The figure above displays the turnover of the Food Services Industry compared to all of the industries in the Lake Charles MSA. A turnover rate is the rate at which stable jobs begin and end, according to QWI explorer. The quarterly turnover rate in this industry is close to five percent higher than the MSA average during this period, and it spikes noticeably in Quarter 1 of This suggests that there is a high amount of employee churn in the Food Services sector, and employment stints may be shorter in this industry than in other industries. Source: Turnover Information (revised 2015) Sources: 1: Labor Market Information 2022 Occupation Projections (revised 2015) 2: Labor Market Information 2022 Occupation Projections (revised 2015). Annual openings are new jobs plus replacements by occupation. The occupational projections were produced by analysts in the Labor Market Information Unit of the Research and Statistics Division of the Louisiana Workforce Commission. Refinement to the industry and occupational projections were provided by the LSU Division of Economic Development and Forecasting. Analysis uses industry staffing patterns data to review historical trends and to project future employment growth or decline of an occupation within a geographical area. Labor Market Information address: LMI@LWC.la.gov Labor Market Information Phone Number: P age
Metropolitan Chicago Region Overview of the Economy
 June 2013 Overview of the Economy This report is issued by The Workforce Boards of Metropolitan Chicago (WBMC) for the purpose of sharing economic and workforce development information for the metropolitan
Reference Point May 2015
 T. Rowe Price Defined Contribution Plan Data As of December 31, Insights It s evident participants are taking advantage of the loan feature in 401(k) plans. Currently, one-fourth of participants who can
Wisconsin Economic Development Corporation
 Wisconsin Economic Development Corporation 201 W. Washington Ave. Madison, Wisconsin 53707 608.267.4417 Analyst Report Economic Modeling Specialists, Inc. www.economicmodeling.com 1 Region Info Region:
LOUISIANA EMPLOYMENT AND WAGES October 2002
 LOUISIANA EMPLOYMENT AND WAGES 2001 M.J. Mike Foster, Jr. Governor Dawn Romero Watson, Secretary Louisiana Department of Labor Raj Jindal, Assistant Secretary of Labor Office of Occupational Information
The Graying of Hawaii s Workforce 2006
 The Graying of Hawaii s Workforce 2006 April 2008 Hawaii State Department of Labor and Industrial Relations Research and Statistics Office Quality Information for Informed Decisions Introduction The Graying
Rhode Island. A publication of the Labor Market Information Unit
 Rhode Island Employment & Wage Analysis 2012 A publication of the Labor Market Information Unit Summary of Findings The annual Rhode Island Employment and Wage Analysis report highlights Rhode Island s
In This Issue. h p://www.laworks.net. 2 Economic Comparison. 3-4 NSA State & Area Employment. 5 8 Data Trends (Graphs) 9 15 Nonfarm Employment
 9 15 Nonfarm Employment") h p://www.laworks.net In This Issue 2 Economic Comparison 3-4 NSA State & Area Employment 5 8 Data Trends (Graphs) 9 15 Nonfarm Employment 16 17 Unemployment Rates & Civilian Labor Force 18 Average Hours
h p://www.laworks.net In This Issue 2 Economic Comparison 3-4 NSA State & Area Employment 5 8 Data Trends (Graphs) 9 15 Nonfarm Employment 16 17 Unemployment Rates & Civilian Labor Force 18 Average Hours
SOUTH DAKOTA KIDS COUNT BEACOM SCHOOL OF BUSINESS UNIVERSITY OF SOUTH DAKOTA 414 E. CLARK STREET VERMILLION, SD
 Brookings County Compared to o SDSD Undergrad Enrollment approximately 11,225 o USD Undergrad Enrollment approximately 7,600 o Brookings County 1 year population estimate for 2013 is 32,968 o 1 year population
November 2018 Labor Market Review Reported by: Kathy Jaworski
 November 2018 Labor Market Review Reported by: Kathy Jaworski Regional Workforce Analyst Tel: 219-841-6347 Email Kathy kjaworski@dwd.in.gov Economic Growth Region 1 Statistical Data Report for November
In This Issue. h p:// United States Louisiana. Seasonally Adjusted. 2 Economic Comparison. 3-4 NSA State & Area Employment
 h p://www.laworks.net In This Issue 2 Economic Comparison 3-4 NSA State & Area Employment 5 8 Data Trends (Graphs) 9 15 Nonfarm Employment 16 17 Unemployment Rates & Civilian Labor Force 18 Average Hours
The Northeast Ohio 2014 Starting Wage and Benefit Survey. Fall Completed for. TeamNEO
 The Northeast Ohio 2014 Starting Wage and Benefit Survey Fall 2014 Completed for TeamNEO By The Corporate University Kent State University at Stark 6000 Frank Ave. NW North Canton, OH 44720 (330) 244-3508
Small Businesses in Broward There are 33,400 small businesses in Broward County, which provide 135,000 jobs and have a combined payroll of $4 billion.
 Planning Services Division February 2006 Number 43 Small Businesses in Broward There are 33,400 small businesses in Broward County, which provide 135,000 jobs and have a combined payroll of $4 billion.
Minnesota Energy Industry
 Energy Industry Jobs Q3 2000 Q3 2001 Q3 2002 Q3 2003 Q3 2004 Q3 2005 Q3 2006 Q3 2007 Q3 2008 Q3 2009 Q3 2010 Q3 2011 Q3 Q3 Q3 Q3 Q3 2016 Minnesota Energy Consortium April 13, 2017 Cameron Macht DEED Labor
Horry County. S.C. Department of Employment & Workforce. Business Intelligence Department
 S.C. Department of Employment & Workforce Business Intelligence Department 1550 Gadsden Street, PO Box 995 Columbia, SC 29202 803.737.2660 www.scworkforceinfo.com Updated: 07/21/2016 Table Of Contents
In This Issue. h p:// 2 Economic Comparison. 3-4 NSA State & Area Employment. 5 8 Data Trends (Graphs) 9 15 Nonfarm Employment
 9 15 Nonfarm Employment") h p://www.laworks.net In This Issue 2 Economic Comparison 3-4 NSA State & Area Employment 5 8 Data Trends (Graphs) 9 15 Nonfarm Employment 16 17 Unemployment Rates & Civilian Labor Force 18 Average Hours
h p://www.laworks.net In This Issue 2 Economic Comparison 3-4 NSA State & Area Employment 5 8 Data Trends (Graphs) 9 15 Nonfarm Employment 16 17 Unemployment Rates & Civilian Labor Force 18 Average Hours
Economy Overview Champaign-Urbana, IL
 Economy Overview Champaign-Urbana, IL Emsi Q4 Data Set November Illinois Emsi Q4 Data Set www.economicmodeling.com Page 1/15 Economy Overview Population () 240,355 Jobs () 100,288 Average Earnings () $53,770
In This Issue. h p://www.laworks.net. 2 Economic Comparison. 3-4 NSA State & Area Employment. 5 8 Data Trends (Graphs) 9 15 Nonfarm Employment
 9 15 Nonfarm Employment") h p://www.laworks.net In This Issue 2 Economic Comparison 3-4 NSA State & Area Employment 5 8 Data Trends (Graphs) 9 15 Nonfarm Employment 16 17 Unemployment Rates & Civilian Labor Force 18 Average Hours
h p://www.laworks.net In This Issue 2 Economic Comparison 3-4 NSA State & Area Employment 5 8 Data Trends (Graphs) 9 15 Nonfarm Employment 16 17 Unemployment Rates & Civilian Labor Force 18 Average Hours
Economy Overview Champaign County, IL
 Economy Overview Champaign County, IL Emsi Q4 2016 Data Set November 2016 Illinois Emsi Q4 2016 Data Set www.economicmodeling.com Page 1/17 Parameters Regions Code Description 17019 Champaign County, IL
County Economic Profile Jefferson Davis County, MS extension.msstate.edu/economic-profiles
 County Economic Profile Jefferson Davis County, MS extension.msstate.edu/economic-profiles Demographics Jefferson Davis Mississippi United States Total Population, 2016 (Census) 11,385 2,988,726 323,127,513
Oklahoma Department of Career and Technology Education
 Oklahoma Department of Career and Technology Education Information Commons October 2016 Kiamichi Technology Center - McAlester Economy Overview Report Emsi Q3 2016 Data Set www.economicmodeling.com Parameters
Year Projection
 LABOR FORCE CHARACTERISTICS Civilian Labor Force 2007 2008 2009 2010 2011 2012 2013 Q1 Unemployment Rate (for month & year use most recent information available and seasonally adjusted annual average 3.8
White Pine County Economic Overview
 Economic Overview Population (2016) 10,105 Jobs (2016) 4,597 Average Earnings (2016) $65,033 Unemployed (2/2016) 229 GRP (2014) $996,944,330 Exports (2014) $1,789,478,088 Imports (2014) $1,181,738,119
Industry Employment Projections. Overview of Employment Growth. Ashley Leach, Economist. 1 Projected Employment Growth by Substate Area
 2016-2026 Industry Employment Projections Ashley Leach, Economist The New Mexico Department of Workforce Solutions (NMDWS) Economic Research and Analysis Bureau (ER&A) produces long-term industry and occupational
Insolvency Statistics in Canada. September 2015
 Insolvency Statistics in Canada September 2015 List of Tables Table 1: Total Insolvencies... 1 Table 2: Insolvencies Filed by Consumers... 2 Table 3: Insolvencies Filed by Businesses... 3 Table 4: Insolvencies
METROPOLITAN REPORT Economic Indicators for the New Orleans Area
 METROPOLITAN REPORT Economic Indicars for the New Orleans Area Volume 26, No. 1 Indicars for the 2 nd Quarter through the 2 nd Quarter 2019 August 2017 List of Tables Table 1: U.S. Economic Indicars -
Overview of Pinellas County s Economy
 Overview of Pinellas County s Economy Mike Meidel, Director Pinellas County Economic Development October 30, 2014 1 Pinellas County Population 1,000,000 900,000 921,495 927,740 932,117 931,680 923,266
Michigan Economic Development Corporation
 Michigan Economic Development Corporation 300 N. Washington Square, Lower Level Lansing, Michigan 48913 888.522.0103 Economy Overview MEDC Region 2 Northwest Michigan Economic Modeling Specialists International
WorkFirst NJ. Quarterly Progress Update March 2017 DEPARTMENT OF HUMAN SERVICES DIVISION OF FAMILY DEVELOPMENT STATE OF NEW JERSEY
 WorkFirst NJ Quarterly Progress Update March 2017 STATE OF NEW JERSEY DEPARTMENT OF HUMAN SERVICES DIVISION OF FAMILY DEVELOPMENT Natasha Johnson Director Elizabeth Connolly Acting Commissioner WorkFirst
Economic Overview New York
 Report created on October 20, 2015 Economic Overview Created using: Contact: Lisa.Montiel@suny.edu DEMOGRAPHIC PROFILE...3 EMPLOYMENT TRENDS...5 UNEMPLOYMENT RATE...5 WAGE TRENDS...6 COST OF LIVING INDEX...6
County Economic Profile Oktibbeha County, Mississippi extension.msstate.edu/economic-profiles
 County Economic Profile Oktibbeha County, Mississippi extension.msstate.edu/economic-profiles Demographics Oktibbeha County, Mississippi Mississippi United States Total Population, 2015 (Census) 49,800
County Economic Profile Oktibbeha County, MS extension.msstate.edu/economic-profiles
 County Economic Profile Oktibbeha County, MS extension.msstate.edu/economic-profiles Demographics Oktibbeha Mississippi United States Total Population, 2016 (Census) 49,833 2,988,726 323,127,513 Percent
Economy Overview. Navarro County, TX. Emsi Q Data Set
 Economy Overview Navarro County, TX Emsi Q3 2017 Data Set www.economicmodeling.com Economy Overview Contents. Economy........ Overview.........................................................................................
Economy Overview. Navarro County, TX. Emsi Q Data Set
 Economy Overview Navarro County, TX Emsi Q4 2017 Data Set www.economicmodeling.com Economy Overview Contents. Economy........ Overview.........................................................................................
Economic Overview Long Island
 Report created on October 20, 2015 Economic Overview Long Island Created using: Contact: Lisa.Montiel@suny.edu DEMOGRAPHIC PROFILE...3 EMPLOYMENT TRENDS...5 UNEMPLOYMENT RATE...5 WAGE TRENDS...6 COST OF
Economic Overview Fairfax / Falls Church. October 23, 2017
 Economic Overview Fairfax / Falls Church October 23, 2017 DEMOGRAPHIC PROFILE... 3 EMPLOYMENT TRENDS... 5 UNEMPLOYMENT RATE... 5 WAGE TRENDS... 6 COST OF LIVING INDEX... 6 INDUSTRY SNAPSHOT... 7 OCCUPATION
The Secure Choice Retirement Savings Program. Compiled by the Office of the Illinois State Treasurer Treasurer Michael W. Frerichs
 The Secure Choice Retirement Savings Program Compiled by the Office of the Illinois State Treasurer Treasurer Michael W. Frerichs Retirement Security What is Secure Choice? Economic Impact and Benefits
Businesses in Kentucky
 Black-Owned Businesses in Kentucky Old Capitol Annex 3 West Broadway Frankfort, KY 6-975 Phone 52.56.7 Fax 52.56.3256 www.thinkkentucky.com TABLE OF CONTENTS Summary of Findings.................................................
Michigan Economic Development Corporation
 Michigan Economic Development Corporation 300 N. Washington Square, Lower Level Lansing, Michigan 48913 888.522.0103 Economy Overview MEDC Region 3 Northeast Michigan Economic Modeling Specialists International
Insolvency Statistics in Canada. April 2013
 Insolvency Statistics in Canada April 2013 List of Tables Table 1: Total Insolvencies... 1 Table 2: Insolvencies Filed by Consumers... 2 Table 3: Insolvencies Filed by Businesses... 3 Table 4: Insolvencies
Economic Overview City of Tyler, TX. January 8, 2018
 Economic Overview City of Tyler, TX January 8, 2018 DEMOGRAPHIC PROFILE...3 EMPLOYMENT TRENDS...5 WAGE TRENDS...5 COST OF LIVING INDEX...6 INDUSTRY SNAPSHOT...7 OCCUPATION SNAPSHOT...9 INDUSTRY CLUSTERS...
June 9, Economic Overview Billings, MT MSA
 June 9, 2016 Economic Overview Billings, MT MSA DEMOGRAPHIC PROFILE... 3 EMPLOYMENT TRENDS... 5 UNEMPLOYMENT RATE... 5 WAGE TRENDS... 6 COST OF LIVING INDEX... 6 INDUSTRY SNAPSHOT... 7 OCCUPATION SNAPSHOT...
WORK FIRST NJ. Quarterly Progress Update March 2013
 WORK FIRST NJ Quarterly Progress Update March 2013 NEW JERSEY DEPARTMENT OF HUMAN SERVICES Division of Family Development Jeanette Page-Hawkins Director Jennifer Velez Commissioner 2 Work First New Jersey
Economic Overview Monterey County, California. July 22, 2016
 Economic Overview Monterey July 22, 2016 DEMOGRAPHIC PROFILE... 3 EMPLOYMENT TRENDS... 5 UNEMPLOYMENT RATE... 5 WAGE TRENDS... 6 COST OF LIVING INDEX... 6 INDUSTRY SNAPSHOT... 7 OCCUPATION SNAPSHOT...
Nevada Commerce Tax Narrative. Prepared by Commerce Tax Division
 Nevada Commerce Tax Narrative Prepared by Commerce Tax Division Commerce Tax Highlights Annual tax on business entities engaged in business in Nevada Each business entity engaged in business in Nevada
Sussex Demographic and Labor Market Trends
 Sussex Demographic and Labor Market Trends Ed Simon (302) 672-6845 edward.simon@state.de.us October 2013 Introduction Statistical Update Differences among the regions in Sussex Demographic, economic and
Oxford County Labour Market Overview
 ELGIN MIDDLESEX OXFORD WORKFORCE PLANNING AND DEVELOPMENT BOARD Oxford County Labour Market Overview Literacy Service Providers Discussion By Debra Mountenay 2014 This Employment Ontario project is funded
The Election Economy. November 29, City of Georgetown
 The Election Economy November 29, 2016 City of Georgetown More Growth Coming Why are people moving here? Citizens Quality of Life Planning for Growth 100% Renewable Energy by 2018 Transportation Investments
November 2018 Labor Market Review Reported by: Kent Sellers
 November 2018 Labor Market Review Reported by: Kent Sellers Regional Workforce Analyst Tel: 260-469-4313 Email Kent wsellers@dwd.in.gov Economic Growth Region 6 Statistical Data Report for November 2018,
Economic Overview York County, South Carolina. February 14, 2018
 Economic Overview York County, February 14, 2018 DEMOGRAPHIC PROFILE... 3 EMPLOYMENT TRENDS... 5 UNEMPLOYMENT RATE... 5 WAGE TRENDS... 6 COST OF LIVING INDEX... 6 INDUSTRY SNAPSHOT... 7 OCCUPATION SNAPSHOT...
County Economic Profile Warren County, MS extension.msstate.edu/economic-profiles
 County Economic Profile Warren County, MS extension.msstate.edu/economic-profiles Demographics Warren Mississippi United States Total Population, 2016 (Census) 47,140 2,988,726 323,127,513 Percent Change
Average Worker Earnings. Location Quotient. NAICS Code
 Relative Concentration by County: Hospitality County 2012 Jobs Average Worker Earnings Location Quotient NAICS Industry Employment Breakdown: Hospitality Sector Name 2012 Jobs Location Quotient Denver,
Michigan Economic Development Corporation
 Michigan Economic Development Corporation 300 N. Washington Square, Lower Level Lansing, Michigan 48913 888.522.0103 Economy Overview MEDC Region 2 Northwest Michigan Economic Modeling Specialists International
Economic Overview Loudoun County, Virginia. October 23, 2017
 Economic Overview October 23, 2017 DEMOGRAPHIC PROFILE... 3 EMPLOYMENT TRENDS... 5 UNEMPLOYMENT RATE... 5 WAGE TRENDS... 6 COST OF LIVING INDEX... 6 INDUSTRY SNAPSHOT... 7 OCCUPATION SNAPSHOT... 9 INDUSTRY
SELECTED ECONOMIC CHARACTERISTICS American Community Survey 5-Year Estimates
 DP03 SELECTED ECONOMIC CHARACTERISTICS 2008-2012 American Community Survey 5-Year Estimates Supporting documentation on code lists, subject definitions, data accuracy, and statistical testing can be found
DEMOGRAPHIC PROFILE...3 EMPLOYMENT TRENDS...5 UNEMPLOYMENT RATE...5 WAGE TRENDS...6 COST OF LIVING INDEX...6 INDUSTRY SNAPSHOT...7
 March 14, 2017 DEMOGRAPHIC PROFILE...3 EMPLOYMENT TRENDS...5 UNEMPLOYMENT RATE...5 WAGE TRENDS...6 COST OF LIVING INDEX...6 INDUSTRY SNAPSHOT...7 OCCUPATION SNAPSHOT...9 INDUSTRY CLUSTERS... 12 EDUCATION
October Mid-Del Technology Center. Economy Overview
 October 2017 Mid-Del Technology Center Economy Overview Parameters Regions Code Description 40109 Oklahoma County, OK Timeframe 2001-2016 Datarun 2017.3 QCEW Employees, Non-QCEW Employees, and Self-Employed
Economic Overview Long Island
 Report created on August 29, 2017 Economic Overview Long Island Contact: Lisa.Montiel@suny.edu DEMOGRAPHIC PROFILE... 3 EMPLOYMENT TRENDS... 5 UNEMPLOYMENT RATE... 5 WAGE TRENDS... 6 COST OF LIVING INDEX...
Sussex Demographic and Labor Market Trends
 Sussex Demographic and Labor Market Trends Ed Simon (302) 672-6845 edward.simon@state.de.us October 2012 Introduction Statistical Update Economic and labor market update for 2012 Is Sussex doing better?
2016 Labor Market Profile
 2016 Labor Market Profile Prepared by The Tyler Economic Development Council Tyler Area Sponsor June 2016 The ability to demonstrate a regions availability of talented workers has become a vital tool
Economic Overview Western New York
 Report created on August 29, 2017 Economic Overview Western New Contact: Lisa.Montiel@suny.edu DEMOGRAPHIC PROFILE... 3 EMPLOYMENT TRENDS... 5 UNEMPLOYMENT RATE... 5 WAGE TRENDS... 6 COST OF LIVING INDEX...
October 28, Economic Overview Yellowstone County, Montana
 October 28, 2016 Economic Overview Yellowstone DEMOGRAPHIC PROFILE...3 EMPLOYMENT TRENDS...5 UNEMPLOYMENT RATE...5 WAGE TRENDS...6 COST OF LIVING INDEX...6 INDUSTRY SNAPSHOT...7 OCCUPATION SNAPSHOT...9
Economic Overview Marlboro County Labor Shed. June 29, 2016
 Economic Overview Marlboro County Labor June 29, 2016 DEMOGRAPHIC PROFILE...3 EMPLOYMENT TRENDS...5 UNEMPLOYMENT RATE...5 WAGE TRENDS...6 COST OF LIVING INDEX...6 INDUSTRY SNAPSHOT...7 OCCUPATION SNAPSHOT...9
Michigan Economic Development Corporation
 Michigan Economic Development Corporation 300 N. Washington Square, Lower Level Lansing, Michigan 48913 888.522.0103 Economy Overview MEDC Region 5 East Central Michigan Economic Modeling Specialists International
Regional Prosperity Initiative: Labor Market Information Supplement
 Regional Prosperity Initiative: Labor Market Information Supplement Prepared For: (Region 6) (Genesee, Huron, Lapeer, Sanilac, Shiawassee, St. Clair, and Tuscola) Prepared By: State of Michigan Department
Economic Overview. Lawrence, KS MSA
 Economic Overview Lawrence, KS MSA March 5, 2019 DEMOGRAPHIC PROFILE... 3 EMPLOYMENT TRENDS... 5 UNEMPLOYMENT RATE... 5 WAGE TRENDS... 6 COST OF LIVING INDEX... 7 INDUSTRY SNAPSHOT... 8 OCCUPATION SNAPSHOT...
EMPLOYEES UNDER LABOUR CONTRACT AND GROSS AVERAGE WAGES AND SALARIES, FOURTH QUARTER OF 2016
 EMPLOYEES UNDER LABOUR CONTRACT AND GROSS AVERAGE WAGES AND SALARIES, FOURTH QUARTER OF 2016 According to the preliminary data of the National Statistical Institute (NSI) at the end of December 2016 the
September Caddo Kiowa Technology Center. Economy Overview
 September 2017 Caddo Kiowa Technology Center Economy Overview Parameters Regions Code Description 40015 Caddo County, OK 40051 Grady County, OK 40075 Kiowa County, OK Timeframe 2001-2016 Datarun 2017.3
Figure 1. Gross average wages and salaries by months
 EMPLOYEES UNDER LABOUR CONTRACT AND GROSS AVERAGE WAGES AND SALARIES, FIRST QUARTER OF 2018 According to the preliminary data of the National Statistical Institute (NSI) at the end of March 2018 the number
Community Colleges of Spokane
 Community Colleges of Spokane 501 N Riverpoint Blvd Spokane, Washington 99217 Economy Overview CCS Northern Service Area Economic Modeling Specialists International www.economicmodeling.com Page 1/14 Report
Economic Overview Capital District
 August 29, 2017 Economic Overview Capital District Contact: Lisa.Montiel@suny.edu DEMOGRAPHIC PROFILE... 3 EMPLOYMENT TRENDS... 5 UNEMPLOYMENT RATE... 5 WAGE TRENDS... 6 COST OF LIVING INDEX... 6 INDUSTRY
ECONOMIC AND FISCAL IMPACT OF A WAL-MART DISTRIBUTION CENTER IN OPELOUSAS, LOUISIANA AUGUST 2008
 ECONOMIC AND FISCAL IMPACT OF A WAL-MART DISTRIBUTION CENTER IN OPELOUSAS, LOUISIANA AUGUST 2008 EXECUTIVE SUMMARY Wal-Mart opened a distribution facility in Opelousas, Louisiana in 2000. The facility
Economic Overview Mohawk Valley
 Report created on August 29, 2017 Economic Overview Mohawk Valley Contact: Lisa.Montiel@suny.edu DEMOGRAPHIC PROFILE... 3 EMPLOYMENT TRENDS... 5 UNEMPLOYMENT RATE... 5 WAGE TRENDS... 6 COST OF LIVING INDEX...
A Profile of Workplaces in Waterloo Region
 A Profile of Workplaces in Waterloo Region March 2010 Overview This report is a reference document for the Region of Waterloo Public Health s workplace health initiative, Project Health (http://www.projecthealth.ca),
For Immediate Release April 15, 2015
 For Immediate Release April 15, 2015 Nevada s Unemployment Rate Holds Steady at 7.1 Percent in March Metro area labor market information will be released April 21st as part of a new reporting schedule
American Community Survey 5-Year Estimates
 DP03 SELECTED ECONOMIC CHARACTERISTICS 2013-2017 American Community Survey 5-Year Estimates Supporting documentation on code lists, subject definitions, data accuracy, and statistical testing can be found
The Economic Base of Valencia County, NM. PREPARED BY: The Office of Policy Analysis at Arrowhead Center, New Mexico State University.
 The Economic Base of Valencia County, NM PREPARED BY: The Office of Policy Analysis at Arrowhead Center, New Mexico State University DATE: July 2017 DATE: September 2013 The Economic Base of Valencia County,
Tell us what you think. Provide feedback to help make American Community Survey data more useful for you.
 DP03 SELECTED ECONOMIC CHARACTERISTICS 2016 American Community Survey 1-Year Estimates Supporting documentation on code lists, subject definitions, data accuracy, and statistical testing can be found on
The Gender Wage Gap by Occupation
 IWPR Publication #C350a April 2009 The Gender Wage Gap by Occupation During the last several decades women s participation in the workforce has steadily increased, with women now accounting for almost
American Community Survey 5-Year Estimates
 DP03 SELECTED ECONOMIC CHARACTERISTICS 2012-2016 American Community Survey 5-Year Estimates Supporting documentation on code lists, subject definitions, data accuracy, and statistical testing can be found
American Community Survey 5-Year Estimates
 DP03 SELECTED ECONOMIC CHARACTERISTICS 2012-2016 American Community Survey 5-Year Estimates Supporting documentation on code lists, subject definitions, data accuracy, and statistical testing can be found
American Community Survey 5-Year Estimates
 DP03 SELECTED ECONOMIC CHARACTERISTICS 2012-2016 American Community Survey 5-Year Estimates Supporting documentation on code lists, subject definitions, data accuracy, and statistical testing can be found
American Community Survey 5-Year Estimates
 DP03 SELECTED ECONOMIC CHARACTERISTICS 2012-2016 American Community Survey 5-Year Estimates Supporting documentation on code lists, subject definitions, data accuracy, and statistical testing can be found
American Community Survey 5-Year Estimates
 DP03 SELECTED ECONOMIC CHARACTERISTICS 2012-2016 American Community Survey 5-Year Estimates Supporting documentation on code lists, subject definitions, data accuracy, and statistical testing can be found
American Community Survey 5-Year Estimates
 DP03 SELECTED ECONOMIC CHARACTERISTICS 2012-2016 American Community Survey 5-Year Estimates Supporting documentation on code lists, subject definitions, data accuracy, and statistical testing can be found
American Community Survey 5-Year Estimates
 DP03 SELECTED ECONOMIC CHARACTERISTICS 2012-2016 American Community Survey 5-Year Estimates Supporting documentation on code lists, subject definitions, data accuracy, and statistical testing can be found
American Community Survey 5-Year Estimates
 DP03 SELECTED ECONOMIC CHARACTERISTICS 2012-2016 American Community Survey 5-Year Estimates Supporting documentation on code lists, subject definitions, data accuracy, and statistical testing can be found
American Community Survey 5-Year Estimates
 DP03 SELECTED ECONOMIC CHARACTERISTICS 2012-2016 American Community Survey 5-Year Estimates Supporting documentation on code lists, subject definitions, data accuracy, and statistical testing can be found
American Community Survey 5-Year Estimates
 DP03 SELECTED ECONOMIC CHARACTERISTICS 2012-2016 American Community Survey 5-Year Estimates Supporting documentation on code lists, subject definitions, data accuracy, and statistical testing can be found
American Community Survey 5-Year Estimates
 DP03 SELECTED ECONOMIC CHARACTERISTICS 2012-2016 American Community Survey 5-Year Estimates Supporting documentation on code lists, subject definitions, data accuracy, and statistical testing can be found
American Community Survey 5-Year Estimates
 DP03 SELECTED ECONOMIC CHARACTERISTICS 2012-2016 American Community Survey 5-Year Estimates Supporting documentation on code lists, subject definitions, data accuracy, and statistical testing can be found
American Community Survey 5-Year Estimates
 DP03 SELECTED ECONOMIC CHARACTERISTICS 2012-2016 American Community Survey 5-Year Estimates Supporting documentation on code lists, subject definitions, data accuracy, and statistical testing can be found
American Community Survey 5-Year Estimates
 DP03 SELECTED ECONOMIC CHARACTERISTICS 2012-2016 American Community Survey 5-Year Estimates Supporting documentation on code lists, subject definitions, data accuracy, and statistical testing can be found
American Community Survey 5-Year Estimates
 DP03 SELECTED ECONOMIC CHARACTERISTICS 2012-2016 American Community Survey 5-Year Estimates Supporting documentation on code lists, subject definitions, data accuracy, and statistical testing can be found
American Community Survey 5-Year Estimates
 DP03 SELECTED ECONOMIC CHARACTERISTICS 2012-2016 American Community Survey 5-Year Estimates Supporting documentation on code lists, subject definitions, data accuracy, and statistical testing can be found
American Community Survey 5-Year Estimates
 DP03 SELECTED ECONOMIC CHARACTERISTICS 2012-2016 American Community Survey 5-Year Estimates Supporting documentation on code lists, subject definitions, data accuracy, and statistical testing can be found
American Community Survey 5-Year Estimates
 DP03 SELECTED ECONOMIC CHARACTERISTICS 2012-2016 American Community Survey 5-Year Estimates Supporting documentation on code lists, subject definitions, data accuracy, and statistical testing can be found
American Community Survey 5-Year Estimates
 DP03 SELECTED ECONOMIC CHARACTERISTICS 2012-2016 American Community Survey 5-Year Estimates Supporting documentation on code lists, subject definitions, data accuracy, and statistical testing can be found
American Community Survey 5-Year Estimates
 DP03 SELECTED ECONOMIC CHARACTERISTICS 2012-2016 American Community Survey 5-Year Estimates Supporting documentation on code lists, subject definitions, data accuracy, and statistical testing can be found
American Community Survey 5-Year Estimates
 DP03 SELECTED ECONOMIC CHARACTERISTICS 2012-2016 American Community Survey 5-Year Estimates Supporting documentation on code lists, subject definitions, data accuracy, and statistical testing can be found
American Community Survey 5-Year Estimates
 DP03 SELECTED ECONOMIC CHARACTERISTICS 2012-2016 American Community Survey 5-Year Estimates Supporting documentation on code lists, subject definitions, data accuracy, and statistical testing can be found