The Virginia Tech U.S. Forest Service November 2018 Housing Commentary: Section II
|
|
|
- Lora Fisher
- 5 years ago
- Views:
Transcription

1 The Virginia Tech U.S. Forest Service November 2018 Housing Commentary: Section II Urs Buehlmann Department of Sustainable Biomaterials College of Natural Resources & Environment Virginia Tech Blacksburg, VA Delton Alderman Forest Products Marketing Unit Forest Products Laboratory U.S. Forest Service Madison, WI Virginia Polytechnic Institute and State University CNRE-46NP Virginia Cooperative Extension programs and employment are open to all, regardless of age, color, disability, gender, gender identity, gender expression, national origin, political affiliation, race, religion, sexual orientation, genetic information, veteran status, or any other basis protected by law. An equal opportunity/affirmative action employer. Issued in furtherance of Cooperative Extension work, Virginia Polytechnic Institute and State University, Virginia State University, and the U.S. Department of Agriculture cooperating. Edwin J. Jones, Director, Virginia Cooperative Extension, Virginia Tech, Blacksburg; M. Ray McKinnie, Administrator, 1890 Extension Program, Virginia State University, Petersburg.
2 Table of Contents Slide 3: Federal Reserve System Indicators Slide 50: Private Indicators Slide 106: Demographics Slide 111: Economics Slide 123: Virginia Tech Disclaimer Slide 124: USDA Disclaimer
 in the fourth quarter of 2018 is 1.5 percent on February 14, down from 2.")
3 U.S. Economic Indicators Atlanta Fed GDPNow Latest forecast: 1.5 percent February 14, 2019 The GDPNow model estimate for real GDP growth (seasonally adjusted annual rate) in the fourth quarter of 2018 is 1.5 percent on February 14, down from 2.7 percent on February 6. After this morning's retail sales and retail inventories releases from the U.S. Census Bureau, the nowcast of fourth-quarter real personal consumption expenditures growth fell from 3.7 percent to 2.6 percent, and the nowcast of the contribution of inventory investment to fourth-quarter real GDP growth fell from percentage points to percentage points. Pat Higgins, Economist, Federal Reserve Bank of Atlanta Source: 2/14/19

4 The Federal Reserve Bank of Chicago: Midwest Economy Index Index Points to a Slight Increase in Midwest Economic Growth in December The Midwest Economy Index (MEI) moved up slightly to in December from in November. Contributions to the December MEI from two of the four broad sectors of nonfarm business activity and three of the five Seventh Federal Reserve District states increased from November. The relative MEI rose to in December from 0.20 in November. Contributions to the December relative MEI from all four sectors and all five states increased from November. Laura LaBarbera, Media Relations, The Federal Reserve Bank of Chicago Source: 1/31/19
5 The Federal Reserve Bank of Chicago: Midwest Economy Index Index Points to a Slight Increase in Midwest Economic Growth in December The manufacturing sector s contribution to the MEI edged down to in December from in November. The pace of manufacturing activity decreased in Iowa, Michigan, and Wisconsin, but increased in Indiana and was unchanged in Illinois. Manufacturing s contribution to the relative MEI increased to in December from in November. The construction and mining sector contributed to the MEI in December, up from 0.02 in November. The pace of construction and mining activity was faster in Indiana, Michigan, and Wisconsin, but slower in Iowa and unchanged in Illinois. The contribution from construction and mining to the relative MEI edged up to in December from in November. The service sector made a neutral contribution to the MEI in December, up from 0.06 in November. The pace of service sector activity was up in Illinois, Iowa, Michigan, and Wisconsin, but down in Indiana. The service sector s contribution to the relative MEI moved up to 0.14 in December from 0.33 in November. The contribution from consumer spending indicators to the MEI ticked down to 0.04 in December from 0.02 in November. Consumer spending indicators were, on balance, down in Illinois and Michigan, but steady in Indiana, Iowa, and Wisconsin. Consumer spending made a neutral contribution to the relative MEI in December, up slightly from 0.01 in November. Laura LaBarbera, Media Relations, The Federal Reserve Bank of Chicago Source: 1/31/19
 growth is presented at an annualized quarterly rate.")
6 The Federal Reserve Bank of Chicago: Survey of Business Conditions Real GDP Growth: 3.4 Activity Index: 2.0 Notes: Real gross domestic product (GDP) growth is presented at an annualized quarterly rate. The CFSBC Activity Index is converted from a biquarterly to quarterly frequency by taking the quarterly average of the available data. After averaging, the CFSBC Activity Index values are rescaled by taking the fitted values from a regression of GDP growth on the CFSBC Activity Index. The Federal Reserve Bank of Chicago Survey shows steady growth in late November and December The Chicago Fed Survey of Business Conditions (CFSBC) Activity Index decreased slightly to 4 from 2, suggesting that growth in economic activity remained at a modest pace in late November and December. The CFSBC Manufacturing Activity Index moved down to 16 from +6, while the CFSBC Nonmanufacturing Activity Index moved up to +3 from 5. Laura LaBarbera, Media Relations, Federal Reserve Bank of Chicago Source: 1/16/19
7 The Federal Reserve Bank of Chicago: Survey of Business Conditions Activity Index: -4.0 Activity Index: Activity Index: -3.0 Notes: The CFSBC Activity Index is converted from a biquarterly to quarterly frequency by taking the quarterly average of the available data. After averaging, the CFSBC Activity Index values are rescaled by taking the fitted values from a regression of GDP growth on the CFSBC Activity Index. The Federal Reserve Bank of Chicago Source: 1/16/19
8 The Federal Reserve Bank of Chicago: Survey of Business Conditions Survey shows steady growth in late November and December Respondents outlooks for the U.S. economy for the next six to 12 months deteriorated markedly, turning pessimistic on balance. Respondents with pessimistic outlooks highlighted increased financial market volatility; elevated policy uncertainty related to trade negotiations and the government shutdown; and slowing demand for their firms products. Respondents with optimistic outlooks highlighted good economic data, particularly for the labor market, and growing demand for their firms products. The pace of current hiring slowed, and respondents expectations for the pace of hiring over the next six to 12 months decreased. Both hiring indexes remained negative. The pace of current capital spending edged up, as did respondents expectations for the pace of capital spending over the next six to 12 months. Both capital spending indexes remained negative. The wage cost pressures index decreased, as did the nonwage cost pressures index. Both cost pressures indexes moved into negative territory. Laura LaBarbera, Media Relations, The Federal Reserve Bank of Chicago Source: 1/16/19
9 The Federal Reserve Bank of Chicago: National Activity Index Index Points to a Slight Increase in Economic Growth in December Led by improvements in production-related indicators, the Chicago Fed National Activity Index (CFNAI) moved up slightly to in December from in November. Two of the four broad categories of indicators that make up the index increased from November, and two of the four categories made positive contributions to the index in December. The index s three-month moving average, CFNAI-MA3, edged up to in December from in November. Graham Justice, Media Relations, The Federal Reserve Bank of Chicago Source: 1/28/19
10 The Federal Reserve Bank of Chicago: National Activity Index Index points to a Slight Increase in Economic Growth in December The contribution from production-related indicators to the CFNAI increased to in December from in November. Manufacturing industrial production rose 1.1 percent in December after edging up 0.1 percent in November. The sales, orders, and inventories category made a neutral contribution to the CFNAI in December, down from in November. The Institute for Supply Management s Manufacturing New Orders Index decreased to 51.1 in December from 62.1 in November. Employment-related indicators contributed to the CFNAI in December, up slightly from in November. Total nonfarm payrolls rose by 312,000 in December after increasing by 176,000 in the previous month. However, the unemployment rate increased to 3.9 percent in December from 3.7 percent in November. The contribution of the personal consumption and housing category to the CFNAI edged down to 0.06 in December from 0.03 in November. The CFNAI was constructed using data available as of January 24, At that time, December data for 45 of the 85 indicators had been published (fewer than usual because of the partial federal government shutdown). For all missing data, estimates were used in constructing the index. The November monthly index value was revised to from an initial estimate of +0.22, and the October monthly index value was revised to from last month s estimate of Revisions to the monthly index can be attributed to two main factors: revisions in previously published data and differences between the estimates of previously unavailable data and subsequently published data. Revisions to the November and October monthly index values were primarily due to the former. (These monthly index values are likely to be further revised as data releases delayed by the shutdown become available.) Graham Justice, Media Relations, The Federal Reserve Bank of Chicago Source: 1/28/19
11 The Federal Reserve Bank of Dallas Growth in Texas Manufacturing Activity Accelerates Texas factory activity continued to expand in January, according to business executives responding to the Texas Manufacturing Outlook Survey. The production index, a key measure of state manufacturing conditions, rose from 7.3 to 14.5, indicating an acceleration in output growth. Other measures of manufacturing activity also suggested continued expansion in January, although the pace of demand growth slowed a bit. The capacity utilization index rose seven points to 14.8, and the shipments index rose five points to Meanwhile, the new orders index edged down to 11.6 and the growth rate of new orders index fell from 5.8 to 1.2. Perceptions of broader business conditions improved in January. The general business activity index rebounded from a multiyear low of -5.1 in December to 1.0 in January. This near-zero reading suggests manufacturers were fairly balanced in their assessment of whether activity had improved or worsened from last month. The company outlook index also rebounded from negative territory this month, rising more than 10 points to 7.1. Labor market measures suggested slower growth in employment and workweek length in January. The employment index retreated four points to 6.6, a two-year low. Sixteen percent of firms noted net hiring, compared with 10 percent noting net layoffs. The hours worked index edged down to 3.6. Emily Kerr, Business Economist, The Federal Reserve Bank of Dallas Source: 1/28/19
12 The Federal Reserve Bank of Dallas Growth in Texas Manufacturing Activity Accelerates Upward pressure on input prices and wages eased further in January, while pressure on selling prices held steady. The raw materials price index slipped eight points to 21.2, and the wages and benefits index ticked down two points to Meanwhile, the finished goods price index held steady at 6.4. Expectations regarding future business conditions pushed further positive in January. The indexes of future general business activity and future company outlook rose to 11.7 and 22.3, respectively. Other indexes of future manufacturing activity also posted increases this month. Emily Kerr, Business Economist, The Federal Reserve Bank of Dallas Source: 1/28/19
13 The Federal Reserve Bank of Dallas Texas Service Sector Activity Picks Up Texas service sector activity grew at a faster pace in January, according to business executives responding to the Texas Service Sector Outlook Survey. The revenue index, a key measure of state service sector conditions, rose from 10.1 in December to 14.9 in January. Labor market indicators reflected positive but slower employment growth and longer workweeks this month. The employment index fell almost three points to 7.0, while the hours worked index increased from 1.9 in December to 6.6 in January. Perceptions of broader business conditions remained soft, and measures of uncertainty stayed elevated this month. The general business activity index was largely unchanged at - 4.8, indicating a deterioration in perceptions of conditions in January, while the company outlook index rebounded to positive territory at 1.3. The outlook uncertainty index fell slightly but remained high at Price and wage pressures continued to ease this month. The wages and benefits index dipped from 19.8 in December to 18.7 in January, while the selling price index fell nearly three points to 7.9, its lowest reading since early Respondents expectations regarding future business conditions improved slightly from December. The future general business activity index increased over four points to -0.6, while the future company outlook index picked up six points to 7.6. Other indexes of future service sector activity, such as revenue and employment, also moved further into positive territory. Amy Jordan, Assistant Economist, The Federal Reserve Bank of Dallas Source: 1/29/19
14 The Federal Reserve Bank of Dallas Source: 1/29/19
15 The Federal Reserve Bank of Dallas Retail Sales Growth Holds Steady Retail sales grew at a stable pace in January, according to business executives responding to the Texas Retail Outlook Survey. The sales index held roughly steady at 6.5 in January. Inventory growth picked up sharply, as the inventories index surged nearly 13 points to Retail labor market indicators were flat, as employment and workweeks were largely unchanged this month. The employment index rebounded from -4.5 in December to 0.1 in January, while the hours worked index held mostly steady at a six-month low of 1.9. Retailers perceptions of broader business conditions continued to reflect pessimism in January. The general business activity index increased nearly five points but remained negative at -12.1, with almost one-fifth of respondents reporting worsening business activity. The company outlook index increased over seven points but also remained negative at -8.3 in January. Retail price pressures were mixed, while wage pressures eased this month. The selling prices index increased by two points to 14.7, while the input price index fell over nine points to 15.0, its lowest reading since mid The wages and benefits index fell from 11.1 in December to 8.3 in January. Retailers perception of future business conditions continued to worsen this month. The future general business activity index dropped eight points to -20.0, while the future company outlook index fell to -16.5, its lowest reading in nearly a decade. Other indexes of future retail sector activity, such as sales and employment, improved slightly but remain low relative to 2018 averages. Amy Jordan, Assistant Economist, The Federal Reserve Bank of Dallas Source: 1/29/19
16 The Federal Reserve Bank of Dallas Source: 1/29/19
17 U.S. Economic Indicators The Federal Reserve Bank of Kansas City Tenth District manufacturing activity continued to grow modestly Tenth District manufacturing activity continued to grow modestly in January, and expectations for future growth remained solid. The month-over-month finished goods price index rose, while the raw materials price index edged lower. Price expectations for the next six months held steady. Factories Report Slightly Positive Growth in January The month-over-month composite index was 5 in January, similar to 6 in December, and lower than 17 in November (Chart 1, Table 1). The composite index is an average of the production, new orders, employment, supplier delivery time, and raw materials inventory indexes. The slow and steady increase in factory activity was driven by durable goods producers, particularly wood products, fabricated metals, electrical equipment and appliances, and furniture manufacturing. Month-over-month indexes were somewhat mixed. The production index jumped back into positive territory, while the order backlog index turned negative for the first time since June Most year-over-year factory indexes eased from the previous month, and the composite index decreased from 38 to 31. Future factory activity expectations remained solid. The future composite index eased slightly from 22 to 18, while the future production index increased. Chad Wilkerson, Vice President and Oklahoma City Branch Executive, The Federal Reserve Bank of Kansas City Source: 1/24/19
18 U.S. Economic Indicators The Federal Reserve Bank of Kansas City Tenth District manufacturing activity continued to grow modestly Regional factories had another month of sluggish growth in January. About one-sixth of the firms in the survey said the partial government shutdown had negatively affected their business. Special Questions This month contacts were asked special questions about how the partial federal government shutdown has affected their business, and how credit conditions have changed over the past year. Nearly 17 percent of manufacturing contacts reported negative effects from the federal government shutdown on their business (Chart 3). Of the firms that reported negative effects from the shutdown, most noted permit delays or trade disruptions due to federal agencies being closed. Over the past year, more than 13 percent of firms reported that access to credit had increased while only seven percent of firms said access had decreased (Chart 4). However, 54 percent of contacts reported that the cost of credit increased over the past year. Chad Wilkerson, Vice President and Oklahoma City Branch Executive, The Federal Reserve Bank of Kansas City Source: 1/24/19

19 The Federal Reserve Bank of Kansas City Source: 1/24/19
20 The Federal Reserve Bank of Kansas City Source: 1/24/19
21 U.S. Economic Indicators The Federal Reserve Bank of Kansas City Tenth District services activity expands Tenth District services activity expanded in January, with positive expectations for future growth. The input prices index grew modestly while the selling price index inched down. Price expectations rose moderately. After five years of conducting the Tenth District Services Survey, historical data and monthly reports are now being released. This information provides up to date accounts of activity for a large sector in our region s economy, as well as insights gathered from special questions and comments from survey participants. Services companies in our region reported another good month in January and expect activity to expand further in coming months. This is despite over a quarter of services firms noting that the partial federal government shutdown has negatively affected them in some way. Business continued to expand in January The month-over-month services composite index rose to 15 in January, up from 11 in December and 14 in November (Tables 1 & 2). The composite index is a weighted average of the revenue/sales, employment, and inventory indexes. Most of the other month-overmonth indexes also expanded or were unchanged in January. The revenue/sales index rebounded in January, due to increases in wholesale trade, auto, real estate, and leisure and hospitality. The month-over-month inventory index dropped into negative territory for the first time since December Most year-over-year services indexes edged higher. Compared with a year ago, the services composite index declined grew from 18 to 21. Future services activity expectations remained positive, dipped slightly as the future composite index eased from 25 to 17. Chad Wilkerson, Vice President and Oklahoma City Branch Executive, The Federal Reserve Bank of Kansas City Source: 1/25/19

22 U.S. Economic Indicators Source: 1/25/19
23 U.S. Economic Indicators The Federal Reserve Bank of Kansas City Special Questions This month contacts were asked special questions about how the federal government shutdown has affected their business, and how credit conditions have changed over the past year. More than 26 percent of services contacts reported negative effects from the federal government shutdown on their business (Chart 3). Of the firms that reported negative effects from the shutdown, most noted declining business from federal entities or contract delays due to federal agencies being closed. Over the past year, more than 10 percent of firms reported that access to credit had increased while only seven percent of firms said access had decreased (Chart 4). However, 53 percent of contacts reported that the cost of credit increased over the past year. Chad Wilkerson, Vice President and Oklahoma City Branch Executive, The Federal Reserve Bank of Kansas City Source: 1/25/19
24 U.S. Economic Indicators Source: 1/25/19
25 U.S. Economic Indicators The Federal Reserve Bank of Kansas City Labor Market Conditions Indicators The KCFSI suggests financial stress decreased last month The Kansas City Financial Stress Index (KCFSI) decreased from in December to in January, but is still close to its historical average of 0. The second table on the following page documents the contribution of each variable to the index. Yield spreads collectively reduced 0.01 from the KCFSI in January. The behavior of asset prices, particularly the decreased volatility of overall stock prices (VIX), reduced 0.02 from the KCFSI in January. Bill Medley, Media Relations, The Federal Reserve Bank of Kansas City Source: 2/8/19
26 The Federal Reserve Bank of New York Empire State Manufacturing Survey Growth Continues to Slow Business activity grew slightly in New York State, according to firms responding to the January 2019 Empire State Manufacturing Survey. The headline general business conditions index fell eight points to 3.9, its lowest level in well over a year. New orders increased at a slower pace than in recent months, while shipments continued to climb significantly. Delivery times were slightly shorter, and inventories declined. Labor market indicators pointed to a modest increase in employment and hours worked. The prices paid index moved lower for a second consecutive month, indicating some slowing in input price increases, and the prices received index held steady. Looking ahead, firms were less optimistic about the six-month outlook than they were last month. Richard Deitz and Jason Bram, The Federal Reserve Bank of New York Source: 1/15/19

27 The Federal Reserve Bank of New York January 2019 Expected: 17.8 January 2019 Current: 3.9 Source: 1/15/19
28 The Federal Reserve Bank of New York Empire State Manufacturing Survey Employment Rises Modestly Manufacturing firms in New York State reported that business activity expanded slightly. The general business conditions index fell eight points to 3.9, its lowest reading since mid The headline index has fallen a cumulative eighteen points since November. Twentythree percent of respondents reported that conditions had improved over the month, while 20 percent reported that conditions had worsened. The new orders index fell ten points to 3.5, indicating that growth in orders slowed significantly, while the shipments index was little changed at Unfilled orders were somewhat lower, inventories declined, and delivery times were slightly shorter. Optimism Wanes Firms were less optimistic about the six-month outlook than in recent months. The index for future business conditions fell thirteen points to 17.8, and the indexes for future new orders and shipments also declined. Firms expected employment to increase modestly. The capital expenditures index fell thirteen points to 17.9, and the technology spending index moved down six points to Richard Deitz and Jason Bram, The Federal Reserve Bank of New York Source: 1/15/19
29 The Federal Reserve Bank of New York Business Leaders Survey (Services) Growth Slows To A Halt Activity in the region s service sector held steady, according to firms responding to the Federal Reserve Bank of New York s January 2019 Business Leaders Survey. The survey s headline business activity index fell six points to zero, its lowest level since mid The business climate index was little changed, also coming in at around zero, indicating that on balance, firms regarded the business climate as normal. Employment levels rose modestly, and wage increases picked up slightly. The prices paid index, while still elevated, edged down three points to 51.5, and the prices received index was little changed at Optimism waned, with the index for future business climate falling to its lowest level in nearly a decade. Input Price Increases Ease Slightly At 7.1, the employment index indicated that employment levels increased modestly. The wages index edged up three points to 37.1, suggesting that wage gains remained fairly widespread. The prices paid index fell three points, its third consecutive monthly decline, but remained elevated at The prices received index held steady at The capital spending index moved down six points to 10.8, suggesting that capital spending increased at a slower pace than last month. Optimism Continues To Droop Firms remained fairly subdued in their optimism about the six-month outlook. The index for future business activity fell four points to 14.3, its lowest level in more than two years. The index for future business climate declined four points to -15.7, its lowest reading since 2009, suggesting that firms expect the business climate to be worse than normal in the months ahead. The index for future wages and the index for future prices paid both moved lower, and the index for planned capital spending fell eight points to Jason Bram and Richard Deitz, The Federal Reserve Bank of New York Source: 1/16/19

30 The Federal Reserve Bank of New York January 2019: 14.3 January 2018: 0.0 Source: 1/16/19
31 U.S. Economic Indicators The Federal Reserve Bank of New York Nowcast Notes: We start reporting the Nowcast for a reference quarter about one month before the quarter begins; we stop updating it about one month after the quarter closes. Colored bars reflect the impact of each broad category of data on the Nowcast; the impact of specific data releases is shown in the accompanying table. Source: Authors' calculations, based on data accessed through Haver Analytics. February 8, 2019: Highlights The New York Fed Staff Nowcast stands at 2.4% for 2018:Q4 and 2.2% for 2019:Q1. The Federal Reserve Bank of New York Source: 2/8/19
 model. We describe very briefly our forecast and its change since October 2018.")
32 The Federal Reserve Bank of New York The New York Fed DSGE Model Forecast January This post presents an update of the economic forecasts generated by the Federal Reserve Bank of New York s dynamic stochastic general equilibrium (DSGE) model. We describe very briefly our forecast and its change since October As usual, we wish to remind our readers that the DSGE model forecast is not an official New York Fed forecast, but only an input to the Research staff s overall forecasting process. For more information about the model and variables discussed here, see our DSGE model Q & A. The January model forecast for is summarized in the table above, alongside the October forecast, and in the following charts. The model uses quarterly macroeconomic data released through the third quarter of 2018, financial data available through January 31, 2019, and staff nowcasts of GDP growth for the fourth quarter through January 31, Michael Cai, Marco Del Negro, Ethan Matlin, and Reca Sarfati; The Federal Reserve Bank of New York Source: 1/16/19
33 U.S. Economic Indicators The Federal Reserve Bank of Philadelphia January 2019 Manufacturing Business Outlook Survey Current Indicators Suggest Growth Manufacturing activity in the region continued to grow, according to results from the January Manufacturing Business Outlook Survey. The survey s broad indicators remained positive, although their movements were mixed again this month: The general activity and new orders indicators increased from their readings last month, while the indicators for shipments and employment decreased. The firms reported growth in the underlying demand for their products and are generally optimistic about future growth and employment. The index for current manufacturing activity in the region increased from a revised reading of 9.1 in December to 17.0 this month* (see Chart 1). Over 30 percent of the manufacturers reported increases in overall activity, while 13 percent reported decreases. The new orders index increased 8 points to 21.3, its highest reading in six months. The current shipments index, however, decreased 1 point to Both the unfilled orders and delivery times indexes were positive this month, suggesting higher unfilled orders and slower delivery times. Inventories declined this month: The current inventory index fell 10 points to -7.6, its first negative reading in 14 months. Mike Trebing, Senior Economic Analyst, The Federal Reserve Bank of Philadelphia Source: 1/19/19

34 The Federal Reserve Bank of Philadelphia January January 2019 : 17.0 Source: 1/19/19
35 The Federal Reserve Bank of Philadelphia January 2019 Manufacturing Business Outlook Survey The firms continued to report overall higher employment, but the current employment index fell nearly 10 points to 9.6, its lowest reading in 16 months. Over 22 percent of the responding firms reported increases in employment this month, while 13 percent of the firms reported decreases in employment. The current workweek index increased 2 points to a reading of 6.0. Price Index for Inputs Continues Downward Trend The survey s diffusion indexes for prices remained positive but decreased from their readings in December. On the cost side, the prices paid index decreased 6 points to The index has been trending down since last July and is at its lowest reading in 13 months (see Chart 2). With respect to prices received for firms own manufactured goods, 29 percent of the firms reported higher prices, and 4 percent reported lower prices. The prices received index decreased 4 points to Most Six-Month Indicators Remain Positive The diffusion index for future general activity increased slightly, from a revised reading of 29.9 to a reading of 31.2 this month (see Chart 1). Over 46 percent of the firms expect increases in activity over the next six months, while 15 percent expect declines. The future new orders index decreased 6 points, but the future shipments index increased 1 point. The future employment index edged up 1 point, with nearly 41 percent of the firms indicating that they expect to add workers over the next six months. Mike Trebing, Senior Economic Analyst, The Federal Reserve Bank of Philadelphia Source: 1/19/19

36 The Federal Reserve Bank of Philadelphia January 2019 : 32.7 January Source: 1/19/19
37 The Federal Reserve Bank of Philadelphia January 2019 Manufacturing Business Outlook Survey Firms Expect to Increase Production in Near Term In Special Questions this month, the firms were asked to characterize current demand and production of their manufactured products over the past few months and to forecast their production increases for the first quarter of the year. Most firms (46 percent) reported an increase in underlying demand: Only 11 percent characterized underlying demand as increasing significantly, while 35 percent characterized it as increasing modestly. Over 65 percent of the firms anticipate increasing production in the first quarter, although 29 percent expect decreases. Among those increasing production, one-third indicated this will require hiring additional labor. Summary The firms responses indicated continued growth in the region s manufacturing sector this month. The survey s broad current indicators remained positive, and the indexes for activity and new orders improved. The firms reported moderated increases in employment this month but indicated plans for further increases over the next six months, in line with expanded production of manufactured products. The survey s future indexes indicate that respondents continue to expect growth over the next six months. Mike Trebing, Senior Economic Analyst, The Federal Reserve Bank of Philadelphia Source: 1/19/19
38 The Federal Reserve Bank of Philadelphia The Federal Reserve Bank of Philadelphia January 2019 Nonmanufacturing Business Outlook Survey Current Indicators Weaken Further Responses to the November Nonmanufacturing Business Outlook Survey suggest that nonmanufacturing activity in the region continued to expand. The firm-level index of general activity, new orders, and sales/revenues all rose above last month s readings. In addition, the employment indicators remained positive, while the indexes for prices paid and prices received both increased. The survey s indexes for future activity suggest that firms expect growth to continue over the next six months. The diffusion index for current general activity at the firm level fell from a revised reading of 6.4 in December to -0.2 in January (see Chart 1). This is its first negative reading since October 2011; the index has fallen 41 points since November. Roughly similar percentages of firms reported increases in activity and decreases in activity; however, the share of firms reporting decreases has more than doubled since November. The new orders index fell 21 points to -3.1, its first negative reading since February The share of firms reporting increases in new orders (23 percent) fell below the share reporting decreases (26 percent). The sales/revenues index fell 12 points to 3.9 in January. Nearly 35 percent of the responding firms reported increases in sales/revenues, while 31 percent reported decreases. Matching the decline of the firm-level index, the regional activity index fell 7 points to 1.0. Elif Sen, Research Department, The Federal Reserve Bank of Philadelphia Source: 1/22/19
39 The Federal Reserve Bank of Philadelphia January 2019 Nonmanufacturing Business Outlook Survey Full-Time Employment Index Remains Positive The firms continued to report overall increases in full-time employment, although most firms noted steady employment levels. The full-time employment index fell slightly from a revised reading of 11.8 in December to 9.4 in January. Although most firms (59 percent) continue to report steady full-time employment levels, the share of firms reporting increases (22 percent) was higher than the share reporting decreases (12 percent). The part-time employment index fell 5 points to 5.6, while the wages and benefits indicator edged down 1 point to The average workweek index fell 20 points to 5.2, its lowest reading since July Firms Report Overall Price Increases Both price indicators rose from last month s readings, suggesting continued overall increases in prices for inputs and for firms own goods and services. The prices paid index rose 5 points to 26.3 (see Chart 2). Although the majority of respondents (56 percent) reported stable input prices, 32 percent of the respondents reported increases, while only 5 percent reported decreases. Regarding prices for firms own goods and services, the prices received index rose 7 points from December to 14.9 in January. While 25 percent of the firms reported increases in prices received, 10 percent reported decreases. More than 58 percent of the firms reported no change in their own prices. Elif Sen, Research Department, The Federal Reserve Bank of Philadelphia Source: 1/20/18
40 The Federal Reserve Bank of Philadelphia January 2019 Nonmanufacturing Business Outlook Survey Expectations for Future Growth Weaken Both future activity indexes suggest that firms expect growth to continue over the next six months, although index readings are well below last year s averages. The diffusion index for future activity at the firm level fell from a revised reading of 43.2 in December to 22.9 this month (see Chart 1). Nearly 49 percent of the firms expect an increase in activity at their firms over the next six months, while the share of firms that expect a decline increased from 12 percent last month to 26 percent this month. More than 25 percent of the firms expect no change over the next six months. The future regional activity index fell 16 points to Summary Responses to this month s Nonmanufacturing Business Outlook Survey suggest that nonmanufacturing activity slowed further in the region. Indicators for firm-level general activity, new orders, and sales/revenues fell for the second consecutive month, while the full-time employment index fell only slightly. Respondents remain optimistic about growth over the next six months in their own firms and in the region, although less so than over the past year. Elif Sen, Research Department, The Federal Reserve Bank of Philadelphia Source: 1/20/19
41 The Federal Reserve Bank of Philadelphia January January Source: 1/20/19
42 The Federal Reserve Bank of Philadelphia January January Source: 1/20/19

43 The Federal Reserve Bank of Philadelphia: GDPplus 2018 Q3 3.6% 2018 Q3 3.3% 2018 Q3 4.2% GDPplus Real GDP Real GDI Source: 12/21/19

44 The Federal Reserve Bank of Philadelphia The Federal Reserve Bank of Philadelphia has released the coincident indexes for the 50 states for December Over the past three months, the indexes increased in 47 states, decreased in two states, and remained stable in one, for a three-month diffusion index of 90. In the past month, the indexes increased in 38 states, decreased in three states, and remained stable in nine, for a one-month diffusion index of 70. For comparison purposes, the Philadelphia Fed has also developed a similar coincident index for the entire United States. The Philadelphia Fed s U.S. index increased 0.7 percent over the past three months and 0.2 percent in December. Daniel Mazone, Research Department, The Federal Reserve Bank of Philadelphia Source:; 1/23/19
45 U.S. Economic Indicators The Federal Reserve Bank of Richmond Fifth District Manufacturing Activity Was Soft in January Fifth District manufacturing activity was soft in January, according to the latest survey from the Richmond Fed. The composite index rose from 8 in December to 2 in January but continued to indicate weak growth. The rise from December came from increases in the component indexes of employment and shipments, although the shipments index remained negative The third component, new orders, dropped to 11, its lowest reading since June Meanwhile, the index for backlog of orders fell to 21, its lowest reading since May However, manufacturers remained optimistic that conditions would improve in the coming months. Survey results indicated continued growth in employment and wages in January, but firms still struggled to find workers with the skills they need. Respondents expected this struggle to continue, along with employment and wage growth, in the near future. The growth rate of prices paid by survey respondents fell in January, but continued to outpace that of prices received, which held steady. Firms expected growth to slow for both prices paid and prices received in the next six months. Jeannette Plamp, Economic Analyst, The Federal Reserve Bank of Richmond Source: 1/23/19

46 U.S. Economic Indicators Source: 1/23/19

47 U.S. Economic Indicators Source: 1/23/19
48 U.S. Economic Indicators Source: 1/23/19
49 The Federal Reserve Bank of San Francisco FRBSF FedViews The economy has continued to grow at a robust pace, primarily driven by solid gains in consumer income and spending. We project that GDP growth rate averaged 3.1% for We forecast that growth will slow down to 2.0% in 2019, as monetary policy continues to normalize and fiscal stimulus wanes, and fall gradually to our estimated long-term potential rate of 1.7%. The labor market remains very strong. The economy added 312,000 jobs in December, significantly exceeding the breakeven rate, which we estimate at about 90,000 jobs per month. The increases in payroll numbers were revised up for both October and November to 274,000 jobs and 176,000 jobs, respectively. Though the December unemployment rate rose 0.2 percentage point to 3.9%, this mainly reflects a sharp increase in the number of people entering the labor force, and it remains well below our estimate of the natural unemployment rate of 4.5%. We expect unemployment to decline to 3.7% by the end of 2019, and then gradually climb to 4.0% by the end of the forecast horizon. Headline inflation of the personal consumer expenditures (PCE) price index over the past 12 months came in at 1.8% in November, slightly below the Federal Open Market Committee s (FOMC) target of 2%. Core inflation, which excludes volatile food and energy prices, rose 1.9%. We forecast that inflation will remain at this level below target through The recent softening in inflation is partially attributable to the pass-through of low commodity prices and lower-than-expected increases in health-care costs. As the labor market continues to strengthen and the effects of these transitory factors diminish over time, we expect both headline and core inflation rates to slightly overshoot the 2% target by the end of Galina Hale, Research Advisor, The Federal Reserve Bank of San Francisco Source: 1/14/19
50 The Federal Reserve Bank of San Francisco Source: 1/14/19
51 The Federal Reserve Bank of San Francisco Source: 1/14/19
52 U.S. Economic Indicators Source: FHFA U.S. FHFA House Price Index Report November 2018 The FHFA House Price Index (HPI) reported a 0.4 percent increase in U.S. house prices in November from the previous month. According to the Federal Housing Finance Agency (FHFA) seasonally adjusted monthly House Price Index (HPI), the previously reported 0.3 percent increase in October was revised to reflect a 0.4 percent increase. From November 2017 to November 2018, house prices were up 5.8 percent. For the nine census divisions, seasonally adjusted monthly price changes from October 2018 to November 2018 ranged from -0.8 percent in the Pacific division to +1.1 percent in the South Atlantic division. The 12-month changes were all positive, ranging from +4.5 percent in the West South Central division to +7.4 percent in the Mountain division. Stefanie Johnson and Corinne Russell, FHFA Source: 1/23/19
53 The Federal Reserve Bank of Dallas Mexico's Output Growth Slows in the Fourth Quarter Mexico s economy grew an annualized 1.2 percent in fourth quarter 2018 after expanding 3.4 percent in the third quarter. Gross domestic product (GDP) grew 2.1 percent in 2018 (fourth quarter/fourth quarter). The consensus growth forecast for 2019, compiled by Banco de México, was revised down from 1.9 percent in December to 1.8 percent in January. Other data are mixed. Exports, employment and retail sales grew, while industrial production fell. The peso strengthened against the dollar, but inflation increased slightly. GDP Growth Falls Below 10-Year Average Mexico s fourth-quarter GDP growth of 1.2 percent was below its long-run average (Chart 1). Output from goods-producing industries (manufacturing, construction, utilities and mining) fell 4.3 percent, while service-related activities (wholesale and retail trade, transportation and business services) grew 3.2 percent. Agricultural output rose 7.8 percent. Exports Tick Up in December Total exports increased 1.7 percent in December after falling 1.5 percent in November. Manufactured-goods and oil exports grew 1.1 percent and 1.8 percent, respectively, in December. However, the three-month moving averages continue showing declines (Chart 2). In 2018, total exports were up 7.3 percent, with manufacturing exports growing 6.3 percent and oil exports surging 26 percent. It bears noting that the rise in oil exports in 2018 stems largely from higher oil prices earlier in the year, not an increase in the volume of exports. Jesus Cañas, Senior Business Economist and Benjamin Meier, Research Assistant; The Federal Reserve Bank of Dallas Source: 2/8/19
54 The Federal Reserve Bank of Dallas Source: 2/8/19
55 The Federal Reserve Bank of Dallas Source: 2/8/19
56 Private Indicators: Global Source: IHS Markit; StatCan. Slowest expansion of manufacturing production since December 2016 Markit Canada Manufacturing PMI The headline seasonally adjusted IHS Markit Canada Manufacturing Purchasing Managers Index (PMI ) eased from 53.6 in December to 53.0 in January. Although still above the crucial 50.0 no-change threshold, the latest reading pointed to the weakest improvement in overall business conditions since December Manufacturers in Canada reported another loss of momentum at the start of 2019, with output and new business growth easing further from the peaks seen last summer. Export sales remained particularly subdued in January, with this index pointing to a marginal fall in new work from abroad. On a more positive note, manufacturing companies signalled a robust pace of job creation and slower input cost inflation during the latest survey period. January data pointed to only a moderate rise in new work received by manufacturing companies. The rate of new business growth eased for the second month running and was the weakest since October Moreover, new export orders fell in January, albeit only slightly. Survey respondents noted that ongoing global trade frictions had dampened business confidence and contributed to more cautious spending patterns among clients. January data highlights that the manufacturing sector got off to a slow start in 2019, with the loss of momentum centred on the weakest increase in new business volumes for more than two years. Survey respondents noted that global trade frictions and subdued business confidence among clients had once again acted as a break on client demand. There were some signs that manufacturers expect the slowdown in manufacturing conditions to prove temporary, as signalled by the robust rate of job creation reported in January. Optimism regarding the business outlook also improved at the start of 2019, with output growth projections now the strongest since last August. Manufacturers attributed their positive expectations to planned expansions of production capacity and hopes of strengthening demand in US markets. Christian Buhagiar, President and CEO, SCMA Source: 2/1/19
57 Private Indicators: Global Source: IHS Markit, Caixin. Caixin China General Manufacturing PMI The headline seasonally adjusted Purchasing Managers Index (PMI ) posted 48.3 at the start of 2019, down from 49.7 in December, to point to a continued softening in the health of China s manufacturing sector. The latest PMI reading was the lowest since February Manufacturing sector performance subdued at start of 2019 Latest survey data signalled subdued overall operating conditions in the Chinese manufacturing sector at the start of Production and total new work were both slightly down at the start of the year, despite a renewed increase in export orders. Relatively muted demand conditions underpinned the first fall in purchasing activity for 20 months, while firms also registered lower inventories of both purchased and finished items. On a positive note, employment levels fell at the weakest rate for nine months, while confidence towards the business outlook was at its highest since May After rising slightly at the end of last year, Chinese manufacturing production weakened in January. According to panellists, softer demand conditions led companies to revise their production schedules. That said, the rate at which output fell was only modest. January s survey indicated a generally subdued trend in total new work placed with Chinese goods producers. Underlying data indicated that weakness largely stemmed from muted domestic demand, as new work from abroad rose slightly at the start of the Purchasing activity weakened in January, driven by a softer trend in overall new order intakes. That said, the pace of decline was modest. Manufacturers also adopted a relatively cautious approach to inventories, as firms reduced their holdings of both stocks of purchases and finished items at the start of After broadly stabilising at the end of 2018, average suppliers delivery times increased across China s manufacturing sector in January. That said, the rate at which times lengthened was only slight. Dr. Zhengsheng Zhong, Director of Macroeconomic Analysis, CEBM Group Source: 2/1/19
58 Private Indicators: Global Caixin China General Manufacturing PMI The Caixin China General Manufacturing PMI fell further to 48.3 in January, the lowest since February The subindex for new orders dipped further into contractionary territory, pointing to a moderate contraction in demand across the manufacturing sector. Yet the gauge for new export orders rose notably above the 50 level, the dividing line that separates contraction from expansion, reaching its highest point since March 2018, showing that companies export orders have obviously rebounded since the truce in the China-U.S. trade war. The output subindex dropped, highlighting the drag effect of softer demand on production. The employment subindex continued to rise moderately despite staying in negative territory, which could be due to the effect of government policies to stabilize the job market. The measure for stocks of finished goods fell into contractionary territory, while the subindex for stocks of purchased items dropped further, suggesting that manufacturers tended to reduce their inventories. The subindex for suppliers delivery times returned to negative territory, indicating that pressure on capital turnover, though less than in the months before December, still existed. Both gauges for input costs and output charges dropped only slightly. While companies have reduced their inventories, prices of domestic industrial products have since the start of the month recovered some of the losses seen in December. We expect that year-on-year growth in the producer price index is likely to slide closer to zero. On the whole, countercyclical economic policy hasn t had a significant effect. While domestic manufacturing demand shrank, external demand turned positive and became a bright spot amid positive progress in Sino-U.S. trade talks. As companies were more willing to reduce their inventories, their output declined, indicating notable downward pressure on China s economy. China is likely to launch more fiscal and monetary measures and speed up their implementation. Yet the stance of stabilizing leverage and strict regulation hasn t changed, which means the weakening trend of China s economy will continue. Dr. Zhengsheng Zhong, Director of Macroeconomic Analysis, CEBM Group Source: 2/1/19
59 Private Indicators: Global Source: IHS Markit. Markit Eurozone Manufacturing PMI Manufacturing operating conditions in the eurozone improved only marginally and at the slowest rate for over four years at the start of After accounting for seasonal factors, the IHS Markit Eurozone Manufacturing PMI registered 50.5, down from 51.4 in December, unchanged from the flash estimate. The headline index has now fallen for six consecutive months and stood in January at its lowest level since November Eurozone manufacturing sector moves closer to stagnation Ongoing weakness was apparent in the intermediate goods sector at the start of 2019, whilst producers of investment goods recorded a deterioration in operating conditions for the first time since July In contrast, the consumer goods category continued to enjoy solid growth in January. In line with recent trends, it was the big-four economies that recorded the lowest manufacturing PMI readings during January. Most notably, Germany entered contraction territory for the first time in over four years whilst the downturn in Italy gathered pace. The January PMI adds to the likelihood that the manufacturing sector is in recession and will act as a drag on the economy in the first quarter. Some temporary factors remain evident, including an auto sector that is struggling to regain momentum after new emissions regulation and some signs of yellow vest disturbances dampening demand in France. However, there appears to be a more deep-rooted malaise setting in, which reflects widespread concerns about the destabilising effect of political uncertainty and the damage to exports from rising trade protectionism. Worryingly, weaker than anticipated sales mean warehouses are filling up with unsold stock at a rate not previously recorded over the two decades of prior survey history, suggesting firms will need to cut operating capacity in coming months unless demand revives, boding ill for future production growth. While there is some evidence that firms are hoarding labour in the hope of sales picking up again, and business optimism did perk up from December s six-year low, jobs growth is starting to deteriorate as increasing numbers of firms seek to cut costs and raise productivity. Any such downturn in the labour market will in turn potentially drive consumer sentiment lower, and adds further to the risk that economic growth will continue to slow in coming months. Chris Williamson, Chief Business Economist, Markit Source: 2/1/19

60 Private Indicators: Global Sources: IHS Markit, Eurostat.. Markit Eurozone Composite PMI The IHS Markit Eurozone PMI Composite Output Index edged lower in January, falling for a fifth successive month to register its lowest level for five-and-a-half years. After accounting for seasonal factors, the index recorded 51.0 in January, a little better than the earlier flash estimate of 50.7 but still down from 51.1 in December and signalling only weak growth in business activity. Eurozone growth edges lower at start of 2019 Activity weakness was principally centered on France and Italy. Output in France was down for a second successive month, and at the fastest rate in over four years. Meanwhile, Italian private sector output deteriorated for the third time in four months and to the greatest degree in over five years. Manufacturing was the primary source of output weakness during January. Whilst service sector growth was unchanged since December at around a four-year low, production in manufacturing rose only slightly and at the weakest rate in over fiveand-a-half years of growth. The eurozone has started 2019 on flat note, with growth close to stagnation amid falling demand for goods and services. The PMI indicates that GDP is growing at a quarterly rate of just 0.1%, setting the scene for the region s worst quarter since Such a weak start to the year would mean the current consensus forecast for 1.5% GDP growth in 2019 is likely to be revised lower, and hence lead to more dovish signals from the ECB. What started as a manufacturing and export-led slowdown has shown increasing signs of infecting the service sector. The manufacturing PMI numbers are indicative of the goods-producing sector slipping into recession, while growth in services is now running at its lowest for four years. Worst may be yet to come: new orders received by factories are declining at the steepest rate for nearly six years and new business inflows into the service sector have stalled. Demand is consequently falling to an extent not seen since mid The deteriorating picture looks broad-based. Italy is in its steepest downturn for over five years and France has sunk into its sharpest decline for over four years. Faster growth in Germany and Spain meanwhile looks tenuous, as order book trends deteriorated in both cases. Chris Williamson, Chief Business Economist, Markit Source: 2/5/19
61 Private Indicators: Global Source: IHS Markit, Bundesbank IHS Markit/BME Germany Manufacturing PMI At 49.7 in January, down from 51.5 in December, the headline IHS Markit/BME Germany Manufacturing PMI a single-figure snapshot of the performance of the manufacturing economy was below the 50.0 'no-change' mark for the first the first time in more than four years. Sharp fall in new orders causes PMI to fall into contraction territory in January Conditions across Germany's manufacturing sector worsened at the start of the year, with latest PMI survey data from IHS Markit and BME showing inflows of new orders falling at the fastest rate in over six years. Client uncertainty, trade tensions and a slowing automotive sector were all found to have undermined demand, with the same factors also weighing on firms' expectations for production. Elsewhere, January saw a further slowdown in the rate of input cost inflation in the sector to a 27-month low, reflecting the recent downward pressure on a number of key global commodity prices and falling demand for inputs. The notable fall in the headline PMI since December was led by a deepening downturn in new orders, which contracted to the greatest extent in over six years. Part of the reason for lower order books was a drop in demand from international markets, with surveyed firms reporting decreases in sales to the US, UK, Italy, Turkey and Asia (particularly China). Germany's manufacturing sector showed no sign of turning the corner in January, with the downturn in order books extending to a fourth straight month and gathering pace. A number of factors continued to undermine demand, affecting predominantly the intermediate and capital goods sectors. "The downturn is feeding through to supply chains, with lead-times on purchased items edging closer to stabilisation in January as manufacturers scaled back their demand for inputs. Purchase price inflation has also come down a lot in recent months, offering some respite to any struggling manufacturers Phil Smith, Principal Economist, IHSMarkit Source: 2/1/19
62 Private Indicators: Global Source: IHS Markit JP Morgan Global Manufacturing PMI Growth of the global manufacturing sector slowed closer to stagnation in January. At 50.7, the J.P. Morgan Global Manufacturing PMI a composite index1 produced by J.P. Morgan and IHS Markit in association with ISM and IFPSM fell for the ninth straight month to its lowest reading since August Global PMI sinks to near two-and-a-half year low at start of 2019 The US remained one of the stronger performing nations in January, with its PMI rising to buck the slowing trend seen at the global level. Moreover, if US data were excluded from the Global Manufacturing PMI calculation the reading would have been 50.0, a level signalling stagnation. The slowdown in China manufacturing was the main drag, as the China PMI fell to a near three-year low. The euro area and Japan PMIs fell to 50- and 29-month lows respectively. Sector data suggested that the consumer goods industry was the strongest performer, despite seeing its rate of expansion slow to a four - month low. The PMI for the intermediate goods sector fell to the stagnation mark of 50.0, while a slight contraction was signalled for investment goods producers. The rate of expansion in global manufacturing production eased to a 31-month low in January. This mainly reflected a near-stalling in the rate of growth in new orders, as new business rose at the weakest pace during the current six-year sequence of expansion. New export work decreased for the fifth straight month and to the greatest extent since May Better news was provided by the trends in employment and business confidence. Staffing levels rose for the twenty-ninth consecutive month, with the rate of job creation improving slightly. Meanwhile, manufacturers optimism regarding the one-year outlook for the sector rose to a four-month high. Input cost inflation eased to a 19-month low in January, with rates of increase slowing (on average) in both developed and emerging markets. The pricing power of manufacturers held up comparatively well, with average output charges rising at a slightly quicker pace than before the turn of the year. Although average vendor lead-times lengthened again, it was to the least marked extent in almost two years. David Hensley, Global Economist, J.P. Morgan Source: 2/1/19
63 Private Indicators: Global Sources: IHS Markit, JP Morgan JP Morgan Global Services PMI The start of 2019 saw a further slowing in the rate of expansion of global service sector output. The J.P. Morgan Global Services Business Activity Index a composite index produced by J.P. Morgan and IHS Markit in association with ISM and IFPSM fell to a 28-month low of 52.6 in January, down from 53.0 in December. Global services output growth eases to 28-month low in January The consumer services sector was the main drag on the global aggregate, as business activity contracted for the first time since August There was also a marked slowdown in the rate of output growth at financial services providers to a four-year low. The business services sector was the brightest spot, being the only sub-industry covered to register a faster pace of expansion. January saw output growth ease (on average) in both developed and emerging nations, slipping to 28- and three-month lows respectively. Service sector activity increased in all except two (France and Italy) nations. The US remained one of the strongest performers, despite seeing its rate of expansion slow slightly. China also saw a solid (albeit slower) increase in output. Rates of expansion were below the global average in the euro area, Japan, the UK, Australia, India and Brazil. Service providers maintained a positive outlook for the year ahead at the start of 2019, with business optimism improving to a three-month high. The news of the price front was mixed, with January seeing an acceleration of output charge inflation and a slower rate of increase in average costs. Output growth in the global service sector slowed further in January, as the rate of expansion in new business dipped to a 28-month low. This filtered through to the jobs market, with service sector staffing rising at the weakest pace since April There may be better news on the horizon, however, as companies improved outlook for the coming year may be an early sign that the slowdown is nearing its end. David Hensley, Global Economist, JPMorgan Source: 2/5/19
64 Private Indicators: Global Sources: IHS Markit, JP Morgan JP Morgan Composite PMI At 52.1 in January, down from 52.7 in December, J.P. Morgan Global Composite Output Index which is produced by J.P. Morgan and IHS Markit in association with ISM and IFPSM posted its lowest reading since September Rates of expansion slowed in both the manufacturing (31-month low) and service (28-month low) sectors. Growth in services business activity outpaced that of manufacturing production for the ninth month running. Global economic growth slowdown continues at start of 2019 The rate of global economic expansion eased to a near two-and-a-half-year low in January, as growth of new order inflows weakened and international trade in goods and services contracted. Output expanded in three out of the six sub-industries covered by the survey during January. The strongest rates of increase were seen in the business services and consumer goods sectors, with the former the only category to see growth accelerate. Expansion was also seen at financial service provides, although the rate of increase slowed sharply to a four-year low. Inflows of new business rose at the slowest pace in two-and-a-half years during January. Growth in manufacturing new orders slumped to near-stagnation, while new work at service providers rose at the weakest pace since September New export business fell in both the manufacturing and service sectors. The January PMIs signal that global economic growth slowed to a 28-month low, as inflows of new work rose at a weaker pace and international trade in goods and services fell for the second month in a row. The trend in new orders will need to pick-up substantially in the coming months if global GDP growth is to recover to a level more in line with expectations for 2019 as a whole. David Hensley, Global Economist, J.P. Morgan Source: 2/5/19
65 Private Indicators: Global Source: IHS Markit Markit/CIPS UK Manufacturing PMI The headline seasonally adjusted IHS Markit/CIPS Purchasing Managers Index (PMI ) which provides a single-figure tracker of the performance of the sector fell to a three-month low of 52.8, down from 54.2 in December and its second-weakest reading since July 2016 (the first survey month following the EU referendum result). Series-record stockpiling of inputs at UK manufacturers as Brexit preparations continue The manufacturing sector made a lacklustre start to 2019, as trends in output and new orders slowed and employment fell for only the second time in the past two-and-a-half years. Companies reported that Brexit preparations led to sharp rises in both purchasing activity and stockpiling of inputs at warehouses. The trend in production volumes was the weakest registered during the past two-and-a-half years. Although output rose solidly at consumer goods producers, this was largely offset by weaker expansion in the intermediate goods sector and the first decline in investment goods output since July The start of 2019 saw UK manufacturers continue their preparations for Brexit. Stocks of inputs increased at the sharpest pace in the 27-year history, as buying activity was stepped up to mitigate against potential supply-chain disruptions in coming months. There were also signs that inventories of finished goods were being bolstered to ensure warehouses are well stocked to meet ongoing contractual obligations. Based on its historical relationship against official data, the January survey is consistent with a further solid contraction of production volumes, meaning manufacturing will likely act as a drag on the economy in the first quarter. January also saw manufacturing jobs being cut for only the second time since mid as confidence about the outlook slipped to a 30-month low, often reflecting ongoing concerns about Brexit and signs of a European economic slowdown. With neither of these headwinds likely to abate in the near-term, there is a clear risk of manufacturing sliding into recession. Rob Dobson, Director & Senior Economist, IHS Markit Source: 2/1/19
66 Private Indicators American Institute of Architects (AIA) December Architecture Billings Index ABI December 2018: The year ends with slow billings growth The pace of billings growth at architecture firms slowed modestly to end 2018, with AIA s Architecture Billings Index (ABI) score declining from 54.7 in November to 50.4 in December (any score over 50 indicates billings growth). But despite flat billings in December, firm billings increased every month of the year in And while concern about a potential economic slowdown looms for 2019, firms are not yet seeing any clear signs of it in their project workloads. Inquiries into new projects and the value of new design contracts both continued to grow steadily in December, while backlogs at firms continued to lengthen. In fact, they reached an average of 6.4 months, the strongest they have been since the collection of backlog data began on a quarterly basis in The American Institute of Architects Source: 1/23/19

67 Private Indicators: AIA Region Architecture firm billings also strengthened at firms located in the Northeast and Midwest in December, with firms in the Midwest reporting particularly strong conditions. Business conditions softened for the third consecutive month at firms located in both the South and the West, but the decline remained relatively minimal. The American Institute of Architects Source: 1/23/19

68 Private Indicators: AIA Sector Billings also flattened at firms with a residential specialization in December, but strengthened at firms with commercial/industrial and institutional specializations. The American Institute of Architects Source: 1/23/19
69 Private Indicators Dodge Data & Analytics New Construction Starts in December Decline 10 Percent; Annual Total for 2018 Edges Up 0.3 Percent to $789.0 Billion New construction starts in December fell 10% to a seasonally adjusted annual rate of $708.9 billion, continuing to retreat after November s 7% slide, according to Dodge Data & Analytics. The December downturn reflected diminished activity for each of the three main construction sectors. Nonresidential building dropped 14%, as its commercial building segment lost momentum following its heightened November amount. Residential building pulled back 8%, due to reduced activity in December for both single family and multifamily housing. Nonbuilding construction decreased 9%, with a steep plunge by the electric utility/gas plant category that outweighed a December rebound for public works. For 2018 as a whole, total construction starts increased a slight 0.3% to $789.0 billion. This came after 7% gains in both 2016 and 2017, as well as 11% to 14% gains from 2012 through The 2018 increase for total construction starts was restrained by a 31% plunge for the electric utility/gas plant category. If electric utilities and gas plants are excluded, total construction starts for 2018 would be up 2% from The December statistics produced a reading of 150 for the Dodge Index (2000=100), down from 167 in November and 179 in October, while matching the 2018 low at 150 reported back in September. For the full year 2018, the Dodge Index averaged 167. Nicole Sullivan, AFFECT Public Relations & Social Media Source: 1/24/19
70 Private Indicators Dodge Data & Analytics The monthly pattern of construction starts was mixed during 2018, as elevated activity in June and October was offset by weaker activity in the months immediately following, with the end result being that the 2018 dollar amount of construction starts was slightly above the previous year. By recent standards, the overall level of construction starts in 2018 can be regarded as healthy, but the substantially slower rate of growth compared to the prior six years is suggestive of a market that s close to a peak. There were several noteworthy features that stand out in the 2018 construction starts data. Last year s brisk economic expansion enabled market fundamentals for multifamily housing and commercial building to strengthen, which supported more growth for apartment projects, office buildings, and hotels. However, store construction continued to decline, adversely affected by the glut of retail space produced in the previous decade as well as by the greater role now played by e-commerce. Single family housing showed improvement early in 2018, but then plateaued and began to recede given affordability constraints. The institutional building segment showed more growth for educational facilities and witnessed a number of major transportation terminals reach groundbreaking, although not to the same extent as what took place in Public works construction benefitted from the 2018 omnibus federal appropriations bill passed last March, as well as funding arising from recent state transportation bond measures. Going forward into 2019, economic growth is not expected to be as strong as what occurred during 2018, which may dampen groundbreaking for multifamily housing and commercial building projects. In addition, more growth for public works this year requires that federal appropriations for fiscal 2019 get finalized without much further delay. Robert A. Murray, Chief Economist, Dodge Data & Analytics Source: 1/24/19
71 Private Indicators Dodge Data & Analytics Residential building in December was $300.6 billion (annual rate), down 8% from the previous month. Multifamily housing retreated 15%, slipping for the second month in a row after a 19% gain in October. There were four multifamily projects valued at $100 million or more that reached groundbreaking in December, compared to ten such projects in November. The large multifamily projects in December were led by a $265 million apartment building in Oakland CA and a $150 million apartment building in Long Beach CA. Single family housing in December dropped 5%, settling back from the extended plateau that was present for much of The December pace for single family housing was down 7% from the average dollar volume for the previous eleven months. The 2018 amount for residential building was $323.5 billion, up 5%. Multifamily housing grew 8% in 2018, rebounding from the 8% decline that was reported for The largest multifamily projects that reached groundbreaking in 2018 were the $700 million City View Tower at Court Square in Queens NY, the $580 million multifamily portion of the Winthrop Square Tower in Boston MA, and the $550 million Queens Plaza Park Apartments in Queens NY. The top five metropolitan areas ranked by the 2018 dollar amount of multifamily starts, with their percent change from a year ago, were New York NY, up 2%; Boston MA, up 71%; Washington DC, up 26%; Miami FL, up 43%; and Los Angeles CA, down 11%. Metropolitan areas ranked 6 through 10 were San Francisco CA, up 23%; Seattle WA, up 25%; Dallas-Ft. Worth TX, up 24%; Chicago IL, down 28%; and Philadelphia PA, up 3%. Eight of the top ten metropolitan areas for multifamily housing were able to report gains in 2018 relative to the prior year, comparing favorably to 2017 which saw only three of the top ten metropolitan areas reporting gains relative to the prior year. Single family housing in 2018 grew 4%, a smaller increase than the 9% pickup in By geography, single family housing in 2018 showed this pattern for the five major regions the West, up 8%; the South Atlantic, up 5%; the South Central, up 4%; the Midwest, up 1%; and the Northeast, down 1%. Robert A. Murray, Chief Economist, Dodge Data & Analytics Source: 1/24/19
72 Private Indicators Dodge Data & Analytics Nonresidential building in December was $242.8 billion (annual rate), down 14% from the previous month. The commercial building categories as a group fell 27% after registering a 15% increase in November that featured the start of the $1.5 billion Manchester Pacific Gateway mixeduse complex in San Diego CA with hotel, office, retail, museum, and garage space. Office construction in December dropped 34%, following its November amount that included the start of a $750 million Facebook data center in Covington GA, the $544 million office portion of the Manchester Pacific Gateway complex, and a $530 million California state government office building in Sacramento CA. The largest office projects that were entered as December construction starts were $400 million for three Microsoft data center buildings in San Antonio TX, a $222 million data center in Ashburn VA, and a $135 million California state government office building in Rancho Cordova CA. Hotel construction experienced an even larger percentage decline in December, plunging 41%, after being lifted in November by the $643 million hotel portion of the Manchester Pacific Gateway complex and the $241 million Omni Hotel in Oklahoma City OK. The largest hotel projects that were entered as December construction starts were the $168 million Joseph Nashville Hotel in Nashville TN and the $83 million hotel portion of a $170 million hotel/multifamily mixeduse building in Austin TX. Decreased activity in December was also reported for commercial garages, down 30%; and warehouses, down 24%; although the warehouse category did include the start of a $136 million warehouse complex in Lacey WA and a $130 million warehouse complex in Nampa ID. Store construction was the one commercial project type that registered a December gain, rising 32% with the help of the $52 million Edens Collection shopping mall in Chicago IL. The manufacturing plant category slipped 2% in December, with the largest project entered as a construction start being a $117 million bioenergy plant in Rialto CA. Robert A. Murray, Chief Economist, Dodge Data & Analytics Source: 1/24/19
73 Private Indicators Dodge Data & Analytics The institutional building categories as a group edged up 1% in December, after sliding 22% in November. Educational facilities provided much of the lift in December, climbing 27% with the help of these projects the $650 million renovation of the Smithsonian National Air & Space Museum in Washington DC, a $118 million high school in Queens NY, and a $101 million high school in Waukee IA. The public buildings category also registered growth in December, advancing 48% as a $155 million courthouse reached groundbreaking in Redding CA. In addition, December gains were reported for church construction, up 18%; and transportation terminals, up 1%. Reduced activity was reported in December for amusement-related work, down 42%; and healthcare facilities, down 16%; although the latter did include the start of the $175 million Penn Medicine ambulatory care facility in Wayne PA. For 2018 as a whole, nonresidential building eased back 1% to $282.8 billion after its 11% increase in A major reason for the double-digit gain in 2017 was an 18% jump by the institutional building segment, which benefitted from a sharp 126% hike for transportation terminal starts. Reduced activity in 2018 was also shown by healthcare facilities, which retreated 9% after its 6% gain in 2017 that included the start of the $1.4 billion Penn Medicine Patient Pavilion in Philadelphia PA. In 2018, large hospital projects continued to reach groundbreaking, although not quite to the same extent as 2017, as the 2018 large hospital projects were led by the $500 million Cincinnati Children s Hospital expansion in Cincinnati OH and the $400 million Boston Children s Clinical Building in Boston MA. Robert A. Murray, Chief Economist, Dodge Data & Analytics Source: 1/24/19
74 Private Indicators Dodge Data & Analytics Full year 2018 declines were also posted by church construction, down 21%; and the public buildings category, down 2%. On the plus side for institutional building in 2018, educational facilities continued to see moderate growth, rising 5% and helped in particular by a 16% advance for K-12 school buildings. The top five states ranked by the dollar amount of K-12 school construction starts in 2018, with their percent change from the previous year, were the following Texas, up 9%; California, up 30%; New York, up 12%; Washington, up 35%; and Pennsylvania, up 105%. Amusement-related construction starts also strengthened in 2018, rising 9%, with support coming from such projects as the $1.3 billion football stadium in Las Vegas NV for the soon-to-relocate Oakland Raiders, the $860 million expansion to the Las Vegas Convention Center, and the $810 million expansion to the Washington State Convention Center in Seattle WA. The commercial building categories as a group grew 1% in 2018, the same as the 1% rise in 2017 which followed a 23% surge in Office construction in 2018 advanced 10%, led by such projects as the $1.8 billion Spiral office building in the Hudson Yards district of New York NY, a $655 million office building on North Wacker Drive in Chicago IL, and the $644 million office portion of the $1.3 billion Winthrop Square Tower in Boston MA. Large data center project starts, which are included in the office category, were also very strong in 2018, led by a $1.0 billion Facebook data center in Papillion NE plus three Facebook data centers valued at $750 million each that were located in Huntsville AL, Eagle Mountain UT, and Covington GA. There were also three very large Google data centers valued at $600 million each that reached groundbreaking in Clarksville TN, Pryor OK, and Stevenson AL. The top five metropolitan areas ranked by the dollar amount of new office construction starts, with their percent change from the previous year, were New York NY, up 22%; Washington DC, up 36%; Boston MA, up 102%; Chicago IL, up 67%; and Atlanta GA, up 2%. Robert A. Murray, Chief Economist, Dodge Data & Analytics Source: 1/24/19
75 Private Indicators Dodge Data & Analytics Hotel construction starts in 2018 climbed 11%, helped by such projects as the $643 million hotel portion of San Diego s Manchester Pacific Gateway complex, the $450 million Omni Seaport Hotel in Boston MA, and the $320 million Four Seasons Hotel in New Orleans LA. Commercial garage construction starts in 2018 held steady with 2017, while warehouse construction starts settled back 6% from a very strong Store construction in 2018 fell 21%, dropping for the second year in a row after a 5% decline in The manufacturing plant category in 2018 strengthened 20%, boosted by a $6.5 billion uranium processing plant in Oak Ridge TN, numerous outdoor chemical plants led by a $2.4 billion propylene oxide plant in Channelview TX, and more typical manufacturing plants such as an $800 million aluminum rolling mill in Ashland KY and a $682 million Continental Tire plant in Clinton MS. Robert A. Murray, Chief Economist, Dodge Data & Analytics Source: 1/24/19

76 Private Indicators Source: 1/24/19
77 Private Indicators MNI Chicago Business Barometer Cooled to 56.7 in January The MNI Chicago Business Barometer dropped to 56.7 in January, down 7.1 points from December s downwardly adjusted Barometer Starts the Year on Moderate Footing; New Orders Lowest in Two Years Four out of the five Barometer sub-components started the year lower. Notable falls in Production and New Orders contributed to most of the 7.1-point fall in the headline index. The decline marked the fifth time in two years the Barometer has fallen on a year-over-year basis. However, the Barometer continues to signal healthy business conditions, recording a 24th consecutive reading above 50. Contributing to the bulk of January s downside was a drop in New Orders to a two year low. As a result of January s weak order book strength, Production declined to a 10-month low. Firms noted an inability to absorb cost-push pressures as a reason for customers being deterred from placing orders in January. Order Backlogs did not build on the momentum seen in the latter stages of Q4 and eased to a three-month low. On balance, firms reported a relatively small drop in inventory levels in January. However. there was anecdotal evidence of firms accumulating stock because of new product launches and incentive programs. Some firms increased inventories in expectation of stronger orders, whilst others as a result of higher lead times and tariffs. The MNI Chicago Business Barometer had a sluggish start to 2019, pressured by significant drops in both New Orders and Production, resulting in the lowest headline reading in two years. Encouragingly, some anecdotal evidence pointed to temporary factors such as holidays as the reason for dampening output as opposed to inherent weakness in demand. Jai Lakhani, Economist, MNI Indicators Source: 1/31/19
, following a 0.2 percent increase in November, and a 0.3 percent decline in October. U.S.")
78 Private Indicators The Conference Board Leading Economic Index (LEI) for the U.S. Declined The Conference Board Leading Economic Index (LEI) for the U.S. declined 0.1 percent in December to (2016 = 100), following a 0.2 percent increase in November, and a 0.3 percent decline in October. U.S. Composite Economic Indexes (2016 = 100) Source: The Conference Board Economic growth may be peaking; economy could decelerate to 2 percent growth by year end The US LEI declined slightly in December and the recent moderation in the LEI suggests that the US economic growth rate may slow down this year. While the effects of the government shutdown are not yet reflected here, the LEI suggests that the economy could decelerate towards 2 percent growth by the end of Ataman Ozyildirim, Director of Business Cycles and Growth Research, The Conference Board The Conference Board Coincident Economic Index (CEI) for the U.S. increased 0.2 percent in December to (2016 = 100), following a 0.2 percent increase in November, and a 0.2 percent increase in October. The Conference Board Lagging Economic Index (LAG) for the U.S. increased 0.5 percent in December to (2016 = 100), following a 0.5 percent increase in November and a 0.6 percent increase in October. The Conference Board Source: 1/24/19
79 Private Indicators Source: The Conference Board The Conference Board Help Wanted OnLine (HWOL) Online Labor Demand Increased Slightly in January Decline in oil prices since October is leading to a decline in online ads in the oil industry Northeast region saw the largest job ads growth in January The Conference Board Experimental Help Wanted OnLine (HWOL) Index increased in January. The Index now stands at (July 2018=100), up from in December. Unlike in 2016 where there was a clear drop in online job ads during the economic slowdown, the HWOL Index rose in January despite the current financial market turmoil. This indicates a reduced likelihood of a major slowdown in the US economy. We expect employment growth in the first half of 2019 to modestly slow down, and labor turnover rates to increase as the labor market tightens. Recruiters will continue to be busy replacing workers and filling new positions. Gad Levanon, Chief Economist, North America, at The Conference Board Source: 2/6/19
80 Private Indicators Equipment Leasing and Finance Association Equipment Leasing and Finance Industry Confidence Eases Further in January The Equipment Leasing & Finance Foundation (the Foundation) releases the January 2019 Monthly Confidence Index for the Equipment Finance Industry (MCI-EFI). Designed to collect leadership data, the index reports a qualitative assessment of both the prevailing business conditions and expectations for the future as reported by key executives from the $1 trillion equipment finance sector. Overall, confidence in the equipment finance market eased further in January to 53.4, a decrease from the December index of Anneliese DeDiemar, Author, Equipment Leasing & Finance Association I believe economic conditions in 2019 will be less favorable than As such, I expect the equipment finance industry to continue its growth, although at a lesser pace than the prior two years. Excess market liquidity will continue to adversely impact margins and will have a long-term impact on industry profitability. Creativity and efficiency will be key to future success. Thomas Jaschik, President, BB&T Equipment Finance Businesses seem more cautious to continue expansion until the environment in Washington and the stock market becomes more stable. The government shutdown continues to emphasize the incredible polarization that exists in our government. This type of environment makes it difficult to consider investment in equipment. Valerie Hayes Jester, President, Brandywine Capital Associates The industry has sufficient liquidity at relatively low cost. While there continues to be slack and uncertainty in business investment, fundamentals in the economy are still positive. Paul Menzel, CLFP, President and CEO, Financial Pacific Leasing, Inc., an Umpqua Bank Company Fundamentally business and the economy remain strong. Areas of concern in the future like foreign trade, interest rates, and government spending cast a cloud that brings caution to expansion plans. Harry Kaplun, President, Specialty Finance, Frost Bank Source: 1/17/19
81 Private Indicators Equipment Leasing and Finance Association Equipment Leasing and Finance Industry Confidence Eases Further in November January 2019 Survey Results: The overall MCI-EFI is 53.4, a decrease from 55.5 in December. When asked to assess their business conditions over the next four months, 10% of executives responding said they believe business conditions will improve over the next four months, a decrease from 13.8% in December. 70% of respondents believe business conditions will remain the same over the next four months, an increase from 65.5% the previous month. 20% believe business conditions will worsen, down slightly from 20.7% who believed so the previous month. 3.3% of survey respondents believe demand for leases and loans to fund capital expenditures (capex) will increase over the next four months, a slight decrease from 3.5% in December. 80% believe demand will remain the same during the same fourmonth time period, an increase from 79.3% the previous month. 16.7% believe demand will decline, down from 17.2% who believed so in December. 21.4% of the respondents expect more access to capital to fund equipment acquisitions over the next four months, up from 17.2% in December. 78.6% of executives indicate they expect the same access to capital to fund business, an increase from 75.9% last month. None expect less access to capital, down from 6.9% last month. Anneliese DeDiemar, Author, Equipment Leasing & Finance Association Source: 1/17/19
82 Private Indicators Equipment Leasing and Finance Association January 2019 Survey Results: When asked, 33.3% of the executives report they expect to hire more employees over the next four months, a decrease from 44.8% in December. 53.3% expect no change in headcount over the next four months, an increase from 44.8% last month. 13.3% expect to hire fewer employees, up from 10.3% last month. 36.7% of the leadership evaluate the current U.S. economy as excellent, a decrease from 41.4% in December. 63.3% of the leadership evaluate the current U.S. economy as fair, an increase from 58.6% last month. None evaluate it as poor, unchanged from last month. 10% of the survey respondents believe that U.S. economic conditions will get better over the next six months, down slightly from 10.7% in December. 50% of survey respondents indicate they believe the U.S. economy will stay the same over the next six months, a decrease from 53.6% the previous month. 40% believe economic conditions in the U.S. will worsen over the next six months, an increase from 35.7% in December. In January, 26.7% of respondents indicate they believe their company will increase spending on business development activities during the next six months, a decrease from 42.9% last month. 73.3% believe there will be no change in business development spending, an increase from 57.1% in December. None believe there will be a decrease in spending, unchanged from last month. Anneliese DeDiemar, Author, Equipment Leasing & Finance Association Source: 1/17/19

83 Private Indicators Source: 1/17/19
84 Private Indicators Equipment Leasing and Finance Association s Survey of Economic Activity: Monthly Leasing and Finance Index December New Business Volume Down 1 Percent Year-over-year, Up 59 Percent Month-to-month, and Up 4 Percent at Year-end The Equipment Leasing and Finance Association s (ELFA) Monthly Leasing and Finance Index (MLFI-25), which reports economic activity from 25 companies representing a cross section of the $1 trillion equipment finance sector, showed their overall new business volume for December was $12.7 billion, down 1 percent year-over-year from new business volume in December Volume was up 59 percent month-to-month from $8.0 billion in November in a typical end-of-year spike. Cumulative new business volume for 2018 was up 4 percent from Receivables over 30 days were 1.70 percent, up from 1.60 the previous month and up from 1.50 percent the same period in Charge-offs were 0.55 percent, up from 0.37 percent the previous month, and up from 0.48 in the year-earlier period. Credit approvals totaled 77.9 percent in December, up from 77.2 percent in November. Total headcount for equipment finance companies was up 0.1 percent year over year. Separately, the Equipment Leasing & Finance Foundation s Monthly Confidence Index (MCI-EFI) in January is 53.4, down from the December index of Amy Vogt, Vice President, Communications and Marketing; Equipment Leasing & Finance Association Source: 1/24/19
85 Private Indicators Equipment Leasing and Finance Association Monthly Leasing & Finance Index: December 2018 December new business volume capped off a very good year for the equipment leasing and finance industry. Solid demand, an abundant supply of funding in the credit markets, and quality portfolios all contributed to an extremely healthy equipment finance sector in Notably, MLFI-25 respondents indicated that credit approvals were at an all-time high in December, reflecting members willingness to provide the necessary financing to thousands of American businesses as they take advantage of a benign economy to acquire equipment to grow and expand their operations. Most economists expect a lower-growth scenario in 2019, as a result of trade policy frictions, rising interest rates, and the current government shutdown. Whether these and other potential headwinds act as a brake on continued growth in the equipment finance sector over the next 12 months remains to be seen. What is known, however, is that ELFA members always seem to rise to the occasion to do whatever is necessary for U.S. businesses both large and small to acquire productive assets that drive their businesses and move the economy forward. Ralph Petta, CEO, Equipment Leasing & Finance Association 2018 was another strong year for the equipment finance industry, as reflected in the most recent MLFI-25 data. Customers across a wide variety of industries and revenue sizes invested in their businesses last year and the equipment finance industry supported that growth. Looking forward, the primary issues we hear about from our clients revolve around global trade uncertainty and a lack of skilled labor availability. Despite those concerns, we see continued business optimism and investment in automation and capital equipment expansion throughout the early stages of Jud Snyder, President, BMO Harris Equipment Finance Company, and ELFA Chairman Source: 1/24/19

86 Private Indicators Source: 1/24/19
87 Private Indicators Source: 1/24/19
88 Private Indicators Source: 1/24/19
89 Private Indicators Freight Waves Weekly Market Update: Has the freight market bottomed? The first week of February has been remarkably stable regarding freight market volatility. The National Tender Rejection Index has only moved 14 bps higher over the past 7 days. Volumes have fallen about 1.1% from end of month levels but have had no significant swings. The market has at least stopped falling for the moment, meaning capacity is not loosening any further with the same amount available this week versus last. With this being the slowest time of year, both economically speaking and in terms of freight volumes, does this mean the market has found its bottom? A freight market bottom would be where capacity is as loose as it has been with heavy downward pressure on rates. With the market in a holding pattern over the past week after being on a slow decline from mid-january, there simply isn t much further to go with a rejection rate of 7.8%. March is just a few short weeks away and the southern tier of the country will start heading back outdoors to start building houses and buying patio furniture. Store shelves will need to be stocked with seasonal inventory. This push of freight normally doesn t begin in earnest until early to mid-march. The Chinese New Year (CNY) began yesterday, but that will not have an impact to the freight market for a few weeks if at all. Weekly rail intermodal volumes, which are heavily tied to imported containers, have declined over 8% since peaking in early December and are roughly 9% lower than this time last year. Intermodal volumes had been trending higher throughout 2018 but appear to be softening in early This has a spillover effect to the truckload market as this means there are fewer intermodal shipments to haul. Zach Strickland, FreightWaves Source: 2/7/19

90 Private Indicators The Freightos Baltic Index, that measures the spot rate for shipping 40-foot containers from China to North America s West Coast, has fallen from $2,110 to $2,051 over the past two weeks an indication that there has not been a significant impact to shipping capacity in the maritime market. In other words, don t expect a big shot of containers hitting the market prior to the March 1st deadline. The Los Angeles market is still repositioning all the inbound freight it received from the previous months as outbound volumes remain elevated, averaging 10% more than last week. Short haul length of haul miles -- rejection rates from the market have been on the increase over the past two weeks, climbing 213 bps. These loads are having more trouble finding capacity than any other length of haul, averaging 5.08% rejection rate compared to the market average of around 2.4%. The fact the warehouses seem full, and maritime rates have fallen leading up to the CNY, would suggest we will not see a big impact from inbound freight prior to the March 1st tariff deadline. With that being off the table, the chances for surging volumes prior to the standard spring seasonal push seem slim. That being said, volumes are not falling rapidly, and rejection rates are essentially flat through the first week of February. There is still room to fall, however, and historically speaking February has as much chance of finding a floor as January, but each passing week the odds get smaller for falling any further. Zach Strickland, FreightWaves Source: 2/7/19
91 January 2019 Manufacturing ISM Report On Business January 2019 PMI at 56.6% New Orders, Production, and Employment Growing Supplier Deliveries Slowing at Slower Rate; Backlog Growing Raw Materials Inventories Growing; Customers Inventories Too Low Prices Decreasing; Exports and Imports Growing Economic activity in the manufacturing sector expanded in January, and the overall economy grew for the 117th consecutive month, say the nation's supply executives in the latest Manufacturing ISM Report On Business. The January PMI registered 56.6 percent, an increase of 2.3 percentage points from the December reading of 54.3 percent. The New Orders Index registered 58.2 percent, an increase of 6.9 percentage points from the December reading of 51.3 percent. The Production Index registered 60.5 percent, 6.4-percentage point increase compared to the December reading of 54.1 percent. The Employment Index registered 55.5 percent, a decrease of 0.5 percentage point from the December reading of 56 percent. The Supplier Deliveries Index registered 56.2 percent, a 2.8 percentage point decrease from the December reading of 59 percent. The Inventories Index registered 52.8 percent, an increase of 1.6 percentage points from the December reading of 51.2 percent. The Prices Index registered 49.6 percent, a 5.3-percentage point decrease from the December reading of 54.9 percent, indicating lower raw materials prices for the first time in nearly three years. Timothy R. Fiore, CPSM, CPSD, Chair of the ISM Manufacturing Business Survey Committee Source: 2/1/19
92 January 2019 Manufacturing ISM Report On Business Comments from the panel reflect continued expanding business strength, supported by strong demand and output. Demand expansion improved with the New Orders Index reading returning to the high 50s, the Customers Inventories Index remaining too low, and the Backlog of Orders remaining at a near-zero-expansion level. Consumption continued to strengthen, with production expanding strongly and employment continuing to expand at previous-month levels. Inputs expressed as supplier deliveries, inventories and imports continued to improve, but are negative to PMI expansion. Inputs reflect an easing business environment, confirmed by Prices Index contraction. Exports continue to expand, but at the lowest level since the fourth quarter of Prices contracted for the first time since the first quarter of The manufacturing sector continues to expand, reversing December s weak expansion, but inputs and prices indicate fundamental changes in supply chain constraints. Of the 18 manufacturing industries, 14 reported growth in January, in the following order: Textile Mills; Computer & Electronic Products; Plastics & Rubber Products; Miscellaneous Manufacturing; Furniture & Related Products; Printing & Related Support Activities; Primary Metals; Chemical Products; Transportation Equipment; Machinery; Fabricated Metal Products; Petroleum & Coal Products; Food, Beverage & Tobacco Products; and Electrical Equipment, Appliances & Components. The only industry reporting contraction in January is Nonmetallic Mineral Products. Timothy R. Fiore, CPSM, CPSD, Chair of the ISM Manufacturing Business Survey Committee Source: 2/1/19
93 January 2019 Non-Manufacturing ISM Report On Business January PMI at 56.7% Business Activity Index at 59.7%; New Orders Index at 57.7%; Employment Index at 57.8% Economic activity in the non-manufacturing sector grew in January for the 186th consecutive month, say the nation s purchasing and supply executives in the latest Non-Manufacturing ISM Report On Business. The NMI registered 56.7 percent, which is 1.3 percentage points lower than the December reading of 58 percent. This represents continued growth in the non-manufacturing sector, at a slower rate. The Non-Manufacturing Business Activity Index decreased to 59.7 percent, 1.5 percentage points lower than the December reading of 61.2 percent, reflecting growth for the 114th consecutive month, at a slower rate in January. The New Orders Index registered 57.7 percent, 5 percentage points lower than the reading of 62.7 percent in December. The Employment Index increased 1.2 percentage points in January to 57.8 percent from the December reading of 56.6 percent. The Prices Index increased 1.4 percentage points from the December reading of 58 percent to 59.4 percent, indicating that prices increased in January for the 20th consecutive month. According to the NMI, 11 non-manufacturing industries reported growth. The non-manufacturing sector s growth rate cooled off in January. Respondents are concerned about the impacts of the government shutdown but remain mostly optimistic about overall business conditions. Anthony Nieves, CPSM, C.P.M., A.P.P., CFPM, Chair of the Institute for Supply Management (ISM ) Non-Manufacturing Business Survey Committee Source: 2/5/19
94 Private Indicators Source: IHS Markit Markit U.S. Manufacturing PMI The seasonally adjusted IHS Markit final U.S. Manufacturing Purchasing Managers Index (PMI ) 54.9 in January, up from 53.8 in December. The latest headline figure signaled a strong and faster improvement in the overall health of the sector, and was above the long-run series average. Output growth picks up to four-month high in January Overall operating conditions across the U.S. manufacturing sector improved in January, supported by faster expansions in output and new orders. Domestic demand drove new business growth, as new export orders rose only marginally and at the weakest rate since last October. Business confidence about the year ahead also picked up markedly to reach a three-month high. Meanwhile, goods producers increased their workforce numbers strongly amid a quicker rise in new orders. Nonetheless, backlogs continued to expand. On the price front, input cost inflation eased to a 12-month low but remained marked and above the series trend. January saw US manufacturers start the year with renewed vigour. Production rose at a markedly increased rate, commensurate with the factory sector contributing to robust economic growth of approximately 2.5% in the first quarter if such momentum can be sustained in coming months. Other encouraging signs included an improved rate of job creation and increased purchasing of inputs, suggesting firms are in the mood for expanding capacity. The upturn in business activity in January helped lift confidence in the outlook, though many companies clearly remain concerned about the impact of trade wars and rising protectionism. Domestic markets provided the main source of new work for manufacturers, offsetting a near-stalling of export trade, the latter linked to subdued demand for US goods in foreign markets. Although higher than December, the overall rise in new orders was the second-lowest since last August, hinting at a slight cooling of demand growth in recent months which served to keep the headline PMI below the average recorded last year. Chris Williamson, Chief Economist, Markit Source: 2/1/19
95 Private Indicators Source: IHS Markit Markit U.S. Services PMI The seasonally adjusted final IHS Markit U.S. Services Business Activity Index registered 54.2 in January, down slightly from 54.4 in December. Anecdotal evidence linked the solid rise in business activity to a sustained increase in new orders and greater client demand. That said, the rate of expansion was the softest for four months and weaker than both the series trend and the average seen in Joint-weakest rise in new business since October 2017 January data signalled a further upturn in business activity across the service sector. The rise in output was the slowest for four months, amid one of the softest increases in new business seen for more than a year. Although only fractional, new export orders fell for the second successive month. In line with a slower rise in new business, employment growth eased to the second-weakest since June However, firms registered a stronger degree of confidence towards business activity levels over the coming 12 months. New business received by service providers continued to increase at a solid rate, and one that matched that seen in December. The upturn was, however, the joint-slowest since October Where a rise was reported, panellists often attributed this to the release of new product lines and solid domestic demand. Others, meanwhile, suggested client demand growth remained subdued in comparison to the first half of The robust economic growth signalled by the US PMI surveys at the start of the year sits in stark contrast to the near-stalling of growth seen in Europe, China and Japan. At current levels, the surveys are consistent with annualised GDP growth of around 2.5% at the start of the year. Jobs growth remained buoyant as business optimism perked up to its highest since October. Backlogs of work are meanwhile building up, in part because firms struggled to meet demand, which has in turn allowed sellers to continue to push prices higher. However, although still robust, the rates of economic growth, job creation and inflation signalled by the PMI surveys have cooled since peaks seen last year. This possibly reflects some impact from the government shutdown, though scant evidence of such was seen in the anecdotal evidence from the surveys, but also reflects an easing of demand growth, notably from abroad. Foreign sales of goods and services barely rose in January, contrasting with signs of faster growth of domestic orders. Chris Williamson, Chief Economist, Markit Source: 2/5/19
96 Private Indicators National Association of Credit Management Credit Managers Index Credit Managers Index Lags to Open 2019 Combined Sectors (Manufacturing and Services) January s Credit Managers Index (CMI) was characterized by a slight downturn from December As 2019 started, there was a great deal of conversation regarding how the year would progress in comparison to The sense was that 2018 was a pull out all the stops year and 2019 would not likely feature that kind of encouragement. There will be no big tax cut in 2019 and there will be no low interest rate environment as had been provided by the Federal Reserve. There was not even the momentum in terms of growth that carried over from the end of This month s data is not a lot different than it was the month prior, but the trend has been down. That has created some concern regarding the rest of the year, and it will take some good news to force the index to start trending in the opposite direction. The combined index fell a bit from 54.2 to The index remains in expansion territory (a reading above 50) where it has been for the majority of the year. The bad news is this is the lowest reading seen in the last 12 months, hardly the direction preferred. The change was extremely slight as far as the favorable factors are concerned and, in fact, they went up (59.4 to 59.5). The bad news is these last two months have been the only two below 60 in the last year. Even more concerning is the index of unfavorable factors as this reading slumped into contraction territory with a reading of 49.4 compared to the 50.8 notched in December. Dr. Chris Kuehl, NACM Economist, noted the last time these numbers were that low was in April of Up to this point, the decline in the CMI data was felt primarily in the favorable categories, while the unfavorable stayed relatively stable. Now there are some new signs of real distress among creditors. Adam Fusco, Associate Editor, NACM Source: 1/31/19
97 National Association of Credit Management Credit Managers Index Private Indicators It was only a month or two ago that the four categories included in the favorable sector were all reading in the 60s. Now only one remains in that classification. The others are all still in the high 50s, which certainly continues to signal growth, but the pace has slowed a little. The sales category improved slightly from 59 to 59.7, getting close to the 60 line again. The new credit applications also moved back up a little, but the category stayed under the 60 line as it went from 57.5 to The all-important dollar collections number dropped a bit, from 59.3 to 59. The amount of credit extended also dropped, but stayed in the 60s with a reading of 61.2 as compared to 61.9 in December. There was a slight improvement in the rejections of credit applications number 51.4 to 51.8, which is good news given the applications for credit category has been a little weak. The decline in accounts placed for collection is a bit more worrisome. It was at 49.7 and is now at The disputes category sank as well (49.6 to 47.1). There was a similar drop in dollar amount beyond terms as it shifted from 49.3 to The downward trend continues with the dollar amount of customer deductions which fell from 49.7 to 48. The filings for bankruptcy sagged, but stayed in the expansion category by going from 55 to Manufacturing Sector Kuehl relates that the good news story from much of 2018 was the resurgence of the manufacturing sector in the U.S. Many factors played a role in this growth and the question for 2019 is whether they will still be providing that positive impetus. Last year, there was a tax break that allowed companies to buy machinery that had been planned for years, the consumer came back to life pushing demand for a variety of factory goods and the growth of the global economy stimulated the export sector. There will be no tax cut this year, the consumer has been slowing down and the global economy is not expected to grow at the pace it did last year the International Monetary Fund (IMF) just downgraded growth again on the eve of the Davos meeting. Adam Fusco, Associate Editor, NACM Source: 1/31/19
98 National Association of Credit Management Private Indicators Credit Managers Index The favorable and unfavorable numbers both weakened, enough to start creating some worry. The overall favorable factors dropped from 58.9 to 57.7, while the overall unfavorable readings went from 50.7 into the contraction zone with a 49.9 mark. The total for the whole of the manufacturing sector fell from 54 to The sales category improved slightly (59 to 59.1), but it still fell short of the 60s where it has been for the past year. The new credit applications declined considerably from 56.8 to 53.3 not a good sign. This category has been in the 60s since July of 2018 and keeps sliding. The dollar collections data also fell a bit, from 59 to Kuehl noted this is the category that is most carefully watched as it signals whether creditors are staying current with their obligations. The amount of credit extended remained in the 60s, but by the narrowest of margins (60.9 to 60.3). The rejections of credit applications actually improved a little, moving from 51.6 to Kuehl suggests this is especially good news given there has been a decline in the applications for new credit those that are applying are generally creditworthy. The accounts placed for collection slipped into contraction territory with a reading of 49.7 compared to The disputes category also shifted deeper into contraction territory ( ). The dollar amount beyond terms moved into contraction territory as well, dipping from 50 to There was also a significant decline in the category of dollar amount of customer deductions as the reading fell to 46.7 after 49.1 last month. The filings for bankruptcies stayed stable enough, moving from 54.4 to 54. Adam Fusco, Associate Editor, NACM Source: 1/31/19
99 National Association of Credit Management Private Indicators Credit Managers Index Service Sector Kuehl summarizes the service sector by saying the service economy has fared a little better than manufacturing this month as more of the readings are still in the 60s and generally in expansion territory. The sector is very diverse, and that makes the data both intriguing and sometimes confusing. It tends to be weighted toward retail and construction, but health care plays a significant role as well. It is not clear that any of the government shutdown activity has affected the data at this point, but if there is to be a reaction, it would be in the service category given the potential impact on spending by consumers. The overall CMI score for services went from 54.5 to 53.8, the lowest reading since April of last year. Kuehl notes this is not a point of panic at this stage as the data is still in the expansion zone, but the data is clearly weaker than it once was. The favorable factors data actually improved this month and got back into the 60s with a reading of 61.3 as compared to the 59.9 that was notched in December. The unfavorable index fell from 50.9 to 48.8, more of a concern as that signals there is serious weakness in the creditor population showing up. The sales reading regained a little lost ground and moved from 59 to 60.3, while new credit applications also made a nice positive move, jumping from 58.2 to 63, and that was unexpected. Kuehl concludes the focus is now on retail and the consumer. The U.S. economy is unusually reliant on consumer activity as it accounts for some 80% of the GDP (in most European states it is closer to 65%). The consumer confidence levels have been dropping, but these are always volatile and change very quickly, and for a variety of reasons. Adam Fusco, Associate Editor, NACM Source: 1/31/19
100 Private Indicators National Association of Credit Management Credit Managers Index The first sets of data coming in have shown there was good reason to be worried. The Purchasing Managers Index trended lower and so did the December. Now that January is in, there was still more decline although nothing precipitous. The optimists are asserting this is just a breather. They expect recovery in the second half of the year. The more pessimistic assert this will be just the start and conditions will steadily worsen through the year. The message is loud and clear: Companies are having issues, and this has started to affect their ability to keep pace with their obligations. There has been enough of a slowdown in some sectors to impact the data. The numbers are still in the high 40s and not all that far from expansion, but the trend is not in the preferred direction and is likely to get worse as the year progresses. These are lower numbers than would be preferred, but not really cause for panic just yet. The overall score remains in growth territory as do the favorable numbers. Even the unfavorables are just barely in the contraction zone. It seems that many retailers gained additional confidence from the solid holiday season and expect the consumer to keep spending into the new year. That may turn out to be an inaccurate assessment given the recent slump in consumer confidence. The dollar collection numbers stayed right where they were the month prior at 59.6 and the amount of credit extended shifted down a little from 63 to January 2019 versus January 2018 The trend of late has not been what anyone would like to see. The unfavorable numbers are sinking deeper into the contraction zone, and there has not been enough activity in the favorable categories to offset the decline. The sense is that further slowdown is likely. Dr. Chris Kuehl, Economist, NACM Source: 1/31/19

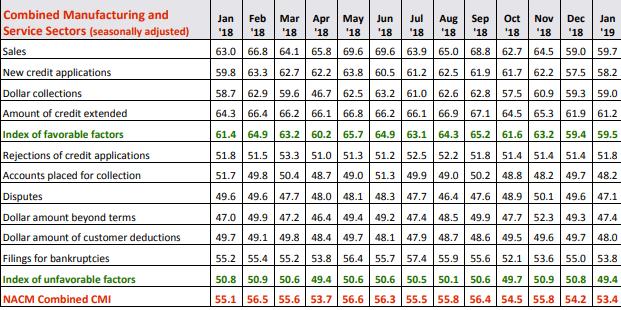
101 Private Indicators Source: 1/31/19

102 Private Indicators January 2019 Report: The NFIB Small Business Optimism Index slipped 3.2 points in January, as owners continued hiring and investing, but expressed rising concern about future economic growth. The reading, the lowest since the weeks leading up to the 2016 elections, remains well above the historical average of 98, but indicates uncertainty among small business owners due to the 35-day government shutdown and financial market instability. The NFIB Uncertainty Index rose seven points to 86, the fifth highest reading in the survey s 45-year history. Small Business Optimism Returning to Normal Levels as Owners Express Uncertainty about the Future Small businesses added a net 0.33 workers per firm, the best reading since July 2018, with 15 percent of owners increasing employment an average of 3.1 workers per firm. Sixty percent reported capital outlays, just one point below December. The net percent of owners reporting inventory increases rose four points to a net seven percent (seasonally adjusted), matching February 2018 and the strongest since April However, the net percent of owners viewing current inventory stocks as too low lost two points, historically a favorable reading but a little less comfortable than in The percent of owners planning to expand inventory stocks fell seven points from exceptionally high levels to one percent of owners. Twenty-three percent of small business owners reported the availability of qualified labor as their top business problem compared to 15 percent citing taxes (up two points), 12 percent citing regulations and red tape, and two percent citing financing (down one point). Holly Wade, NFIB Source: 2/11/19
103 Private Indicators Small Business Optimism Returning to Normal Levels as Owners Express Uncertainty about the Future Business operations are still very strong, but small business owners expectations about the future are shaky. One thing small businesses make clear to us is their dislike for uncertainty, and while they are continuing to create jobs and increase compensation at a frenetic pace, the political climate is affecting how they view the future. Juanita Duggan, President and CEO, NFIB Although January s index showed some positive developments among current business conditions, the return to divided government in Washington created an inability to agree on basic policy measures. This produced the longest partial government shutdown in history, elevating the level of uncertainty, which is damaging to economic activity. William C. Dunkelberg, Chief Economist, NFIB A net four percent of all owners (seasonally adjusted) reported higher nominal sales in the past three months, unchanged, solid, but the lowest reading in a year. The net percent reporting higher sales averaged two percent in 2017 but eight percent in 2018, with a peak value of 15 percent. The net percent of owners expecting higher real sales volumes fell seven points to a net 16 percent of owners. As reported in January s NFIB Jobs Report, reports of higher worker compensation rose to the second highest level in the survey s history to a net 36 percent of all firms. In 2018, nationwide wages increased 3.2 percent. Small business owners continue to hire at record levels, with 56 percent of owners reported hiring or trying to hire. However, 88 percent of those owners reported few or no qualified applicants for the positions. Holly Wade, NFIB Source: 2/11/19
104 Private Indicators The S&P CoreLogic Case-Shiller U.S. National Home Price NSA Index, covering all nine U.S. census divisions, reported a 5.2% annual gain in November, down from 5.3% in the previous month. The 10- City Composite annual increase came in at 4.3%, down from 4.7% in the previous month. The 20-City Composite posted a 4.7% year-over-year gain, down from 5.0% in the previous month. Southwest Region Leads In Annual Gains According To S&P CoreLogic Case-Shiller Index Home prices are still rising, but more slowly than in recent months. The pace of price increases are being dampened by declining sales of existing homes and weaker affordability. Sales peaked in November 2017 and drifted down through Affordability reflects higher prices and increased mortgage rates through much of last year. Following a shift in Fed policy in December, mortgage rates backed off to about 4.45% from 4.95%. Housing market conditions are mixed while analysts comments express concerns that housing is weakening and could affect the broader economy. Current low inventories of homes for sale about a four-month supply are supporting home prices. New home construction trends, like sales of existing homes, peaked in late 2017 and are flat to down since then. Stable 2% inflation, continued employment growth, and rising wages are all favorable. Measures of consumer debt and debt service do not suggest any immediate problems. David Blitzer, Managing Director and Chairman of the Index Committee, S&P Dow Jones Indices Source: 1/29/19
105 Private Indicators S&P/Case-Shiller Home Price Indices City Composite 10-City Composite U.S. National Home Price Index Las Vegas, Phoenix and Seattle reported the highest year-over-year gains among the 20 cities. In November, Las Vegas led the way with a 12.0% year-over-year price increase, followed by Phoenix with an 8.1% increase and Seattle with a 6.3% increase. Seven of the 20 cities reported greater price increases in the year ending November 2018 versus the year ending October Soogyung Jordan, Global Head of Communications, S&P CoreLogic Source: 1/29/19
106 Demographics U.S. Census Bureau 2018 Families and Living Arrangements Adults in the United States are increasingly delaying saying I Do as the median age at first marriage continues to climb, according to new data released by the Census Bureau. The median age at first marriage in the United States has continued to rise in recent years from 27.1 and 25.3 years in 2003 for males and females, respectively, to 29.8 and 27.8 years in This upward trend is consistent with other changes to U.S. households and family structure according to new tables released today by the Census Bureau. As the nation s household and family structure continues to change and median age at first marriage rises, the proportion of young adults who are married has decreased. In 2018, 29 percent of young adults ages 18 to 34 were married, a decrease of 30 percentage points when compared to 59 percent of young adults being married in Along with changes in the age of first marriage and marriage rates, there have been changes in the number of young adults living with an unmarried partner. In 2018, 15 percent of young adults ages 25 to 34 lived with an unmarried partner, up from 12 percent in Among those ages 18 to 24, cohabitation is now more prevalent than living with a spouse; 9 percent of these young adults lived with an unmarried partner, compared to 7 percent who lived with a spouse in Jewel Jordan, Public Information Office, U.S. Census Bureau Source: 12/14/18 Return TOC
107 Demographics U.S. Census Bureau 2018 Families and Living Arrangements Other Highlights: Households In 2018, there are 35.7 million single-person households, composing 28 percent of all households. In 1960, single-person households represented only 13 percent of all households. Marriage and Family In 2018, 32 percent of all adults age 15 and over have never been married, up from 23 percent in Over a quarter (27 percent) of children under the age of 15 who live in married-couple families have a stay-at-home mother, compared to only 1 percent who have a stay-athome father. Living Arrangements of Adults and Children Over half (54 percent) of young adults ages 18 to 24 live in the parental home, compared to 16 percent of young adults ages 25 to 34. Unmarried Couples In 2018, there were 8.5 million unmarried opposite-sex couples living together. These statistics come from the 2018 Current Population Survey Annual Social and Economic Supplement, which has collected statistics on families for more than 60 years. The data shows characteristics of households, living arrangements, married and unmarried couples, and children. Jewel Jordan, Public Information Office, U.S. Census Bureau Source: 12/14/18 Return TOC

108 Demographics Source: 12/14/18 Return TOC


109 Economics Visualizing the Poverty Rate of Each U.S. State In three southern states, Mississippi, Louisiana, and New Mexico, nearly 20% of the population lives below the poverty line. Two Appalachian states round out the top five: West Virginia (19.1%) and Kentucky (17.2%). Here are the five states with the highest levels of poverty today: On the flipside, here are the five states with the lowest levels of poverty: Jeff Desjardins, Editor-in-Chief, Visual Capitalist Source: 12/26/18 Return TOC

110 Economics Source: 12/26/18 Return TOC
111 Economics The Federal Reserve Bank of New York Quarterly Report on Household Debt and Credit 2018 : Q4 Aggregate household debt balances ticked up in the fourth quarter of 2018 for the 18th consecutive quarter, and are now $869 billion (6.9%) higher than the previous (2008Q3) peak of $12.68 trillion. As of December 31, 2018, total household indebtedness was $13.54 trillion, a $32 billion (0.2%) increase from the third quarter of Overall household debt is now 21.4% above the 2013Q2 trough. Mortgage balances, shown on consumer credit reports on December 31 stood at $9.1 trillion, essentially unchanged from the third quarter of Balances on home equity lines of credit (HELOC) continued their declining trend from 2009 with a drop of $10 billion in the fourth quarter and are now at $412 billion, the lowest level seen in 14 years. Non-housing balances increased by $58 billion in the fourth quarter, with auto loans increasing by $9 billion, credit card balances going up by $26 billion, and student loan balances by $15 billion. The increase in credit card balances is consistent with seasonal patterns but marks the first time credit card balances retouched the 2008 peak; card balances now stand at $870 billion. New extensions of credit for mortgage and auto loans slowed in the fourth quarter. Mortgage originations, which we measure as appearances of new mortgage balances on consumer credit reports and which include refinanced mortgages, were at $401 billion, a decline from the volume seen in 2018Q3 and the lowest level seen in nearly four years. There were $144 billion in newly originated auto loans in the fourth quarter of 2018, continuing the nine year growth trend in new auto loans. Auto loan originations totaled $584 billion in 2018, the highest year in the 19-year history of the data for auto loan originations (in nominal terms) and an increase from 2017 s $567 billion. The aggregate credit card limit rose for the 24th consecutive quarter, with a 1.5% increase. Research and Statistics Group, The Federal Reserve Bank of New York Source: 2/12/19 Return TOC
112 Economics The Federal Reserve Bank of New York Quarterly Report on Household Debt and Credit: 2018 : Q4 Housing Debt There was $401 billion in newly originated mortgage debt in 2018Q4. Mortgage delinquencies were flat again, with 1.1% of mortgage balances 90 or more days delinquent in 2018Q3. Delinquency transition rates were mixed, with about 1.0% of current balances transitioning to delinquency. Transitions from early delinquency were flat, as 14.8% of mortgages in early delinquency (30-60 days late) transitioned to 90+ days delinquent. The share of mortgages in early delinquency that cured was 35.1%. Transitions into serious delinquency for credit card accounts increased again. While this rate is highest for younger borrowers, it has risen sharply among older borrowers over the last two years. About 68,000 individuals had a new foreclosure notation added to their credit reports between October 1 and December 31, up slightly the previous quarter. Foreclosures remain very low by historical standards. Student Loans Outstanding student loan debt stood at 1.46 trillion in the fourth quarter, up $15 billion. 11.4% of aggregate student debt was 90+ days delinquent or in default in 2018Q4, a small improvement from the jump seen in the third quarter of Transition rates into delinquency were unchanged. Research and Statistics Group, The Federal Reserve Bank of New York Source: 2/12/19 Return TOC

113 Economics Source: 2/12/19 Return TOC

114 Economics Source: 2/12/19 Return TOC

115 Economics Source: 2/12/19 Return TOC
116 Economics Source: 2/12/19 Return TOC
117 Economics Source: 2/12/19 Return TOC
118 Economics Source: 12/18 Return TOC
119 Economics Source: 12/18 Return TOC

120 Economics Source: 12/18 Return TOC

121 Economics Source: 12/18 Return TOC
The Virginia Tech U.S. Forest Service October 2018 Housing Commentary: Section II
 The Virginia Tech U.S. Forest Service October 2018 Housing Commentary: Section II Urs Buehlmann Department of Sustainable Biomaterials College of Natural Resources & Environment Virginia Tech Blacksburg,
The Virginia Tech U.S. Forest Service April 2018 Housing Commentary: Section II
 The Virginia Tech U.S. Forest Service April 2018 Housing Commentary: Section II Urs Buehlmann Department of Sustainable Biomaterials College of Natural Resources & Environment Virginia Tech Blacksburg,
The Virginia Tech U.S. Forest Service March 2018 Housing Commentary: Section II
 The Virginia Tech U.S. Forest Service March 2018 Housing Commentary: Section II Urs Buehlmann Department of Sustainable Biomaterials College of Natural Resources & Environment Virginia Tech Blacksburg,
The Virginia Tech U.S. Forest Service May 2018 Housing Commentary: Section II
 The Virginia Tech U.S. Forest Service May 2018 Housing Commentary: Section II Urs Buehlmann Department of Sustainable Biomaterials College of Natural Resources & Environment Virginia Tech Blacksburg, VA
The Virginia Tech U.S. Forest Service February 2018 Housing Commentary: Section II
 The Virginia Tech U.S. Forest Service February 2018 Housing Commentary: Section II Urs Buehlmann Department of Sustainable Biomaterials College of Natural Resources & Environment Virginia Tech Blacksburg,
The Virginia Tech U.S. Forest Service June 2018 Housing Commentary: Section II
 The Virginia Tech U.S. Forest Service June 2018 Housing Commentary: Section II Urs Buehlmann Department of Sustainable Biomaterials College of Natural Resources & Environment Virginia Tech Blacksburg,
The Virginia Tech U.S. Forest Service September 2018 Housing Commentary: Section II
 The Virginia Tech U.S. Forest Service September 2018 Housing Commentary: Section II Urs Buehlmann Department of Sustainable Biomaterials College of Natural Resources & Environment Virginia Tech Blacksburg,
The Virginia Tech U.S. Forest Service December 2017 Housing Commentary: Section II
 The Virginia Tech U.S. Forest Service December 2017 Housing Commentary: Section II Urs Buehlmann Department of Sustainable Biomaterials College of Natural Resources & Environment Virginia Tech Blacksburg,
The Virginia Tech U.S. Forest Service November 2017 Housing Commentary: Section II
 The Virginia Tech U.S. Forest Service November 2017 Housing Commentary: Section II Urs Buehlmann Department of Sustainable Biomaterials College of Natural Resources & Environment Virginia Tech Blacksburg,
The Virginia Tech U.S. Forest Service September 2017 Housing Commentary: Section II
 The Virginia Tech U.S. Forest Service September 2017 Housing Commentary: Section II Urs Buehlmann Department of Sustainable Biomaterials College of Natural Resources & Environment Virginia Tech Blacksburg,
The Virginia Tech U.S. Forest Service June 2017 Housing Commentary: Section II
 The Virginia Tech U.S. Forest Service June 2017 Housing Commentary: Section II Urs Buehlmann Department of Sustainable Biomaterials College of Natural Resources & Environment Virginia Tech Blacksburg,
Virginia Tech U.S. Forest Service August 2015 Housing Commentary Part B: Current Markets
 Virginia Tech U.S. Forest Service August 2015 Housing Commentary Part B: Current Markets Urs Buehlmann Department of Sustainable Biomaterials College of Natural Resources & Environment Virginia Tech Blacksburg,
The Virginia Tech U.S. Forest Service May 2017 Housing Commentary: Section II
 The Virginia Tech U.S. Forest Service May 2017 Housing Commentary: Section II Urs Buehlmann Department of Sustainable Biomaterials College of Natural Resources & Environment Virginia Tech Blacksburg, VA
The Virginia Tech U.S. Forest Service August 2017 Housing Commentary: Section II
 The Virginia Tech U.S. Forest Service August 2017 Housing Commentary: Section II Urs Buehlmann Department of Sustainable Biomaterials College of Natural Resources & Environment Virginia Tech Blacksburg,
The Virginia Tech U.S. Forest Service April 2017 Housing Commentary: Section II
 The Virginia Tech U.S. Forest Service April 2017 Housing Commentary: Section II Urs Buehlmann Department of Sustainable Biomaterials College of Natural Resources & Environment Virginia Tech Blacksburg,
The Virginia Tech U.S. Forest Service October 2016 Housing Commentary: Section II
 The Virginia Tech U.S. Forest Service October 2016 Housing Commentary: Section II Urs Buehlmann Department of Sustainable Biomaterials College of Natural Resources & Environment Virginia Tech Blacksburg,
file:///c:/users/cathy/appdata/local/microsoft/windows/temporary Int...
 1 of 5 9/25/17, 8:57 AM A Publication of the National Association of Manufacturers September 25, 2017 As expected, the Federal Reserve opted to not raise short-term interest rates at its September 19 20
Empire State Manufacturing Survey
 November 216 Empire State Manufacturing Survey Business activity stabilized in New York State, according to firms responding to the November 216 Empire State Manufacturing Survey. The headline general
The Virginia Tech U.S. Forest Service February 2017 Housing Commentary: Section II
 The Virginia Tech U.S. Forest Service February 2017 Housing Commentary: Section II Urs Buehlmann Department of Sustainable Biomaterials College of Natural Resources & Environment Virginia Tech Blacksburg,
The Virginia Tech U.S. Forest Service January 2017 Housing Commentary: Section II
 The Virginia Tech U.S. Forest Service January 2017 Housing Commentary: Section II Urs Buehlmann Department of Sustainable Biomaterials College of Natural Resources & Environment Virginia Tech Blacksburg,
Empire State Manufacturing Survey
 December 16 Empire State Manufacturing Survey Business activity grew modestly in New York State, according to firms responding to the December 16 Empire State Manufacturing Survey. The headline general
Empire State Manufacturing Survey.
 February 218 Empire State Manufacturing Survey Business activity continued to expand in New York State, according to firms responding to the February 218 Empire State Manufacturing Survey. The headline
The Virginia Tech U.S. Forest Service June 2016 Housing Commentary: Section II
 The Virginia Tech U.S. Forest Service June 2016 Housing Commentary: Section II Urs Buehlmann Department of Sustainable Biomaterials College of Natural Resources & Environment Virginia Tech Blacksburg,
Empire State Manufacturing Survey
 November 217 Empire State Manufacturing Survey Business activity continued to grow strongly in New York State, according to firms responding to the November 217 Empire State Manufacturing Survey. Though
The Virginia Tech U.S. Forest Service July 2016 Housing Commentary: Section II
 The Virginia Tech U.S. Forest Service July 2016 Housing Commentary: Section II Urs Buehlmann Department of Sustainable Biomaterials College of Natural Resources & Environment Virginia Tech Blacksburg,
Valentyn Povroznyuk, Edilberto L. Segura
 National real GDP grew by 2.3% quarter-over-quarter (qoq) in Q2 2015. Average real GDP growth for Q4 2011-Q1 2015 was revised downwards by 0.2% from the previously published 2.2%. US industrial output
Empire State Manufacturing Survey.
 October 217 Empire State Manufacturing Survey Business activity grew at a robust pace in New York State, according to firms responding to the October 217 Empire State Manufacturing Survey. The headline
Empire State Manufacturing Survey
 December 217 Empire State Manufacturing Survey Business activity continued to grow at a solid clip in New York State, according to firms responding to the December 217 Empire State Manufacturing Survey.
Empire State Manufacturing Survey.
 March 218 Empire State Manufacturing Survey Business activity grew robustly in New York State, according to firms responding to the March 218 Empire State Manufacturing Survey. The headline general business
Empire State Manufacturing Survey
 January 216 Empire State Manufacturing Survey The January 216 Empire State Manufacturing Survey indicates that business activity declined for New York manufacturers at the fastest pace since the Great
Global PMI. Global economy buoyed by rising US strength. June 12 th IHS Markit. All Rights Reserved.
 Global PMI Global economy buoyed by rising US strength June 12 th 2018 2 Global PMI rises but also brings signs of slower future growth At 54.0 in May, the headline JPMorgan Global Composite PMI, compiled
W HIGHLIGHTS - EXECUTIVE SUMMARY
 FURNITURE INSIGHTS Smith Leonard PLLC s Industry Newsletter June 2018 W HIGHLIGHTS - EXECUTIVE SUMMARY e had heard at the High Point Market that business seemed to have picked up a bit. We also heard that
News Release. IHS Markit Flash Eurozone PMI. Eurozone growth slips to one-and-a-half year low in May
 IHS Markit Flash Eurozone PMI Purchasing Managers Index MARKET SENSITIVE INFORMATION EMBARGOED UNTIL 1000 (CEST) / 0800 (UTC) May 23 Eurozone growth slips to one-and-a-half year low in May Key findings:
Investec Services PMI Ireland
 Embargoed until: 06:00 (Dublin) July 4th 18 Investec Services PMI Ireland Sharpest rise in activity since January Investec T: +3-1-421-0496 E: Investec.Economics@investec.ie W: www.investec.ie Investec
The Virginia Tech U.S. Forest Service August 2016 Housing Commentary: Section II
 The Virginia Tech U.S. Forest Service August 2016 Housing Commentary: Section II Urs Buehlmann Department of Sustainable Biomaterials College of Natural Resources & Environment Virginia Tech Blacksburg,
Empire State Manufacturing Survey
 November 218 218 Business activity continued to grow at a solid clip in New York State, according to firms responding to the November 218. The headline general business conditions index edged up two points
Monetary Policy Report: Using Rules for Benchmarking
 Monetary Policy Report: Using Rules for Benchmarking Michael Dotsey Executive Vice President and Director of Research Keith Sill Senior Vice President and Director, Real Time Data Research Center Federal
Empire State Manufacturing Survey.
 August 218 Empire State Manufacturing Survey Business activity remained robust in New York State, according to firms responding to the August 218 Empire State Manufacturing Survey. The headline general
Ulster Bank Northern Ireland PMI
 Embargoed until 0101 (UK) 14 January 2019 Ulster Bank Northern Ireland PMI New orders stagnate in December Key Findings No change in new business ends 25-month sequence of growth Further solid rises in
Ulster Bank Northern Ireland PMI
 Embargoed until 0101 UK (0001 UTC) 10 September 2018 Ulster Bank Northern Ireland PMI New orders rise at weakest pace in four months Key Findings Weaker growth of output and new orders Further increase
Mississippi s Business Monitoring The State s Economy
 Mississippi s Business January 2012 Monitoring The State s Economy ECONOMY AT A GLANCE Volume 70 - Number 1 A Publication of the University Research Center, Mississippi Institutions of Higher Learning
The President s Report to the Board of Directors
 The President s Report to the Board of Directors April 4, 214 Current Economic Developments - April 4, 214 Data released since your last Directors' meeting show the economy was a bit stronger in the fourth
Smith Leonard PLLC Kenneth D. Smith, CPA Mark S. Laferriere, CPA
 FURNITURE INSIGHTS Smith Leonard PLLC s Industry Newsletter May 2018 HIGHLIGHTS - EXECUTIVE SUMMARY A fter hearing about how sluggish business was in the first quarter, our survey of residential furniture
Global PMI. Global economy set for robust Q2 growth. June 8 th IHS Markit. All Rights Reserved.
 Global PMI Global economy set for robust Q2 growth June 8 th 2017 2 PMI indicates robust global growth in Q2 The global economy is on course for a robust second quarter, according to PMI survey data. The
2014: Started with a Deep Hole, Ending with a Whimper Growth Received an Upgrade But Some Payback is in the Cards
 2014: Started with a Deep Hole, Ending with a Whimper The year 2014 will be remembered for its roller-coaster pattern of economic growth. The unusually cold winter weather helped put growth in deep negative
Economic Growth Expected to Slow and Housing to Stabilize in 2019
 Consumer Confidence Expectations in the Next Six Months (%) Economic Developments December 218 Economic Growth Expected to Slow and Housing to Stabilize in 219 The U.S. economy is expected to grow 2.6
Leeds Business Confidence Index
 First Quarter 2018 Volume 11, number 1 colorado.edu/business/brd Leeds Business Confidence Rebounds Ahead of Q1 2018 The Leeds Business Confidence Index (LBCI) captures Colorado business leaders expectations
Michigan Economic Update
 Michigan Economic Update Federal Reserve Bank of Chicago Detroit Branch October 30, 2015 Paul Traub Senior Business Economist The Midwest Economy declined to -0.15 in September while Michigan s contribution
Smith Leonard PLLC Kenneth D. Smith, CPA Mark S. Laferriere, CPA
 FURNITURE INSIGHTS Smith Leonard PLLC s Industry Newsletter August 2018 N HIGHLIGHTS - EXECUTIVE SUMMARY ew orders in June 2018 were up 5% over June 2017, according to our recent survey of residential
Virginia Tech U.S. Forest Service August 2015 Housing Commentary Part C: Demographics/Economics
 Virginia Tech U.S. Forest Service August 2015 Housing Commentary Part C: Demographics/Economics Urs Buehlmann Department of Sustainable Biomaterials College of Natural Resources & Environment Virginia
LIA Monthly Economic Report
 This publication is made possible through the support of:. LIA Monthly Economic Report A Research Report for Directors and Members of the Long Island Association, Inc. November 2018, 2018 Prepared by Dr.
The Beige Book. Summary of Economic Activity
 The Beige Book Eighth District February 2019 Summary of Economic Activity Economic conditions have been unchanged since our previous report. Labor market conditions remained tight as firms continued to
Monetary Policy Report: Using Rules for Benchmarking
 Monetary Policy Report: Using Rules for Benchmarking Michael Dotsey Executive Vice President and Director of Research Keith Sill Senior Vice President and Director, Real-Time Data Research Center Federal
Global PMI. Global economic growth kicks higher at start of fourth quarter but outlook darkens. November 14 th 2016
 Global PMI Global economic growth kicks higher at start of fourth quarter but outlook darkens November 14 th 2016 2 Global PMI at 11-month high in October Global economic growth kicked higher at the start
Editor: Thomas Nilsson. The Week Ahead Key Events Jul, 2017
 Editor: Thomas Nilsson The Week Ahead Key Events 10 16 Jul, 2017 European Sovereign Rating Reviews Recent rating reviews Upcoming rating reviews Source: Bloomberg Monday 10, 08.00 NOR: CPI (Jun) SEB Cons.
Baseline U.S. Economic Outlook, Summary Table*
 October 2014 Solid U.S. Economic Data Belie Market Turmoil Executive Summary September payroll job growth was above consensus with 248,000 jobs added over the month. September private-sector employment
Smith Leonard PLLC Kenneth D. Smith, CPA Mark S. Laferriere, CPA
 Smith Leonard PLLC s Industry Newsletter January 2018 HIGHLIGHTS - EXECUTIVE SUMMARY A ccording to our latest survey of residential furniture manufacturers and distributors, new orders in November 2017
The Virginia Tech U.S. Forest Service March 2018 Housing Commentary: Section I
 The Virginia Tech U.S. Forest Service March 2018 Housing Commentary: Section I Urs Buehlmann Department of Sustainable Biomaterials College of Natural Resources & Environment Virginia Tech Blacksburg,
Leeds Business Confidence Index
 Third Quarter 2018 Volume 11, number 3 colorado.edu/business/brd Leeds Business Confidence Steady Ahead of Q3 2018 The Leeds Business Confidence Index (LBCI) captures Colorado business leaders expectations
61.0% (June: 61.7%) 41.8 (June: 42.3) 1.9% 2.1% 0.4% 0.8% 0.4% 0.8% 0.7% 1.7% 8.5% Manufacturing Outlook. Expected Growth Rate Over the Next 12 Months
 41.8 (June: 42.3) 1.9% 2.1% 0.4% 0.8% 0.4% 0.8% 0.7% 1.7% 8.5% Manufacturing Outlook. Expected Growth Rate Over the Next 12 Months") Manufacturing Outlook PERCENTAGE OF RESPONDENTS POSITIVE IN THEIR OWN COMPANY S OUTLOOK 61.0% (June: 61.7%) Small Manufacturers: 48.7% (June: 56.1%) Medium-Sized Manufacturers: 64.0% (June: 64.2%) Large
Manufacturing Outlook PERCENTAGE OF RESPONDENTS POSITIVE IN THEIR OWN COMPANY S OUTLOOK 61.0% (June: 61.7%) Small Manufacturers: 48.7% (June: 56.1%) Medium-Sized Manufacturers: 64.0% (June: 64.2%) Large
NatWest UK Regional PMI
 8 October 2018 outperforms all other regions for business activity growth in third quarter Key Findings Quarterly growth performance led by, ahead of and top business activity growth rankings in September
LETTER. economic COULD INTEREST RATES HEAD UP IN 2015? JANUARY Canada. United States. Interest rates. Oil price. Canadian dollar.
 economic LETTER JANUARY 215 COULD INTEREST RATES HEAD UP IN 215? For six years now, that is, since the financial crisis that shook the world in 28, Canadian interest rates have stayed low. The key interest
World trade rises 5.3% in Q1 2010
 June 2010 TABLE OF CONTENTS World trade rises 5.3% in Q1 2010 1 Highlights 2 The Canadian economy 2 The U.S. economy 3 Oil prices tumble after US jobs report 4 Flight to quality hits Canadian dollar 4
Manufacturing: Output and Future Output. Manufacturing: New Orders and New Export Orders. Manufacturing: Employment and Backlogs of Work
 Bank of Scotland is part of Lloyds Banking Group, the UK s largest retail bank and Scotland s largest financial services employer. Established in 1695, Bank of Scotland is the UK s oldest surviving clearing
NatWest UK Regional PMI
 Embargoed until 0101 () 14 January 2019 NatWest Regional PMI is top performing region in 2018 despite strong finish from the Key Findings 2018 ends with leading growth in both output and employment, while
Investec Services PMI Ireland
 Embargoed until: 06:00 (Dublin) June 6th 18 Investec Services PMI Ireland Investec T: +3-1-421-0496 E: Investec.Economics@investec.ie W: www.investec.ie Investec in Ireland, a member of the Investec Group,
Empire State Manufacturing Survey
 March 216 Empire State Manufacturing Survey The March 216 Empire State Manufacturing Survey indicates that business activity steadied for New York manufacturers. The headline general business conditions
Global PMI. Global economy grows at fastest rate for over two years, inflationary pressures rise. September 8 th 2017
 Global PMI Global economy grows at fastest rate for over two years, inflationary pressures rise September 8 th 2017 2 Global PMI records fastest growth for over two years Global economic growth rose to
Business activity growth weakens in June
 9 July 2018 NatWest Wales PMI Business activity growth weakens in June Key Findings Output rises at softer pace Rate of growth in new business weakest in almost two years Staffing numbers decline Wales
Second Quarter 2016 Volume 9, number 2 colorado.edu/business/brd
 Second Quarter 2016 Volume 9, number 2 colorado.edu/business/brd Summary Stable Expectations The panel of business leaders surveyed in the Leeds Business Confidence Index (LBCI) reported steady optimism
District Economic. Structurally Deficient Bridges, 2001 (Percent)
") District Economic BY ROBERT LACY Apprehension about terrorism and political developments regarding Iraq cast a pall over the Fifth District economy in the last three months of. Many businesses continued
District Economic BY ROBERT LACY Apprehension about terrorism and political developments regarding Iraq cast a pall over the Fifth District economy in the last three months of. Many businesses continued
Weekly Economic Commentary
 LPL FINANCIAL RESEARCH Weekly Economic Commentary July 28, 2014 Midsummer Madness John Canally, CFA Economist LPL Financial Highlights Only nine times in over 14 years have the FOMC meeting, GDP report,
U.S. Economic Update and Outlook. Laurel Graefe, REIN Director Federal Reserve Bank of Atlanta October 2, 2013
 1 U.S. Economic Update and Outlook Laurel Graefe, REIN Director Federal Reserve Bank of Atlanta October 2, 213 Following the deepest recession since the 193s, the economic recovery is well under way, though
Monetary Policy Report: Using Rules for Benchmarking
 Monetary Policy Report: Using Rules for Benchmarking Michael Dotsey Executive Vice President and Director of Research Keith Sill Senior Vice President and Director, Real-Time Data Research Center Federal
O HIGHLIGHTS - EXECUTIVE SUMMARY
 FURNITURE INSIGHTS Smith Leonard PLLC s Industry Newsletter February 2018 O HIGHLIGHTS - EXECUTIVE SUMMARY ur latest survey of residential furniture manufacturers and distributors revealed some disappointing
The Beige Book. Summary of Economic Activity
 The Beige Book Eighth District August 2017 Summary of Economic Activity Economic conditions have improved at a modest pace since our previous report. District labor market conditions continue to improve,
Monetary Policy Report: Using Rules for Benchmarking
 Monetary Policy Report: Using Rules for Benchmarking Michael Dotsey Executive Vice President and Director of Research Keith Sill Senior Vice President and Director, Real-Time Data Research Center Federal
U.S. Equipment & Software Investment Momentum Monitor
 U.S. Equipment & Software Investment Momentum Monitor June 2018 CONTACT INFORMATION: Kelli Nienaber, Executive Director Equipment Leasing & Finance Foundation knienaber@elfaonline.org www.leasefoundation.org
Manufacturing sector expands strongly in June.
 July 2018 Manufacturing sector expands strongly in June. Key findings Growth momentum in the Australian manufacturing sector picked up at the end of the second quarter. Demand improved at a sharp pace,
Global PMI. Solid Q2 growth masks widening growth differentials. July 7 th IHS Markit. All Rights Reserved.
 Global PMI Solid Q2 growth masks widening growth differentials July 7 th 2017 2 Widening developed and emerging world growth trends The global economy enjoyed further steady growth in June, according to
Ulster Bank Northern Ireland Purchasing Managers Index (PMI)
") Ulster Bank Northern Ireland Purchasing Managers Index (PMI) Includes analysis of Global, Eurozone, UK, UK Regions, NI & Republic of Ireland economic performance by sector February 2016 Survey Update Issued
Ulster Bank Northern Ireland Purchasing Managers Index (PMI) Includes analysis of Global, Eurozone, UK, UK Regions, NI & Republic of Ireland economic performance by sector February 2016 Survey Update Issued
Economic Highlights. ISM Purchasing Managers Index 1. Sixth District Payroll Employment by Industry 2. Contributions to Real GDP Growth 3
 December 1, 2010 Economic Highlights Manufacturing ISM Purchasing Managers Index 1 Employment Sixth District Payroll Employment by Industry 2 Economic Activity Contributions to Real GDP Growth 3 Prices
Banks at a Glance: Economic and Banking Highlights by State 4Q 2017
 Economic and Banking Highlights by State 4Q 2017 These semi-annual reports highlight key indicators of economic and banking conditions within each of the nine states comprising the 12th Federal Reserve
Ulster Bank Northern Ireland PMI
 11 February 2019 Employment falls for first time in four years Key Findings Output growth at 28-month low Employment falls for first time in four years Business sentiment remains muted Northern Ireland
LETTER. economic. The price of oil and prices at the pump: why the difference? NOVEMBER bdc.ca
 economic LETTER NOVEMBER 211 The price of oil and prices at the pump: why the difference? Since the end of April the price of crude oil based on the West Texas Intermediate (WTI) benchmark has dropped
Global Economic Review January 2016
 M Global Economic Review January 2016 UNITED STATES Gross domestic product US real gross domestic product grew 0.7% in the fourth quarter, decelerating from +2.0% in the third quarter. Federal Reserve
Smith Leonard PLLC Kenneth D. Smith, CPA Mark S. Laferriere, CPA
 FURNITURE INSIGHTS Smith Leonard PLLC s Industry Newsletter April 2018 HIGHLIGHTS - EXECUTIVE SUMMARY N ew orders in February 2018 were 5% higher than orders in February 2017, according to our latest survey
Year-Over-Year Manufacturing Production Growth
 A Publication of the National Association of Manufacturers 00 March 21, 2016 Year-Over-Year Manufacturing Production Growth (January 2015 - February 2016) Jan-15 Feb Mar Apr May Jun Jul Aug Sep Oct Na,J
Highlights. GDP growth rebounded somewhat in Q3, but business spending weakened
 OSU Economic Outlook Conference December, Chad Wilkerson Oklahoma City Branch Executive and Economist Federal Reserve Bank of Kansas City www.kansascityfed.org/oklahomacity Highlights U.S. economic growth
Monetary Policy Report: Using Rules for Benchmarking
 Monetary Policy Report: Using Rules for Benchmarking Michael Dotsey Executive Vice President and Director of Research Keith Sill Senior Vice President and Director, Real-Time Data Research Center Federal
Ulster Bank Northern Ireland PMI
 Embargoed until 0101 UK (0001 UTC) 13 August 2018 Ulster Bank Northern Ireland PMI Fastest rise in output since January Key Findings Sharper increases in both output and new orders Slowest rise in employment
Investec Services PMI Ireland
 Embargoed until: 06:00 (Dublin) September 5th 18 Investec Services PMI Ireland Activity rises at sharper pace in August Investec T: +3-1-421-0496 E: Investec.Economics@investec.ie W: www.investec.ie Investec
Baseline U.S. Economic Outlook, Summary Table*
 January 19 Gus Faucher Stuart Hoffman William Adams Kurt Rankin Abbey Omodunbi Chief Economist Senior Economic Advisor Senior Economist Economist Economist Executive Summary Great December Jobs Report;
The economic recovery remains intact. Absent
 Business-Cycle Conditions, April 213 AMERICAN INST ITUTE for ECONOMIC RESEARCH www.aier.org April 15, 213 Labor Market Recovers Unevenly High-skilled jobs account for most employment growth in a steady
The Beige Book. Summary of Economic Activity
 The Beige Book Eighth District January 2019 Summary of Economic Activity Reports from contacts indicate that economic conditions have slightly improved since our previous report. Firms continued to report
MISSISSIPPI S BUSINESS Monitoring the state s economy
 MISSISSIPPI S BUSINESS Monitoring the state s economy A Publication of the University Research Center, Mississippi Institutions of Higher Learning JULY 2015 VOLUME 73, NUMBER 7 ECONOMY AT A GLANCE igure
The Week Ahead in US Economics December 26-30, 2011
 The Week Ahead in US Economics December 26-30, 2011 Monday Tuesday Wednesday Thursday Friday 26 Christmas Day (Observed) 27 S&P Case-Shiller Idx (Oct) (09:00) Consumer Confidence (Dec) (10:00) Richmond
Gus Faucher Stuart Hoffman William Adams Kurt Rankin Mekael Teshome Chief Economist Senior Economic Advisor Senior Economist Economist Economist
 July 217 Gus Faucher Stuart Hoffman William Adams Kurt Rankin Mekael Teshome Chief Economist Senior Economic Advisor Senior Economist Economist Economist Executive Summary Job Growth Picked Back Up Again
Structure and Function of the Federal Reserve System
 1/17/17 Economic Outlook Cortney Cowley Economist Federal Reserve Bank of Kansas City Omaha Branch October, 17 The views expressed are those of the author and do not necessarily reflect the opinions of