Terasen Gas Inc. ( Terasen Gas ) Extension of the Multi-Year Performance Based Rate Plan 2007 Annual Review
|
|
|
- Thomas Berry
- 5 years ago
- Views:
Transcription
1 Scott A. Thomson Vice President, Regulatory Affairs and Chief Financial Officer Fraser Highway Surrey, B.C. V4N 0E8 Tel: (604) Fax: (604) October 5, 2007 Regulatory Affairs Correspondence British Columbia Utilities Commission Sixth Floor 900 Howe Street Vancouver, B.C. V6Z 2N3 B-1 Attention: Ms. Erica M. Hamilton, Commission Secretary Dear Ms. Hamilton: RE: Terasen Gas Inc. ( Terasen Gas ) Extension of the Multi-Year Performance Based Rate Plan 2007 Annual Review By Order No. G , the British Columbia Utilities Commission ( the Commission ) set November 13, 2007 as the date for the joint Terasen Gas 2007 Annual Review Workshop and Terasen Gas (Vancouver Island) 2007 Settlement Update Meeting. This Annual Review Workshop will be the fifth under the Company s Multi-Year Performance Based Rate settlement agreement (the Settlement ) extended to The Settlement was approved by Commission Order No. G dated July 29, 2003, with the two-year extension approved by Order No. G The terms of the Settlement require Terasen Gas to submit to the Commission and interested parties advance materials on the information to be presented at the Annual Review three weeks prior to the Annual Review Workshop. The details of the Annual Review process are set out on Pages 17 to 22 of Appendix A to Commission Order No. G The 2007 Annual Review is a process for the Company and stakeholders to ensure that the objectives of the Settlement are being achieved and to review the cost drivers and financial forecasts for the purposes of establishing the 2008 revenue requirements. Enclosed are twenty (20) copies of the advance information for the 2007 Annual Review. Section A of the binder includes information on the cost drivers, financial projections and forecasts necessary for setting 2008 delivery rates. Section B of the binder includes various other reports and information requirements identified in the Settlement and Commission Order No. G and G Terasen Gas will present information at the Annual Review Workshop on the matters addressed in the advance materials. The 2008 revenue requirement increase identified in the enclosed materials is $5.6 million, equivalent to a 1.1% increase in gross margin or a 0.4% increase in total revenue at existing
2 October 5, 2007 British Columbia Utilities Commission TGI 2007 Annual Review Page 2 rates. After taking into consideration the earnings surplus incentive sharing, the revenue requirement is a decrease of $9.4 million, equivalent to a 1.9% decrease in gross margin, or a 0.6% decrease in total revenue at existing rates. The final rates for 2008 may be subject to further adjustments for changes in the return on equity ( ROE ). The financial calculations for 2008 in the enclosed materials have been made using an ROE of 8.37% representing the allowed Terasen Gas 2007 ROE. The difference between the 2007 allowed ROE level and the 2008 ROE, as determined in accordance with the Commission s March 2, 2006 ROE Decision, will result in corresponding changes to the final 2008 revenue requirement. At the point in time that the 2008 allowed ROE is approved by the Commission, the Company will revise its rate proposals and submit them for Commission approval. Any rate changes related to the flow-through of gas cost changes will be dealt with in a separate application to the Commission. Lastly, the 2008 revenue requirements included herein do not take into consideration the impacts of the sale of vacant land in Burnaby, which was approved by the Commission in Order No. G , dated September 21, In the Order, the Commission directed the Company to refund $2.5 million to ratepayers over one year by a rate rider to be filed with the first quarterly gas review following the date of completion of the sale. This is discussed in more detail in the Deferred Charges portion of Section A3, on page 12. REQUEST FOR APPROVAL With this Annual Review Application, TGI requests Commission approval for the following: 1. The increase in Gross Margin effective January 1, 2008 as included in the Annual Review advance materials in Section A1, page 5, line Earnings Sharing Mechanism sharing in 2008 of $15.0 million via a rate rider as included in the Annual Review advance materials in Section A8, page The Deferral account additions and treatment as included in the Annual Review advance materials in Section A3. This includes the creation of a deferral account in the event that the Commission approves the proposed changes to the Company s Service Line Installation Fees and Service Line Cost Allowance and creation of a deferral account to account for the cost of service reductions related to the timing of the Lochburn land sale. 4. To use the reporting format for O&M as included in the Annual Review advance materials in Section A5, page To follow Section of the CICA Handbook revision that will result in a reclassification in TGI s financial statements between inventory and property, plant and equipment for pipe, valves, fittings and other items that would ultimately be used for gas plant in service, whereby these costs will be transferred to Plant Work in Process (WIP) in the financial statements, effective January 1, 2009, as included in the Annual Review advance materials in Section B6.
3 October 5, 2007 British Columbia Utilities Commission TGI 2007 Annual Review Page 3 In its Order No. G , the Commission established the Regulatory Timetable for the Annual Review. As most parties are aware, the Company is currently experiencing labour disruptions with one of its bargaining units. The Company will do its best to meets its Annual Review requirements given this challenge. We trust the enclosed is satisfactory. If you have any questions related to this submission please contact Tom Loski, Director of Regulatory Affairs at (604) To assist in the planning of the review, it would be appreciated if any party that intends to attend the Annual Review on November 13, 2007 would contact Regulatory Affairs by phone (604) or by at regulatory.affairs@terasengas.com or to advise of the intended attendance. Yours very truly, Original signed by: Tom Loski For: Scott Thomson Attachment cc ( only): TGI Multi Year PBR ( PBR & Extension) Participants and 2006 Annual Review & Mid-Term Settlement Update Participants
4 TABLE OF CONTENTS SECTION A: Revised Forecasts and Projections for 2008 Revenue Requirements SUMMARY COST DRIVERS 2008 Cost Drivers...1 Explanatory Notes RATE BASE 2008 Rate Base Capital Expenditures Plant Additions...3 Deferred Charges GAS SALES AND TRANSPORTATION VOLUMES 1. Forecast Methodology Underlying Assumptions Economic Outlook for British Columbia...2 Housing Market...3 Customer Additions Forecast Use per Customer Forecast Energy Forecast a. Residential and Commercial...6 b. Firm Sales and Industrial Revenue Forecast Margin Forecast Southern Crossing Pipeline (SCP) Third Party Revenues Miscellaneous Revenue Burrard Thermal Revenue Terasen Gas (Vancouver Island) Inc. Revenue Forecast Risks Summary OPERATING AND MAINTENANCE EXPENSE TAX AND OTHER EXPENSES 1. Property Tax Expense Large Corporations Tax Income Tax Expense RETURN ON CAPITAL PROJECTIONS Table of Contents Page i
5 SECTION B: Other Advance Information Pertaining to the Terms of the Settlement 1. FIVE YEAR MAJOR CAPITAL PLAN 1. Introduction Five Year Regular Capital Plan Comparison of 2007 Forecast vs Projection Five Year Major Capital Plan Major Capital Projects that do not require a CPCN Major Capital Projects that require a CPCN SERVICE QUALITY ASSURANCE MECHANISM 1. Introduction Components of the Service Quality Assurance Mechanism Service Quality Indicators Benchmarks DEMAND SIDE MANAGEMENT STATUS REPORT 1. Introduction General Overview of DSM Programs at Terasen Gas Education and Outreach Initiatives Incentive Program Descriptions Summary of 2007 Results Summary of Costs Research Initiatives Proposed 2008 Activity UNCONTROLLABLE / PARTIALLY CONTROLLABLE EXPENSES 5. CODE OF CONDUCT AND TRANSFER PRICING POLICY Internal Audit Ernst & Young 6. EXOGENOUS FACTORS AND FINANCIAL ACCOUNTING MATTERS Exogenous Factors Provincial Sales Tax Reassessment...1 Financial Accounting Matters Sale of Vacant Land at nd Avenue, Burnaby, BC (Lochburn) Changes to CICA Handbook Section Accounting for Rate Regulated Operations International Financial Reporting Standards ( IFRS )...3 Table of Contents Page ii
6 SUMMARY OF REVENUE REQUIREMENTS FOR THE YEAR ENDING DECEMBER 31, 2008 The British Columbia Utilities Commission (the "Commission" or "BCUC") by Order No. G-51-03, approved the TGI Settlement Agreement for a Performance Based Rate Plan (the "Settlement" or PBR ), and extended the Settlement for by Order No. G Pursuant to the provisions of the Settlement Agreement, Terasen Gas has developed the projections and forecasts needed to establish the 2008 revenue requirement. The attached costs and revenues incorporate updated data for: 2007 projected year-end customers, 2007 projected formula-based capital expenditures trued up for customer additions and average total customers, the resulting year-end plant balances, and other rate base information, 2007 projected deferral account balances and amortization, 2007 projected formula-based utility O&M trued up for average total customers Other projected 2007 cost-of-service items required under the terms of the Settlement for setting 2008 rates, 2008 forecast cost drivers, such as customer additions, average total customers and inflation (less an adjustment factor), 2008 customer use rate forecasts, 2008 forecast volumes and revenues, 2008 formula-based utility O&M expenses including adjustments, as per the terms of the Settlement, for the change in forecast pension and insurance costs, 2008 formula-based base capital expenditures and resulting plant balances, accumulated depreciation and contributions-in-aid-of-construction, 2008 forecast property taxes, 2008 forecast working capital, deferred account balances and amortization, and 2008 forecast long-term debt and the associated financing costs of long-term and unfunded debt to be included in 2008 rates. A summary of the 2008 revenue requirement decrease determined pursuant to the terms of the Settlement Agreement and the Revised Target is shown on the following financial summary pages: A-1 Summary Page 1
7 Page 5 Summary of Rate Change Required Page 6 Utility Rate Base Page 7 Utility Income and Earned Return Page 8 Income Taxes / Revenue Surplus Page 9 Return on Capital The 2008 test year costs and revenues are explained under the following section of this Annual Review material: Cost Drivers - see Section A, Tab 2, Gas plant in service, plant additions and other rate base components - see Section A, Tab 3, Volumes and revenues - see Section A, Tab 4, Operating and maintenance costs - see Section A, Tab 5, Taxes and other expenses - see Section A, Tab 6, Financing costs - see Section A, Tab 7, 2007 Projected Results - see Section A, Tab 8. The results of incorporating the forecast and formula-based costs and revenues in the 2008 test year show that the revenue requirement increase, before earnings sharing, is $5.6 million, equivalent to a 1.1% increase in gross margin, or a 0.4% increase in total revenue at existing rates. After taking into consideration the earnings sharing, the revenue requirement is a decrease of $9.4 million, equivalent to a 1.9% decrease in gross margin, or a 0.6% decrease in total revenue at existing rates. Changes in the average residential gas use rates as experienced over the last several years, have been driven by more efficient appliances, better insulated homes and multi-family home construction. The reduction in use rates contributes $7.8 million of the revenue requirement increase before earnings sharing. The change in use rates is offset in part by customer growth which reduces revenue requirement by $5.4 million, but which in turn contributes to revenue requirement increases of $2.6 million due to a higher rate base. O&M cost per customer increases as per the settlement formula are limited to 34% of CPI (BC), or 0.7%, and contributes $4.0 million to increased revenue requirements. Other contributors to cost pressures include higher property taxes and interest expense, while changes in pension and insurance forecasts and higher income tax deductions serve to further offset revenue requirement increases. A summary of the components of the revenue requirement increase before earnings sharing is shown on Page 4. A-1 Summary Page 2
8 The revenue requirement increase is offset by earnings sharing of $12.6 million. Core market customers will experience a decrease in the revenue requirement of an average of $0.114 per gigajoule resulting from the earnings sharing as determined in accordance with the earnings sharing mechanism. There may also be flow-through cost of gas changes as the cost of gas is dependent on the commodity market which is subject to considerable volatility. A cold weather snap or unexpected negative news can change the natural gas commodity market outlook quite quickly. Overall, residential customers can expect to see a decrease of approximately 1.02% to the annual bill when all of the changes related to the RSAM rider, the delivery rate and the earnings sharing credit are factored in. The final rates for 2008 may be subject to further adjustments for changes in the return on equity (ROE). The financial calculations for 2008 in the enclosed materials have been made using an ROE of 8.37% representing the allowed TGI 2007 ROE with a common equity component of 35.01%. The variance between the 2007 allowed ROE level and the 2008 ROE as determined in accordance with the Commission s March 2, 2006 ROE Decision will result in corresponding changes to the final 2008 revenue requirement. Lastly, the 2008 revenue requirements included herein do not take into consideration the impacts of the sale of vacant land in Burnaby, which was approved by the Commission in Order No. G , dated September 21, In the Order the Commission directed the Company to refund $2.5 million to ratepayers over one year by a rate rider to be filed with the first quarterly gas review following the date of completion of the sale. This is discussed in more detail in the Deferred Charges portion of Section A3, on page 12. A-1 Summary Page 3
9 SUMMARY OF 2008 REVENUE REQUIREMENT DECREASE ($ Millions) Volumes/Revenue Related Customer Growth and Use Rate $ 4.2 O & M Related Higher O&M per Formula $ 4.0 Change in Pension and Insurance Forecast (3.4) 0.6 Other Items Higher Property Taxes 0.2 Lower Depreciation and Amortization (0.6) Lower Other Revenues 0.3 Higher Interest Expense 2.3 Lower Income Tax Rates (0.5) Higher Income Tax Deductions (3.6) Higher Rate Base due to Customer Growth Total Revenue Increase (Section A, Tab 1, Page 5, Column 6, Line 15) 5.6 Earnings Sharing Customers' Share of 2007 Earnings Sharing Credit (12.6) True-up of Customers' share of 2006 Earnings Sharing Credit (2.4) (15.0) Net Revenue Decrease after Earnings Sharing - Annual Review $ (9.4) A-1 Summary Page 4
10 Section A Tab 1 SUMMARY OF RATE CHANGE REQUIRED Page 5 FOR THE YEAR ENDING DECEMBER 31, 2008 ($000s) 2008 Line 2007 Bypass and No. Particulars APPROVED Core Non-Core Special Rates Total Change (1) (2) (3) (4) (5) (6) (7) 1 RATE CHANGE REQUIRED 2 3 Gas Sales and Transportation Revenue, 4 At Prior Year's Rates $1,465,181 $1,432,768 $58,644 $13,288 $1,504,700 $39, Add - Other Revenue Related to SCP Third Party 7 Revenue / Terasen Gas (Vancouver Island) 15, ,318 15, Total Revenue 1,480,354 1,432,768 58,644 28,606 1,520,018 39, Less - Cost of Gas (966,880) (1,019,137) (1,517) (1,150) (1,021,804) (54,924) Gross Margin $513,474 $413,631 $57,127 $27,456 $498,214 ($15,260) Revenue Deficiency (Surplus) ($9,609) $4,933 $681 $0 $5, Revenue Deficiency (Surplus) as a % of Gross Margin -1.87% 1.19% 1.19% 0.00% 1.13% Revenue Deficiency (Surplus) as a % of Total Revenue -0.65% 0.34% 1.16% 0.00% 0.37% A-1 Summary Page 5
11 Section A Tab 1 UTILITY RATE BASE Page 6 FOR THE YEAR ENDING DECEMBER 31, 2008 ($000s) 2008 Line 2007 Existing Revised No. Particulars APPROVED Rates Adjustments Rates Change Reference (1) (2) (3) (4) (5) (6) (7) 1 Plant in Service, Beginning $3,140,710 $3,242,849 $0 $3,242,849 $102,139 - Tab A-3, Page CPCNs 8,137 10,092-10,092 1,955 - Tab A-3, Page Additions 129, , ,111 (1,606) - Tab A-3, Page Disposals (32,918) (32,478) - (32,478) Tab A-3, Page Plant in Service, Ending 3,245,646 3,348,574-3,348, , Add - Intangible Plant 1,614 1,614-1,614 (0) ,247,260 3,350,188-3,350, , Contributions In Aid of Construction (131,162) (148,162) - (148,162) (17,000) - Tab A-3, Page Less - Accumulated Depreciation (744,297) (765,334) - (765,334) (21,037) - Tab A-3, Page Net Plant in Service, Ending $2,371,801 $2,436,692 $0 $2,436,692 $64, Net Plant in Service, Beginning $2,339,687 $2,398,136 $0 $2,398,136 $58,449 - Tab A-3, Page Net Plant in Service, Mid-Year $2,355,744 $2,417,414 $0 $2,417,414 $61, Adjustment to 13-Month Average Construction Advances (11) (658) - (658) (647) 27 Work in Progress, No AFUDC 10,771 9,358-9,358 (1,413) 28 Unamortized Deferred Charges (8,222) (27,526) - (27,526) (19,304) - Tab A-3, Page Cash Working Capital (25,197) (28,434) 363 (28,071) (2,874) - Tab A-3, Page Other Working Capital 143, , ,843 (7,139) - Tab A-3, Page Deferred Income Tax, Mid-Year (606) (364) - (364) 242 Capital Efficiency Mechanism LILO Benefit (2,243) (1,980) - (1,980) Utility Rate Base $2,474,218 $2,504,653 $363 $2,505,016 $30,798 A-1 Summary Page 6
12 Section A Tab 1 UTILITY INCOME AND EARNED RETURN Page 7 FOR THE YEAR ENDING DECEMBER 31, 2008 ($000s) Revised Rates----- Line 2007 Existing Revised No. Particulars APPROVED Rates Revenue Total Change Reference (1) (2) (3) (4) (5) (6) (7) 1 ENERGY VOLUMES (TJ) 2 Sales 116, , ,223 (1,553) - Tab A-Tab 4, Page 14 3 Transportation 95,397 91,435-91,435 (3,962) - Tab A-Tab 4, Page , , ,658 (5,515) 5 6 Average Rate per GJ 7 Sales $ $ $0.000 $ $ Transportation $0.775 $0.785 $0.000 $0.792 $ Average $6.860 $7.281 $0.000 $7.308 $ UTILITY REVENUE 12 Sales - Existing Rates $1,390,101 $1,432,963 $0 $1,432,963 $42,862 - Tab A-Tab 4, Page Increase / (Decrease) (8,416) - 4,933 4,933 13,349 - Tab A-Tab 4, Page Transportation - Existing Rates 75,080 71,737-71,737 (3,343) - Tab A-Tab 4, Page Increase / (Decrease) (1,193) ,874 - Tab A-Tab 4, Page Total 1,455,572 1,504,700 5,614 1,510,314 54, Cost of Gas Sold (Including Gas Lost) 966,880 1,021,804-1,021,804 54,924 - Tab A-Tab 4, Page Gross Margin 488, ,896 5, ,510 (182) Operation and Maintenance 169, , , Tab A-5, Page 2 24 Vehicle Lease 1,993 1,988-1,988 (5) 25 Property and Sundry Taxes 44,452 44,635-44, Tab A-Tab 6, Page 4 26 Depreciation and Amortization 84,771 84,142-84,142 (629) - Tab A-Tab 6, Page 7 27 Other Operating Revenue (24,910) (24,598) - (24,598) Tab A-Tab 4, Page , , , Utility Income Before Income Taxes 213, ,870 5, ,484 (630) Income Taxes 30,897 25,200 1,821 27,021 (3,876) - Tab A-Tab 6, Page EARNED RETURN $182,217 $181,670 $3,793 $185,463 $3, UTILITY RATE BASE $2,474,218 $2,504,653 $363 $2,505,016 $30,798 - Tab A-1, Page RATE OF RETURN ON UTILITY RATE BASE 7.365% 7.250% 7.404% 0.039% A-1 Summary Page 7
13 Section A Tab 1 INCOME TAXES / REVENUE DEFICIENCY Page 8 FOR THE YEAR ENDING DECEMBER 31, 2008 ($000s) Revised Rates----- Line 2007 Existing Revised No. Particulars APPROVED Rates Revenue Total Change Reference (1) (2) (3) (4) (5) (6) (7) 1 CALCULATION OF INCOME TAXES 2 Earned Return $182,217 $181,670 $3,793 $185,463 $3,246 - Tab A-1, Page 7 3 Deduct - Interest on Debt (109,714) (112,047) (11) (112,058) (2,344) - Tab A-1, Page 9 4 Add- Non-Tax Ded. Expense (Net) (2,290) (2,644) - (2,644) (354) - Tab A-Tab 6, Page Accounting Income After Tax 70,213 66,979 3,782 70, Add (Deduct) - Timing Differences (7,483) (14,641) - (14,641) (7,158) - Tab A-Tab 6, Page 6 8 Add - Large Corporation Tax Taxable Income After Tax $62,730 $52,338 $3,782 $56,120 ($6,610) Income Tax Rate (Current Tax) % % % % % Current Income Tax Rate % % % % 0.500% Taxable Income Before Income Tax Deferred Income Tax Taxable Income (L10 / L13) $93,626 $77,538 $5,603 $83,141 ($10,485) Income Tax - Current (L12 x L15) $30,897 $25,200 $1,821 $27,021 ($3,876) 19 - Deferred Income Tax 20 - Large Corporation Tax Total Income Tax $30,897 $25,200 $1,821 $27,021 ($3,876) REVENUE DEFICIENCY 25 Earned Return $182,217 $3,793 $185,463 $3,246 - Tab A-1, Page 7 26 Add - Income Taxes 30,897 1,821 27,021 (3,876) 27 Deduct - Utility Income Before Taxes, 28 Present Rates (222,723) - (206,870) 15,853 - Tab A-1, Page 7 29 Corporate Capital Tax Tab A-Tab 6, Page Deficiency After Corporate Capital Tax ($9,609) $5,614 $5,614 $15,223 A-1 Summary Page 8
14 Section A Tab 1 RETURN ON CAPITAL Page 9 FOR THE YEAR ENDING DECEMBER 31, 2008 ($000s) Line Capitalization Embedded Cost Earned No. Particulars Reference Amount % Cost Component Return (1) (2) (3) (4) (5) (6) (7) (8) AT 2007 RATES 2 Long-Term Debt $1,373, % 7.231% 3.97% 3 Unfunded Debt 253, % 5.000% 0.51% 4 Preference Shares % 0.000% 0.00% 5 Common Equity 876, % 7.912% 2.77% Tab A-1, Page 6 $2,504, % 7.25% REVISED RATES 10 Long-Term Debt $1,373, % 7.231% 3.97% $99, Unfunded Debt $253, Adjustment, Revised Rates , % 5.000% 0.51% 12, Preference Shares % 0.000% 0.00% - 14 Common Equity 877, % 8.370% 2.93% 73, Tab A-1, Page 6 $2,505, % 7.40% $185, APPROVED RATES 19 Long-Term Debt $1,470, % 7.018% 4.17% $103, Unfunded Debt $137, Adjustment, Revised Rates , % 4.750% 0.27% 6, Preference Shares % 0.000% 0.00% - 23 Common Equity 866, % 8.370% 2.93% 72, $2,474, % 7.36% $182, CHANGE FROM 2007 APPROVED RATES 28 Long-Term Debt ($96,170) -4.56% 0.213% -0.20% ($3,810) 29 Unfunded Debt $115, Adjustment, Revised Rates , % 0.250% 0.25% 6, Preference Shares % 0.000% 0.00% - 32 Common Equity 10, % 0.000% 0.00% $30, % 0.05% $3,246 A-1 Summary Page 9
15 2008 COST DRIVERS The table below shows the Cost Driver forecasts which are used for setting the 2008 Targets as prescribed in Commission Order No. G and G Cost Drivers Actual Projected Forecast Year End Customer Counts 812, , ,609 Note 1 Customer Additions 13,129 11,797 Average Customer Counts 805, , ,970 Note 2 Change in Average Customers 11,636 12,490 Note 2 Percentage of Customer Growth - Average 1.44% 1.53% Escalators B.C. Inflation (CPI) 2.1% Note 3 Adjustment Factor - % of CPI 66.0% Note 4 Adjustment Factor -1.4% A Cost Drivers Page 1
16 Explanatory Notes Note projection and 2008 forecast year end customer counts are explained under Tab 4 Gas Sales and Transportation Volumes. Year end customer additions are used to calculate Capital Expenditures driven by customer addition. Note 2 The percentage growth in average customer is used to calculate the formula based O & M Expense and Other Base Capital Expenditures. O & M Expense is to be per the PBR formula. Note 3 Pursuant to the provisions of the Settlement Agreement pursuant to Commission Order G and extended by Order No. G-33-07, the 2008 B.C. inflation forecast will be determined as the average of the forecasts from the Conference Board of Canada, the B.C. Ministry of Finance, the RBC Financial Group, and the Toronto-Dominion Bank. Based on this formula, the B.C. CPI forecast for 2008 is 2.1%, and represents the average of the forecasts below: Conference Board of Canada 1.9% (July 2007) B.C. Ministry of Finance 2.0% (February 2007) RBC Financial Group 2.3% (June 2007) Toronto-Dominion Bank 2.0% (Sep 2007) (Copies of the forecasts are included as Attachment A-2) Note 4 Pursuant to the provisions of Commission Order No. G-33-07, the adjustment factor will be 66% of CPI for 2008 equal to 1.39%. A Cost Drivers Page 2
17 Attachment A-2
18
19
20
21

22
23 2008 RATE BASE The 2008 Rate Base for TGI is forecast to be $2.505 billion. Rate Base is composed of midyear net gas plant in service, construction advances, work-in-progress not attracting AFUDC, unamortized deferred charges, cash working capital, other working capital, deferred income tax, LILO benefit. The 2008 Rate Base of TGI includes full year impacts of the 2007 projected plant activities including: 2007 actual CPCN Opening Additions of $10.8 million Formula-Based Capital Additions of $128.7 million Plant Accumulated Depreciation and CIAOC Amortization of $83.4 million Also, the 2008 Rate Base includes 2008 activities including: 2008 CPCN Opening Additions assets of $10.1 million Base Capital Additions of $128.1 million Plant Depreciation and CIAOC Amortization of $87.2 million Various changes in deferred charges, working capital and other items decreasing rate base by a net amount of $30.9 million. Details of the 2007 projected plant balances and the 2008 forecasted plant balances can be found in Section A, Tab 3, Pages 8 and 8.1. A-3 Rate Base Page 1
24 2008 CAPITAL EXPENDITURES The 2008 Capital Expenditures are based on the capital expenditure formula (approved by Commission Order No. G and G-33-07), plus forecast CPCNs. The capital expenditure formula is composed of two cost components: Customer Addition Driven Capital and Other Base Capital driven by average number of customers. Per Commission Order No. G and G-33-07, base capital expenditure amounts will not be rebased to actual amounts during the term. For the rate setting in subsequent years the formula base capital expenditures from the prior years will be adjusted for projected customer counts and trued up for actual customers as this information becomes known. There is no true up for actual CPI. During the 2006 annual review, Terasen Gas had forecast 13,385 customer additions along with 820,347 average number of customers for The current projection for 2007 is 13,129 and 817,480, respectively. Accordingly, the total formula-based capital expenditures for 2007 derived from the projected customer addition numbers has decreased from $ million to $ million. It should be noted that customer additions for 2007 could be affected by labour disruptions. As per the terms of the PBR customer additions will be trued up to actual at the 2008 annual review. Supporting calculations can be found at Tab 3, Page 5. The 2008 Capital Expenditure for TGI is calculated using the 2008 Forecast Unit Cost multiplied by customer accounts cost drivers as outlined in Tab 2, Page 1. The detail calculation is shown on Tab 3, Page Forecast Unit Cost per Customer = o 2007 Unit Cost per Customer x ( [1 + (CPI - Adjustment Factor) 2008 Capital Expenditure = o 2008 Forecast Unit Cost per customer x Cost Driver o The Cost Driver for: Customer Addition Driven Capital is Number of Customer Additions Other Base Capital is Average Number of Customers A-3 Rate Base Page 2
25 2008 PLANT ADDITIONS The 2008 Plant Additions are comprised of TGI s 2008 formula-driven Base Capital plant costs including AFUDC, overhead capitalized for the year, and opening 2008 CPCN Additions. A reconciliation of capital expenditures to plant additions is shown on Section A, Tab 3, Page 6. The 2008 Plant Additions allowed by the terms of the Settlement are $ million. The Plant Addition summary is shown below: 2008 Plant Additions Formula-based Base Capital Overhead Capitalized AFUDC and WIP adjustments Special Projects & CPCN additions Total 2008 Plant Additions $ million $ million $0.866 million $ million $ million Consistent with the terms of the Settlement, the 2008 Contributions in Aid of Construction Additions ( CIAOC ) are formula-based. The software tax savings are based on the software plant additions arising from the base capital additions formula. The other CIAOC consisting of main extensions, excess service line charges, billable alterations, meter & regulator equipment work, and other CIAOC have been calculated based on the PBR Formula. CIAOC is subject to the same adjustment and true-up process as base capital additions. Therefore, the CIAOC additions for 2008 have been adjusted based on projected 2007 customer counts. The 2008 CIAOC and 2007 formula updated CIAOC schedules can be found in Section A, Tab 3, Page 9. TGI s Service Line Installation Fee ( SLIF ) is calculated based on $215 per service line for 2007 and 2008, which is treated as a CIAOC. Additionally, if the cost of a Service Line is expected to exceed the Service Line Cost Allowance ( SLCA ) of $1,100, the customer makes a A-3 Rate Base Page 3
26 further contribution in the amount of the excess over the $1,100 allowance. TGI and TGVI in its Application for System Extension & Customer Connection Changes Review dated July 31, 2007 is seeking to eliminate the $215 contribution requirement and increase the SLCA to $1,535. A decision from the Commission is not expected until the first quarter of If the Commission does approve the elimination of the $215 charge as well as adjusting the Service Line Allowance TGI proposes to defer the value of the cost of service associated with the changes by crediting a deferral account and amortizing it in the following year. TGI requests Commission approval to create a deferral account in the event there are changes to the SLIF and SLCA. A-3 Rate Base Page 4
27 CAPITAL EXPENDITURES FOR THE YEARS ENDING DECEMBER 31, 2007 and 2008 Section A Tab 3 Page 5 PBR Line. Settlement Approved Adjusted Actual Approved Adjusted Actual Approved Adjusted Actual Approved * Projected Forecast No. Particulars (1) (2) (3) (4) (5) (6) (7) (8) (7) (8) (9) 1 Forecast CPI (BC) 1.70% 1.99% 2.00% 2.04% 2.20% 1.76% 2.00% 2.00% 2.10% 2 Adjustment Factor 0.85% 1.00% 1.00% 1.02% 1.45% 1.16% 1.32% 1.32% 1.39% 3 4 CPI - Adjustment Factor % % % % % % % % % CUSTOMER ADDITION DRIVEN CAPITAL EXPENDITURES 8 9 Customer Addition Driven Capital Expenditures Per Customer Addition $2, $2, $2, $2, $2, $2, $2, $2, $2, $2, $2, $2, $2, Number of Customers Additions 8,604 11,412 11,504 10,144 12,676 12,345 12,692 12,726 10,194 13,385 13,129 11, Target Customer Addition Driven Capital Expenditures ($000) $18,162 $24,089 $24,283 $21,626 $27,024 $26,319 $27,261 $27,334 $21,896 $28,945 $28,391 $25, OTHER BASE CAPITAL EXPENDITURES Other Base Capital Expenditures Per Customer $85.69 $86.42 $86.42 $86.42 $87.28 $87.28 $87.28 $87.93 $87.93 $87.93 $88.53 $88.53 $ Average Number of Customers 777, , , , , , , , , , , , Target Other Base Capital Expenditures ($000) $67,216 $67,364 $67,361 $68,985 $69,095 $69,090 $70,724 $70,668 $70,588 $72,625 $72,372 $74, SUMMARY CAPITAL EXPENDITURES ($000) Target Customer Addition Driven Capital Expenditures $18,162 $24,089 $24,283 $21,626 $27,024 $26,319 $27,261 $27,334 $21,896 $28,945 $28,391 $25, Target Other Base Capital Expenditures 67,216 67,364 67,361 68,985 69,095 69,090 70,724 70,668 70,588 72,625 72,372 74, Total Target Base Capital Expenditures $85,378 $91,453 $91,644 $90,611 $96,119 $95,409 $97,985 $98,002 $92,484 $101,570 $100,763 $99, Total Base Capital Additions excluding Forecast CPCN Additions ($000) $85,378 $91,453 $91,644 $90,611 $96,119 $95,409 $97,985 $98,002 $92,484 $101,570 $100,763 $99,693 A-3 Rate Base Page 5
28 Section A CAPITAL EXPENDITURES AND PLANT ADDITIONS Tab 3 FOR THE YEARS ENDING DECEMBER 31, Page 6 ($000) Line Approved Adjusted Forecast No. Particulars (1) (2) (3) (4) 1 CAPITAL EXPENDITURES 2 3 Base Capital Expenditures 4 Customer Addition Driven Capital Expenditures $ 28,945 $ 28,391 $ 25,693 5 Other Base Capital Expenditures 72,625 72,372 74, Total Base Capital Expenditures $ 101,570 $ 100,763 $ 99, Special Projects - CPCN's 10 Vancouver LP Replacement $ 8,706 $ 9,836 $ 6, Squamish Amalgamation into TGI 8,137 6, Mission IP Pipeline System Upgrade 7, MobileUp Replacement CPCN 2,499 2, Fraser River SBSA Rehabilitation 1, , Castlegar to Nelson (Xings at Shoreacres, Brilliant, Upgrades) 0 3, Gateway 11, Gateway - Transmission Gateway - Distribution Border Infrastructure (Transmission) Border Infrastructure (Distribution) Fraser Hwy/176th St., TP 18" Relocation Canada Line Rapid Transit Service Golden Ears Bridge - Distribution Golden Ears Bridge - Transmission Total CPCN's $ 37,588 $ 20,060 $ 14, TOTAL CAPITAL EXPENDITURES $ 139,158 $ 120,823 $ 114, RECONCILIATION OF CAPITAL EXPENDITURES TO PLANT ADDITIONS Base Capital 35 Base Capital Expenditures $ 101,570 $ 100,763 $ 99, Add - Opening WIP 11,946 12, Less - Opening WIP Adjustment 38 Less - Closing WIP (12,521) (12,649) Add - AFUDC Add - Overhead Capitalized 27,535 27, TOTAL BASE CAPITAL ADDITIONS TO GAS PLANT IN SERVICE $ 101,570 $ 128,705 $ 128, Special Projects - CPCN's 46 CPCN Expenditures $ 37,588 $ 20,060 $ 14, CPCN Expenditures - TGS Amalgamation Adjustment 1, Add - Opening WIP 2,329 13, Less - Closing WIP (13,696) (18,598) Add - AFUDC INSERT LINE FOR ACC DEPN FROM PG 15 (EXCLUDING INTANGIBLES) 1, TOTAL CPCN ADDITIONS TO OPENING GASE PLANT IN SERVICE $ 37,588 $ 10,846 $ 10, TOTAL PLANT ADDITIONS $ 139,158 $ 139,551 $ 138,186 A-3 Rate Base Page 6
29 Section A Tab 3 UTILITY RATE BASE Page 7 FOR THE YEAR ENDING DECEMBER 31, 2008 ($000s) 2008 Line 2007 Existing Revised No. Particulars APPROVED Rates Adjustments Rates Change (1) (2) (3) (4) (5) (6) Reference (7) 1 Plant in Service, Beginning $3,140,710 $3,242,849 $0 $3,242,849 $102,139 - Tab A-3, Page CPCN's 8,137 10, ,092 1,955 - Tab A-3, Page Additions 129, , ,111 (1,606) - Tab A-3, Page Disposals (32,918) (32,478) 0 (32,478) Tab A-3, Page Plant in Service, Ending 3,245,646 3,348, ,348, , Add - Intangible Plant 1,614 1, ,614 (0) ,247,260 3,350, ,350, , Contributions In Aid of Construction (131,162) (148,162) 0 (148,162) (17,000) - Tab A-3, Page Less - Accumulated Depreciation (744,297) (765,334) 0 (765,334) (21,037) - Tab A-3, Page Net Plant in Service, Ending $2,371,801 $2,436,692 $0 $2,436,692 $64, Net Plant in Service, Beginning $2,339,687 $2,398,136 $0 $2,398,136 $58,449 - Tab A-3, Page Net Plant in Service, Mid-Year $2,355,744 $2,417,414 $0 $2,417,414 $61, Adjustment to 13-Month Average Construction Advances (11) (658) 0 (658) (647) 27 Work in Progress, No AFUDC 10,771 9, ,358 (1,413) 28 Unamortized Deferred Charges (8,222) (27,526) 0 (27,526) (19,304) - Tab A-3, Page Cash Working Capital (25,197) (28,434) 363 (28,071) (2,874) - Tab A-3, Page Other Working Capital 143, , ,843 (7,139) - Tab A-3, Page Deferred Income Tax, Mid-Year (606) (364) 0 (364) 242 Capital Efficiency Mechanism LILO Benefit (2,243) (1,980) 0 (1,980) Utility Rate Base $2,474,218 $2,504,653 $363 $2,505,016 $30,798 A-3 Rate Base Page 7
30 Section A Tab 3 GAS PLANT IN SERVICE CONTINUITY SCHEDULE Page 8 FOR THE YEAR ENDING DECEMBER 31, 2007 ($000s) Line Balance 2007 Transfers/ Balance No. Particulars 12/31/2006 CPCN'S Additions Retirements Recovery 12/31/2007 (1) (2) (3) (4) (5) (6) (7) 1 INTANGIBLE PLANT Franchise and Consents $99 $0 $0 $0 $0 $ Utility Plant Acquisition Adjustment Other Intangible Plant TOTAL INTANGIBLE PLANT MANUFACTURED GAS / LOCAL STORAGE Manufact'd Gas - Land Manufact'd Gas - Struct. & Improvements Manufact'd Gas - Equipment Manufact'd Gas - Gas Holders Manufact'd Gas - Compressor Equipment Manufact'd Gas - Measuring & Regulating Equipment /441 Land in Fee Simple and Land Rights Structures & Improvements 5, , Gas Holders - Storage 18, , Compressor Equipment Measuring & Regulating Equipment Purification Equipment Local Storage Equipment 16, , TOTAL MANUFACTURED GAS / LOCAL STORAGE 42, , TRANSMISSION PLANT Land in Fee Simple 7, , Land Rights 42,130-1, , Land Rights - Byron Creek Compressor Structures 15, , Measuring Structures 4, , Other Structures & Improvements 4, , Mains 707,608 (312) 3,488 (174) - 710, Mains - Byron Creek Compressor Equipment 103,979 (37) , Measuring & Regulating Equipment 44,115-5, , Telemetering 5, , Measuring & Regulating Equipment - Byron Creek Communication Structures & Equipment 2, , Other Transmission Equipment TOTAL TRANSMISSION PLANT 939,285 (349) 11,883 (174) - 950,645 A-3 Rate Base Page 8
31 - Tab A-3, Page 8 Section A Tab 3 GAS PLANT IN SERVICE CONTINUITY SCHEDULE Page 8.1 FOR THE YEAR ENDING DECEMBER 31, 2007 ($000s) Line Balance 2007 Transfers/ Balance No. Particulars 12/31/2006 CPCN'S Additions Retirements Recovery 12/31/2007 (1) (2) (3) (4) (5) (6) (7) 1 DISTRIBUTION PLANT Land in Fee Simple $3,249 $0 $0 $0 $0 $3, Land Rights Land Rights - Byron Creek Structures & Improvements 5, , Structures & Improvements - Byron Creek 2, , Services 579,750 5,053 26,213 (3,932) - 607, House Regulators & Meter Installations 158, ,314 (516) - 168, Mains 794,005 4,774 35,696 (3,570) - 830, Compressor Equipment Measuring & Regulating Equipment 82, ,805 (540) - 92, Telemetering 5, (8) - 5, Measuring & Regulating Equipment - Byron Creek Meters 214, ,101 (605) - 225, Other Distribution Equipment TOTAL DISTRIBUTION PLANT 1,846,023 10,875 95,688 (9,171) - 1,943, GENERAL PLANT & EQUIPMENT Land in Fee Simple 20, , Land Rights Structures & Improvements Frame Buildings 5, , Masonry Buildings 74, , Leasehold Improvement 4, , Office Furniture and Equipment Furniture & Equipment 24, (39) - 24, Computer Hardware 30, ,864 (8,750) - 28, Computer Software (Infrastructure) 73, ,442 (7,624) - 72, Computer Software (Non-Infrastructure) 23,333-2,545 (7,208) - 18, Transportation Equipment Heavy Work Equipment Small Tools & Equipment 31, ,281 (167) - 33, Equipment on Customer's Premises 1, , VRA Compressor Installation Costs Communications Equipment Telephone 10, (2) - 11, Radio 5, (545) - 5, Other General Equipment TOTAL GENERAL PLANT 308, ,493 (24,335) - 304, UNCLASSIFIED PLANT Plant Suspense TOTAL UNCLASSIFIED PLANT TOTAL CAPITAL $3,136,979 $10,846 $128,704 ($33,680) $0 $3,242, TOTAL CAPITAL $3,136,979 $10,846 $128,704 ($33,680) $0 $3,242,849 A-3 Rate Base Page 8.1
32 - Tab A-3, Page 9 Section A Tab 3 CONTRIBUTIONS IN AID OF CONSTRUCTION Page 9 FOR THE YEAR ENDING DECEMBER 31, 2007 ($000s) TGI Line Balance CPCN 2007 Balance No. Particulars 12/31/2006 Adjustment Additions Retirements 12/31/2007 (1) (2) (3) (4) (5) (6) 1 CIAOC 2 3 DSEP/GEAP $12,671 $0 $0 $0 $12, NGV Conversion Grants NGV Station Grants Furniture & Equipment Software Tax Savings - Non-Infrastructure , (4,380) 4, Infrastructure/Custom ,194-2,102 (15,842) 25, Service Installation Fee ,570-2,823-24, Other to 05 70, ,150-74, TOTAL Contributions 151, ,906 (20,222) 141, Amortization to Software Tax Savings - Non-Infrastructure (5,734) - (1,561) 4,380 (2,915) 25 - Infrastructure/Custom (22,752) - (4,899) 15,842 (11,809) Other (23,980) (67) (2,317) - (26,364) TOTAL Amortization (52,466) (67) (8,777) 20,222 (41,088) NET CONTRIBUTIONS $99,131 $660 $129 $0 $99,920 A-3 Rate Base Page 9
33 Section A Tab 3 CONTRIBUTIONS IN AID OF CONSTRUCTION Page 9.1 FOR THE YEAR ENDING DECEMBER 31, 2008 ($000s) Line Balance CPCN 2008 Balance No. Particulars 12/31/2007 Adjustment Additions Retirements 12/31/2008 (1) (2) (3) (4) (5) (6) 1 DSEP/GEAP $12,671 $0 $0 $0 $12, NGV Conversion Grants NGV Station Grants Furniture & Equipment Software Tax Savings - Non-Infrastructure , (1,242) 3, Infrastructure/Custom ,454-2,119 (150) 27, Service Installation Fee ,393-2,536-26, Other to 05 74,122-3,054-77, TOTAL 141,008-8,546 (1,392) 148, Amortization to Software Tax Savings - Non-Infrastructure (2,915) - (851) 1,242 (2,524) 23 - Infrastructure/Custom (11,809) - (3,182) 150 (14,841) Other (26,364) - (2,449) - (28,813) Total Amortization (41,088) - (6,482) 1,392 (46,178) NET $99,920 $0 $2,064 $0 $101,984 A-3 Rate Base Page 9.1
34 Section A Tab 3 NET GAS PLANT IN SERVICE Page 10 FOR THE YEARS ENDING DECEMBER 31, 2007 TO 2009 ($000s) Line PROJECTION FORECAST No. Particulars (1) (2) (3) 1 Gas Plant in Service - December 31, Previous Year $3,136,979 $3,242, Add: CPCNs on January 1, Beginning of the Year 10,846 10, Adjusted Opening Gas Plant in Service 3,147,825 3,252, Intangible Plant 1,614 1, Less: Contribution in Aid of Construction (152,324) (141,008) Less: Accumulated Depreciation and Amortization (651,669) (715,411) Net Gas Plant in Service as at January 1, Beg of Year 2,345,446 2,398,136 A-3 Rate Base Page 10
35 DEFERRED CHARGES The 2008 deferred charges and amortization (Section A, Tab 3, Pages 13 and 13.1) have been determined in accordance with the BCUC Decision dated February 4, 2003 on Terasen Gas 2003 revenue requirements and the PBR Plan Settlement Terms approved by Commission Order No. G and extended by Order No. G With the implementation of the Commercial Commodity Unbundling Program the GCRA, effective April 1, 2004, was divided into a Commodity Cost Reconciliation Account (CCRA) and a Midstream Cost Reconciliation Account (MCRA). CCRA is designated to capture and account for costs and recoveries associated with the baseload supply and for all of Terasen Gas sales customers. MCRA is designated to capture and account for costs and recoveries associated with the remaining resources required to meet design peak day. The CCRA will capture the costs incurred by Terasen Gas to purchase its portion of the baseload gas requirements and the revenue collected by Terasen Gas through gas commodity rates. The MCRA will capture all the costs associated with the Midstream function and the revenue collected by Terasen Gas through midstream rates. The MCRA will also capture the costs associated with the Terasen Gas (Vancouver Island) Inc. Future disposition of CCRA/MCRA balances will be determined based on the net-of-tax balance in accordance with Commission Order No. G The corporate income tax rate for 2008 reflects the elimination of the Large Corporations Tax effective January 1, 2006 as announced in the 2006 Federal Budget. As per the PBR Settlement Agreement, the impact of the LCT rate change for calendar 2006 has been deferred and will be refunded to customers over three years beginning in 2007 as shown on Section A, Tab 3, Pages 13 and As stated under Section B, Tab 7 under Exogenous Factors, Terasen has been assessed provincial sales tax related to the SCP project. Terasen Gas does not agree with the reassessment and is appealing. While these reassessments are being appealed, Terasen Gas has remitted a $10 million payment to prevent further accrual of interest, which will be refundable with interest in the event Terasen Gas is successful on appeal. A refund of $3.584 million has been received to date and legal fees of $44,200 were incurred in Accordingly, Terasen will continue to collect in a rate base deferral account, the net payment along with cost of the appeal since these are imposed on Terasen Gas by outside authorities over which the Company has no control. When the appeal is resolved, Terasen will seek a Commission order with respect to the disposition of the deferral account. A-3 Rate Base Page 11
36 Consistent with past practice, incremental costs associated with preparing upcoming revenue requirement applications are afforded deferral treatment. Accordingly, a deferral account has been set up in Section A, Tab 3, Pages 13 and 13.3 to capture these expected costs. Anticipated on-going costs of OSC compliance are expected to be relatively unchanged between 2007 and Costs in 2008 are estimated to be $125,000 compared to $121,000 included in the 2007 revenue requirements for Terasen Gas. These costs have been determined in accordance with the allocation process as directed by BCUC Order No. G By Order G , dated September 21, 2007, the Commission approved TGI s Application to sell 7.67 acres of vacant land that is no longer required for the provision of natural gas distribution service. Once the sale is completed $1,136,155 will be removed from the Rate Base and $2.5 million will be refunded to ratepayers by a rate rider. At this time the sale of the land has not been completed. While TGI is hopeful the completion of the sale of land will occur in 2007 it is uncertain if all required conditions can be met before year end. The materials in the annual review do not reflect the sale of the land. TGI proposes that the value of the cost of service from the sale of land would be credited to a deferral account and amortized in the following year reducing the amortization expense from what it would otherwise be. The cost of service reduction would be based on the reduced operating and maintenance expense, property tax and the mid-year rate base effect on earned return and income tax expense using the approved capital structure and allowed return on capital for TGI requests approval of the deferral account for the Lochburn land sale as described to account for the cost of service reductions with disposition in the following year. BCUC levies as calculated by the O&M formula in the 2007 rates have exceeded the 2007 actual projected BCUC levies by $434,000. Terasen Gas has deferred this amount in 2007 and will return the full amount of the excess to customers in BCUC levies embedded in 2003 Decision $1,345, levies as calculated with O&M formula $1,475, projected BCUC Levies 1,041,400 Amount to return to customers in 2008 ($433,600) The schedule of 2007 projected deferred charges and amortization is found in Section A, Tab 3, Pages 13.2 and A-3 Rate Base Page 12
37 Section A Tab 3 UNAMORTIZED DEFERRED CHARGES AND AMORTIZATION Page 13 FOR THE YEAR ENDING DECEMBER 31, 2008 ($000s) Forecast Mid-Year Line Balance Gross Less- Net Amortization Balance Average No. Particulars Account 12/31/2007 Additions Taxes * Additions Expense Other ** 12/31/ (1) (2) (3) (4) (5) (6) (7) (8) (9) (10) 1 Deferred Interest # $95.5 $0.0 $0.0 $0.0 $226.0 $0.0 $321.5 $ Deferred Interest - funding benefits via Customer Depo # 17904A (95.3) (42.1) (68.7) 3 4 NGV Conversion Grants # (22.8) 47.2 (46.7) Revenue Requirement # (29.2) Revenue Requirements # (25.0) Future Revenue Requirements # (16.3) Demand Side Management # , ,500.0 (487.5) 1,012.5 (772.0) - 1, , DSM DRIA # Property Tax Deferral # (942.2) (669.3) (805.8) M.C.R.A. # ,055.1 (23,785.9) 7,730.8 (16,055.1) - - (0.0) 8, C.C.R.A. # (48,258.0) 71,493.5 (23,235.5) 48, (24,129.0) 17 C.C.R.A./M.C.R.A Interest # (2,313.2) 3,427.1 (1,113.9) 2, (1,156.6) RSAM # , , , (11,073.7) 14, , RSAM Interest # (12.6) (273.5) Revelstoke Propane Cost # (20.3) (10.2) (136.5) - (10.2) Coastal Facilities 25 - Extraordinary Plant Loss - Lochburn # BC Tax Rate Reduction Deferral # Vehicle Lease Deferral # (358.8) Notes: Lines 14, 15, and 18 are MCRA, CCRA, and RSAM actual activities and balances. 32 * Taxes = 33% * (Gross Addiion + Amortization Other). 33 ** Amortization Other figures are pre-tax amounts. A-3 Rate Base Page 13
38 Section A Tab 3 UNAMORTIZED DEFERRED CHARGES AND AMORTIZATION Page 13.1 FOR THE YEAR ENDING DECEMBER 31, 2008 ($000s) Forecast Mid-Year Line Balance Gross Less- Net Amortization Balance Average No. Particulars Account 12/31/2007 Additions Taxes * Additions Expense Other ** 12/31/ (1) (2) (3) (4) (5) (6) (7) (8) (9) (10) 1 ROE Hearing Costs # $299.4 $0.0 $0.0 $0.0 ($149.5) $0.0 $149.9 $ Earnings Sharing Mechanism # (10,060.7) - (4,844.1) (4,844.1) - 14, (5,030.4) 4 5 NGV Compression Equip. Recovery # (248.6) Overheads Change - Income Tax Refund # CIAOC Software Tax Savings/OH Change # Bad Debt Allowance for Rates 14 & 14A # (6.3) Other Post Employment Benefits # 17991/93 (25,187.1) (6,074.0) 1,974.1 (4,099.9) - - (29,287.0) (27,237.1) Deferred 2000 SCP Cost of Service # SCP Net Mitigation Revenues # (3,554.1) (955.0) (644.6) (3,567.7) (3,560.9) 15 SCP West to East Transmission # (111.4) (69.2) (90.3) 16 SCP PG&E Contract Cancellation # , (663.2) SCP Provincial Sales Tax Reassessment # , , , CCT Deferral # CCT Assessment # (52.9) - (16.7) Pension Variance # (2,131.5) , (1,065.8) 23 Insurance Variance # (601.1) (300.6) BCUC Levies # (277.3) (138.7) 26 OSC Certification Compliance # (120.5) (40.5) (17.9) LCT Elimination # (2,069.0) , (1,035.0) (1,552.0) TGS O&M Variance # (55.6) TGS Amalgamation # 18503A Rider 2 ROE Revenue Requirement # (31.8) (31.8) - - (31.8) (31.8) Total Deferred Charges for Rate Base ($45,761.7) $46,163.3 ($16,125.4) $30,037.9 $3,044.3 $3,421.1 ($9,258.5) ($27,526.0) Notes: 39 * Taxes = 32.5% * (Gross Addiion + Amortization Other). 40 ** Amortization Other figures are pre-tax amounts. A-3 Rate Base Page 13
39 Section A Tab 3 UNAMORTIZED DEFERRED CHARGES AND AMORTIZATION Page 13.2 FOR THE YEAR ENDING DECEMBER 31, 2007 ($000s) Forecast Mid-Year Line Balance Gross Less- Net Amortization Balance Average No. Particulars Account 12/31/2006 Additions Taxes * Additions Expense Other ** 12/31/ (1) (2) (3) (4) (5) (6) (7) (8) (9) (10) 1 Deferred Interest # ($119.0) $185.5 ($61.2) $124.3 $90.2 $0.0 $95.5 ($11.8) 2 Deferred Interest - funding benefits via Customer Depo # 17904A (153.0) 10.0 (3.3) (95.3) (124.2) 3 4 NGV Conversion Grants # (23.1) 46.9 (56.4) Revenue Requirement # (48.8) Revenue Requirements # (25.0) Future Revenue Requirements # (24.8) Demand Side Management # , ,500.1 (495.0) 1,005.1 (667.0) - 1, , DSM DRIA # Property Tax Deferral # (463.0) (1,009.0) (676.0) (942.2) (702.6) M.C.R.A. # ,837.1 (14,454.2) 4,818.0 (9,636.2) - (145.8) 16, , C.C.R.A. # (52,412.0) 6,200.0 (2,046.0) 4, (48,258.0) (50,335.0) 17 C.C.R.A./M.C.R.A Interest # (1,969.0) (513.7) (344.2) - - (2,313.2) (2,141.1) RSAM # ,883.1 (3,052.9) 6, , (17,282.4) 22, , RSAM Interest # (7.6) (86.8) Revelstoke Propane Cost # (94.0) (36.3) (20.3) (57.2) Coastal Facilities 25 - Extraordinary Plant Loss - Lochburn # (94.0) (94.0) BC Tax Rate Reduction Deferral # (21.0) (10.5) Vehicle Lease Deferral # (358.2) Notes: Lines 14, 15, and 18 are MCRA, CCRA, and RSAM actual activities and balances. 32 * Taxes = 33% * (Gross Addiion + Amortization Other). 33 ** Amortization Other figures are pre-tax amounts. A-3 Rate Base Page 13
40 Section A Tab 3 UNAMORTIZED DEFERRED CHARGES AND AMORTIZATION Page 13.3 FOR THE YEAR ENDING DECEMBER 31, 2007 ($000s) Forecast Mid-Year Line Balance Gross Less- Net Amortization Balance Average No. Particulars Account 12/31/2006 Additions Taxes * Additions Expense Other ** 12/31/ (1) (2) (3) (4) (5) (6) (7) (8) (9) (10) 1 ROE Hearing Costs # $449.0 $0.0 $0.0 $0.0 ($149.6) $0.0 $299.4 $ Earnings Sharing Mechanism # (8,535.0) (15,016.0) (14,264.5) - 12,738.8 (10,060.7) (9,297.9) 4 5 NGV Compression Equip. Recovery # (248.6) Overheads Change - Income Tax Refund # (139.0) (69.5) 8 CIAOC Software Tax Savings/OH Change # (807.0) (403.5) 9 Bad Debt Allowance for Rates 14 & 14A # (6.6) Other Post Employment Benefits # 17991/93 (21,214.0) (5,930.0) 1,956.9 (3,973.1) - - (25,187.1) (23,200.6) Deferred 2000 SCP Cost of Service # (62.0) SCP Net Mitigation Revenues # (3,810.0) (1,152.9) (772.4) 1, (3,554.1) (3,682.1) 15 SCP West to East Transmission # (300.4) - (111.4) SCP PG&E Contract Cancellation # , (663.2) - 1, , SCP Provincial Sales Tax Reassessment # ,029.0 (3,540.2) (24.4) (3,564.6) - - 6, , CCT Deferral # (133.0) (66.5) 20 CCT Assessment # (8.8) (8.8) (116.0) Pension Variance # (2,432.0) (1,935.3) (1,296.7) 1, (2,131.5) (2,281.8) 23 Insurance Variance # (205.0) (882.3) (591.1) (601.1) (403.1) BCUC Levies # (226.0) (433.6) (290.5) (277.3) (251.7) 26 OSC Certification Compliance # (89.0) (40.0) 81.1 (112.6) - (120.5) (104.8) LCT Elimination # (3,103.0) , (2,069.0) (2,586.0) TGS O&M Variance # (56.4) TGS Amalgamation # 18503A (66.0) Rider 2 ROE Revenue Requirement # Total Deferred Charges for Rate Base ($17,682.6) ($39,367.8) $13,341.0 ($26,026.8) $2,723.9 ($4,776.2) ($45,761.7) ($31,722.5) Notes: 39 * Taxes = 33% * (Gross Addiion + Amortization Other). 40 ** Amortization Other figures are pre-tax amounts. A-3 Rate Base Page 13
41 - Tab A-3, Page 14 Section A Tab 3 WORKING CAPITAL ALLOWANCE Page 14 FOR THE YEAR ENDING DECEMBER 31, 2008 ($000s) 2008 Line 2007 Revised No. Particulars APPROVED Rates Revenue Change Reference (1) (2) (3) (4) (5) (6) 1 Cash Working Capital 2 Cash Required for 3 Operating Expenses ($16,403) ($17,738) ($17,375) ($972) 4 5 Customer Deposits (3,474) (3,474) (3,474) Less - Funds Available: 8 9 Reserve for Bad Debts (2,904) (4,545) (4,545) (1,641) Withholdings From Employees (2,416) (2,677) (2,677) (261) Subtotal (25,197) (28,434) (28,071) (2,874) - Tab A-1, Page Other Working Capital Items 16 Inventories 6,296 6,675 6, Transmission Line Pack Gas 3,199 3,367 3, Gas in Storage 134, , ,801 (7,636) 19 Miscellaneous Other 50 - (50) Subtotal 143, , ,843 (7,139) - Tab A-1, Page Total $118,785 $108,409 $108,772 ($10,013) A-3 Rate Base Page 14
42 Section A Tab 3 DEPRECIATION AND AMORTIZATION Page 15 FOR THE YEAR ENDING DECEMBER 31, 2007 ($000s) Line PROJECTION FORECAST No. Particulars Reference (1) (2) (3) (5) 1 Balance, Beginning $702,160 $756,497 - Tab A-3, Page CIAOC Amortization Balance, Beginning (52,533) (41,088) - Tab A-3, Page Gas Plant Held for Future Use 6 Balance, Beginning TGS Amalgamation 2, Utility Accumulated Depreciation 11 Balance, Beginning 651, ,409 - Tab A-3, Page Depreciation Provision 92,151 93,668 - Tab A-3, Page Less - Gas Plant Held for Future Use Less Prior Year Adjustments Less - Amortization of Contributions in 18 Aid of Construction (8,777) (6,482) - Tab A-3, Page ,374 87, Plant Retirements (33,680) (32,478) - Tab A-3, Page CIAOC Retirements 20,222 1,392 - Tab A-3, Page Removal Costs (6,174) (6,175) Proceeds on Disposals (19,632) (37,261) Balance, Ending $715,411 $765,334 - Tab A-1, Page 6 A-3 Rate Base Page 15
43 Section A Tab 3 DEPRECIATION AND AMORTIZATION CONTINUITY SCHEDULE Page 15.1 FOR THE YEAR ENDING DECEMBER 31, 2008 ($000s) Annual Provision Line Balance Depreciation 2008 Adjust- Retirement Proceeds on Accumulated No. Account 12/31/2007 Rate % (Cr.) ments Retirements Costs Disposal 12/31/ /31/2008 (1) (2) (3) (4) (5) (6) (7) (8) (9) (10) Adjusted for TGS Adjusted for TGS 1 INTANGIBLE PLANT Utility Plant Acquisition Adjustment $0 1.00% $0 $0 $0 $0 $0 $0 $ Unamortized Conversion Expense % Unamortized Conversion Expense - Squamish % Organization Expense % Other Deferred Charges % Franchise and Consents % Utility Plant Acquisition Adjustment % Other Intangible Plant - Lease Term TOTAL INTANGIBLE PLANT 2, , MANUFACTURED GAS / LOCAL STORAGE Manufact'd Gas - Land % Manufact'd Gas - Struct. & Improvements % Manufact'd Gas - Equipment % Manufact'd Gas - Gas Holders % Manufact'd Gas - Compressor Equipment % Manufact'd Gas - Measuring & Regulating Equipm % /441 Land in Fee Simple and Land Rights % Structures & Improvements 5, % ,086 2, Gas Holders - Storage 18, % ,588 9, Compressor Equipment % Measuring & Regulating Equipment % Purification Equipment % Local Storage Equipment 16, % ,427 9, TOTAL MANUFACTURED GAS / LOCAL STORAG 43,084 1, ,545 21, TRANSMISSION PLANT Land in Fee Simple 7, % Land Rights 43, % (1,434) (1,434) Land Rights - Byron Creek % $0 $0 $16 $ Compressor Structures 16, % ,458 4, Measuring Structures 4, % ,167 1, Other Structures & Improvements 4, % , Mains 710, % 14,212 - (179) , , Mains - Byron Creek % Compressor Equipment 103, % 3, ,750 31, Measuring & Regulating Equipment 49, % 1, ,865 9, Telemetering 5, % ,422 7, Measuring & Regulating Equipment - Byron Cr % Communication Structures & Equipment 3, % Other Transmission Equipment % TOTAL TRANSMISSION PLANT 950,645 20,543 - (179) , ,128 A-3 Rate Base Page 15.1
44 Section A Tab 3 DEPRECIATION AND AMORTIZATION CONTINUITY SCHEDULE Page 15.2 FOR THE YEAR ENDING DECEMBER 31, 2008 ($000s) Annual Provision Line Balance Depreciation 2008 Adjust- Retirement Proceeds on Accumulated No. Account 12/31/2007 Rate % (Cr.) ments Retirements Costs Disposal 12/31/ /31/2008 (1) (2) (3) (4) (5) (6) (7) (8) (9) (10) Adjusted for TGS Adjusted for TGS 1 DISTRIBUTION PLANT Land $3, % $0 $0 $0 $0 $0 $35 $ Land Rights % Land Rights - Byron Creek % Frame Buildings 6, % ,177 2, Byron Creek 2, % Services 607, % 12,142 - (3,707) (4,675) - 93,465 97, House Regulator & Meter Installation 168, % 6,006 - (519) (600) - 36,331 41, Mains 830, % 16,820 - (3,541) (500) - 207, , All Other % Measuring & Regulating 92, % 2,774 - (555) ,517 13, Telemetering 5, % (8) - - 5,388 5, Measuring & Regulating - Byron Creek % (59) (59) Meters 225, % 8,068 - (604) (400) - 52,954 60, Other Distribution Equipment % ,943,415 46,707 - (8,934) (6,175) - 409, , GENERAL PLANT & EQUIPMENT Land in Fee Simple 21, % Land Rights % Structures & Improvements % Frame Buildings 5, % (2,934) (2,782) 23 - Masonry Buildings 74, % 1, (6,576) (5,455) 24 - Leasehold Improvement 5,397 Lease Term ,256 14, Office Furniture and Equipment % - - (5) ,092 12, Furniture & Equipment 24, % 1,236 - (1,214) - - (21) Computer Hardware 28, % 5,731 - (753) ,108 23, Computer Software (Infrastructure) 72, % 9,093 - (14,304) ,199 28, Computer Software (Non-Infrastructure) 18, % 3,734 - (4,564) ,154 17, Transportation Equipment % ,944 3, Heavy Work Equipment % (272) (254) Small Tools & Equipment 33, % 1,676 - (2,179) ,744 13, Equipment on Customer's Premises 1, % , Communications Equipment % Telephone 11, % (45) - - 3,097 3, Radio 5, % (301) - - 3,961 4, Other General Equipment % TOTAL GENERAL PLANT 304,618 24,661 - (23,365) , , UNCLASSIFIED PLANT Plant Suspense % TOTAL UNCLASSIFIED PLANT TOTAL CAPITAL $3,244,463 $93,668 $0 ($32,478) ($6,175) $0 $756,497 $811, TOTALS $3,244,463 $93,668 $0 ($32,478) ($6,175) $0 $756,497 $811,512 A-3 Rate Base Page 15.2
45 Section A Tab 3 DEPRECIATION AND AMORTIZATION CONTINUITY SCHEDULE Page 15.3 FOR THE YEAR ENDING DECEMBER 31, 2007 ($000s) Annual Provision Line Balance Depreciation Adjust- Retirement Proceeds on Accumulated No. Account 12/31/2006 Rate % ments Retirements Costs Disposal 12/31/ /31/2007 (1) (2) (3) (5) (6) (7) (8) (9) (10) 1 INTANGIBLE PLANT Utility Plant Acquisition Adjustment $0 1.00% $0 $0 $0 $0 $0 $ Unamortized Conversion Expense % Unamortized Conversion Expense - Squamish % Organization Expense % Other Deferred Charges % Franchise and Consents % Utility Plant Acquisition Adjustment % Other Intangible Plant - Lease Term TOTAL INTANGIBLE PLANT 1, MANUFACTURED GAS / LOCAL STORAGE Manufact'd Gas - Land % Manufact'd Gas - Struct. & Improvements % Manufact'd Gas - Equipment % Manufact'd Gas - Gas Holders % Manufact'd Gas - Compressor Equipment % Manufact'd Gas - Measuring & Regulating Equipm % /441 Land in Fee Simple and Land Rights % Structures & Improvements 5, % ,868 2, Gas Holders - Storage 18, % ,868 8, Compressor Equipment % Measuring & Regulating Equipment % Purification Equipment % Local Storage Equipment 16, % ,757 8, TOTAL MANUFACTURED GAS / LOCAL STORAG 42, ,909 19, TRANSMISSION PLANT Land in Fee Simple 7, % Land Rights 42, % (1,434) (1,434) Land Rights - Byron Creek % Compressor Structures 15, % ,989 4, Measuring Structures 4, % ,036 1, Other Structures & Improvements 4, % Mains 707, % - (174) , , Mains - Byron Creek % Compressor Equipment 103, % ,632 28, Measuring & Regulating Equipment 44, % ,542 7, Telemetering 5, % ,823 6, Measuring & Regulating Equipment - Byron Cr % A-3 Rate Base Page Communication Structures & Equipment 2, % Other Transmission Equipment % TOTAL TRANSMISSION PLANT 939,285 - (174) , ,765
46 Section A Tab 3 DEPRECIATION AND AMORTIZATION CONTINUITY SCHEDULE Page 15.4 FOR THE YEAR ENDING DECEMBER 31, 2007 ($000s) Annual Provision Line Balance Depreciation 2007 Adjust- Retirement Proceeds on Accumulated No. Account 12/31/2006 Rate % (Cr.) ments Retirements Costs Disposal 12/31/ /31/2007 (1) (2) (3) (4) (5) (6) (7) (8) (9) (10) 1 DISTRIBUTION PLANT Land $3, % $0 $0 $0 $0 $0 $35 $ Land Rights % Land Rights - Byron Creek % Frame Buildings 5, % ,903 2, Byron Creek 2, % Services 579, % 11, (3,932) (4,675) - 90,062 93, House Regulator & Meter Installation 158, % 5, (516) (600) - 31,689 36, Mains 794, % 15, (3,570) (499) - 194, , All Other % Measuring & Regulating 82, % 2, (540) - - 9,574 11, Telemetering 5, % (8) - - 4,844 5, Measuring & Regulating - Byron Creek % (59) (59) Meters 214, % 7, (605) (400) - 46,276 52, Other Distribution Equipment % ,846,023 44,321 1,532 (9,171) (6,174) - 379, , GENERAL PLANT & EQUIPMENT Land in Fee Simple 20, % Land Rights % Structures & Improvements % Frame Buildings 5, % (3,086) (2,934) 23 - Masonry Buildings 74, % 1, (7,697) (6,576) 24 - Leasehold Improvement 4,733 Lease Term ,783 14, Office Furniture and Equipment % - 1 (24) ,903 10, Furniture & Equipment 24, % 1,213 4 (15) - - (9) 1, Computer Hardware 30, % 6, (8,750) ,645 18, Computer Software (Infrastructure) 73, % 9, (7,624) ,566 34, Computer Software (Non-Infrastructure) 23, % 4,667 - (7,208) ,695 18, Transportation Equipment % ,723 2, Heavy Work Equipment % (291) (273) Small Tools & Equipment 31, % 1, (167) ,317 13, Equipment on Customer's Premises 1, % Communications Equipment % Telephone 10, % (2) - - 2,545 3, Radio 5, % (545) - - 3,927 3, Other General Equipment % TOTAL GENERAL PLANT 308,140 25, (24,335) , , UNCLASSIFIED PLANT Plant Suspense % TOTAL UNCLASSIFIED PLANT TOTAL CAPITAL $3,137,816 $92,151 $2,042 ($33,680) ($6,174) $0 $702,160 $756, TOTALS $3,137,816 $92,151 $2,042 ($33,680) ($6,174) $0 $702,160 $756,499 A-3 Rate Base Page 15.4
47 2008 GAS SALES AND TRANSPORTATION VOLUMES This section addresses the forecast of gas sales and transportation volumes for Included is a review of the energy forecast methodology as well as factors influencing customer additions and use per customer. An outline of the residential, commercial and industrial margins and revenues over the forecast period is also provided. The yearly projections and forecasts, including customer accounts and the use per customer used to derive revenues for 2008, reflect the best information available at the time of the Annual Review. The forecast of industrial accounts and associated volumes are updated to reflect the latest industrial survey conducted during the summer of Similarly, revenue and margin forecasts reflect the most recently approved rates. 1. FORECAST METHODOLOGY Consistent with previous years, the forecasting process is comprised of three main components: Customer additions forecast Average use per customer forecast Industrial forecast The residential and commercial energy forecast consisting of Rate Classes 1, 2, 3 and 23 is driven by the respective account and use per customer forecasts, while the industrial energy forecast incorporates Rate Classes 7, 22, 25 and 27 and is based mainly on customer survey data. Rate Classes 4, 5 and 6 customer account and demand growth is modelled from market information and historical trends. The customer additions forecast reflects prevailing macroeconomic circumstances affecting residential and commercial customers. The forecast for industrial customers assumes no net change in the number of customers over the forecast period except where specific knowledge of a change in service level has been received by Terasen Gas. Consistent with the methodology used in prior years, the average use per customer is estimated for Rate Classes 1, 2, 3 and 23 and is multiplied by the corresponding forecast of customers in each respective rate class to derive energy consumption. The large volume industrial and A-4 Gas Sales and Transportation Volumes Page 1
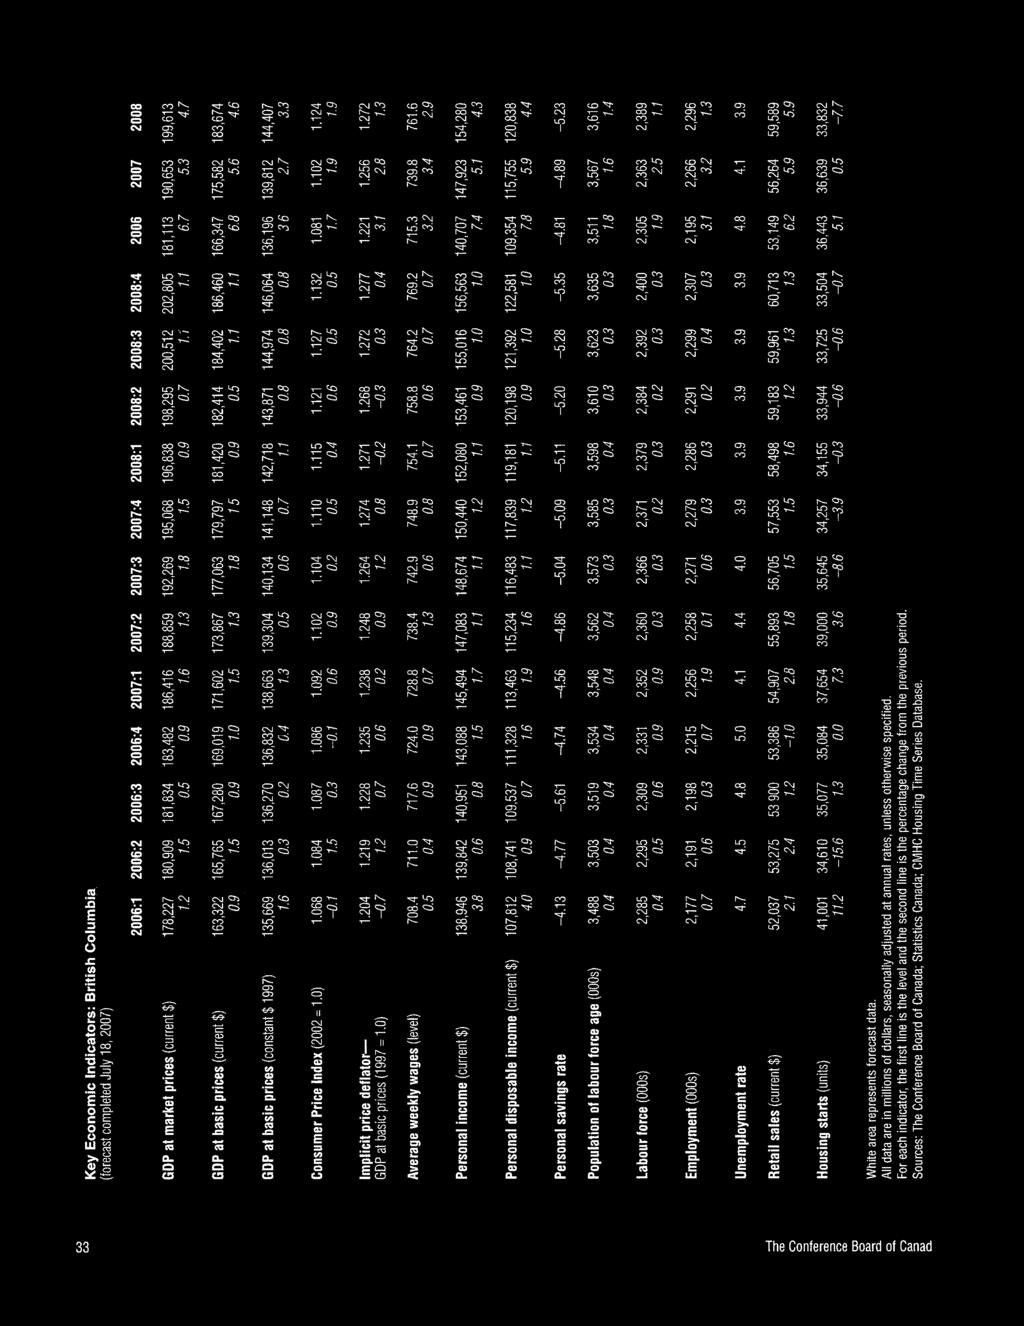
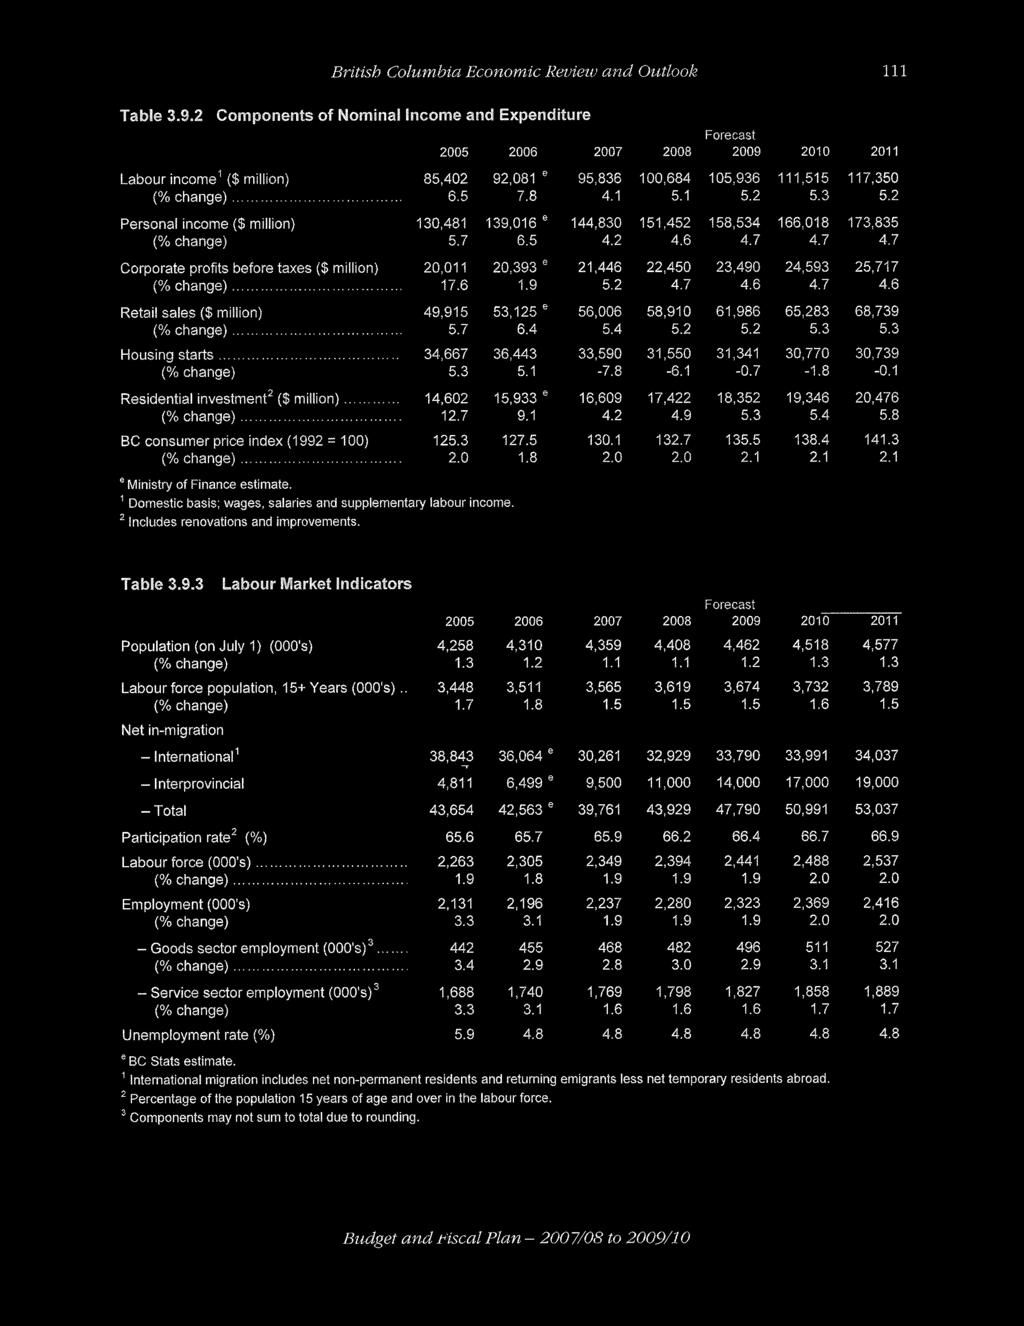
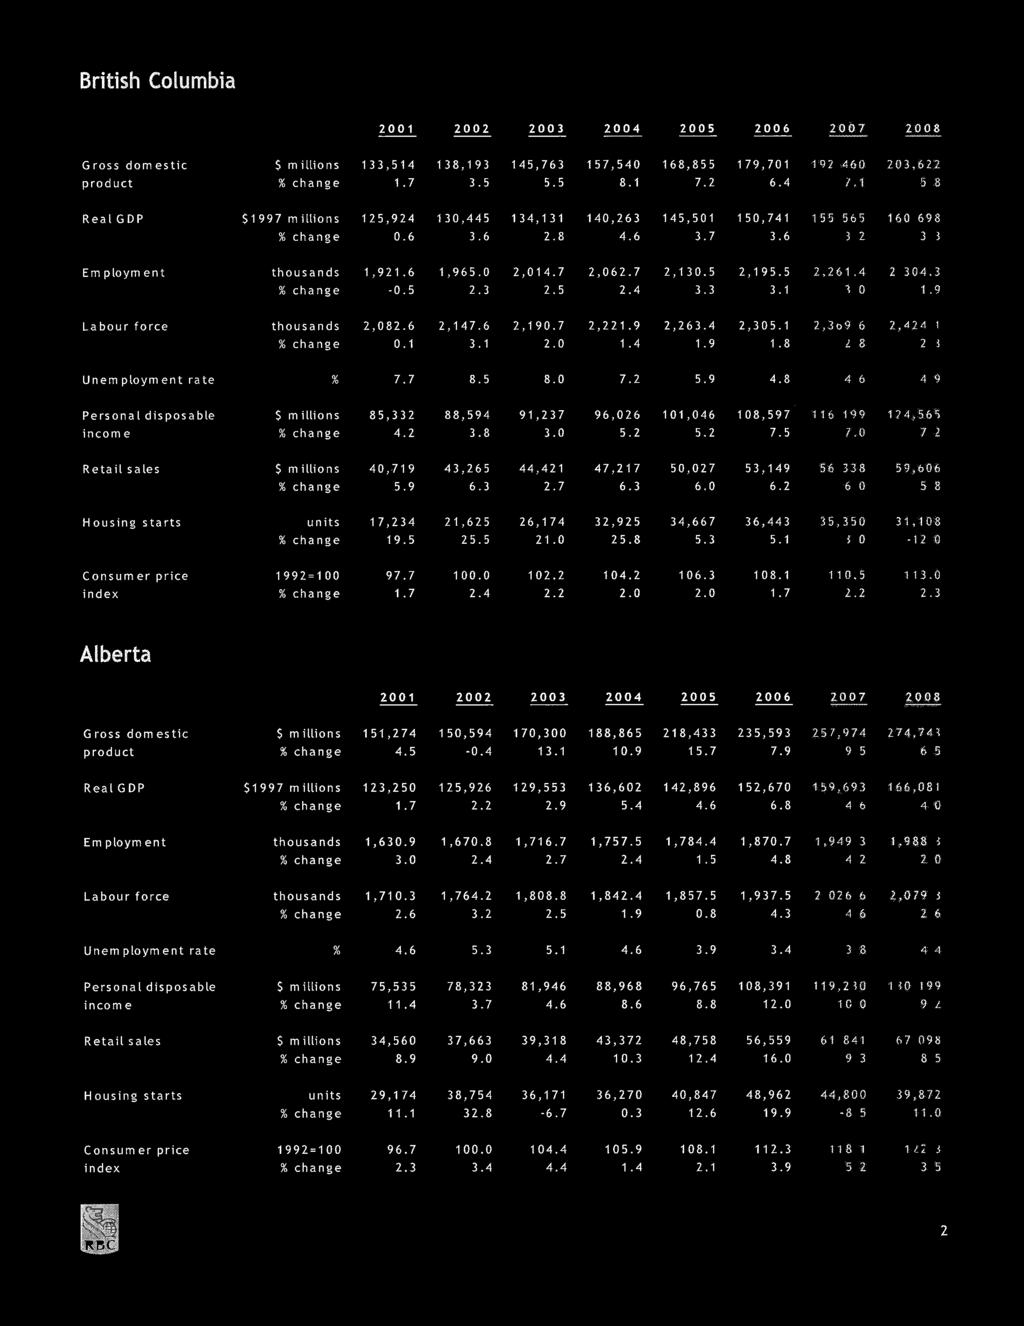
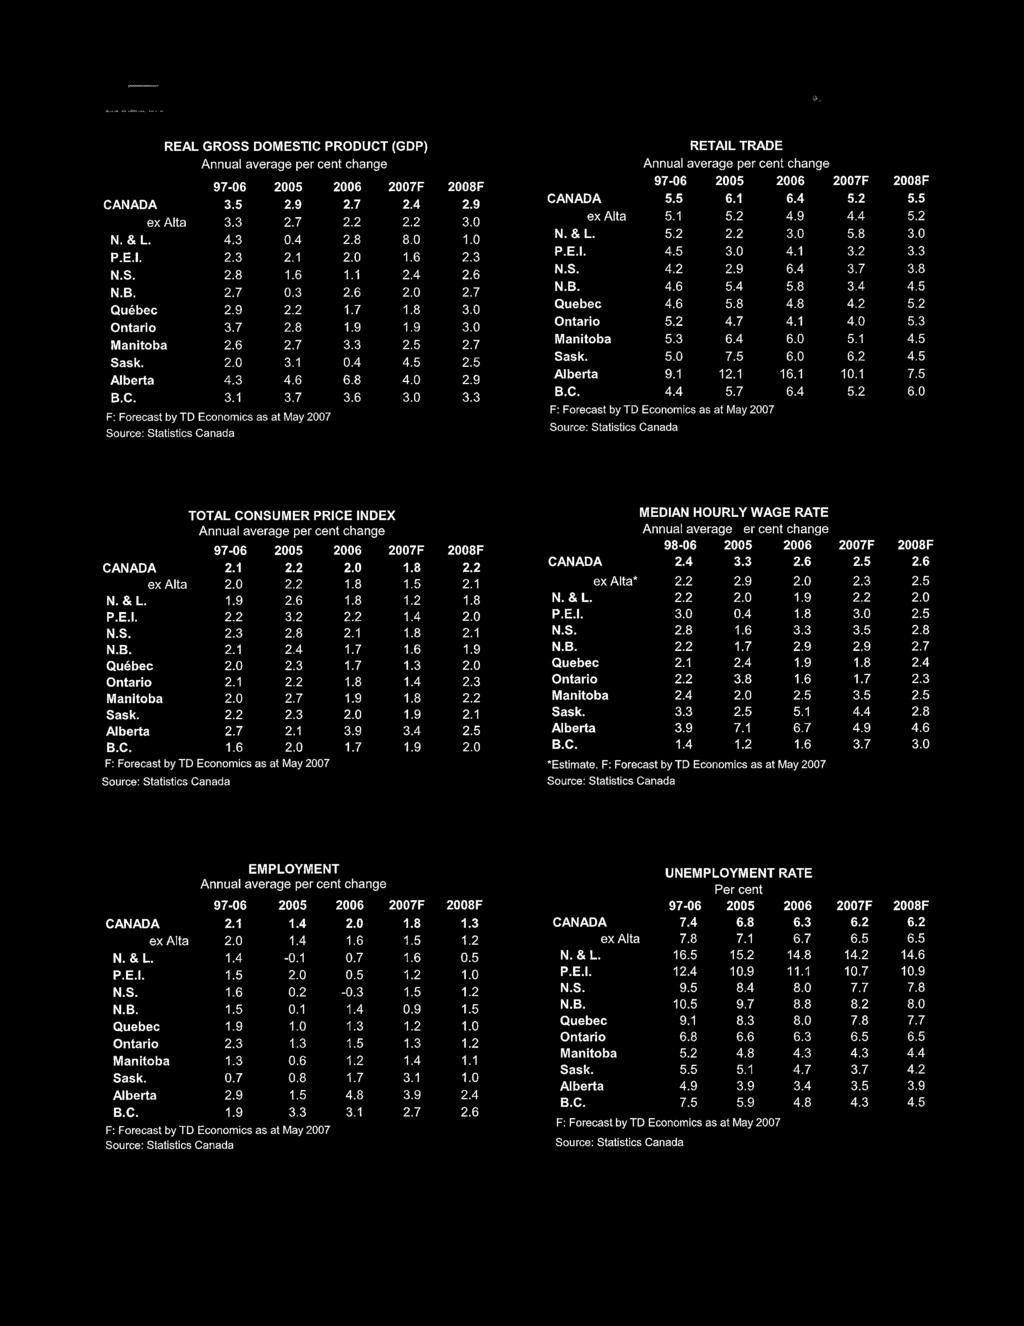
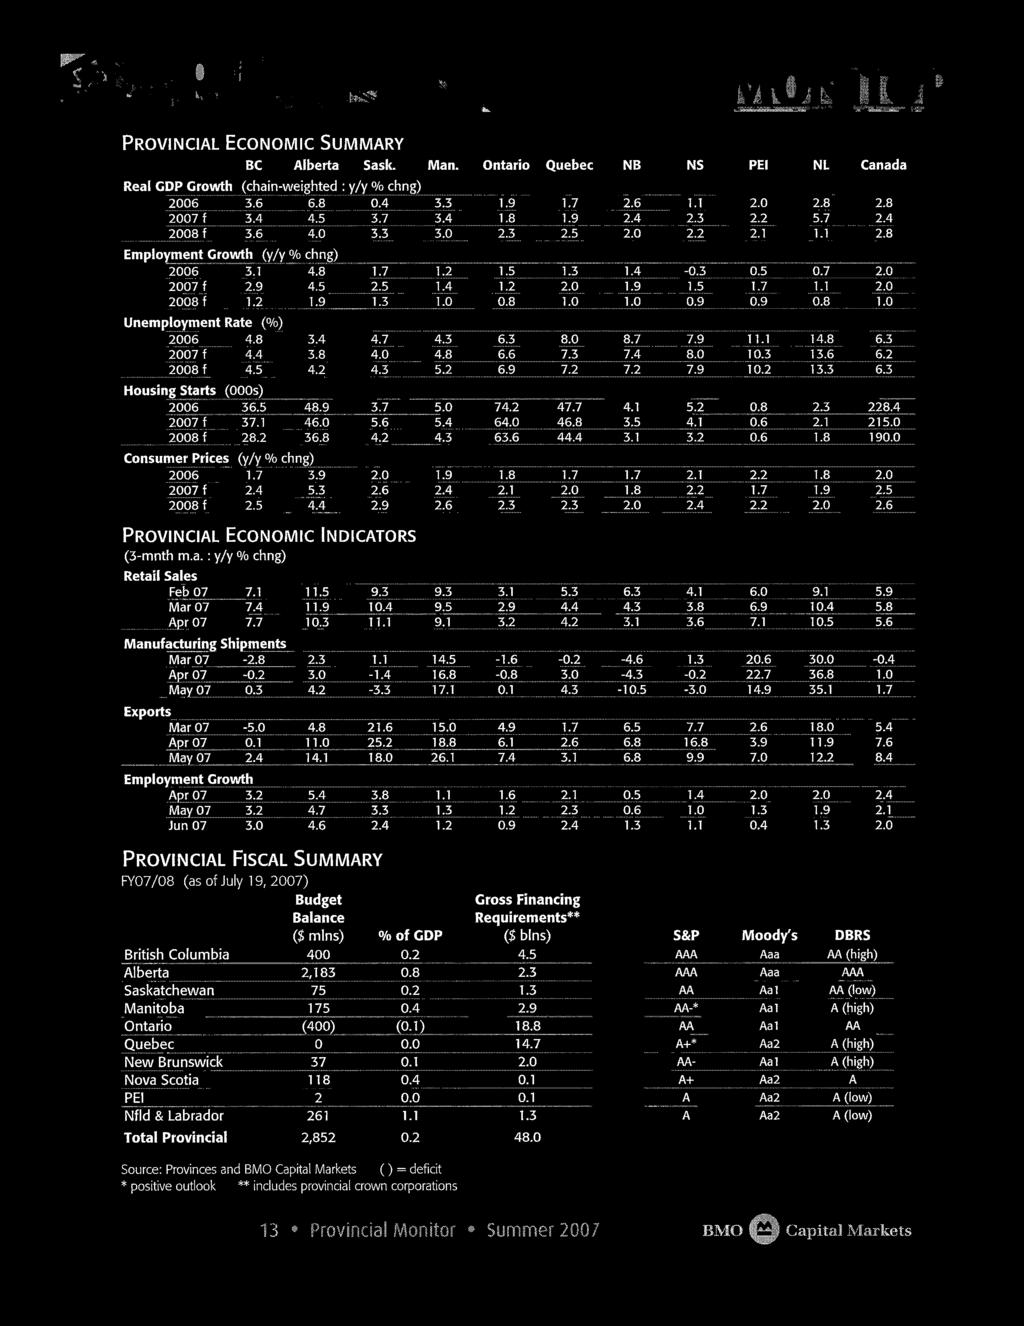
48 transportation customer forecast continues to rely on historical data, sector analyses and customer-specific survey results. Current rates are applied against the energy forecast to calculate the revenue forecast. The underlying assumptions and components of that forecast are discussed below. 2. UNDERLYING ASSUMPTIONS The following assumptions were made about external influences when developing this forecast: The Province will continue to experience economic growth for the balance of 2007 and into 2008; Provincial population growth continues, with significant contributions from international immigration and inter-provincial migration; Natural gas commodity prices will remain relatively stable, but may experience mild upward pressure; Energy efficiency will continue to improve driven by appliance renewal and continuing conservation efforts; and Industrial and transportation sectors will be challenged to maintain their position in the face of a declining U.S. currency and a slowing economy in that country. 3. ECONOMIC OUTLOOK FOR BRITISH COLUMBIA The prospects for the province remain encouraging for the end of 2007 and into The consensus among leading economists 1 is that the country will continue to experience positive growth with British Colombia being among the leading provinces. The tightening of credit conditions in the U.S. has the potential to intensify the housing correction there and restrain economic growth in general, but the U.S. Federal Reserve s recent rate cut should help to stabilize conditions. The B.C. Ministry of Finance is projecting economic growth at 3.0% in 2007 and 2.9% in 2008 for the province. The weakness in the lumber and natural gas industries, along with lower 1 BMO Financial Group Provincial Monitor, summer 2007; Conference Board of Canada - Provincial Outlook, Summer 2007; RBC Financial Group - Provincial Outlook, June 2007; Provincial Current Trends, August 2007; TD Bank Financial Group TD Quarterly Economic Forecast, June 2007 A-4 Gas Sales and Transportation Volumes Page 2
49 economic growth south of the border, is recognized by the Government, but strong domestic demand and steady employment gains are expected to maintain B.C. s robust economic growth. Housing Market Growth in incomes combined with a tight labour market and high levels of consumer confidence will help to counteract rising mortgage carrying costs for new homes in B.C. Multi-family housing starts are forecast to reach a 13-year peak in 2007 but then decline slightly in B.C. will continue to see a net migration to the province which will add close to 100,000 people to the province s population over the next two years which will in turn boost housing demand. According to the Canada Mortgage and Housing Corporation (CMHC), the provincial housing sector will continue to benefit from above-average economic growth this year and next. As of July 2007, single detached housing starts dropped 19 per cent to 5,999 units, compared to July Multiple home starts rose 4 per cent to 12,791 units, compared to July last year. # of housing starts in BC BC Housing Starts f 2008f Single Family Housing Starts Multi Family Housing Starts 2006 Actual (CMHC - BC Housing Statistics) 2007f and 2008f (CMHC Housing Market Outlook - Canada - Third Quarter 2007) The latest CMHC housing starts forecast for BC published in the third quarter of 2007 projects 35,525 housing starts for 2007 (a 2.5% decrease from 2006) and 32,500 for 2008 (a 8.5% decrease from 2007). Single-family dwelling starts are expected to reach 14,250 in 2007 and A-4 Gas Sales and Transportation Volumes Page 3
50 decline slightly to 13,500 in Multi-family dwelling starts are forecasted at 21,275 units in 2007 and 19,000 in Apartment condominium starts will continue to dominate this category reflecting rising land costs. Customer Additions Forecast The forecast of residential account additions is based on household formation data which is statistically linked with actual account additions to model annual account growth on a service area basis. The forecast of household formations is then applied to obtain the expected number of additions and adjusted for actual customer counts to date (June 2007). The BC Statistics 2007 Household Formation forecast was used as the primary predictor variable to estimate household formations by area over the forecast period, with the near-term forecast validated by current housing start and service request information. Provincial housing forecasts from CMHC are also reviewed to identify recent trends as these quarterly forecasts can better identify changes in the market than the household formation forecast which is only updated on a yearly basis. The table below provides a summary of the residential, commercial and industrial and transportation customer additions for the last 3 years and a projection for the years 2007 and forecast for Yearly information on housing starts and population growth is also provided Actuals 2005 Actuals 2006 Actuals 2007 Projected 2008 Forecast Residential 2 10,716 11,427 9,595 12,764 11,098 Commercial , Industrial & Transportation 4 32 (9) (70) (17) (5) Total 11,504 12,420 10,181 13,129 11,797 Year-Ending Customers 786, , , , ,609 Housing Starts 5 32,925 34,667 36,443 35,525 32,500 Notes TGI Customer Growth 1 1. Includes Lower Mainland, Inland, Columbia and Revelstoke service regions only. 2. Rate 1 3. Rates 2, 3 & Rates 4, 5, 6, 7, 22, 25 & Source: CMHC 6. Includes 3,124 additional customers due to amalgamation of Squamish customers A-4 Gas Sales and Transportation Volumes Page 4
51 Natural gas prices have been decreasing over 2007 and the outlook is for prices to remain relatively stable or only increase marginally provided there are no significant events that threaten supply. As a result, net account additions for 2008 should continue at a steady pace as customers grow accustomed to more stable natural gas prices. 4. USE PER CUSTOMER FORECAST Individual use per customer projections are developed for each service area and rate class by considering the following factors: Recent historical normalized use per account Efficiency improvements - appliance and insulation upgrades Customer migration between rate classes The decline in residential use rates experienced over the last several years is expected to continue over the long-term. Though the use rate for 2007 is projected to increase slightly, the familiar drivers of 1) more efficient appliances 2) better insulated homes and 3) multi-family home construction results in an average residential use rate that is forecast to be approximately 1% lower in 2008 than Commercial use rates have been exhibiting more of a mixed pattern with some rates increasing while other showing a small decline. A summary of historic and forecasted use per customer rates are set out below and have been used in the preparation of the 2008 forecast. Historic and Forecast Usage - Rates 1, 2, 3 & 23 (GJ) Normal 2004 Normal 2005 Normal 2006 Projected 2007 Forecast 2008 Rate Rate Rate 3 3, , , ,429.0 Rate 23 5, , , , ,850.0 A-4 Gas Sales and Transportation Volumes Page 5
52 5. ENERGY FORECAST a. Residential and Commercial The residential and commercial energy forecast is calculated by multiplying the use per customer rate by the total number of customers. Compared with the projection for 2007, the total residential energy consumption is expected to decline from 73.8 PJs to 72.0 PJs in 2008 while commercial consumption is forecast to remain relatively stable at 46.1 PJs in 2008 as compared to 46.9 PJs in Lower projected consumption for with respect to primarily reflects the impact of colder than normal weather experienced over the first six months of this year and declining residential use rates. The forecast for each year is provided in the summary table at the end of this section. b. Firm Sales and Industrial As with previous years, the primary source of information for the industrial energy forecast was the industrial survey which was conducted over the summer of Surveys were faxed to each customer in Rate Classes 7, 22, 25 and 27. Customers were asked to what extent they expected their firm s natural gas consumption to change from the previous year and to estimate their consumption over the forecast period. The industrial energy forecast was then updated to include these demand estimates and other pertinent feedback. A total of 368 surveys were completed, representing a response rate of 80% (based on 2006 energy consumption) and 49% (based on the number of accounts). Surveys were gathered from customers across every service region, rate class and industry. Rate Classes 4, 5 and 6 forecasted volumes are estimated based on the most recent 12 months (July 2006 June 2007) of metered consumption data. Where appropriate, the forecast consumption for Rate Class 5 is adjusted to reflect a normal weather year. Total firm sales and industrial energy consumption (excluding Burrard Thermal and TGVI) is expected to decrease from 60.6 PJs in 2007 to 53.6 PJs in Though natural gas commodity costs have moderated, the increase in the Canadian currency has caused some customers in the forestry sector to curtail their production or even cease operations. A-4 Gas Sales and Transportation Volumes Page 6
53 The following table sets out the energy forecast by residential, commercial, firm sales and industrial customers. Historic and Forecast Energy (PJ) Normal 2004 Normal 2005 Normal 2006 Projected 2007 Forecast 2008 Residential Commercial Firm Sales Industrial Total Notes 1. Rate 1 2. Rates 2, 3 & Rates 4, 5 & 6 4. Rates 7, 22, 25 & 27 (does not include Burrard Thermal & TGVI) 6. REVENUE FORECAST A revenue forecast for each customer rate class is developed from the total energy forecasts and the applicable rates. The revenue forecast below does not include Burrard Thermal and TGVI. The table below summarizes historical and forecast revenues for 2004 to 2008 by customer category. Historic and Forecast Revenue ($ million) Normal 2004 Normal 2005 Normal 2006 Projected 2007 Forecast 2008 Residential Commercial Firm Sales Industrial Total 1, , , , ,494.7 Notes 1. Rate 1 2. Rates 2, 3 & Rates 4, 5 & 6 4. Rates 7, 22, 25 & 27 (does not include Burrard Thermal & TGVI) A-4 Gas Sales and Transportation Volumes Page 7
54 7. MARGIN FORECAST In 2008, total margin is expected to moderate from the value projected for 2007 due to decreasing industrial volumes - particularly in the forest industry. Also, the 2007 projection incorporates 6 months of actual data during which the weather was colder than normal. The table below sets out the forecast for residential, commercial, firm sales and industrial customers. Historic and Forecast Margin ($ million) Normal 2004 Normal 2005 Normal 2006 Projected 2007 Forecast 2008 Residential Commercial Firm Sales Industrial Total Notes 1. Rate 1 2. Rates 2, 3 & Rates 4, 5 & 6 4. Rates 7, 22, 25 & 27 (does not include Burrard Thermal & TGVI) 8. SOUTHERN CROSSING PIPELINE (SCP) THIRD PARTY REVENUES For 2008, SCP Third Party firm revenues are forecasted to be $11.1 million, relatively unchanged from The revenue forecast for SCP is detailed in the table below SCP Revenues Northwest Natural Gas Co. $ 7,317,094 PG&E Termination $ (825,000) MCRA $ 3,600,000 Net Mitigation $ 1,000,000 Total SCP Revenues $ 11,092,094 Debits from the Midstream Cost Reconciliation Account (MCRA) are expected to continue until November 1, PG&E Termination fees to PG&E are planned to decrease in 2010 to A-4 Gas Sales and Transportation Volumes Page 8
55 $145,000 per year and cease at the end of Net mitigation revenues continue to be forecasted at $1 million per year. 9. MISCELLANEOUS REVENUE Revenue from service work remains at $85 for customer additions and $25 for account transfers. Late Payment Charges are calculated using the O&M formula methodology as set out in the Negotiated Settlement document. Annual NSF cheques are estimated at approximately 0.5% of the beginning of year s account base at a rate of $20 per cheque. Other miscellaneous revenue is estimated at approximately $59,000 comprising of Non- Regulated Businesses (NRB) recoveries. 10. BURRARD THERMAL REVENUE Revenues for the Bypass Transportation Agreement between the Company and BC Hydro to serve Burrard Thermal, are forecast to provide $10.0 million in revenues in The transportation charge is adjusted from year to year based on inflation, and is fixed for the year independent of energy consumption. 11. TERASEN GAS (VANCOUVER ISLAND) INC. REVENUE Revenue from wheeling demand charges and odorant cost recovery remains at approximately $4.3 million for FORECAST RISKS The Canadian economy in 2008 is expected to moderate from the level experienced over the past few years. Canada and B.C. in particular are underpinned with strong economic fundamentals, but there are external factors which could impact the province and have an effect on the forecast. These risks include but are not limited to: Continued appreciation of the Canadian dollar against the U.S. currency resulting in a decrease in the competitiveness of exports from B.C. to the U.S.; A-4 Gas Sales and Transportation Volumes Page 9
56 Recession in the U.S. which results in a slowdown in the Canadian and B.C. economies; Possibility of increase in interest rates and a resulting slowdown in new home construction; Natural gas price increases impacting its competitive position. 13. SUMMARY This Gas Sales and Transportation Volumes forecast reflects the best information currently available and incorporates the following: Revenues adjusted to reflect current rates approved for 2007; Customer counts and use per customer rates adjusted to reflect actual results to June 2007; Industrial demand and revenues adjusted to reflect current agreements. A-4 Gas Sales and Transportation Volumes Page 10
57 2008 OPERATING AND MAINTENANCE EXPENSE FOR THE YEAR ENDING DECEMBER 31, 2008 In accordance with the Extension of the PBR settlement, the 2008 operating and maintenance costs are determined on a formula-based approach that starts from a base of the 2003 Decision O&M, escalated by growth in customers and inflation less an adjustment factor of 66% of CPI (BC). The forecast of 2008 inflation based on CPI (BC) is 2.1% as discussed under Section A, Tab 2. For the purpose of 2008 rates setting, 2007 formula-based O&M expense has been adjusted based on updated 2007 customer accounts. Per Commission Order No. G-51-03, a true-up does not occur on CPI. Further, a customer count-related true-up for 2007 overhead capitalization does not occur. The detail calculation of adjusted 2007 O&M base is shown on Page 2 of this Tab. A rate base deferral account has been established to record the difference between the O&M that TGS would have been allowed in 2007 in its cost of service, had it not amalgamated with TGI and the O&M expenses that, under the PBR, are allowed to amalgamated TGI in An amount of $114,600 after tax has been deferred in 2007 as shown in Tab 3, Page For 2008, the annual operating and maintenance expenses are based on the following formula: Gross O&M = 2007 Adjusted O&M X [(1 + customer growth) X (1 + CPI adjustment factor)] + Pension & Insurance Variance Gross 2008 O&M Capitalized Overhead Fort Nelson O&M and Vehicle Lease Net 2008 O&M $ million (27.552) million (2.707) million $ million Details in support of the above calculation can be found on Page 2 of this Tab. As per Commission Order No. G-51-03, variances between PBR formula based pension and insurance costs and forecast cost of service based have also been included as 2008 O&M expenses. Based on the calculation shown on Page 3 of this tab, an amount of $4,575,000 is included as a reduction to 2008 O&M expenses. Forecast 2007 cost of service variances are trued up and captured in deferral accounts under Section A, Tab 3, Page Consistent with the 2003 Decision and the terms of the Settlement, the Company has kept the overheads capitalized rate at 16% for the 2008 year. A-5 O&M Expense Page 1
58 Section A Tab 5 FORMULA CALCULATION OF Page 2 OPERATING AND MAINTENANCE EXPENSE FOR THE YEARS ENDING DECEMBER 31 ($000) - Except where noted 2003 Customer Customer Customer Customer Decision Base Base Base Base Line Adjusted for Approved Adjustment Adjusted Base Approved Adjustment Adjusted Base Approved Adjustment Adjusted Base Approved Adjustment Adjusted Base Forecast No. Description TPIP Change Change 2004 Change Change 2005 Change Change 2006 Change Change 2007 Change 2008 (1) (2) (3) (4) (5) (6) (7) (8) (9) (10) (11) (12) (13) (14) (15) (16) (17) (18) (19) (20) (21) (22) (23) (24) s 1 Average Number of Customers - Forecast 770,368 7, ,779 10, ,385 12, ,316 13, ,347 12, ,970 2 Percentage Growth in Average Customers 0.96% 1.40% 1.60% 1.68% 1.53% 3 4 Average Number of Customers - True up (Actual/Projection) 770,624 8, , ,461 12, , ,593 15, , ,844 11, ,480 5 Percentage Growth in Average Customers 1.15% 1.56% 1.92% 1.44% 6 7 Annual Inflation Rate - CPI 1.70% 1.70% 2.00% 2.00% 2.20% 2.20% 2.00% 2.00% 2.10% 8 Adjustment Factor 0.85% 0.85% 1.00% 1.00% 1.45% 1.45% 1.32% 1.32% 1.39% Total Gross O & M Expense before TPIP $176, TPIP 5, Total Gross O & M Expense 182,420 3, ,740 3, ,089 4, ,575 4, ,888 4, ,394 5, ,001 4, ,657 4, ,183 4, , Pension & Insurance Variance 2,144 2,144 2,144 2,144 (2,134) 11 (2,134) 11 1,515 1,525 1,515 1,525 (2,721) (1,195) (2,721) (1,195) (3,380) (4,575) 14 Adjusted Total Gross O&M Expense ,233 J22 - H22 (not 190, , , , , , , Less: Adjustments for Overhead Capitalized Purpose 17 Fort Nelson ($581) 18 Vehicle Lease (1,833) 19 DRIA (1,652) 20 OPEB (6,329) 21 Capital-related Portion - CustomerWorks (8,978) 22 Total Items Not Subject to Overheads ($19,373) (19,373) (19,726) (19,763) (20,239) (20,273) (20,752) (20,816) (21,311) (21,260) (21,739) 23 Less: TPIP Not Subject to Overhead (5,505) (5,605) (5,616) (5,751) (5,761) (5,897) (5,915) (6,056) (6,041) (6,177) 24 Total O&M Subject to Capitalized Overhead 157,542 5, ,553 5, ,854 1, ,596 2, ,865 5, ,270 5, ,795 1, , , , Capitalized Overhead at 16% 25,207 26,010 26,010 26,335 26,335 27,243 27,243 27,535 27,535 27, Gross O&M Less Capitalized Overhead 157,213 4, ,875 5, ,224 2, ,250 2, ,563 5, ,676 5, ,283 1, ,927 1, ,453 1, , Less: Fort Nelson (581) (11) (592) (12) (593) (14) (607) (15) (608) (14) (622) (16) (624) (15) (639) (13) (637) (14) (651) 30 Vehicle Lease (1,833) ($33) (1,866) (37) (1,870) (45) (1,915) (48) (1,918) (45) (1,963) (51) (1,969) (47) (2,016) (42) (2,011) (45) (2,056) 31 Total Utility O&M $154,799 4,618 $159,417 $4,962 $159,761 $1,967 $161,728 $2,276 $162,037 $5,054 $167,091 $5,653 $167,690 $1,582 $169,272 $1,115 $168,805 $1,054 $169, Customer Customer Customer Customer Decision Base Base Base Base Adjusted for Approved Adjustment Adjusted Base Approved Adjustment Adjusted Base Approved Adjustment Adjusted Base Forecast Adjustment Adjusted Base Forecast Late Payment Charges Formula TPIP Change Change 2004 Change Change 2005 Change Change 2006 Change Change 2007 Change 2008 Lower Mainland 3,327 3,394 3,476 3,481 3,563 3,574 3,659 3,650 3,732 Inland 1,306 1,332 1,364 1,367 1,399 1,404 1,437 1,434 1,466 Columbia Total 3 Divisions 4,789 4,885 5, , , , , , ,373 A-5 O&M Expense Page 2
59 Section A Tab 5 FORMULA CALCULATION OF O & M EXPENSE Page 3 PENSION AND INSURANCE VARIANCE ($000) - Except where noted 2003 Line Adjusted for Approved Adjusted Base Approved Adjusted Base Approved Adjusted Base Approved Adjusted Base Forecast No. Particulars 2003 Change Change Change Change Change 2008 (1) (2) (3) (4) (5) (6) (7) (8) (9) (10) (11) (12) (13) (14) (15) (16) 1 Formula Based 2 Pension $5,543 $101 $5,644 $5,654 $147 $5,791 $5,800 $137 $5,937 $5,956 $141 $6,097 $6,083 $137 $6,220 3 Insurance 3, ,728 3, ,825 3, ,921 3, ,027 4, ,108 4 Total $9,204 $168 $9,372 $9,389 $244 $9,615 $9,631 $227 $9,859 $9,889 $235 $10,124 $10,100 $228 $10, Cost of Service Based 7 Pension $5,616 $4,626 $6,299 $3,862 $1,103 8 Insurance 5,900 5,000 5,085 5,067 4,650 9 Total $11,516 $9,626 $11,384 $8,929 $5, Pension & Insurance Variance 12 Pension ($28) ($1,165) $362 ($2,235) ($5,117) 13 Insurance 2,172 1,175 1,164 1, Total Pension and Insurance Variance $2,144 $11 $1,525 ($1,195) ($4,575) A-5 O&M Expense Page 3
60 A TGI, TGW, TGVI and Commission staff working group was established in 2006 to review the appropriate reporting requirements for O&M. The purpose of the working group was to review appropriate reporting requirements for the Annual Report to the Commission. The BCUC Uniform System of Accounts for O&M provide a number of qualities for reporting that are standardized, consistent, comparable, replicable, measurable, transparent, understandable, known in advance, and unbiased. These are desirable goals that a new reporting structure should attempt to achieve. The group met on several occasions in 2006 and The working group has agreed on a reporting format, for which the Company is seeking approval from the Commission as part of this Annual Review. On September 20, 2007, the Commission issued a letter detailing the progress and proposed reporting format (included as Attachment A5 to this filing) wherein the Commission requested Intervenor comments on the working group findings and results by September 27, As of October 5, 2007, the Company is not aware of any submissions made by Intervenors. The proposed format for O&M for 2007 would be as follows: A-5 O&M Expense Page 4
61 ANNUAL REVIEW OPERATING AND MAINTENANCE EXPENSES By BCUC Account BCUC No. Particulars Approved 2007 Adjusted Base 2007 Forecast 2008 Operating Distribution Supervision 10,392 10,184 9, Distribution - Supervision 10,392 10,184 9, Operation Centre - Distribution 7,187 7,028 7, Asset Management - Distribution 1,040 1,051 1, Preventative Maintenance - Distribution 1,676 1,693 2, Distribution Operations - General 4,487 4,758 4, Meter Exchanges 1,892 1,911 2, Emergency Management 6,083 7,106 5, Distribution - Operation 22,364 23,547 22, Distribution Corrective - Meters 977 1,083 1, Distribution Corrective - Propane Distribution Corrective - Leak Repair Distribution Corrective - Stations Distribution Corrective - General Distribution - Maintenance 2,417 2,537 3, DISTRIBUTION 35,173 36,268 35, Transmission Supervision 2,172 2,255 2, Transmission - Supervision 2,172 2,255 2, Pipeline Operation 2,002 2,123 2, Right of Way 1,288 1,405 1, Compression 1,729 1,747 1, Gas Control 2,572 2,271 2, Transmission Pipeline Integrity Project (TPIP) 5,682 3,270 5, Transmission - Operation 13,274 10,816 13, Pipeline - Maintenance Compression - Maintenance TPIP - Maintenance Transmission - Maintenance TRANSMISSION 16,207 13,839 16, LNG Plant Operations LNG - Plant Operation LNG Plant Maintenance LNG - Plant Maintenance LNG Plant Operations 1,061 1,072 1, Measurement Operations 3,931 3,971 3, Measurement - Operation 3,931 3,971 3, Measurement Maintenance Measurement - Maintenance MEASUREMENT 3,931 3,971 3, Faciliities Management 5,546 5,602 5, Shops & Stores 3,761 3,799 3, Operations Engineering 5,475 5,530 5, Property Services 996 1,006 1, System Integrity 1,901 1,920 1, Environmental Health & Safety 1,478 1,422 1, Operations Governance 1,626 1,588 1, GENERAL OPERATION 20,783 20,868 20, Total Operating 77,154 76,018 77,315 A-5 O&M Expense Page 5
62 General & Administration Energy Efficiency 1,752 1,770 1, Marketing - Supervision Corporate & Marketing Communications 2,066 2,087 2, Marketing Planning & Development MARKETING 5,238 5,291 5, Customer Care - Supervision 1, , Customer Contact - ABSU contract 49,339 49,724 50, Bad Debt Management and Administration 6,206 5,530 6, Customer Management & Sales 2,730 3,303 2, CUSTOMER CARE 59,290 59,450 60, Business & IT Services - Supervision 1,179 1,191 1, Application Management 8,203 8,286 8, Infrastructure Management 6,426 6,491 6, Procurement Services BUSINESS & INFORMATION TECH SERVICES 16,618 16,786 16, Administration & General 4,666 6,083 4, Insurance 5,479 5,534 4, Finance and Regulatory Affairs 8,985 9,122 9, Shared Services Agreement 4,315 4,359 3, Corporate Administration 23,444 25,098 23, Forecasting 1,462 1,200 1, Community Relations 1,397 1,411 1, Public Affairs 1,397 1,411 1, Business Development 1,437 1,332 1, Human Resource 4,561 4,700 5, Other Post Employment Benefits 8,860 8,950 8, ADMINISTRATION & GENERAL 41,162 42,691 40,982 TOTAL GENERAL AND ADMINISTRATION 122, , ,116 TOTAL OPERATING & GENERAL ADMINISTATION 199, , ,431 Less : Stock Related Compensation 0 (1,249) (313) Total Formula Gross O&M ( including Fort Nelson) 199, , ,118 Less: Capitalized Overhead (27,535) (27,535) (27,552) CC2 Vehicle Lease (2,016) (2,011) (2,056) Fort Nelson (639) (637) (651) Total Formula Utility O&M 169, , ,859 A-5 O&M Expense Page 6
63 OPERATING AND MAINTENANCE EXPENSES Resource View Cost Element Approved 2007 Adjusted Base 2007 Forecast 2008 M&E Expenses 45,594 46,864 45,215 COPE Expenses 25,508 25,438 25,997 IBEW Expenses 20,541 21,502 21,873 Total Labour Expenses 91,643 93,803 93,085 Vehicle Expenses 5,183 5,279 4,949 Employee Expenses 3,934 3,949 4,028 Materials 5,198 5,142 5,371 Office Furnishing & Equipment Computer Expenses 8,152 8,235 8,099 Fees & Admin, Promotion & Advertising 29,877 29,286 28,808 Contractors Expenses 59,396 58,832 61,326 Facilities 12,357 12,155 11,713 Recoveries & Revenue (14,094) (14,237) (14,726) Less: Transfer to Manual GL (2,302) (2,325) (2,346) Total Non-Labour Expenses 107, , ,346 Less: Stock Related Compensation - (1,249) (313) Total Formula Gross O&M Expenses 199, , ,118 Less: Vehicle Lease Reclass (27,535) (27,535) (27,552) Capitalized Overhead (2,016) (2,011) (2,056) Fort Nelson (639) (637) (651) Formula Utility O&M Expenses ( excl Fort Nelson) 169, , ,859 A-5 O&M Expense Page 7
64 Attachment A-5
 660-4700 BC TOLL FREE: 1-800-663-1385 FACSIMILE: (604) 660-1102 Via E-mail September 20, 2007 To: Terasen Gas (Vancouver Island) Inc.")
65 SIXTH FLOOR, 900 HOWE STREET, BOX 250 VANCOUVER, B.C. V6Z 2N3 CANADA web site: TELEPHONE: (604) BC TOLL FREE: FACSIMILE: (604) Via September 20, 2007 To: Terasen Gas (Vancouver Island) Inc. 2006/2007 Revenue Requirements-Registered Intervenors (TGVI_ RR-RI) Re: Terasen Gas (Vancouver Island) Inc. 2006/2007 Negotiated Settlement Agreement Departure from Uniform System of Accounts for O&M Terasen Gas (Vancouver Island) Inc. ( TGVI ) proposed in its 2006 and 2007 Revenue Requirements Application dated July 20, 2005 to depart from using a portion of the Uniform System of Accounts for recording its O&M in Accounts 600 to 999, commencing on January 1, The Negotiated Settlement Agreement for TGVI stated on page 11 of Appendix A to Commission Order No. G : A TGVI and Commission staff working group will be established to review appropriate reporting requirements and submit its findings for review at the 2006 Settlement Update Meeting. The purpose of the working group was to review appropriate reporting requirements for the Annual Report to the Commission. The BCUC Uniform System of Accounts for O&M provide a number of qualities for reporting that are standardized, consistent, comparable, replicable, measurable, transparent, understandable, known in advance, and unbiased. These are desirable goals that a new reporting structure should attempt to achieve. On October 23, 2006, TGVI filed its 2006 Settlement Update. On Section 9, page 5 of the filing it indicated that the status was In Progress. It outlined the proposed activity view and the complementary resource view reports. TGVI stated that the proposed reporting allows costs to be easily compared year over year regardless of organization structure and that once approved TGVI, Terasen Gas (Whistler) Inc. ( TGW ) and Terasen Gas Inc. ( TGI ) (collectively the Terasen Utilities ) will report their O&M in this consistent manner going forward. On December 7, 2006, TGW requested approval to depart from using the Uniform System of Accounts for recording of its O&M expenses. By Order No. G , the Commission denied TGW s requested departure from using the Uniform System of Accounts and asked TGW to consider participating in the TGVI and Commission staff Working Group. On February 28 and March 15, 2007, the TGVI, TGW, TGI and Commission staff Working Group (the Working Group ) reviewed the Operation and Maintenance Code of Accounts, with the goal of developing a revised code of accounts ( New Code of Accounts ). The New Code of Accounts would... /2
66 2 allow reporting for both an activity-based view and a resource-based view and relationship mapping to the Commission s Uniform System of Accounts. The information presented does not mirror exactly the BCUC Uniform System of Accounts but does attempt to provide relevant and consistent information for both annual reporting and revenue requirements. Since the New Code of Accounts is based on how the Terasen Utilities are currently internally planning, recording and reporting their costs, the New Code of Accounts may in the future need to be adapted to meet changes in operational activities. An example of potential future changes could be the reporting, coding and recording of CustomerWorks charges or Shared Services Agreement charges. The reporting requirements do not limit the detailed information that should be kept by the utility. The utility should be able to provide a detailed drill-down of amounts that are reported in the code of accounts. In April 2007, TGI, TGVI and TGW filed its Annual Reports to the Commission for the year ended December 31, Most of the Terasen Utilities prepared the reports using the New Code of Accounts, providing both a resource-based view and an activity-view. Unlike British Columbia Transmission Corporation ( BCTC ) no mapping of the accounts to the BCUC Uniform System of Accounts were provided in the TGI and TGVI Annual Reports. The Working Group is now reporting its results to the participants in the TGVI 2007 Settlement Update Meeting that was originally contemplated for the 2006 Settlement Update Meeting. The documents included for your review are: Appendix A: Terasen Gas O&M Code of Accounts; Appendix B: The relevant Annual Report pages filed in the Terasen Utilities 2006 Annual Reports to the Commission; and Appendix C: The relevant BCTC Annual Report pages including the mapping of the accounts provided by BCTC in its 2006 Annual Report to the Commission. Registered Intervenors are requested to provide their comments on the Working Group findings and results by September 27, 2007 to Commission staff and Terasen Gas. TGI and TGVI will include a copy of this letter and the Registered Intervenors comments in its 2007 Annual Review and Settlement Update materials. PN/dlf Enclosures Yours truly, Original signed by: Philip Nakoneshny Director, Rates and Finance TGVI/Cor/Code of Accts Rpting Sept. 07
67 APPENDIX A Page 1 of 33 Operation and Maintenance Code of Accounts
68 Code of Accounts APPENDIX A Page 2 of 33 ACTIVITY-BASED VIEW 100 DISTRIBUTION DISTRIBUTION - SUPERVISION Supervision - Supervision DISTRIBUTION OPERATION Operations Centre - Distribution Asset Management - Distribution Preventative Maintenance - Distribution Distribution Operations - General Emergency Management DISTRIBUTION MAINTENANCE Corrective Maintenance - Meters Corrective Maintenance - Propane Corrective Maintenance - Leak Repair Corrective Maintenance - Stations Corrective Maintenance - General 200 TRANSMISSION TRANSMISSION - SUPERVISION Transmission - Supervision TRANSMISSION OPERATION Pipeline Operation Right of Way Compression Gas Control Transmission Pipeline Integrity Program ( TPIP ) TRANSMISSION MAINTENANCE Pipeline Operation Compression TPIP Maintenance 300 LNG OPERATION LNG PLANT OPERATION LNG Plant Operation LNG MAINTENANCE LNG Maintenance Page 1 of 32
69 Code of Accounts APPENDIX A Page 3 of MEASUREMENT MEASUREMENT OPERATION Measurement Operation MEASUREMENT MAINTENANCE Measurement Maintenance 500 GENERAL OPERATION Facilities Management Shops and Stores Operations Engineering Property Services System Integrity Environmental Health and Safety Operations Governance 600 MARKETING Marketing Supervision Energy Efficiency Corporate and Marketing Communications 700 CUSTOMER CARE Customer Care - Supervision Customer Contact Bad Debt Management and Administration Customer Management & Sales Page 2 of 32
70 Code of Accounts APPENDIX A Page 4 of BUSINESS and INFORMATION TECHNOLOGY SERVICES Business & Information Technology Services - Supervision Application Management Infrastructure Management Procurement Services 900 ADMINISTRATIVE AND GENERAL CORPORATE ADMINISTRATION Administration and general Insurance Finance and Regulatory Affairs Corporate centre and shared services fees MARKETING PLANNING & FORECASTING PUBLIC AFFAIRS Community Relations BUSINESS DEVELOPMENT HUMAN RESOURCES OTHER POST EMPLOYMENT BENEFITS Page 3 of 32
71 Code of Accounts APPENDIX A Page 5 of 33 RESOURCE-BASED VIEW 1000 COMPENSATION CHARGED TO O&M 1100 EMPLOYEE EXPENSES 1200 VEHICLES 1300 MATERIALS AND SUPPLIES 1400 FEES AND ADMINISTRATION COSTS 1500 FACILITIES 1600 CONTRACTOR COSTS 1700 COMPUTER COSTS 1800 RECOVERIES AND REVENUES Page 4 of 32
72 Code of Accounts APPENDIX A Page 6 of 33 ACTIVITY BASED VIEW 100 DISTRIBUTION DISTRIBUTION SUPERVISION Supervision - Distribution Cost of labour, vehicles, travel, supplies and other expenses incurred in the general supervision and direction of distribution facility operations. Includes expenses associated with: Regional Managers Field Managers Field Operations Assistants Clerical staff in regional locations This account also includes third party costs to conduct customer satisfaction surveys, risk assessments and environmental audits DISTRIBUTION - OPERATIONS Operations Centre Distribution Salaries, vehicles, supplies and other expenses for: Operations Centre managers Closing and Administration group Installation Coordinators Surveyors Centralized dispatch 24-hour emergency response group Appointment setting group Environmental audits Asset Management Distribution Salaries, supplies and other expenses for the distribution asset management group. This group is responsible for the systems and processes used to manage the distribution assets. A key responsibility is determining the frequency of preventative maintenance. Page 5 of 32
73 Code of Accounts APPENDIX A Page 7 of Preventative Maintenance Distribution Costs associated with scheduled or routine operational work and minor repairs as they relate to: individual meter sets that require less than 30 minutes for single run sets and less than 60 minutes for double run sets propane equipment stations including testing, calibration and minor housekeeping that require less than 30 minutes for single run sets and less than 60 minutes for double run sets, as well as scheduled heater overhauls Distribution Operations General Costs incurred for: leak surveys of mains and services (including intermediate pressure) audits land slippage any survey in advance of local municipal improvements including paving and repaving and any survey by request inspecting the meters for ice or snow transmission pressure laterals (included in distribution plant) surveys filling of bulk odorant facilities inspection of odorizer facilities including measurement of product in storage, minor adjustments calibrations or repairs requiring less than 15 minutes that can be completed during the inspection, and odorant surveys identification, recommendation or urgent action necessary to prevent activities which could endanger the pipeline activities to identify maintenance or system integrity concerns replacing line markers and warning signs attending/monitoring low pressure problems (i.e. water in the lines) winter valve configuration and survey recorder operations inspection of facilities where leaks are suspected or gas odour has been detected recording pressures and changing charts Page 6 of 32
74 Code of Accounts APPENDIX A Page 8 of Emergency Management Costs associated with: responding to gas odour calls responding to carbon monoxide investigation calls responding to fire, explosions and other customer safety calls responding to industrial premise calls first response standby time restoring full service to customers and restoring normal business functions DISTRIBUTION MAINTENANCE Distribution Corrective Maintenance Meters Meter sets Costs related to: inches, instrument drives, and OFM meter set overhauls which are determined during operational checks miscellaneous meter maintenance such as: raise, code violations, inspecting and testing meter sets and alterations to bypass assemblies relighting a residential meter set after maintenance work completed (incurred only when an additional call is required for relight) Meter devices Costs related to: duties performed to make repairs to the automatic meter reading devices and electronic/control equipment troubleshooting and repairs on portable instruments used to evaluate or test system operations repairs and repair contracts for SCADA (Supervisory Control and Data Acquisition) - system that Gas Control uses to monitor, control and manage the transmission system Distribution Corrective Maintenance Propane This account includes costs related to the unscheduled repair of propane transfer, storage, regulation and vaporization equipment. Page 7 of 32
75 Code of Accounts APPENDIX A Page 9 of Distribution Corrective Maintenance Leak Repairs Costs incurred in pinpointing and repairing a gas leak, including: leaking valves, where the leak is on a TP (transmission pressure), IP (intermediate pressure), DP (distribution pressure) or LP (low pressure) main leaks on a service leaks that are not repaired by cutting off and abandoning a section of unused main or by carrying out a renewal of main over 6 meters Distribution Corrective Maintenance Stations This account includes cost of overhauls, determined at time of operational checks, as well as repairs to buildings, structures, regulators, reliefs, valves, piping and associated equipment Distribution Corrective Maintenance General Includes costs incurred in: resetting or replacing valve boxes replacement of stem packing, o-rings, valve stops and road box height adjustment paving repair main clearing operations maintaining main ditches, bell holes and other street cuts This account also includes other general maintenance related to the distribution system not specifically described in accounts through Page 8 of 32
76 Code of Accounts APPENDIX A Page 10 of TRANSMISSION TRANSMISSION SUPERVISION Supervision - Transmission Cost of labour, vehicles, travel, supplies and other expenses for the Vice President, Gas Supply and Transmission and all transmission management personnel TRANSMISSION OPERATION Pipeline Operation Costs incurred to manage planned maintenance of the lower mainland and interior pipeline transmission lines Right of Way Costs to manage all rights of way associated with transmission lines to ensure that all transmission lines are clear of vegetation and are available for easy access Compression Costs incurred to manage planned maintenance of all compressor stations. Compressor stations in the interior include Savona, Armstrong, Kingsvale, Hedley, Midway, Warfield and Kitchener A and B compressor stations. The Langley compressor station is the only station in the lower mainland Gas Control Costs associated with planned maintenance around monitoring and/or controlling: the flow of gas in the system the odorization system the operation of the compressor, regulator and valve stations in the system the operation of the line heaters in the system pressure in the system flow imbalances Includes costs related to monitoring the security system, responding to alarm conditions, preparing gas load requirements, maintaining the SCADA system and adding and deleting points to SCADA. Page 9 of 32
77 Code of Accounts APPENDIX A Page 11 of 33 Includes the cost of company own-use gas as well as electricity expenses for the Hedley Station Transmission Pipeline Integrity Program Cost of planned maintenance activities, for mainline transmission operating plant assets including: development and maintenance of an integrity management plan asset assessments (data collection for in-line inspections, above-ground electrical surveys, natural hazards inspections, class location surveys, pipeline digs) to demonstrate and ensure asset integrity and for development of future asset assessment plans and/or asset improvement plans TRANSMISSION MAINTENANCE Pipeline Operation This account collects the costs to manage the corrective maintenance of the lower mainland and interior pipeline transmission lines. This account also includes the costs associated with corrective maintenance around gas control including: Compression repairing faults with communication systems repairing faults with SCADA system modifying SCADA screen displays This account includes the purchase of materials and cost of labour associated with the compressors, engines, and ancillary equipment such as valves, transmitters, switches and other such items that require repair or replacement TPIP Maintenance This account includes all work done when a TP or IP pipeline is excavated for repair as a result of defect indications found during inspections (note 1) but excludes excavations where defects were neither indicated nor found (note 2). Notes: 1. Would include off-target digs where a subsequent dig located the indicated defect. 2. These control digs are required by the inspection protocol in the absence of defect indications and if confirmed defect-free are to be charged to the original inspection in account Page 10 of 32
78 Code of Accounts APPENDIX A Page 12 of LNG OPERATION LNG PLANT OPERATION LNG Plant Operation This account includes salaries and expenses for planned maintenance of the LNG plant in Delta LNG MAINTENANCE LNG Maintenance This account includes salaries and expenses for unplanned corrective maintenance of the LNG plant in Delta. Page 11 of 32
79 Code of Accounts APPENDIX A Page 13 of MEASUREMENT OPERATION MEASUREMENT OPERATION Measurement Operation This account includes costs associated with: oversight of training programs research and development for any work related to modifying existing equipment, procedures or changing environmental or regulatory requirements passport to Safety Program which rewards active participants in safety initiatives to prevent workplace accidents Operational support provided for meter set design and equipment issues Purchases of non-inventoried meter parts for service work Costs incurred by the meter shop related to planned maintenance, including: travel, office supplies and administrative labour parts and labour associated with the repair of rotary, turbine and diaphragm meters 800 cu ft/hr and larger meter sampling program preventative maintenance and labour costs involved in the ongoing upkeep of the meter fleet, as well as general meter shop maintenance Costs related to instrumentation and communication services, and data acquisition such as: annual and recurring field maintenance checks performed for lower mainland measurement customers (primarily for Automated Meter Reading ( AMR ) customers - rates 5, 7, 22, 25 and 27), lower mainland line-breaks and stations, the Tilbury LNG facility, lower mainland SCADA and the telemetry and mobile radio systems scheduled calibration checks on industrial measurement equipment and AMR equipment processing the consumption data from AMR customers planned portable instrument maintenance activities (calibration checks) Page 12 of 32
80 Code of Accounts APPENDIX A Page 14 of MEASUREMENT MAINTENANCE Measurement Maintenance This account includes costs related to corrective maintenance, including: unscheduled corrective maintenance of prover system and the equipment used to repair the meters general troubleshooting to resolve meter or prover issues not directly related to a specific meter or device unscheduled field repairs associated with the Lower Mainland measurement customers (primarily AMR customers) manually reading the meters located at our lower mainland AMR customers repairing industrial measurement equipment and AMR equipment repairing the hardware and software used to collect and process data from our AMR customers responding to and resolving trouble calls at lower mainland line-break and stations, Tilbury LNG facility, muster stations, lower mainland SCADA, telemetry and mobile radio stations repairing portable instrumentation that has come in earlier than the planned maintenance date Meter Management System ( MMS - a module of SAP) repairs Page 13 of 32
81 Code of Accounts APPENDIX A Page 15 of GENERAL OPERATIONS FACILITIES MANAGEMENT Costs for the management of various facilities, including: maintenance of coastal buildings renting, operating and maintaining interior buildings labour and other expenses incurred in the general supervision and direction of the Facilities group telecommunications management rental and storage of office furniture and files maintenance of office equipment (lower mainland and interior offices) mailroom/reception printer consumables toners/papers courier and postage costs centralized office supplies in the Surrey mailroom SHOPS AND STORES Cost of labour for the Shops, Stores and Warehousing Manager as well as the expenses for the overall business unit manager and any inventory adjustments arising out of cycle counts. Shops and Stores encompasses manufacturing services, trucking and warehousing. Manufacturing Services Manufacturing Services is comprised of three separate shops, being the Machine Shop, Weld Shop and Prefabrication Shop: 1. The Machine Shop is responsible for the maintenance and manufacturing of specialized tools used by Terasen crews or contractors for the installation of mains and service lines and by Customer Service Technicians. 2. The Weld Shop is responsible for the welding of various components and sub assemblies that form the basic meter set configurations used for residential, commercial and industrial applications as well as welds on mains construction in the field. 3. Prefabrication Shop is responsible for the final painting and assembly of the components made by the Weld Shop. Page 14 of 32
82 Code of Accounts APPENDIX A Page 16 of 33 Trucking Trucking is responsible for the delivery of all materials either to musters or directly to job sites using company owned trucks or contracted delivery services. Warehousing Warehousing is responsible for the management of material inventories stored at the central warehouse, local musters, packing and shipping of materials to their final destinations as well as handling new and recall meter shipments around the province. Warehousing is also responsible for ensuring that materials being ordered into inventory meet required quality controls and specifications OPERATIONS ENGINEERING Cost of labour and other expenses for the department managers and system planning engineers. The departments include: Property Services Engineering Services System Capacity Planning Drafting Services GIS & Data Management System Integrity Department managers are responsible for project management and professional services to meet the requirements of asset managers throughout the project lifecycle including: Front End Engineering and Design (FEED) project justification design and construction operation and maintenance PROPERTY SERVICES Costs related to managing all land rights and land tenure issues, including property taxation, acquisition and disposal, leases, right of way agreements, environmental reviews and First Nations negotiations. Property services is responsible for the maintenance and security of all pipeline rights of way; this includes third party crossing permits and inspections, sub-division approvals, vegetation management, right of way patrol, public awareness and encroachment removal. Page 15 of 32
83 Code of Accounts APPENDIX A Page 17 of SYSTEM INTEGRITY Costs incurred for developing and maintaining a comprehensive integrity management plan for the gas distribution and transmission operating plant assets. The system integrity group provides risk-based integrity management services related to operating plant and surrounding natural hazards, principally focused on material defect, corrosion, geotechnical and hydro-technical risks. Includes costs incurred to: inspect, monitor, repair and replace cathodic protection systems on an ongoing basis provide or assist with corrosion control drawings and specifications repair and troubleshoot the cathodic protection system for TP (transmission pressure), IP (intermediate pressure) and DP (distribution pressure) ENVIRONMENTAL HEALTH AND SAFETY Cost of labour and other expenses incurred in providing environmental and occupational health and safety governance; carrying out public and corporate safety activities; and emergency planning. Includes costs related to: monitoring Workers Compensation Board ( WCB ) regulatory changes and potential impacts on Terasen Gas providing guidance and direction to the organization on WCB regulatory requirements including, inspections, reports and issues of compliance liaising with industry associations and other health and safety stakeholder groups on behalf of Terasen Gas overseeing health monitoring requirements and providing exposure monitoring services for all employee maintaining health and safety information system to record and track all employee accidents and injury information providing Occupational Health and Safety (OHS) reports to meet internal and external reporting requirements conducting incident investigations when required acting as an OHS resource to all field personnel ensuring there is public awareness with regard to public safety issues liaising with agencies and the community to increase awareness with regard to public safety public safety communication and initiatives Page 16 of 32
84 Code of Accounts APPENDIX A Page 18 of 33 planning and preparing for and recovering from emergencies security issues, software development and supplies ensuring business groups maintain and practice emergency plans and that the corporate plan is maintained designing and managing emergency exercises and ensuring corrective action plans are developed liaising with and developing relationships with government, agencies and related organizations ensuring mutual aid agreements are in place and maintained OPERATIONS GOVERNANCE Cost of labour and expenses of the Vice President Human Resources and Operations Governance and his/her direct reports. Includes costs associated with: Engineer in Training program which includes a labour component as well as a variety of governance related activities such as participating on committees and investigation teams, working on standards and other technical governance related projects as they come up the Governance Engineer role which is responsible for administration of the internal Standards Maintenance process, monitoring the external Regulations and Legislation as they apply to the technical side of the business (not including environment, health and safety), coordinating and participating on investigation teams, and other technical governance related activities as they arise. Page 17 of 32
85 Code of Accounts APPENDIX A Page 19 of MARKETING MARKETING - SUPERVISION Cost of labour, telecommunication and other expenses incurred in the general supervision and direction of marketing activities ENERGY EFFICIENCY Costs incurred for Demand Side Management ( DSM ) program development, launch, administration and review but excluding incentives and rebates which are charged to deferral accounts. Program examples include Efficient Boiler, High Efficient Furnace, New Construction Heating and Fireplace Upgrades. Costs incurred for communications of DSM programs, including: Connections and Gasline newsletters At Home Guide reprints and distribution customer bill inserts, brochures and info sheets Gas by Design reprints and toolkits CORPORATE AND MARKETING COMMUNICATION Cost of labour and expenses incurred for: media monitoring Terasen Gas logo stationery web communication and research lifestyle campaigns directory listings advertising design and production managers forums Focus and customer newsletters writing and editing services crisis communication. Page 18 of 32
86 Code of Accounts APPENDIX A Page 20 of CUSTOMER CARE CUSTOMER CARE - SUPERVISION Cost of salaries and expenses for: Accenture Business Services Utilities (ABSU) contract administration, negotiation and review/audit bad debt administration, credit and collections, review and audit costs customer communication including: Get Comfortable newsletters, Equal Payment Plan, heating season and rate change advertising. Costs include non-capitalized portion of Customer Contact Centre labour (CAFÉ front end) CUSTOMER CONTACT Customer care services are outsourced to CustomerWorks LP which has contracted ABSU to provide these services. The contract is comprised of the following services: Schedule A - Customer Contact - consists of contact services related to emergency service call handling, billing inquiries, payment/billing program inquiries, customer move orders, customer complaints, customer education, gas service line and meter requests, key account handling and interactive voice response for mass market customers. Schedule B - Billing Support - includes the services related to billing, payment processing, customer accounting, data interpretation and information requests, and systems support for mass market customers. Schedule C - Meter Services - includes the services related to meter reading, meter reading route management, meter order processing, high bill investigations, and meter identification for mass market customers. Schedule D - Credit and Collections - includes collection management, credit approval, credit monitoring, security deposit administration, and administration of non-cash security for mass market customers. Schedule E - Industrial and Off System Sales - consists of account management and billing, payment processing, inquiry handling, customer accounting and early stage collections and systems support for TGI industrial and large volume customers. Page 19 of 32
87 Code of Accounts APPENDIX A Page 21 of 33 Schedule F - Commercial Unbundling Operational Services - includes the services required to handle customer inquiries related to billing, enrolments and educational material, data capture and transfer of data related to market participation, financial reporting of marketer billings, marketer tariff set up and maintenance, and summary reporting related to the program. Schedule G - Stable Rate Program Operational Services includes the services required to handle customer inquiries, customer enrolments, enrolment verification, tariff set up and administration, and summary reporting related to the program. Note: if this function ceases to be outsourced, the company will provide more detail for customer care costs BAD DEBT MANAGEMENT AND ADMINISTRATION Costs associated with Rate 1-3 bad debt provision expense, recoveries and collection agency commissions. Includes costs incurred, net of recoveries, in conducting lock offs for arrears, vacant premises, seasonal, final reads and disconnect diversions to prevent unauthorized consumption, as well as Cap and Plug activities as per instruction from Gas Safety Branch or other agencies. Includes costs incurred to: remove locks from locked off meters, vacant premises, seasonal, final reads and relighting appliances, during and after work hours investigate complaints due to high bills identify/verify meter numbers corresponding to correct address and usage investigate customer calls relating to a switch, stopped, non-registering or noisy meter CUSTOMER MANAGEMENT AND SALES Cost of labour and expenses related to Rate 14 account management and recovery fees, one-on-one management and liaison of large key account customers, energy use consultation, new tariff code development. This account also includes the bad debt provision and credit and collection for Rate 4 customers and above. This account also includes the cost of labour and expenses incurred to provide: individual key account management/liaison (including credit and collections) representation of Terasen Gas at various trade shows and energy conferences Page 20 of 32
88 Code of Accounts APPENDIX A Page 22 of 33 print, supply/distribute technical literature, data sheets, brochures and newsletters energy use case studies and site visits annual transportation contracts residential sales (Multiple and Single Family) including builder, development or industry liaison technical advice to account managers and customers as well as the costs incurred researching new gas technology. Page 21 of 32
89 Code of Accounts APPENDIX A Page 23 of BUSINESS & INFORMATION TECHNOLOGY SERVICES BUSINESS & INFORMATION TECHNOLOGY SERVICES - SUPERVISION Cost of labour, travel, office supplies, and other expenses incurred in the general supervision and direction of business and information technology services operations APPLICATION MANAGEMENT Costs for the overall data and application architecture for Terasen Gas, including: SAP application Click scheduling application CAFÉ (Customer Attachment Front-End) application. CAFÉ includes process enhancements from customer attraction through order completion to collect, sort, prioritize, assign and measure company performance in closing leads and enable improved customer order processing currently handled in SAP. measurement related applications such as MACS (Measurement Application Computer System) which supports the Meter Shop business processes primarily capturing measurement equipment data that is interfaced to SAP. AM/FM (Automated Mapping / Facilities Management) and DCRS (Digitized Construction Records System) Forecasting Information System WIN Gas Connect Web Interface Nomination System middleware, a toolset that facilitates the integration of data between applications Business Intelligence applications such as Business Warehouse (BW) Intranet and Internet INFRASTRUCTURE MANAGEMENT Cost of managing the overall technology environment and infrastructure architecture including: maintaining communication sites and overseeing radio site rentals security and virus protection network costs LAN (local area network) and WAN (wide area network server services Page 22 of 32
90 Code of Accounts APPENDIX A Page 24 of 33 server hardware costs maintenance of peripheral devices (desktops, laptops and printers) application services such as and Citrix PROCUREMENT SERVICES Cost of labour and expenses related to the purchasing of goods and services including tender development, contract maintenance, purchase order processing, inventory and supplier management, training and general administration. Page 23 of 32
91 Code of Accounts APPENDIX A Page 25 of CORPORATE ADMINISTRATION CORPORATE ADMINISTRATION Administration and General The expenses in this account include: salary, travel and other expenses for the President s cost centre organizational costs such as Canadian Gas Association membership dues other administrative/general costs not otherwise defined in the code of accounts Insurance costs Cost of insurance coverage Finance and Regulatory Affairs Cost of labour, travel, supplies and other expenses incurred by the Finance and Regulatory Affairs department in providing the following services: financial accounting and reporting asset accounting accounts payable regulatory reporting regulatory application preparation and filing budgeting and planning This account also includes items such as BCUC assessment fees and external audit fees Corporate Centre and Shares Services Fees This account includes: management fees paid for services provided by Terasen Inc. or any of the Terasen Gas utilities management fee received from any of the Terasen Gas utilities for services provided by the affiliated utility Page 24 of 32
92 Code of Accounts APPENDIX A Page 26 of MARKETING PLANNING & FORECASTING Cost of labour and expenses incurred in forecasting gas load, customer additions, revenue and margin PUBLIC AFFAIRS Community Relations Cost of labour and expenses incurred for community, municipal, government and aboriginal relations/liaison. Costs include corporate donations and sponsorships related to the environment, education and community development BUSINESS DEVELOPMENT Cost of labour and expenses for identifying and developing new business opportunities HUMAN RESOURCES Cost of labour and other expenses for human resource governance, administering payroll and benefits, providing advisory services, recruiting and temporary staffing OTHER POST EMPLOYMENT BENEFITS Actuarial cost of providing other post employment benefits to retirees. Page 25 of 32
93 Code of Accounts APPENDIX A Page 27 of 33 RESOURCE VIEW 1000 COMPENSATION CHARGED TO OPERATIONS AND MAINTENANCE ( O&M ) This account includes the O&M component of the cost of labour and benefits for all three affiliations (M&E, COPE and IBEW), including other post employment benefits as defined in account EMPLOYEE EXPENSES This account includes cost such as: course fees travel and meals and entertainment (training and non-training related) mileage allowance employee hiring and relocation costs 3000 VEHICLES This account includes the costs associated with vehicles and other types of equipment including: vehicle and equipment rentals lease charges and operating costs license fees fuel expense repairs and maintenance 4000 MATERIALS AND SUPPLIES This account includes costs related to: personal supplies (e.g. purchase and cleaning of uniforms, shoes, gloves, hard hats, etc.) costs associated with the purchase, rent, and lease of office furniture as well as any required repairs and maintenance office supplies miscellaneous field, shop, road, surfacing and backfill materials (used in O&M work) Page 26 of 32
94 Code of Accounts APPENDIX A Page 28 of 33 inventory write-downs/revaluations, shrinkage/adjustments and other material adjustments freight charges 5000 FEES AND ADMINISTRATION COSTS This account includes costs such as: government fees membership dues BCUC assessments external auditor fees legal fees and retainers including land acquisition fees continuing/shared services charitable donations, political contributions and corporate sponsorships easement and rights-of-way fees and costs communications investor, public relations and employees advertising e.g. media, printed matter administration e.g. postage, couriers, contracts and outside services damages and injury costs insurance bad debt expense bank charges 6000 FACILITIES This account includes costs related to: communication heat and light company own-use gas electrical maintenance on buildings, exterior lighting heating, ventilation and air conditioning (HVAC) janitorial services landscaping plumbing garbage removal and recycling security snow removal window cleaning Page 27 of 32
95 Code of Accounts APPENDIX A Page 29 of 33 yard maintenance building maintenance CONTRACTOR COSTS This account includes costs related to: consulting fees contractors customer care services (ABSU) 8000 COMPUTER COSTS This account includes costs related to: computer consulting outsourced computer services hardware and software not meeting capitalization criteria 9000 RECOVERIES AND REVENUES This account includes the following recoveries/revenues: recovery of bad debt previously written off amounts received as recoveries from salvaged materials recoveries of O&M costs - miscellaneous recoveries not undertaken with an expectation of profit (e.g. lease recoveries, sales of miscellaneous O&M materials at cost) recovery of direct costs and overhead incurred on behalf of non-regulated businesses management fees received (as described in account ) Page 28 of 32
96 Code of Accounts APPENDIX A Page 30 of 33 UNIFORM CODE OF ACCOUNT MAPPING TERASEN GAS ACTIVITY- BASED CODE OF ACCOUNTS DISTRIBUTION DISTRIBUTION - SUPERVISION Distribution - Supervision UNIFORM CODE OF ACCOUNT MAPPING Distribution - Operation - Supervision RANGE (in millions of dollars) $ DISTRIBUTION OPERATION Operations Centre - Distribution Distribution - Operation - Supervision System Operation & Engineering $ Asset Management - Distribution Distribution - Operation - Supervision $ Preventative Maintenance - Distribution Removing and Resetting Meters and House Regulators Manufactured Gas Production - Supervision Measuring and Regulating $ Distribution Operations - General Mains and Services Measuring and Regulating $ Emergency Management Dist Ops - Supervision Service on Customers' Premises Mains and Services (Maintenance) Meters (Maintenance) $ DISTRIBUTION MAINTENANCE $ Distribution Corrective - Meters /003 Meters Distribution Corrective - Propane Other Manufactured Gas Production Maintenance Distribution Corrective - Leak Repair Mains and Services Distribution Corrective - Stations Measuring and Regulating Distribution Corrective - General /054 Mains and Services Page 29 of 32
97 Code of Accounts APPENDIX A Page 31 of 33 TERASEN GAS ACTIVITY- BASED CODE OF ACCOUNTS UNIFORM CODE OF ACCOUNT MAPPING 200 TRANSMISSION TRANSMISSION - SUPERVISION Transmission - Supervision Transmission Operation - Supervision RANGE (in millions of dollars) $ TRANSMISSION OPERATION Pipeline Operation Pipelines $ Right of Way Pipelines $ Compression Compressor $ Gas Control Other Transmission Operation $ Transmission Pipeline Integrity Program (TPIP) Pipelines $ TRANSMISSION MAINTENANCE Pipeline Operation Pipe Lines Compression Compressor TPIP Maintenance Pipe Lines currently not breaking out (included in Transmission Operation) currently not breaking out (included in Transmission Operation) currently not breaking out (included in Transmission Operation) 300 LNG OPERATION LNG PLANT OPERATION LNG Plant Operation Other Local Storage - Operation $ LNG MAINTENANCE LNG Maintenance Other Local Storage Maintenance currently not breaking out (included in LNG Operation) 400 MEASUREMENT MEASUREMENT OPERATION Measurement Operation 667/677 - Measuring and Regulatoring (Transmission/Distribution) MEASUREMENT MAINTENANCE Measurement Maintenance 867/877 - Measuring and Regulatoring (Transmission/Distribution) Removing and Resetting Meter and house Regulators $3-5 $2-4 Page 30 of 32
98 Code of Accounts APPENDIX A Page 32 of 33 TERASEN GAS ACTIVITY- BASED CODE OF ACCOUNTS UNIFORM CODE OF ACCOUNT MAPPING 500 GENERAL OPERATION Facitilities Management System Operation and Engineering General Operations - maintenance $ Shops and Stores Stores Operation Materials Quality $ Operations Engineering System Operation and Engineering $ Property Services System Operation and Engineering-Lands Management Corporate Administration - Property Services $ System Integrity System Operation and Engineering $ Environmental Health and Safety System Operation and Engineering Environmental Programs Safety Operations Governance System Operation and Engineering 600 MARKETING RANGE (in millions of dollars) $1-2 $ Marketing - Supervision Marketing Administration $ Energy Efficiency DSM Programs $ Corporate and Marketing Communications Marketing Advertising Media Relations & Employee Communications Corporate Advertising $ CUSTOMER CARE Customer Care - Supervision Customer Accounting - Supervision $ Customer Contact - ABSU contract Supervision Contracts and Orders Meter Reading Billing & Accounting Credit & Collections ~ $ Bad Debt Management and Administration Customer Accounting $ Large Commercial & Industrial Customer Management Customer Accounting - $2-3 Other Operating Page 31 of 32
99 Code of Accounts APPENDIX A Page 33 of 33 TERASEN GAS ACTIVITY- BASED CODE OF ACCOUNTS UNIFORM CODE OF ACCOUNT MAPPING 800 BUSINESS and INFORMATION TECHNOLOGY SERVICES Business & Information Technology Services - Supervision Information Systems General Information Systems Operations Information Systems Planning Application Management Information Systems General Information Systems Operations Infrastructure Management Information Systems General Information Systems Operations RANGE (in millions of dollars) $ Procurement Services Purchasing General ~$1 $7-8 $ ADMINISTRATIVE AND GENERAL CORPORATE ADMINISTRATION Administration and general Administration & General 722 Special Services $ Insurance 723 Insurance - General $ Finance and Regulatory Affairs Regulatory Affairs Accounting Planning Capital Expenditure Accounting $ Corporate centre and shared services fees Management Fees Subsidiaries & Associated $4-5 Companies MARKET PLANNING AND FORECASTING Marketing Administration Marketing Advertising $ PUBLIC AFFAIRS Community Relations Government Relations & Communications Community Relations Public Affairs Supervision Charitable Donations $ BUSINESS DEVELOPMENT 721 Corporate Administration $ HUMAN RESOURCES Human Resources General Employee Recruitment & Activities $ OTHER POST EMPLOYMENT BENEFITS 721 Corporate Administration $ 8-10 Page 32 of 32
100 APPENDIX B Page 1 of 7
101 APPENDIX B Page 2 of 7
102 APPENDIX B Page 3 of 7
103 APPENDIX B Page 4 of 7
104 APPENDIX B Page 5 of 7
105 APPENDIX B Page 6 of 7
106 APPENDIX B Page 7 of 7
107 APPENDIX C Page 1 of 10 British Columbia Transmission Corporation Schedule 4.0 Annual Report to BCUC - F2007 Electric Operation and Maintenance Expenses Line # No. Account (in $000) As at 31 March 2007 As at March 31, 2006 Increase or (Decrease) from Prior Year (a) (b) (c) (d=b-c) Other Power Supply Expenses System Control and Load Dispatching $ 1,115 $ 1,113 $ 2 2 Total Other Power Supply Expenses $ 1,115 $ 1,113 $ 2 Transmission Expenses - Operation Operation Supervision and Engineering $ 8,552 $ 7,520 $ 1, Load Dispatching 19,818 16,880 2, Other Transmission Expenses 6,437 6, Total Transmission Expenses - Operation (Note 1) $ 34,807 $ 30,748 $ 4,059 Transmission Expenses - Maintenance Maintenance Supervision and Engineering $ 15,288 $ 12,213 $ 3, Maintenance of Station Equipment 27,681 28,171 (490) Maintenance of Overhead & Underground Lines 39,135 40,663 (1,528) Maintenance of Other Transmission Plant 4,006 2,548 1, Total Transmission Expenses - Maintenance (Note 2) $ 86,110 $ 83,595 $ 2,515 Distribution Expenses - Maintenance Maintenance of Station Equipment (Note 2) $ 13,699 $ 11,314 $ 2,385 Distribution Expenses - Operation Load Dispatching $ 6,666 $ 6,091 $ 575 Administrative and General - Operation Administrative and General Salaries $ 6,521 $ 5,829 $ Special Services (150) Insurance 1,477 1, Employee Benefits 1,915 1, Other Administrative and General Expenses 15,570 15, Total Administrative and General - Operation (Note 3) $ 25,822 $ 24,419 $ 1, Total Electric Operation and Maintenance Expenses $ 168,219 $ 157,280 $ 10, Total Operation $ 68,410 $ 62,371 $ 6, Total Maintenance 99,809 94,909 4, Total Operation & Maintenance Expenses $ 168,219 $ 157,280 $ 10,939 Note 1: Increase of $4.1 million due to higher activity relating to interconnection studies, wage rate increases, higher Western Electricity Coordinating Council (WECC) fees, organization and business process design for new System Control Centre, and planning work for CPCN projects. Note 2: Increases due to emergency maintenance costs from wind storms of winter 2006/7, higher substation security costs, and labour cost increases. Note 3: Increase of $1.4 million due to higher labour costs for 39 additional employees, and a province-wide advertising campaign, partially offset by increased capitalized overhead. BCTC F2007 Annual Report 3 August 2007 Page 35
108 APPENDIX C Page 2 of 10 Appendix 1 Mapping of Accounts Between BCTC Chart of Accounts and BCUC Uniform System of Accounts for F2007 Statement of Operations, Statement of Retained Earnings, and Balance Sheet
109 Appendix 1 APPENDIX C Page 3 of 10 F2007 STATEMENT OF OPERATIONS BCTC Annual Report BCUC A/C # BCUC Account Description BCTC Account Mapping Revenue Tariff 400 Operating Revenue Account & Asset management and maintenance 400 Operating Revenue Account Service fees and other 400 Operating Revenue Account , , , & Investment Income 419 Income From Investments Account & Expenses Cost of market 426 Other Income Deductions Account (A portion of these accounts are allocated to deferral accounts) Operations, maintenance and administration 401 Operating Expense 402 Maintenance Expense Account (Portions of this account are allocated between Operating and Maintenance expense accounts and deferral accounts) Taxes and grants 408 Municipal and Other Taxes Account Depreciation and amortization 403 Depreciation Account & Finance charges 427 Interest on Long Term Debt 428 Amortization of Debt Discount, Premium & Expense 431 Other Interest Expense Account & (Portion of these accounts are allocated to: Interest on Long-Term Debt, Amortization of Debt Discount, Premium & Expense and Other Interest Expense) Amortization of Debt Discount (included in Finance Charges) 428 Amortization of Debt Discount, Premium & Expense (Included in Account 75300) Income before Deferral Account Transfers Deferral Accounts 426 Other Income Deductions Account 80100, & (A portion of these accounts are allocated to deferral accounts for F/S presentation purposes) Net Income F2007 STATEMENT OF RETAINED EARNINGS Retained Earnings, beginning of year 216 Retained Earnings - Balance Beginning of Year Account Net income 435 Retained Earnings - Balance Transferred from Net Income Prior Period Adjustment 439 Adjustments to Retained Earnings Account Retained Earnings, end of year 216 Retained Earnings - Balance End of Year BCTC F2007 Annual Report 2 August 2007 Page A-1
110 Appendix 1 APPENDIX C Page 4 of 10 F2007 BALANCE SHEET BCTC Annual Report ASSETS Current Assets BCUC A/C # BCUC Account Description BCTC Account Mapping Cash and cash equivalents 131 Cash Account Short term investments 136 Accounts receivable 142 Temporary Cash Investments Accounts Receivable - Trade Account (A portion of is allocated to cash for F/S presentation purposes) Account (Portions of these accounts are reclassified for F/S presentation purposes) Prepaid expenses 166 Prepayments Account & Deferral accounts 186 Other Deferred Credits Account Other Receivables 143 Accounts Receivable - Other Prepaid Expense - Long Term 166 Prepayments Account , & Account (A portion of is allocated to current prepaids for F/S presentation purposes) Property, Plant and Equipment 101 Plant in Service 107 Plant Under Construction 108 Accumulated Depreciation - Plant Account , (These accounts are grouped into the BCUC, Plant in Service, Plant Under Construction and Accumulated Depreciation - Plant accounts). LIABILITIES AND SHAREHOLDER'S EQUITY Current Liabilities Current portion of obligations under capital lease 239 Accounts payable and accrued liabilities 232 Accrued interest 237 Long Term Debt Due Within One Year Accounts Payable and Accrued Interest Payable and Accrued Deferred revenue 253 Other Deferred Credits Account Account , , & (Portions of these accounts are reclassified for F/S presentation purposes) Account Deferred leasehold inducements 253 Other Deferred Credits Account & Account (This Heading includes portions of other accounts reclassified for F/S presentation purposes) Due from BC Hydro 234 Accounts Receivable - Affiliated Co.'s Account & (This Heading includes portions of other accounts reclassified for F/S presentation purposes) Accrued Employee Benefits 263 Welfare and Pension Reserve Account & Asset Retirement Obligation 265 Other Reserves Account Long Term Debt 221 Long Term Debt Account Obligations Under Capital Lease 224 Other Long Term Debt Account Shareholder's Equity Share capital 201 Retained earnings 216 Common Stock (Share Capital) Retained Earnings - End of Year Account BCTC F2007 Annual Report 2 August 2007 Page A-2
111 F2007 BCTC Chart of Accounts Appendix 1 Category Account Name Classification Control Acct # Acct # APPENDIX C Page 5 of 10 Cash & Short Term Investments BMO CDN General #8357 Balance Sheet BMO USD General #6528 Balance Sheet BMO Payroll #8349 Balance Sheet BMO CDN OATT #1207 Balance Sheet BMO USD OATT #6173 Balance Sheet BMO CDN BCH TRUST #4933 Balance Sheet BMO US BCH TRUST #6755 Balance Sheet Bank Clearing Balance Sheet Petty Cash Balance Sheet Temporary Investments - CDN Balance Sheet Temporary Investments - USD Balance Sheet Accounts/ Sundry Receivables Accounts Receivable - CDN Balance Sheet Accounts Receivable - USD Balance Sheet Sundry Receivable - CDN Balance Sheet Sundry Receivable - USD Balance Sheet Written Off Accts Receivable Balance Sheet Provision For Bad Debt Accounts Balance Sheet Refund Clearing Balance Sheet Unapplied Receipts Balance Sheet Various Payroll Receivables Overpaid salaries/wages Balance Sheet Employee Pay Advances Balance Sheet Employee WCB Advances Balance Sheet Employee Advances - Income Continuance Balance Sheet Employee Advances - Relocation Balance Sheet Employee Benefit Plan Premium Receivable Balance Sheet Unbilled Labour/ expenses Unbilled Labour Balance Sheet Unbilled Exp - TLoB Capital Balance Sheet Unbilled Exp - BCH Other Balance Sheet Unbilled Exp - Non BCH Balance Sheet Unbilled Claims - damage to plant Balance Sheet Unbilled Exp - TLoB asset relocation Balance Sheet Prepaids Prepaid Expenses Balance Sheet Prepaid Expenses - Core & Rwwl Balance Sheet Prepaid Grants & School Taxes Balance Sheet Prepaid VISA Clearing Balance Sheet Other Current Assets Spares Inventory Balance Sheet Prepaid Expenses - Long Term Balance Sheet Non Current Receivables Mortgage Receivable Balance Sheet Mortgage Payment Clearing Balance Sheet Prepaid Expense - Long Term Balance Sheet Long term receivable - USD Balance Sheet Long term receivable - CDN Balance Sheet TLoB Interco - BCTC Balance Sheet TLoB Interco - Other Balance Sheet TLob Inter Business Unit AR Balance Sheet BCTC F2007 Annual Report 2 August 2007 Page A-3
112 F2007 BCTC Chart of Accounts Appendix 1 Category Account Name Classification Control Acct # Acct # APPENDIX C Page 6 of 10 Deferred Charges Deferred Debt Costs Balance Sheet BCUC Deferrals Revenue Deferral (BCUC) Balance Sheet Emergency Mtce Deferral (BCUC) Balance Sheet Cost of Market Deferral (BCUC) Balance Sheet Regulatory Exp Deferral (BCUC) Balance Sheet Grid West Exp Deferral (BCUC) Balance Sheet Capital Assets Fixed Assets - In Service Balance Sheet Fixed Assets - Capital Lease Balance Sheet Fixed Asset-Leasehold Improvements Balance Sheet Contribution in Aid of Construction - Assets In Service Balance Sheet Recurring Capital Balance Sheet Recurring Capital - Contra Balance Sheet * Site Survey & Investigation Costs Balance Sheet Site Survey & Investigation Costs - Contra Balance Sheet * Deferred Capital Balance Sheet Asset Retirement Obligation Cost Balance Sheet Tenant Inducement Balance Sheet TLob Power Smart Accum. Amortization Balance Sheet TLob Def PWS Balance Sheet TLob Sp PI OH - Opening Balance Balance Sheet TLob Re PI OH - Opening Balance Balance Sheet * Unfinished Construction Balance Sheet Unfinished Construction - WIP Contra Balance Sheet Project Clearing Balance Sheet Contribution in Aid - WIP Balance Sheet Contribution in Aid - WIP Contra Balance Sheet Accumulated Depreciation - In Service Balance Sheet Accumulated Amortization - Capital Lease Balance Sheet Accum.Depreciation-Asset Retirement Cost Balance Sheet CIA-Accumulatd Depreciation Balance Sheet Accum. Deprec. - Site Survey & Invest Costs Balance Sheet Accumulated Depreciation - Tenant Inducement Balance Sheet Accounts Payable Accounts Payable - CDN Balance Sheet Autoinvoice Clearing Balance Sheet Accounts Payable - USD Balance Sheet Various Payroll Deductions/ GST Payable Accident Dismemb Insurance Balance Sheet Adj Employees Paid Loa Balance Sheet Canada Savings Bond Balance Sheet Contrib To Fellow Empl Balance Sheet CPP Employee Contributions Balance Sheet Current Pension - Employer Balance Sheet Ehc Liability Balance Sheet EI Premiums Balance Sheet Employee Donation Deduction Balance Sheet Employee Garnishees Balance Sheet Employee Rent Balance Sheet Employee/Employer Benefit Pay Balance Sheet BCTC F2007 Annual Report 2 August 2007 Page A-4
113 F2007 BCTC Chart of Accounts Appendix 1 Category Account Name Classification Control Acct # Acct # APPENDIX C Page 7 of 10 Enhanced Pension Liability Balance Sheet Fitness Center Balance Sheet Group Insurance - Voluntary Balance Sheet Group Insurance Liability Balance Sheet Group RRSP Deductions Balance Sheet Hydrecs Tickets Balance Sheet IBEW Union Dues Balance Sheet Income Tax Deductions Balance Sheet COPE Dental Plan Balance Sheet COPE Union Dues Balance Sheet Pension Employee Contrib Balance Sheet Pensionable Bonus Plan Balance Sheet Private Health Services Plan Balance Sheet Provision Long-Term Disability Balance Sheet Sundry Pay Deductions Balance Sheet Temp Elec-Emp Benefits Balance Sheet Transit Pass Deductions Balance Sheet Gst Input Tax Credit Balance Sheet Gst Payable Balance Sheet Gst-Equal Pay/Advance Billing Balance Sheet Provincial Sales Tax Balance Sheet Payroll Clearing Balance Sheet Various Accrued Liabilities Interest Payable Balance Sheet Accrued Liabilities Balance Sheet Accrued Liability - Capital Balance Sheet Accruals on Receipt of Goods Balance Sheet Accrued Liability - Visa Balance Sheet Grants And School Tax Payable Balance Sheet Gainsharing Liability Balance Sheet Retiree Dental Plan Balance Sheet Retirement Leave Bank - Bcpc Balance Sheet Severance Pay Balance Sheet EI Premium Refund Balance Sheet Unpaid Wages Liability Balance Sheet Workers' Compensation Balance Sheet Short Term Loans Short Term Borrowing - Cdn Balance Sheet Short Term Borrowing - US Balance Sheet Due to BCH BCH Payable Balance Sheet BCH Clearing (WTS) Balance Sheet Intercompany Clearing Balance Sheet Current Deferred Credits Deferred Revenue-BCH Balance Sheet Deferred Revenue -Other Balance Sheet Other Current Liabilities B.C. Corp. Capital Tax Payable Balance Sheet Non-Res Tax Withheld Balance Sheet Obligation under Capital Lease - Current Balance Sheet * Dismantling Costs - Fixed Assets Balance Sheet Dismantling Costs - Contra Balance Sheet BCTC F2007 Annual Report 2 August 2007 Page A-5
114 F2007 BCTC Chart of Accounts Appendix 1 Category Account Name Classification Control Acct # Acct # APPENDIX C Page 8 of 10 Refundable CIA Balance Sheet Energy Purchased Liability Balance Sheet Customer Deposits Balance Sheet Holdbacks Payable Balance Sheet Other Non-Current Liabilities Asset Retirement Obligation Liability Balance Sheet Supplemental Pension Plan Balance Sheet Post Retirement Benefit Costs Balance Sheet Vacation And RWWL Liability Balance Sheet Q/V Bank Liability Balance Sheet V/O Bank Liab Ibew Balance Sheet COPE Overtime Bank Liability Balance Sheet Sabbatical Leave Plan Liab. Balance Sheet Environmental Exposure Provision Balance Sheet Obligation under Capital Lease - Long Term Balance Sheet Long Term Debts Debenture Payable Balance Sheet Premium on Debentures Payable Balance Sheet Other Liabilities Translation Adjustment Balance Sheet Equity Capital Stock Balance Sheet Retained Earnings Balance Sheet Dividends Balance Sheet TLoB Contribution in Aid of Construction Balance Sheet TLoB CIA-Accumulatd Depreciation Balance Sheet Prior Period Adjustment Balance Sheet Tariff Revenue Network Integration Trans. Rev Profit and Loss * Firm PTP Trans Rev Profit and Loss * Non-Firm PTP Trans Rev Profit and Loss Sched, Syst Control & Dispatch Rev Profit and Loss Reactive Supply & Voltage Control Rev Profit and Loss Regulation & Frequency Response Rev Profit and Loss Energy Imbalance Rev Profit and Loss Spinning Reserve - OR Rev Profit and Loss Supplemental Reserve - OR Rev Profit and Loss Loss Compensation Trans Rev Profit and Loss Real Power Losses Rev Profit and Loss Minimum Transaction Charge Rev Profit and Loss Asset Management Maintenance Rev Profit and Loss * OATT Revenue - Deferral (BCUC) Profit and Loss BCTC OATT Revenue Clearing Profit and Loss BCH OATT Revenue Offset Profit and Loss TLoB Secondary Revenue Profit and Loss Non - Tariff Revenue GRTA Revenue Profit and Loss SDA Revenue Profit and Loss Grandfathered Wheeling Agreement Revenue (GWA) Profit and Loss NWPP Reserve Sharing Revenue Profit and Loss TLob Capital Revenue Profit and Loss BCH Other Revenue Profit and Loss BCTC F2007 Annual Report 2 August 2007 Page A-6
115 F2007 BCTC Chart of Accounts Appendix 1 Category Account Name Classification Control Acct # Acct # APPENDIX C Page 9 of 10 Non BCH Revenue Profit and Loss Billed Expense Recoveries Profit and Loss BCTC Scheduling, System Control & Dispatch Revenue Profit and Loss Asset Management Maintenance Revenue Profit and Loss Distribution Operations Revenue Profit and Loss Generation Dispatch Revenue Profit and Loss Generation Dispatch Revenue - External Profit and Loss Telecom Revenue Profit and Loss Miscellaneous Revenues Investment Income Profit and Loss Mortgage Interest Income Profit and Loss Rental Income - BCH Profit and Loss Unallocated Revenue Profit and Loss Royalty Revenue Profit and Loss Finance Charge Levied Profit and Loss Miscellaneous Income Profit and Loss Tlob Secondary Revenue Profit and Loss Cost of Service Congestions Management Expense Profit and Loss Ancillary Service Expense Profit and Loss Cost of Energy Profit and Loss OMA * OMA Taxes & Grants BC corporation tax Profit and Loss Grants Profit and Loss Property tax Profit and Loss Depreciation & Amortization Depreciation Profit and Loss Amortization expense - Power Smart Profit and Loss Amortization expense - Asset Under Capital Lease Profit and Loss Depreciation - CIA Profit and Loss Depreciation - Tenant Inducement Profit and Loss Depreciation - Asset Retirement Obligation Profit and Loss * Dismantling Costs Profit and Loss Finance Charges Bank Service Charges Profit and Loss Finance Charges - Short Term Profit and Loss Finance Charges - Long Term Profit and Loss Interest Charges - Capital Lease Profit and Loss IDC - During Construction Profit and Loss Other Business Sustaining Profit and Loss Gains/Losses on Dispositions of Fixed Assets Profit and Loss Write-off of Abandoned Projects Profit and Loss Realized Gains/Losses Profit and Loss Unrealized Gains/Losses Profit and Loss Cross Currency Rounding Profit and Loss PO Rate Variance Gain Profit and Loss Suspense Account Profit and Loss Deferrals RDA Variance Profit and Loss BCTC F2007 Annual Report 2 August 2007 Page A-7
116 F2007 BCTC Chart of Accounts Appendix 1 Category Account Name Classification Control Acct # Acct # APPENDIX C Page 10 of 10 EMEDA Variance Profit and Loss COMDA Variance Profit and Loss REDA Variance Profit and Loss Grid West Exp Variance Profit and Loss * Resource Allocation BCTC F2007 Annual Report 2 August 2007 Page A-8
117 2008 TAXES AND OTHER EXPENSES FOR THE YEAR ENDING DECEMBER 31, PROPERTY TAX EXPENSE Under the PBR, property taxes will be forecast each year for the Annual Review process. The Property Tax deferral account will collect all variances from the forecast amount included in rates. The projected 2007 property tax is expected to be lower than previous forecast by $1,009,000. Under the terms of the Settlement, forecast variances are afforded deferral treatment. For 2008, the forecast property tax is $44,635,000. Details in support of this amount can be found on Page 4 of this tab. Property taxes are levied under legislation against the Company by Provincial, Municipal and other local governments. 1% Tax The 1% tax in lieu of general municipal taxes ( 1% tax ) is calculated based on the amount of revenues collected for gas consumed within municipal boundaries multiplied by 1% (1.25% for the City of Vancouver). Payments of the 1% tax to municipalities are lagged relative to increases and decreases in revenues due to provisions in the applicable legislation and agreements budget payments are based on actual 2006 revenues, except for Vancouver which will be based on 2007 revenues. General, School and Other Property taxes include general, school and other property taxes as well as Oil and Gas Commission fees. Assessed values for land and improvements are estimated using 2007 actual assessments and applying various market adjustments. The 2008 forecast includes: A-6 Taxes and Other Expenses Page 1
118 a) An adjustment of 3% to office improvements and 0% to other improvements except for pipe. b) An adjustment of 10% to fee-owned land for offices, and 5% for all other fee lands to cover expected increases in land prices. c) An average increase of 10% to transmission pipeline, based on projected increases in labour, material and other costs. d) An increase of 5% in distribution pipelines for increased costs such as Polyethylene Pipe, Steel Pipe, Fuel, and labour. e) Net additions to distribution pipeline are estimated at $21,149,000. It is expected that Mill rates will generally decrease as a result of rising assessment values. Mill rates used in calculating taxes payable are forecast to change as follows: a) First Nations: 0.5% b) General Municipal Rate: - 1.0% c) General Vancouver Rate: -0.5% d) General Rural Rates: - 1.5% e) General University Endowment Land Rate: -15.0% f) School Rates: -1.5% g) Other Rates: -1.5% Beyond the changes mentioned above and revenue-driven changes in the 1% tax, no additional property tax increases are included. As indicated in the Application section, Terasen Gas seeks continuation of the deferral account treatment for variances in property taxes from forecast. 2. LARGE CORPORATIONS TAX (LCT) The LCT was eliminated in 2006, therefore no provision for LCT expense has been made for The LCT which was included in 2006 rates has been deferred in accordance with the terms of the PBR, and is being amortized over three years (2007 through 2009). The amortization expense for each year, 2007 and 2008, is credited $1,034,000. A-6 Taxes and Other Expenses Page 2
119 3. INCOME TAX EXPENSE Income tax expense is determined based on taxable earnings calculated on the basis of revenues and costs in accordance with the applicable provisions of the Income Tax Act, multiplied by the combined provincial and federal income tax rates. For regulatory purposes, income tax expense is calculated following the taxes payable method of accounting for income taxes. For 2007 and 2008, the corporate income tax rate is set at 33.00% and 32.50% respectively. A-6 Taxes and Other Expenses Page 3
120 TERASEN GAS Section A Tab 6 PROPERTY AND SUNDRY TAXES Page 4 FOR THE YEAR ENDING DECEMBER 31, ($000) 2008 Revised B.C.U.C. Revenue, Line Account 2007 Total Total No. Particulars Number Approved Expenses Expenses Change Reference (1) (2) (3) (4) (5) (6) (7) 1 Property Taxes % in Lieu of General Municipal Tax 14,356 $14,821 $14,821 $ General, School and Other 30,096 29,851 29,851 (245) ,452 $44,672 $44, B.C. Corporation Capital Tax Total $41,379 $44,672 $44,672 $220 - Tab A-1, Page 7 A-6 Taxes and Other Expenses Page 4
121 Section A Tab 6 INCOME TAXES / REVENUE DEFICIENCY Page 5 FOR THE YEAR ENDING DECEMBER 31, 2008 ($000s) Revised Rates----- Line 2007 Existing Revised No. Particulars APPROVED Rates Revenue Total Change Reference (1) (2) (3) (4) (5) (6) (7) 1 CALCULATION OF INCOME TAXES 2 Earned Return $182,217 $181,670 $3,793 $185,463 $3,246 - Tab A-1, Page 7 3 Deduct - Interest on Debt (109,714) (112,047) (11) (112,058) (2,344) 4 Add- Non-Tax Ded. Expense (Net) (2,290) (2,644) - (2,644) (354) - Tab A-Tab 6, Page Accounting Income After Tax 70,213 66,979 3,782 70, Add (Deduct) - Timing Differences (7,483) (14,641) - (14,641) (7,158) - Tab A-Tab 6, Page 6 8 Add - Large Corporation Tax Tab A-Tab 6, Page Taxable Income After Tax $62,730 $52,338 $3,782 $56,120 ($6,610) % % % % % Current Income Tax Rate % % % % 0.500% Taxable Income (L10 / L13) $93,626 $77,538 $5,603 $83,141 ($10,485) Income Tax - Current (L12 x L15) $30,897 $25,200 $1,821 $27,021 ($3,876) 19 - Deferred Income Tax Large Corporation Tax Tab A-Tab 6, Page Total Income Tax $30,897 $25,200 $1,821 $27,021 ($3,876) - Tab A-1, Page REVENUE DEFICIENCY 25 Earned Return $182,217 $3,793 $185,463 - Tab A-1, Page 7 26 Add - Income Taxes 30,897 1,821 27,021 - Tab A-1, Page 7 27 Deduct - Utility Income Before Taxes, - 28 Present Rates (222,723) - (206,870) - Tab A-1, Page 7 29 Corporate Capital Tax Deficiency After Corporate Capital Tax ($9,609) $5,614 $5,614 A-6 Taxes and Other Expenses Page 5
122 Section A Tab 6 NON-TAX DEDUCTIBLE EXPENSES (NET) AND TIMING DIFFERENCE ADJUSTMENTS Page 6 FOR THE YEAR ENDING DECEMBER 31, 2008 ($000s) Line 2007 No. Particulars APPROVED 2008 Change Reference (1) (2) (3) (4) (5) 1 ITEMS OF A PERMANENT NATURE INCREASING TAXABLE INCOME 2 3 Amortization of Deferred Charges ($2,725) ($3,044) ($319) - Tab A-3, Page Non-tax Deductible Expenses (35) 6 9 Total Permanent Differences ($2,290) ($2,644) ($354) - Tab A-1, Page TIMING DIFFERENCE ADJUSTMENTS Depreciation $87,496 $87,186 ($310) - Tab A-Tab 6, Page 7 14 Amortization of Debt Issue Expenses 1, (479) 15 Debt Issue Costs (1,421) (1,570) (149) 16 Capital Cost Allowance (83,019) (84,566) (1,547) - Tab A-Tab 6, Page 8 17 Cumulative Eligible Capital Allowance (1,057) (1,148) (91) 18 Long Term Compensation 1, (944) 19 Unfunded Pension (1,814) (4,026) (2,212) 20 Overheads Capitalized Expensed for Tax Purposes (10,326) (10,294) Discounts on Debt Issue and Other (323) (1,782) (1,459) 22 Timing Differences (7,483) (14,641) (7,158) Total Timing Differences ($7,483) ($14,641) ($7,158) - Tab A-1, Page 8 A-6 Taxes and Other Expenses Page 6
123 Section A Tab 6 DEPRECIATION AND AMORTIZATION EXPENSES Page 7 FOR THE YEAR ENDING DECEMBER 31, 2008 ($000s) Line 2007 No. Particulars APPROVED 2008 Change Reference (1) (2) (3) (4) (5) 1 Depreciation Provision 2 3 Total Depreciation Expense $92,254 $93,668 $1,414 - Tab A-3, Page Less: Amortization of Contributions in Aid of Construction (4,758) (6,482) (1,724) - Tab A-3, Page ,496 87,186 ($310) 7 8 Amortization Expense 9 10 Amortization of Deferred Charges ($2,725) ($3,044) ($319) - Tab A-3, Page (2,725) (3,044) (319) TOTAL $84,771 84,142 ($629) - Tab A-1, Page 7 A-6 Taxes and Other Expenses Page 7
124 Section A Tab 6 CAPITAL COST ALLOWANCE Page 8 FOR THE YEAR ENDING DECEMBER 31, 2008 ($000s) Line CCA Rate 12/31/ Net /31/2008 No. Class % UCC Balance Adjustments Additions CCA UCC Balance (1) (2) (3) (4) (6) (7) (8) 1 1 4% $1,369,846 $17,912 $88,875 ($57,288) $1,419, % 185, (11,148) 174, % 3, (157) 2, % 254 (1) - (25) % 70 (70) % 20,793 (146) 4,619 (4,591) 20, % % 5,592 (3) 60 (1,686) 3, % , (943) 6, (2) % (21) % % (8) % 1 (1) % 12,014 (203) 8,398 (7,205) 13, % 13, ,433 (1,492) 21, Total $1,618,049 $18,445 $111,154 ($84,566) $1,663,084 A-6 Taxes and Other Expenses Page 8
125 Section A Tab 6 CALCULATION OF LARGE CORPORATION TAX Page 9 FOR THE YEAR ENDING DECEMBER 31, 2008 ($000s) 2008 Line 2007 Existing Revised No. Particulars Reference Approved Rates Rates Change (1) (2) (3) (4) (5) (6) 1 Large Corporation Tax 2 3 Utility Capital (Line 26) $2,492,518 $2,523,931 $2,524,294 $31,776 4 Add: Security Deposits 2,796 3,474 3, Long Term Construction Advances Deferred Income Tax (242) 7 Work in Progress Attracting AFUDC 42,130 21,889 21,889 (20,241) 8 Sub-total 2,538,058 2,550,119 2,550,482 12, Utility Portion of $50,000,000 or $0 Deduction 11 (Line 38 x $50,000,000 or $0) (47,885) (47,910) (47,910) (25) Taxable Capital $2,490,173 $2,502,209 $2,502,572 $12, Large Corporation Tax Rate 0.000% 0.000% 0.000% 0.000% Large Corporation Tax $0 $0 $0 $0 18 Less: Surtax 0.00% Large Corporation Tax $0 $0 $0 $ Net Plant in Service, Ending - Tab A-1, Page 6 $2,371,801 $2,436,692 $2,436,692 $64, All Other Rate Base Items - Lines of - Tab A-1, Page 6 120,717 87,239 87,602 (33,115) Utility Capital 2,492,518 2,523,931 2,524,294 31, Non-Rate Base Items 29 Net Book Value of Lower Mainland Premium 97,670 97,670 97, Disallowed Plant Costs 1,890 1,990 1, Plant Held for Future Use Fort Nelson Division 4,303 4,303 4, Squamish Gas Co. Ltd. 6,050 6,200 6, Total Capital $2,602,486 $2,634,149 $2,634,512 $32, Proportion of Utility Capital to Total Capital 95.77% 95.82% 95.82% 0.05% A-6 Taxes and Other Expenses Page 9
126 2008 RETURN ON CAPITAL FOR THE YEAR ENDING DECEMBER 31, 2008 Under the terms of the Extension of the PBR Settlement the short term interest rate and new long term issues will be updated each fall for the Annual Review process. The interest deferral account will collect short term rate variances and all variances with respect to long term issues. Long-Term Debt Total long-term debt of $1,373.9 million is entirely TGI related. Medium-term notes Series 13 and Series 20 totaling $250 million are set to mature in October, A $250 million 30-year debt issue with a coupon rate of 6.0% was settled on October 2, The following issues will mature in 2008: 2005 Long Term Debt Issue Coastal Facilities; January 1, 2008; $50.3 million;* Medium Term Note - Series 9; June 2, 2008; $55.0 million; Medium Term Note Series 9 Reopened; June 2, 2008; $58.0 million; and Medium Term Note Series 9 Reopened; June 2, 2008; $75.0 million. The total debt maturing in 2008 is $238.3 million. A $200.0 million 30 year debt issue with a forecast rate of 5.95% is planned for June 1, * Refinanced through unfunded debt. Unfunded Debt The unfunded debt rate for 2008 is set at 5.00% based on the current outlook for short-term rates in the year. The total unfunded debt for 2008 is forecast at $253.4 million. A-7 Return on Capital Page 1
127 Common Equity The revenue requirement information included is based on the allowed 2007 return on equity ( ROE ) of 8.37%. The common equity component of TGI will be 35.01% for The 2008 rates for TGI will be adjusted from those in these Annual Review materials to take into account the Commission s determination of the allowed ROE for the low risk benchmark utility, which determination is expected some time in late November A-7 Return on Capital Page 2
128 Section A Tab 7 EMBEDDED COST OF LONG-TERM DEBT Page 2 FOR THE YEAR ENDING DECEMBER 31, 2008 ($000s) Principal Net Effective Average Line Issue Maturity Coupon Amount of Issue Proceeds of Interest Principal Annual No. Particulars Date Date Rate Issue Expense Issue Cost Outstanding Cost (1) (2) (3) (4) (5) (6) (7) (8) (9) (10) 1 Series A Purchase Money Mortgage 3-Dec Sep % $58,943 $855 $58, % $58,943 $7,105 2 Series B Purchase Money Mortgage 30-Nov Nov % 157,274 2, , % 157,274 16, Long Term Debt Issue - Coastal Facilities 1-Jan Jan % 50, , % Medium Term Note - Series 9 21-Oct Jun % 55, , % 22,992 1,450 7 Med.Term Note - Series 9 (Re-opened) 19-Nov Jun % 58, , % 24,246 1,463 8 Med.Term Note - Series 9 (Re-opening) 21-Sep Jun % 75,000 2,053 72, % 31,352 2, Medium Term Note - Series Sep Sep % 150,000 2, , % 150,000 10, Long Term Debt Issue - Series Apr May % 150,000 1, , % 150,000 9, Long Term Debt Issue - Series Feb Feb % 150,000 1, , % 150,000 8, Long Term Debt Issue - Series Sep Sep % 120, , % 120,000 6, Medium Term Debt Issue - Series Oct Oct % 250,000 2, , % 250,000 15, Medium Term Debt Issue - Series 23 1-Jun Jun % 200,000 2, , % 116,940 7, LILO Obligations - Kelowna 5.953% 28,747 1, LILO Obligations - Nelson 7.093% 4, LILO Obligations - Vernon 8.108% 13,660 1, LILO Obligations - Prince George 7.089% 34,914 2, LILO Obligations - Creston 6.348% 3, $1,316,926 $93, Debentures: 25 Series E 8-Jun Jun % 59, , % $59,890 $6, $59,890 $6, Sub-Total $1,376,816 $99, Less - Fort Nelson Division Portion of Long Term Debt (2,935) (212) 31 Total $1,373,881 $99, Average Embedded Cost 7.231% A-7 Return on Capital Page 3
129 2007 PROJECTIONS Terasen Gas is projecting a 2007 return on common equity before earnings sharing of %, or 1.953% higher than the authorized return of 8.370%. This is due to capital productivity improvements, and operating productivity improvements made possible by the integration activities of the Company with TGVI which were facilitated by the performance based rate regulation (PBR) settlement. Under the PBR, which includes an earnings sharing mechanism, Terasen Gas is to share pre-tax earnings variances between authorized level of earnings as determined annually under the settlement and the actual earnings of the utility on a 50:50 basis with its customers. Return on common equity after earnings sharing is 9.54%. Accordingly, the customers portion of the 2007 incentive earnings surplus is projected to be $12.6 million on a pre-tax basis. Details in support of this calculation can be found on Page 6 of this Tab. Terasen Gas proposes to distribute $15.0 million to customers, representing the projected 2007 earnings surplus sharing plus a true up of prior year s earnings sharing, in 2008 via a rider. A Projections Page 1
130 Section A UTILITY RATE BASE Tab 8 SCHEDULE II Page 2 ($000) Line Approved Year Ended 12/31/2007 No. Description 2007 Actual Normalization Normal Difference Reference (1) (2) (3) (4) (5) (6) (7) 1 Plant in service, Beginning $3,140,710 $3,067,390 $0 $3,067,390 ($73,320) 2 CPCN's 8,137 10, ,846 2, Additions/Transfers 129, , ,485 (17,232) 5 Disposals/Retirements (32,918) (32,944) 0 (32,944) (26) 6 Plant in service, Ending $3,245,646 $3,157,777 $0 $3,157,777 ($87,869) 7 8 Add - Intangible plant 1,614 1, , $3,247,260 $3,159,391 $0 $3,159,391 ($87,869) Contributions in aid of construction (131,162) (153,619) 0 (153,619) (22,457) Less - Accumulated depreciation / amortization (744,297) (678,209) 0 (678,209) 66, Net plant in service, Ending $2,371,801 $2,327,563 $0 $2,327,563 ($44,239) Net plant in service, Beginning $2,339,687 $2,300,196 $0 $2,300,196 ($39,491) Net plant in service, Mid-year $2,355,744 $2,313,879 $0 $2,313,879 ($41,865) 20 Adjustment to 13-month average 0 2, ,298 2, Work in progress, no AFUDC 10,771 8, ,772 (1,999) 22 Sub-total 2,366,515 2,324, ,324,949 (41,566) Construction advances (11) (607) 0 (607) (596) 25 Unamortized deferred charges (8,222) (16,213) 0 (16,213) (7,991) 26 Cash working capital (25,197) (28,387) 0 (28,387) (3,190) 27 Other working capital 143, , ,293 3, Deferred income tax, mid-year (606) (606) 0 (606) 0 29 LILO Benefit (2,243) (2,146) 0 (2,146) Utility rate base $2,474,218 $2,424,283 $0 $2,424,283 ($49,935) A Projections Page 2
131 UTILITY INCOME AND EARNED RETURN Section A ($000) Tab 8 Page 3 Line Approved Year Ended 12/31/2007 No. Description 2007 Actual Normalization Normal Difference Reference (1) (2) (3) (4) (5) (6) (7) 1 ENERGY VOLUMES (TJ) 2 Sales 116, ,057 $0 $118,057 1,281 3 Transportation 95,397 99, ,414 4,017 4 Total 212, ,471 $0 $217,471 5, Average Rate per GJ 7 Sales $ $ $0.000 $ $ Transportation $0.775 $0.736 $0.000 $0.736 ($0.039) 9 Average $6.860 $6.955 $0.000 $6.955 $ UTILITY REVENUE 12 Sales - Present Rates $1,390,101 $1,439,339 $0 $1,439,339 $49, Increase / (Decrease) (8,416) , Transportation - Present Rates 75,080 73, ,157 (1,923) 15 - Increase / (Decrease) (1,193) , Total Revenue 1,455,572 1,512, ,512,496 56, Cost of Gas Sold (Including Gas Lost) 966,880 1,022, ,022,974 56, Gross Margin 488, , , RSAM Revenue 0 (3,053) 0 (3,053) (3,053) 21 Adjusted Gross Margin 488, , ,469 (2,223) Operation & Maintenance 169, , ,413 (14,859) 24 Vehicle Leases 1,993 1, ,881 (112) 25 Property Tax 44,452 44, , Depreciation and Amortization 84,771 75, ,154 (9,617) 27 Other Operating Revenue (24,910) (22,617) 0 (22,617) 2, , , ,283 (22,295) 29 Utility Income before Income Taxes 213, , ,186 20, Income Taxes 30,905 37, ,375 6,470 - Tab A-8, Page 4 31 EARNED RETURN $182,209 $195,811 $0 $195,811 $13, UTILITY RATE BASE $2,474,218 $2,424,283 $0 $2,424,283 ($49,935) - Tab A-8 Page RETURN ON RATE BASE 7.364% 8.077% 0.000% 8.077% 0.713% A Projections Page 3
132 Section A INCOME TAXES Tab 8 SCHEDULE III Page 4 ($000) Line Approved Year Ended 12/31/2007 No. Description 2007 Actual Normalization Normal Difference Reference (1) (2) (3) (4) (5) (6) (7) 1 CALCULATION OF INCOME TAXES 2 Earned Return $182,209 $195,811 $0 $195,811 $13,602 3 Deduct - Interest on Debt (109,689) (108,173) 0 (108,173) $1,516 4 Add - Non-Tax Deductible Expense (Net) (2,290) (2,324) 0 (2,324) (34) 5 6 Accounting Income After Tax $70,230 $85,314 $0 $85,314 $15,084 7 Deduct: Timing Differences (7,483) (13,151) 0 (13,151) (5,668) 8 Add: Large Corporation Tax Taxable Income After Tax $62,748 $72,163 $0 $72,163 $9, Income Tax Rate (Current Tax) % % % 1.120% Current Income Tax Rate % % 0.000% % % Taxable Income Before Income Tax $93,653 $109,537 $0 $109,537 $15, Add - Amount Required to Provide for 17 Deferred Income Tax Taxable Income $93,653 $109,537 $0 $109,537 $15, Income Tax 22 Current $30,905 $37,374 $0 $37,374 $6, Deferred Income Tax Large Corporation Tax Total $30,905 $37,374 $0 $37,374 $6,469 - Tab A-8, Page 3 A Projections Page 4
133 Section A RETURN ON CAPITAL Tab 8 SCHEDULE IV Page 5 ($000) Line Approved Year Ended 12/31/2007 No. Description 2007 Actual Normalization Normal Difference Reference (1) (2) (3) (4) (5) (6) (7) 1 Unfunded debt $137,943 $105,490 $0 $105,490 ($32,453) 2 proportion 5.58% 4.35% 0.00% 4.35% -1.23% 3 rate of return 4.750% 4.750% 0.000% 4.750% 0.000% 4 return component 0.27% 0.21% 0.00% 0.21% -0.07% 5 6 Long term debt $1,470,051 $1,470,051 $0 $1,470,051 $0 7 proportion 59.41% 60.64% 0.00% 60.64% 1.23% 8 rate of return 7.018% 7.018% 0.000% 7.018% 0.000% 9 return component 4.17% 4.26% 0.00% 4.26% 0.08% Preference shares $0 $0 $0 $0 $0 12 proportion 0.00% 0.00% 0.00% 0.00% 0.00% 13 rate of return 0.000% 0.000% 0.000% 0.000% 0.000% 14 return component 0.00% 0.00% 0.00% 0.00% 0.00% Common equity $866,224 $848,742 $0 $848,742 ($17,482) 17 proportion 35.01% 35.01% 0.00% 35.01% 0.00% 18 rate of return 8.370% % 0.000% % 1.953% 19 return component 2.93% 3.61% 0.00% 3.61% 0.68% $2,474,218 $2,424,283 $0 $2,424,283 ($49,935) Return on rate base 7.364% 8.077% 0.000% 8.077% 0.713% - Tab A-8, Page Utility rate base $2,474,218 $2,424,283 $0 $2,424,283 ($49,935) - Tab A-8, Page 2 A Projections Page 5
134 Section A EARNINGS SHARING CALCULATION Tab 8 ($000) Page 6 Line Year Ended 12/31/2007 No. Description Actual Reference (1) (2) (3) 1 Utility rate base $2,424,283 - Tab A-8, Page Common Equity Component 35.01% 848,742 - Tab A-8, Page Achieved ROE on Common Equity % - Tab A-8, Page Authorized ROE on Common Equity 8.370% - Tab A-8, Page ROE Surplus / (Deficit) 1.953% After Tax Surplus Available for Sharing $16, Customers' 50% Share of Surplus (net-of-tax) $8, Customers' 50% Share of Surplus (pre-tax) $12,580 A Projections Page 6
135 FIVE YEAR MAJOR CAPITAL PLAN 1.0 INTRODUCTION This section constitutes Terasen Gas Five Year Major Capital Plan for the forecast period 2008 through In addition to this information, Terasen Gas has also included its capital expenditure forecasts and year end projections for Terasen Gas has segmented its Capital Plans as follows: Regular Capital Plan Customer Driven Capital, and Non-Customer Driven Capital. Major Capital Plan Capital Projects that do not require a Certificate of Public Convenience and Necessity ( CPCN ), Approved CPCN Capital Projects, and Anticipated CPCN Capital Projects. Regular Capital includes forecast Capital Expenditures for non-cpcn projects. These expenditures have been categorized into either customer driven capital or non-customer driven capital. Regular Capital excludes Capitalized Overheads, Contributions In Aid of Construction ( CIAC ), and Allowance for Funds Used During Construction ( AFUDC ). Major Capital projects are defined as those discrete projects that are in excess of $1 million (excluding AFUDC). These forecast expenditures have been categorized into projects which do not require a CPCN and those which do require a CPCN to proceed. As outlined on page 5 of Appendix A to Order No. G approving a two year extension of the Multi-Year Performance-Based Rate Plan, CPCN expenditures are excluded from the capital formula. Except in very unusual circumstances, CPCNs will not be filed for projects below $5 million. As such, all projects that are expected to have capital costs in excess of $5 million have been included as prospective CPCN s. 1.1 Five Year Regular Capital Plan The following table identifies the cost forecasts for regular capital expenditures in the current year, 2007 and 2008 to For the purposes of this Five Year Capital Plan, Regular Capital has categorized capital expenditures as follows: B-1 Five Year Major Capital Plan Page 1
136 Capital Additions Customer Driven Capital Mains Services Meters for New Customer Additions Other Regular Capital Meter Replacements Transmission Plant Distribution Plant IT Capital Non-IT Capital Table 1 includes a comparison of the 2007 Forecast versus Projection for 2007 as well as capital expenditure forecasts for the period 2008 to Table 1 - Forecast of Regular Capital Expenditure Targets ( ) Forecast Projection Forecast Forecast Forecast Forecast Forecast Forecasted Year End Customer Additions 13,160 13,129 11,797 11,346 11,148 11,047 11,048 Customer Driven Capital Mains 7,728 8,972 9,527 9,437 9,551 9,749 10,043 Services 15,552 17,871 19,443 19,260 19,492 19,896 20,496 Meters (Customer Additions) 4,172 4,140 3,834 3,798 3,844 3,924 4,042 27,452 30,983 32,804 32,496 32,888 33,569 34,581 Other Regular Capital Replacement Customer Meters (Allocation) 12,327 11,089 13,392 17,231 21,082 25,414 27,310 Transmission Plant 6,401 4,912 11,652 4,841 5,063 5,164 5,267 Distribution Plant 8,806 10,224 9,174 7,793 7,814 8,058 8,270 IT 12,742 5,255 10,736 11,038 11,246 11,471 11,471 Non-IT 11,946 12,036 12,301 12,450 12,699 12,953 13,212 52,222 43,517 57,255 53,352 57,904 63,060 65,530 Total Regular Capital 79,674 74,500 90,059 85,848 90,791 96, ,111 Figures exclude AFUDC and Capitalized Overheads. 1.2 Comparison of 2007 Forecast vs Projection When compared with the figures presented in the 2006 Five Year Capital Plan, Total Regular Capital, the year-end forecast for 2007 is lower by 6.5%. Below is an explanation of the primary driver(s) of forecast differences. Current net customer addition forecasts for Terasen Gas can be found in Table 1 above. When compared with the forecasts presented in the 2006 Five Year Capital Plan, Customer Driven Capital is forecast to be approximately $3.5 million higher for These increases are B-1 Five Year Major Capital Plan Page 2
137 attributable to Mains and Service installation expenses. Installation contracts re-tendered in mid-2006 have resulted in installation price increases for New Mains, the majority of which are installed by external contractors. Contractor paving costs have also increased due to increases in material costs. New Service installations, which are installed by contractor and Terasen crews, have also been impacted by the installation contractor pricing changes and paving cost increases. Additionally, in the lower mainland, crew sizes have been temporarily increased from three to four as part of a succession planning initiative. Once employees are trained and others have retired, crew complements will return to normal. For 2007, total expenditures for Other Regular Capital are expected to be approximately $8.7 million lower than anticipated in the 2006 Five Year Capital Plan. This difference is mainly due to the following factors: 1) IT costs are currently projected to be $7.5 million lower than previous year s forecast. This decrease is attributed to the following two items: With the sale of Terasen Inc to Fortis and the subsequent transition efforts, the Commission's approval of the Distribution Mobile Solution and other business priorities, Terasen had to review and re-prioritize its initial 2007 IT budget with the view of what could be undertaken and implemented successfully. Based on that review, it was decided to scale back and/or defer some initiatives in order to maintain the balance between business operation and new projects. Some of the initiatives that were scaled back were the annual hardware refresh programs (i.e. Network, Server, Desktop, Printer) and the SAP and Order Fulfilment and other SAP enhancement projects. Other projects that were deferred to 2008 were the SAP Upgrade project, the Recorded Information Management project for Distribution and Transmission and various system improvement initiatives. The total impact to the 2007 budget was a reduction in anticipated spend across the Terasen Gas companies of just over $4.0 million. $3.6 million was initially budgeted for the Distribution Mobile Solution Project but additional functionality was required to ensure efficiency and effective performance. This project later became a CPCN approved by the Commission on July 2, 2007 in Order No. C ) The forecast for Replacement Meters is expected to be $1.2 million less in 2007 than originally anticipated due to a lower number of required meter recalls. B-1 Five Year Major Capital Plan Page 3
138 3) Transmission Plant ( TP ) expenditures are currently projected to be $1.5 million less than previously forecast. This reduction is attributed to the reallocation of TP Laterals. This item was previously identified as a Transmission Plant cost that should have been allocated to Distribution Plant. The cost reallocation results in a $1.5 million decrease to Transmission Plant expenditures and an equal offsetting increase to the 2007 Distribution Plant expenditure forecast. 4) Non-IT expenditures are currently projected to be $0.09 million higher than the previous forecast. This increase was attributed to an unanticipated $0.8 million land rights payment for Ashcroft TP Lateral. However, this variance was significantly offset by approximately $0.7 million in projects not proceeding as planned. 2. Five Year Major Capital Plan 2.1 Major Capital Projects that do not require a CPCN Table 2 identifies the forecast of costs for major capital projects not subject to CPCN applications for the current year and the forecast period In the table below, Transmission and Distribution projects are differentiated as either capacity shortfall projects required to maintain minimum gas system pressures in the respective gas systems or as system modification projects. IT projects are categorized as either upgrades/enhancements, replacements, or new applications. Table 2 Forecast of Major Capital Projects not requiring a CPCN ( ) Project Project Description Category YEF Forecast Forecast Forecast Forecast Forecast Transmission Plant SCP Code Compliance Upgrades Upgrade/Enhancement 3,500 LNG Coldbox Upgrade Upgrade/Enhancement 1,334 2,785 Scada Upgrade Upgrade/Enhancement 100 1,500 Kootney River Crossing Upgrade/Enhancement 1, Columbia River Crossing Upgrade/Enhancement 1, Distribution Plant SI m x 323mm STL IP Riverside Capacity Shortfall 1,192 SI m x 323mm STL IP 72nd St Capacity Shortfall 1,800 SI m x 323mm STL IP 36th Ave Capacity Shortfall 1,211 IT SAP Upgrade Upgrade/Enhancement 2,700 Asset Data Integration Upgrade/Enhancement 246 1,350 Non-IT No Projects Identified 1,580 13,935 3, ,011 B-1 Five Year Major Capital Plan Page 4
139 2.1.1 Transmission Plant - SCP Code Compliance Upgrades The Southern Crossing Pipeline ( SCP ) is a key transmission pipeline supplying natural gas to the Interior and through to the Lower Mainland regions of British Columbia. The pipeline was constructed and put in service in December Since construction of the pipeline, the population density and class location near Oliver has increased from the original design value. The resulting difference has resulted in the lowering of the allowable operating pressure. This upgrade to the pipeline will restore the original operating pressure. This project cost is estimated to be $3.5 million and will commence in Transmission Plant LNG Coldbox Upgrade The Liquefied Natural Gas ( LNG ) Coldbox is part of the plant component at the Terasen Gas Tilbury LNG Facility. The LNG Coldbox is the plant component that reduces gas temperature to -162 Celsius, thereby converting natural gas into LNG. The existing plant was built in The LNG Coldbox consists of a number of very complex shell and tube, spiral-wound heat exchanges. A number of the tubes in one heat exchanger failed in early Repairs were successful but very challenging. A materials engineering investigation was completed as to cause and likelihood of additional failures in future. This report stated that further tube failures will occur. A tube failure in the Coldbox will result in Terasen Gas not being able to produce LNG, Terasen Gas plans to spend approximately $4.2 million (excluding AFUDC) for replacement of this plant. Preliminary work commenced in 2006 and the project is expected to be completed in Transmission Plant - SCADA System Upgrade The SCADA system operates, controls, and monitors Terasen Gas transmission and compression facilities in British Columbia. Timely vendor support of the current version (6.0) of the SCADA application may be at risk as knowledge support diminishes with vendor support staff attrition. Preliminary studies are expected to commence in 2008 with an upgrade to the next supported version to be in service in The total estimated cost of this project is $1.6 million (excluding AFUDC). B-1 Five Year Major Capital Plan Page 5
140 2.1.4 Transmission Plant - Kootenay River (near Shoreacres) Crossings The aerial crossing of the Kootenay River on the Savona Nelson Mainline between Castlegar and Nelson has been identified as requiring extensive rehabilitation. This structure was constructed in 1957 and has extensive cable and support corrosion. This structure is in need of repair or replacement in order to ensure continued gas service to Nelson. A horizontal directional drill ( HDD ) is also being considered as the prime alternative to an aerial crossing. Preliminary investigations were conducted in Preliminary project design is expected to be completed by the end of 2007 with construction to commence in 2008 with completion expected in Preliminary cost estimates are approximately $2 million (excluding AFUDC) Transmission Plant - Columbia River Crossing near Brilliant Due to extensive cable and pipe corrosion, rehabilitation is required at the Columbia River on the Savona Nelson Mainline aerial crossing between Castlegar and Nelson near Brilliant. This structure was constructed in 1957 and must be repaired or replaced to avoid any gas service disruptions to Nelson. As an alternative to an aerial crossing, HDD has been considered at this location. Preliminary investigations are currently being performed and preliminary project designs are expected by the end of the current year. The estimated cost of this project is $2 million (excluding AFUDC) and completion anticipated in Distribution Plant Riverside IP, Abbotsford This project consists of a 1.6 km loop of NPS 12 (323mm OD) pipeline operating at 275 psig (1,900 kpa). The estimated cost of this project is $1.2 million (excluding AFUDC). This project is currently planned to be constructed and in service in This system improvement is required to restore capacity in the King Intermediate Pressure ( IP ) system feeding Abbotsford and Mission to ensure that tail end pressures remain above minimum acceptable levels. The capacity of the King IP system has been eroded over time by load growth in Abbotsford and to a lesser extent in Mission Distribution Plant 72 nd Street IP, Delta This project is currently planned to be constructed in It consists of a 2.6 km loop of 323mm O.D. pipeline operating at 1,200 kpa. The estimated cost of this project is $1.8 million (excluding AFUDC) and is expected to be in service in B-1 Five Year Major Capital Plan Page 6
141 This system improvement is required to accommodate load growth to greenhouses in the Delta area. This system improvement will only be installed if the affected greenhouses convert some, or all, of their interruptible load to firm load. With this loop installed greenhouses would not need to be curtailed until colder ambient temperatures are reached Distribution Plant 36 th Avenue IP, Delta This project is currently planned to be constructed in It consists of a 1.75 km loop of 323mm O.D. pipeline operating at 1,200 kpa. The estimated cost of this project is $1.2 million (excluding AFUDC) and is expected to be in service in This system improvement is required to increase capacity to offset aggressive long term load growth projections that have been provided by the greenhouses in the Delta area. This system improvement will only be installed if the affected greenhouses convert some, or all, of their interruptible load to firm load Transmission & Distribution Plant - Gateway Project The Gateway Program was established by the Province of British Columbia in response to the impact of growing regional congestion, and to improve the movement of people, goods and transit throughout Greater Vancouver. The Gateway Program is sponsored by the Ministry of Transportation ( MoT ) and includes three components: Port Mann / Highway 1 Project This includes twinning the Port Mann Bridge, upgrading interchanges and improving access and safety on Highway 1 from Vancouver to Langley. The South Fraser Perimeter Road Project is a proposed new four-lane, 80 km/h route along the south side of the Fraser River extending from Deltaport Way in southwest Delta to the planned Golden Ears Bridge connector road in Surrey/Langley. The North Fraser Perimeter Road Project is a proposed set of improvements on existing roads to provide an efficient, continuous route from New Westminster to Maple Ridge. B-1 Five Year Major Capital Plan Page 7
142 The highway projects and segments are in various stages of planning, design and construction. The planned highway construction and upgrades will impact the Terasen Gas Transmission and Distribution systems along the highway corridors. Since 2006, the MoT and Terasen Gas have been involved in ongoing discussions regarding this project and as a result Terasen Gas has conducted conceptual and preliminary investigations into system modifications that will be required. Based upon the current plans and available information, Terasen Gas projects that total system modifications will cost approximately $26 million (excluding AFUDC). Terasen Gas has been in discussions with MoT with respect to the cost recovery principles and is hopeful that an agreement will be reached that will allow for maximum recovery of costs IT Capital SAP Core Application Upgrade SAP is the enterprise application that supports business processes including: Operations and Maintenance; Order Fulfilment; Meter Management and Supply Chain. It also supports back-office functions such as: Payroll; Finance and Performance Reporting. Vendor support of the current version of the SAP application (R3 v4.6c) expired in the fourth quarter of An upgrade to the next supported version is therefore required. Terasen Gas has negotiated an extension to the support agreement for 2007 and will renegotiate a further extension to mid-year 2009 or the completion of the upgrade project - whichever comes first. The start of the upgrade project is expected in late 2008 with an anticipated go-live date in mid The cost is anticipated to be in the range of $2.5 (pure technical upgrade) to $4.8 million, dependent on the number of enhancements that would be included in the project. The driver for the enhancements will be business priorities to be determined prior to the start of the upgrade project IT Capital Asset Integrity Integration Project The System Integrity department s mission of providing risk based management services depends heavily on having access to the most current and complete pipeline condition data on which to base its analysis. This pipeline asset and condition data is currently maintained in multiple exclusive databases, digital files, or paper reports, with no current means of automated integration, causing numerous challenges in providing integrity management services. Manual alignment of data from these sources for analysis is difficult and time consuming. B-1 Five Year Major Capital Plan Page 8
143 This project will increase integration and continuity within the existing data environment that would allow compliance with the requirements of Z662 Code Annex N (Guidelines for Pipeline Integrity Management Programs) which has recently been adopted by the Oil and Gas Commission of BC ( OGC ), the technical regulator for the Terasen Gas pipeline assets operating at pressures greater than 700kPag, as the standard to which operating companies shall develop their Integrity Management Plans ( IMP ). In addition to helping the Company meet compliance objectives, this project will: Create an automated method to integrate and spatially align pipeline asset integrity data. Introduce new tools to determine and analyze risks to the pipeline and surroundings, as caused by current and forecasted conditions. Introduce new tools to evaluate various options to reduce the risk to levels considered to be not significant. Ensure future capability to integrate distribution data is not compromised. This estimated cost of this project is $1.6 million (excluding AFUDC) and expected to be completed in Major Capital Projects that require a CPCN Table 3 identifies the forecast of costs for major capital projects subject to CPCN applications for 2007 to Table 3 Forecast of Major Capital Projects subject to CPCN Applications ( ) Project Description Projection Forecast Forecast Forecast Forecast Forecast Approved CPCN's & Deferral Accounts Vancouver LP Replacement 9,836 6,358 Residential Unbundling 8,639 3, Distribution Mobile Solution Project 2,499 2,891 20,974 12, Anticipated CPCN's & Deferral Accounts Fraser River SBSA Rehabilitation 750 1,500 7, ,500 7, Total CPCN's & Deferrals 21,724 13,749 7, B-1 Five Year Major Capital Plan Page 9
144 2.2.1 Approved CPCN Vancouver LP System Replacement Approximately 95km of Low Pressure ( LP ) mains are still in service in densely populated and established areas of Vancouver. The LP system serves approximately 7,100 customers including: commercial establishments; residences; schools and hospitals. It is planned to replace the steel/iron LP system with a polyethylene system, operating at Distribution Pressure of 420 kpa (60 psig), over a 3 year period commencing in 2006 with completion in late In May 2006, Terasen Gas submitted a CPCN Application to complete this work. In its application, Terasen Gas projected that it would cost approximately $23.1 million (excluding AFUDC) to complete the 3 year replacement program. Current forecasts indicate that this project will be on target for costs and completion date. This CPCN application was approved by the Commission on June 26, 2006 by Order No. C Approved CPCN - Residential Unbundling Program Since the release of the BC Energy Policy in 2002, Policy Action #19 stating that "Natural gas marketers will be allowed to sell directly to small volume customers", Terasen Gas has been facilitating providing commodity choice for small volume customers. The Commercial Commodity Unbundling program was launched in November 2004 with Residential Commodity Unbundling commencing in November, With direction from the Commission, Terasen Gas completed a detailed design review and cost estimate using external consultants as part of its Pre-Scoping and Scoping Phases for Residential Unbundling between July 2005 and March To complete this work, the Commission approved $1.4 million in funding in 2005 to be recorded in a deferral account. On April, 2006, Terasen Gas submitted an application to enhance its business processes and systems as required to support the provision of commodity choice to residential customers in the Terasen Gas service area. In its application it specifically requested the following: Implement Commodity Unbundling for all residential customers in its service territory, excluding Fort Nelson and Revelstoke, effective November 1, B-1 Five Year Major Capital Plan Page 10
145 Capital Expenditures of $11.1 million (in addition to the $1.4 million approved for the pre-scoping and scoping phases), for the two year 2006 and 2007 to implement the Residential Unbundling program. On August 14, 2006 the Commission issued Order No. C-6-06 approving $12.5 million towards the implementation phase costs in 2006 and 2007 and $3.6 million towards the ongoing program costs after Terasen Gas anticipates filing an application in late 2007 to deal with the establishment of the Residential Commodity Unbundling Cost Recovery Rider and the resetting of the Commercial Commodity Unbundling Cost Recovery Rider. Projected and Forecast costs are as follows: TERASEN GAS INC Residential Unbundling Project - Customer Choice Program Implementation Project Cost Update Actual Costs Forecast Costs >> to Sept 07 Total Oct Nov Dec Total Total Approved Variance Actual & Committed Costs 9,932,160 Planned Costs 9,933, , , ,845 11,100,000 11,105,750 (5,750) Variance (1,029) Project Management 190,395 3,837 10,500 11, , ,000 (546,918) System & Process Changes 4,858, ,858,918 4,842,750 16,168 Finance Process Changes 388,840 76, , , , , ,000 Customer Education 4,494, , , ,676 5,000,000 5,000,000 0 Total 9,932, , , ,210 10,825,000 11,105,750 (280,750) Approved CPCN Distribution Mobile Solution Project The current MobileUP application is used for the Mobile Data Dispatch of customer service activities and the transfer of customer meter and billing information to the Energy Customer Information System. The existing system has reached the end of its useful life and there is significant risk that the current system will fail due to aging technology components. The implementation of the Distribution Mobile Solution provides a new platform for coordinating scheduling and dispatching. The conversion will align customer service activities with construction activities. The Commission issued Order C-5-07 approving the CPCN on July 2, The estimated cost of this project is $5.98 million (excluding AFUDC) and it is expected to be complete by August 31, B-1 Five Year Major Capital Plan Page 11
146 2.2.4 Anticipated CPCN Fraser River South Bank South Arm ( SBSA ) Crossing In 2006 an engineering assessment of the current 20 and 24 underwater Transmission pipeline crossings of the South Arm of the Fraser River serving Vancouver and Richmond was completed. The engineering assessment provided an opinion indicating that both the underwater crossings and the adjacent south bank require extensive rehabilitation to ensure they do not pose a risk in the event of a seismic occurrence. Terasen Gas has recently received a second opinion on the matter, which confirms that rehabilitation work is necessary. Terasen Gas anticipates that it will file a CPCN application for this project sometime early 2008 targetting an expected completion date of the project in Project costs are currently estimated to be $9.75 million (excluding AFUDC). B-1 Five Year Major Capital Plan Page 12
147 SERVICE QUALITY ASSURANCE MECHANISM 1 INTRODUCTION In 2007 the Commission approved the Extension of the PBR Settlement that Terasen Gas negotiated with its stakeholders. The agreement includes a commitment to maintaining specified levels of service as measured by Service Quality Indicators ( SQIs ). Terasen Gas has ten SQIs that are measured and compared against benchmarks on an annual basis. Additionally, there are two directional indicators that do not have benchmarks but are designed to give an understanding of trends that may develop in these particular areas relating to customer service. 2 COMPONENTS OF THE SERVICE QUALITY ASSURANCE MECHANISM The Service Quality Assurance Mechanism includes four components: 1. A set of ten SQIs; 2. Benchmarks for each indicator, where applicable; 3. Two directional indicators; and 4. A process for reviewing Terasen Gas performance. 2.1 Service Quality Indicators and Benchmarks Choice of Service Quality Indicators SQIs are generally based on the following criteria: Value to customer: The indicator must represent a service or service attribute that the customer thinks is important. Controllable by the utility: Only those indicators over which the utility has control should be included. SQIs should not be linked to exogenous events over which management decisions have little or no influence. Cost effective: The information collection activities associated with the indicator must be cost effective. B-2 Service Quality Indicators Page 1
148 Regulated service: The indicator must represent a regulated service provided by the utility that is not generally available from competitors. Simplicity and transparency: The indicator should be simple to administer and results should be easy to understand and interpret. Prior tracking: The indicators should have been previously tracked to ensure they are stable over time and this should be considered in future evaluations. Quantification: The indicators must be quantifiable. Flexibility: The indicators should allow sufficient flexibility to allow modifications, additions and deletions as required over time Choice of Benchmarks Benchmarks are reference points against which levels of service quality can be compared. Benchmarks typically reflect either industry standards or the utility s performance over a recent prior period Service Quality Indicators and Benchmarks The following are individual explanations for each of the ten SQIs that were established as part of the PBR Settlement, to be used throughout the settlement period including the two year extension period. Please refer to the table at the end of this section for a summary of the SQIs. 1. Emergency Response Time (Response Time Dispatched to Site for Emergency Calls) This indicator is the average length of time after notification for a qualified utility representative to arrive on the scene of the emergency (i.e. a pulled main or a situation where gas is blowing) at any location on the Terasen Gas system both during and after working hours, including weekends. The benchmark was set at 21.1 minutes as part of the PBR Settlement. B-2 Service Quality Indicators Page 2
149 Year Response Time Dispatched to Site for Emergency Calls 2007 (Jan Aug) 20.6 minutes minutes minutes minutes minutes Benchmark 21.1 minutes The 2007 current year-to-date response time of 20.6 minutes is lower than the benchmark of 21.1 minutes. Terasen Gas has shown consistent improvement in response time over the last three years especially in 2007 and expects to maintain this favorable response time at year end. 2. Speed of Answer Emergency (Percent of Responses Within 30 Seconds by a Person - Emergency Calls) Call answer time is a common service quality indicator for distribution utilities. The benchmark of 95.0% is included as a performance clause in the contract with CustomerWorks. Year Percent of Responses Within 30 Seconds by a Person for Emergency Calls 2007 (Jan Aug) 98.4% % % % % Benchmark 95.0% The current year to date service level has remained quite consistent for the last three years with marked improvement since Terasen Gas expects to be at or near the current level of 98.4% at the end of B-2 Service Quality Indicators Page 3
150 3. Speed of Answer Non-Emergency (Percent Responses Within 30 Seconds by a Person Non-Emergency Calls) This SQI tracks the percent of responses within 30 seconds by a person for non-emergency calls including general, bill inquiries and service applications. The Benchmark of 75.0% is included as a performance clause in the contract with CustomerWorks. Year Percent of Responses Within 30 Seconds by a Person for a Non-Emergency Call 2007 (Jan - Aug) 77.3% % % % % Benchmark 75.0% The 2007 year-to-date percentage for non-emergency speed of answer at 77.3% is better than the benchmark of 75.0% and Terasen Gas expects the year end result to exceed the benchmark target of 75.0% 4. Transmission System Integrity (Transmission System Annual Reportable Incidents) This indicator is presently tracked manually and this is expected to continue, as it covers several different kinds of incidents that are reported to government. B-2 Service Quality Indicators Page 4
151 Year Transmission System Annual Reportable Incidents 2007 (Jan - Aug) Benchmark 2 The 2007 year-to-date transmission system reportable incidents of 1 compares favourably with the benchmark level of 2. 5a. Residential & Commercial Customer Billing Activity (Customer Bills Produced Meeting Activity Criteria) The contract with CustomerWorks contains three performance measures that are included together as sub-measures and combined to form a single service quality indicator. These submeasures are generally described as accuracy, timeliness, and completion. The tolerance requirements for the first measure are significantly higher than the second and third, 99.9% v. 95%. As such, in order to align these sub-measures, an index score is used. The objective is to achieve a score of 5.0 or less. The benchmark was set based on the performance measures in the contract with CustomerWorks. Billing Sub-Measure 1 Percentage of bills accurate based upon input data 2 Percentage of bills delivered to Canada Post within two days of date that the statement file is created 3 Percentage of customers billed within two business days of the scheduled billing date Percent Achieved ( PA ) Adjustment Factors Result 99.9% IF [PA 99.9%, 5000*(1-PA), 100*(1.05-PA)] % 100 PA % 100 PA 5.0 B-2 Service Quality Indicators Page 5
152 Billing Sub-Measure Benchmark Billing Service Quality Indicator (arithmetic average of sub-measures 1 to 3) Percent Achieved ( PA ) Adjustment Factors Result 5.0 The Adjustment Factors allow the computation of an index score using a simple average of the three results (5.0 or less is desirable). Year Customer Bills Produced Meeting Activity Criteria 2007 (Jan - Aug) Benchmark 5.0 Beginning in March 2006, the determination of this score includes the experience of the TGVI and TGW customers, a base volume increase of approximately 10%. The 2007 year-to-date composite score of 2.47 for customer bills meeting activity criteria compares favourably to the benchmark of 5.0 and Terasen Gas expects to meet the benchmark at year-end. 5b. Industrial Customer Billing Activity (Percent of Industrial Customer Bills Accurate) This service quality indicator tracks the accuracy of billing for Industrial customers. B-2 Service Quality Indicators Page 6
153 Year Percent of Industrial Customer Bills Accurate 2007 (Jan - Aug) 99.4% % % % % Benchmark 99.5% The 2007 year-to-date result of 99.4% for industrial billing accuracy is currently tracking lower than the benchmark of 99.5% as the result of a billing error related to PST and franchise fees that occurred in April this year. Terasen Gas expects to meet the benchmark of 99.5% at year end. 6. Meter Exchange Appointment Activity (Percent of Appointments Met for Meter Exchange) This indicator tracks the percent of appointments met for meter exchange. The benchmark is set at the 2002 level. Year Percent of Appointments Met for Meter Exchange 2007 (Jan - Aug) 93.6% % % % % Benchmark 92.2% The 2007 year-to-date result of 93.6% of meter exchange appointments met exceeds the benchmark of 92.2% and has shown consistency in results over the last four years. B-2 Service Quality Indicators Page 7
154 7. Industrial Meter Measurement (Industrial Meter Measurement First Report Under 10%) This service quality indicator tracks the percent of time when the deviation is less than 10% between the preliminary billing estimate that is first reported to an industrial customer, compared to the final amount that is billed to the customer. Industrial Shipper Agents are interested in both their daily balanced groups and their monthly balanced groups. This SQI for Industrial Meter Measurement contains both an accuracy measure (percent deviation) and a frequency measure, applied to both daily and monthly groups on a GJ-weighted basis. Customers who do not provide Terasen with a metering phone line are not included in this measure. The benchmark is set at 90%. Year Industrial Meter Measurement First Report Under 10% 2007 (Jan - Aug) 100.0% % % % % Benchmark 90.0% The 2007 year-to-date result of 100.0% for industrial meter measurement exceeds the benchmark of 90.0% and improves upon the 2006 results. The Company expects to exceed the 90.0% benchmark at year-end. 8. Customer Satisfaction (Independent Customer Satisfaction Survey) Prior to 2005, this service quality indicator tracked customer satisfaction using three surveys conducted by parties outside Terasen Gas. A Residential Survey has been conducted quarterly, while a Large Commercial Survey and a Builder/Developer Survey were conducted annually. In order to arrive at the Service Quality Indicator for the Independent Customer Satisfaction Survey, these three surveys were weighted as follows: 80% Residential, 10% Commercial and 10% Builder/Developer. B-2 Service Quality Indicators Page 8
155 Starting in 2005, a fourth customer satisfaction study with small commercial customers 1 is included in the calculation of the Service Quality Indicator. Additionally, the formula for deriving the Residential score has been updated to reflect the level of importance customers currently place on various service attributes. The four surveys are weighted as follows: 75% Residential, 10% Large Commercial, 10% Builder/Developer, 5% Small Commercial. High gas costs and other events beyond the control of Terasen Gas such as the Customer Choice Unbundling of Residential Customers this year can influence this SQI. It was agreed as part of the PBR Settlement that no performance threshold for this SQI is needed, but that results would be considered in the context of previous results and that consideration would be given to external factors that can influence satisfaction scores. Year Independent Customer Satisfaction Survey (Jan Aug) 78.0% % % % % Benchmark N/A results to be compared to prior years The 2007 year-to-date Independent Customer Satisfaction Survey score of 78.0% shows a consistent improvement over the previous 4 years and the 2006 level of 77.9%. This score is expected to change slightly for year end as the last quarterly result will include any impacts from the Customer Choice unbundling program, which launched May 1 st of this year and will see gas flowing under the program commencing November 1 st. 1 Small commercial customers represent approximately 20% of Terasen Gas annual revenue and approximately 9% of the total customer base. 2 The 2004 Service Quality Indicator (SQI) was originally reported as 73.9%. This figure was calculated using the formula in place at that time. In 2005, the 2004 SQI was recalculated using a formula adopted in This was to ensure that the 2004 SQI could be directly compared to the SQI for 2005 and subsequent years. B-2 Service Quality Indicators Page 9
156 9. Customer Satisfaction (Number of Customer Complaints to BCUC) This indicator tracks the number of customer complaints submitted to the Commission that the Commission then requests, either by Commission Letter or by a Complaint/Inquiry Record, that Terasen Gas provide a written response. Volatile gas costs and other events beyond the control of Terasen Gas can influence the number of complaints to the Commission. It was agreed as part of the PBR Settlement, that there is no performance threshold for this SQI, but that results would be considered in the context of previous results and consideration would be given to external factors and any relevant uncontrollable events that can influence results. Year Number of Customer Complaints to BCUC 2007 (Jan - Aug) Benchmark N/A results to be compared to prior years The 2007 year end result is expected to be similar to 2006 but the number of complaints is not expected to reach the level experienced in There has been an increase of complaints over the previous two years mostly due to gas rate volatility. 10. Customer Satisfaction (Number of Prior Period Adjustments) The Customer Satisfaction indicator tracks the number of prior period adjustments for Industrial Transportation Service customers. A prior period adjustment is a billing inaccuracy that is identified after a bill has been issued; if this occurs, the bill is adjusted with any necessary corrections. It was agreed as part of the PBR Settlement, that there is no performance threshold for this SQI but that results would be considered in the context of previous results. B-2 Service Quality Indicators Page 10
157 Year Number of Prior Period Adjustments 2007 (Jan - Aug) Benchmark N/A results to be compared to prior years The 2007 year-to-date prior period adjustments result of 9 is significantly lower than the benchmark of 24 and year end result are expected to be lower than the number of adjustments experienced in Directional Indicators Two of the previous SQIs were not effective as measures but they are included as Directional Indicators. 1. Number of Third Party Damages Terasen Gas continues its efforts in preventing third party damages to the distribution system. There is no direct link between Third Party Damages and housing starts, so Number of Third Party Damages is tracked and reported as a Directional Indicator, with no benchmark. Year Number of Third Party Damages 2007 (Jan - Aug) 1054 incidents incidents incidents incidents incidents The 2007 year-to-date number of third party damages at 1,054 incidents is anticipated to be slightly higher at year end than the levels experienced during the past three years due to the current high levels of construction, particularly major provincial infrastructure projects such as Gateway and the Canada Line. B-2 Service Quality Indicators Page 11
158 2. Leaks per Kilometre of Distribution Mains The number of leaks may measure integrity to a certain extent, but in practice, there could be a perceived incentive to lengthen the frequency between surveys in order to reduce the number of leaks detected. Each year approximately one-fifth of the Distribution System is surveyed for leaks. The number of leaks found in any one year will vary in the short term, more because of the condition of the portion of the system being surveyed rather than the quality of the current maintenance program. This statistic will only become valid over a long time horizon; probably 15 to 25 years. The purpose of the leak survey is to find leaks in the system so as to make the appropriate repairs prior to an escalating incident. This measure will continue to be tracked manually and reported as a Directional Indicator, with no benchmark. Year Leaks per Km of Distribution Mains 2007 (Jan - Aug) (54 leaks) (76 leaks) (120 leaks) (150 leaks) (134 leaks). The Company projects year-end results to be within the range of previous years Conclusion It is Terasen Gas submission that service quality continues to be maintained in 2007, and, moreover, has been maintained throughout the settlement period. B-2 Service Quality Indicators Page 12
159 2.2 Summary of Service Quality Indicators Performance Measure Service Quality Indicator Benchmark 1 Emergency Response Time Response Time Dispatched to Site for Emergency Calls 2 Speed of Answer - Percent of Responses Within Emergency 30 Seconds by a Person for Emergency Calls 3 Speed of Answer - Percent of Responses Within Non-Emergency 30 Seconds by a Person for Non-Emergency Calls 4 Transmission System Transmission System Annual Integrity Reportable Incidents 5a Residential & Index Based on the Percent of Commercial Customer Customer Bills Produced Billing Activity Meeting Accuracy, Timeliness, and Completion 5b Industrial Customer Percent of Industrial Customer Billing Activity Bills Accurate 6 Meter Exchange Percent of Appointments Met Appointment Activity for Meter Exchange 7 Industrial Meter Industrial Meter Measurement Measurement First Report under 10% 8 Customer Satisfaction Independent Customer Satisfaction Survey 9 Customer Satisfaction Number of Customer Complaints to BCUC 10 Customer Satisfaction Number of Prior Period Adjustments 21.1 minutes 95.0% 75.0% % 92.2% 90.0% N/A results to be compared to prior years N/A results to be compared to prior years N/A results to be compared to prior years 2.3 Summary of Directional Indicators Directional Measure 1 Distribution System Integrity 2 Distribution System Integrity Directional Indicator Number of Third Party Damages Leaks per Kilometre of Distribution Mains B-2 Service Quality Indicators Page 13
160 2007 DEMAND SIDE MANAGEMENT STATUS REPORT 1. INTRODUCTION Under the terms of the extension of the Multi-Year PBR Settlement, Terasen Gas is required to submit an annual Demand Side Management ( DSM ) Status Report to the Commission as part of the Annual Review process. This report follows the 2006 Status report in form and content and provides an overview of Terasen Gas DSM activities in 2007 with details pertaining to the progress of individual DSM programs against forecasted targets and objectives for the year, and details pertaining to other DSM initiatives. As in prior years, Terasen Gas has offered several types of programs most of which are in progress at the time of this writing; therefore, impacts are estimated rather than actual results. 2. GENERAL OVERVIEW OF DSM PROGRAMS AT TERASEN GAS With the release of the Government of British Columbia s Energy Plan in 2007, the profile of Energy Efficiency and Conservation activities at Terasen Gas increased, and is one of the ways that Terasen Gas can support the provincial policy goals. In 2007, Terasen Gas continued efforts to promote natural gas conservation and efficiency to its customers through a combination of awareness, education and incentive programs. In 2007, the Residential New Construction Heating Program was closed to new applications, and the Efficient Boiler Program was limited to new construction applications. Energy conservation and efficiency continues to be promoted by a number of other utilities, agencies and industry members. Terasen Gas continues, whenever feasible, to partner with others to better leverage its available DSM funds. BC Hydro and FortisBC are contributing to the Variable Speed Motor component of the Energy Star Heating Upgrade program, along with 15 furnace and boiler manufacturers. In March 2007, Terasen Gas s Contribution Agreement of $2.4 million with the Ministry of Energy, Mines and Petroleum Resources ( MEMPR or the Ministry ) concluded. This entailed a contribution by the Ministry to both program and incentive costs for a market survey of gas contractors, for Energy Star furnace/boiler upgrades in residential new construction and retrofits, for a Commercial Boiler program and for sponsorship of the 2006 BC Energy Forum. The Government of Canada has implemented their Eco-Energy strategy of retrofits for various residential upgrades, and the 2007 version of the Energy Star Heating Upgrade program is incremental to the federal grant of $300 to $500 for an Energy Star B-3 DSM Status Report Page 1
161 furnace upgrade. More information about the federal government s Eco-Energy program is available at As in past years, programs are subjected to economic cost-benefit tests (most notably a standardized Total Resource Cost test) prior to launch, and in this report (in response to Commission Order G ) Terasen Gas has also included information on the Ratepayer Impact Measure Test, the Participant Cost Test and the percentage of free riders. Terasen Gas has launched an evaluation of the Energy Star Heating Upgrade program that ran from September 2005 to March 2007, and the first results are anticipated to be available early in 2008 and will be included in next year s Annual Review. The evaluation will provide insight into opportunities for future improvement and assist in measuring actual natural gas savings against projections, as well as free ridership rates. DSM initiatives also produce benefits for the utility, the customer, and society in general which are not considered part of the Total Resource Cost ( TRC ) test, particularly greenhouse gas emission reductions. The greenhouse gas ( GHG ) emission reductions from Terasen s DSM activities are tracked but in the cost-benefit analysis that Terasen Gas performs, the GHG emission reductions have not been monetized. 3.0 EDUCATION AND OUTREACH INITIATIVES Destination Conservation Destination Conservation (DC) is a K-12 school program involving students, teachers and school facilities management staff. The program is organized by the Pacific Resource Conservation Society, a BC based not-for-profit group, and offered to school districts. It features energy conservation curricula and support materials for participating teachers and technical assistance to school facilities management staff. Terasen Gas contributes a portion of the first year operating costs for the program to a number of school districts in prior years. In the FortisBC service territory, FortisBC contributes the second year operating costs, providing another example of how Terasen works with partners to deliver programs. Although participation in the program last year was weak due to a distraction within BC s education system reflecting teachers contract negotiations, this year participation has picked up significantly, partially because the labour situation is now settled, but also because of the focus provincially on conservation and climate change. B-3 DSM Status Report Page 2
162 To date there are three new districts joining the Destination Conservation program for the 2007 school year with the support of Terasen Gas. Vancouver School District (SD #39) is operating a pilot of the program with 15 schools registered. The intention is for the program to expand based on the savings demonstrated by these 15 schools. Likewise the Central Okanagan School District (SD #23) has 11 schools registered to participate in DC this year, with the intent of expanding the program in The final district joining the program this year is Okanagan Skaha (SD #67) in the Penticton area. All 18 schools in this district are registered to participate in DC. There are 44 new schools in all supported by Terasen Gas in their first year. As first year schools, all three districts will be participating in the energy workshop stream. The Orientation, Energy 1, Energy 2 and Celebration sessions engage the building occupants staff, students and parent volunteers. There are also two building operator training workshops, usually held back to back. These mirror the occupant workshops focusing on lighting and heating, ventilation and air conditioning in year one. Commercial Energy Utilization Advisory This program is offered to larger Rate Schedule 3/23 and Rate Schedule 5/25 commercial customers. The offer includes an initial benchmarking consultation and an onsite assessment of natural gas conservation and efficiency opportunities along with recommendations and estimated savings. As of June , there have been 59 completed assessments in 2007, and expected total of by year end is 100. Typically, 25% of the customers who receive the assessment implement the recommended measures and average 600 Gigajoules ( GJ ) in annual savings. Publications Terasen Gas continues to publish brochures and other collateral to encourage residential customers to adopt energy savings measures and practices. These include our Hot Tips booklet, which contains a number of energy saving tips that homeowners can readily perform themselves, as well as bill inserts and our customer newsletter. Mass Media Communication In 2007, Terasen Gas discontinued the use of television commercials as a way to promote its energy efficiency programs and to draw attention to the importance of energy efficiency. B-3 DSM Status Report Page 3
163 Instead, the company focussed on radio as a cost-effective medium for communicating information about energy efficiency in general, and the Energy Star Heating Upgrade program in particular. Community Energy Planning Participation Terasen Gas continues to be an active participant in community-based conservation initiatives (i.e. the Community Energy Association) and collaborates with the provincial and federal governments to review and to implement energy efficiency standards. Terasen Gas is an active supporter of British Columbia s Community Action on Energy Efficiency strategy ( Trade Show Activity Terasen Gas increased its trade show activity in 2007, promoting energy efficiency and conservation at Buildex 2007 (aimed at construction and building trades, as well as architects, engineers, developers and builders), the Vancouver Spring Home and Garden Show, the Vancouver Fall Home and Interior Design show as well as home shows in Kelowna and Kamloops. The company found this to be an effective way to reaching customers with energy saving information and answering their questions. Other Activities Terasen Gas engages in a number of demand side management related activities designed to enhance energy efficiency in British Columbia. Some of them are described below: Terasen Gas participated and continues to participate on the Steering Committee for BC Hydro s Conservation Potential Review and on BC Hydro s Electricity Conservation and Efficiency Advisory Committee. Terasen Gas s sponsorship of the Douglas College program Building Operator Training which is designed to address ongoing maintenance and upgrades to commercial building operations by training facilities staff in efficiency techniques was expanded to make the course available in Prince George and Kelowna Terasen Gas sponsored participation for members in the Building Owners and Managers Association s on-line training course related to energy efficiency. B-3 DSM Status Report Page 4
164 INCENTIVE PROGRAM DESCRIPTIONS Please note that in 2007, Terasen Gas commissioned and received from Willis Energy Services an updated model for calculating DSM cost/benefit ratios and TRC results. The method of presenting energy savings from DSM activity has changed from that presented in previous years to reflect this improved model. In previous Annual Reviews, energy savings have been presented as simple annual savings. Energy savings and cost/benefit test results are presented in the 2007 Annual Review as the present value of the savings over the measure life, to more appropriately represent energy savings from DSM activity. A discount rate of approximately 5.9%, representing Terasen s after tax weighted average cost of capital, was used to determine the present value of the energy savings. It is the intention of Terasen Gas to continue to use the present value measure life method of presenting savings and analyzing cost/benefit results in all future reviews. Energy Star Heating System Upgrade The 2007 program represents a continuation of previous years programs. As in previous years, this year s Residential Heating System Upgrade program offers financial incentives to residential customers to replace older furnaces and boilers with ENERGY STAR qualified high efficiency natural gas models. The Winter 2007 version of the program was officially launched September 1, 2007 and runs to March 31, Partners on this program are BC Hydro, FortisBC, and 15 participating manufacturers. These partners are contributing to customer incentives. Under this program, residential customers are offered a $250 utility bill credit towards the purchase of an ENERGY STAR qualified high efficiency natural gas furnace or boiler. BC Hydro and FortisBC are contributing an additional $50 incentive if the selected furnace has a variable speed motor. Additional supplier-funded incentives ranging from $150 to $1,000 in value toward the purchase of 15 brands of ENERGY STAR qualified furnaces and boilers are being promoted by Terasen Gas as part of this program. The manufacturers are responsible for administering their own coupons and the manufacturer coupons are only valid for redemption between September 1, 2007 and January 31, 2008 B-3 DSM Status Report Page 5
165 The program design for the Energy Star Heating System Upgrade program estimates the average annual natural gas savings at 13.8 GJ per participant. There have been 3666 participants in the program year to date, and Terasen estimates that there will be an additional 650 participants to December 31, This participation level results in a present value (PV) energy savings over the measure life of 344,369 GJ, a present value measure life GHG savings of 17,456 tonnes, and a Total Resource Cost Ratio (TRC) of New Construction Energy Star Heating System Program/PowerSmart New Home Program This program was closed to new applications March 31, Effective January 1, 2008, the Government of British Columbia has legislated under the Energy Efficiency Act that all furnaces and boilers in new construction be Energy Star-rated. Given construction lead times, in order to minimize free rider rates, Terasen Gas felt that builders who were going to apply to the program for homes to be completed by December 31, 2007 would have done so by March 31 of this year. Terasen s involvement in the BC Hydro PowerSmart New Home Program also ended March Terasen had 80 applications for the Energy Star heating and natural gas hot water components of the Power Smart New Home program. These participants have been incorporated into the results for the New Construction Energy Star Heating System program presented below For the New Construction Energy Star Heating System Program, it is estimated that the average annual natural gas savings is 9.1 GJ per participant with 2981 homes participating. This results in a present value energy savings over the measure life of 250,950 GJ, a present value measure life GHG savings of 12,721 tonnes and a TRC of B-3 DSM Status Report Page 6
166 Efficient Boiler Program This program was modified again from that which was offered in previous years. In 2006, the incentives offered under the Efficient Boiler Program were increased in response to increases in boiler prices and the market responded very positively to this modification in incentives. In order to stay within the funding envelope allocated for the program, incentives were restricted partway through 2007 to applications for new construction only. Given the high degree of variability in both incentive amounts and in projected annual savings, only actual approved applications to date are reported here. It is impossible to estimate applications that might be submitted between now and the end of 2007 with any degree of certainty. The present value of energy savings over the measure life for applications received for the Efficient Boiler Program to date is 155,041 GJ, with a present value measure life GHG savings of 7,859 tonnes and a TRC of SUMMARY OF 2007 RESULTS TRC Test and DSM Incentive Status The TRC test is a measure of the net benefits of a utility s DSM programs. Terasen Gas calculates overall TRC impact on a portfolio basis, that is, by examining the impact of the combined group of programs for the year. For the 2007 portfolio (as identified in the table below), the TRC net benefit for specific programs is forecasted to be approximately $6,368,000 with a combined TRC ratio of The numbers presented in the table below reflect actual incentive applications year to date for the Residential New Construction Heating Program, the PowerSmart New Home Program, the Efficient Boiler Program and Destination Conservation, and projections for the Energy Star Heating Upgrade Program and the Commercial Energy Assessment Program. The TRC net benefit from programs, less the non-program-specific DSM costs incurred for salaries, administration, overhead, research, and non-program related education, outreach and promotion is forecasted to be approximately $5,494,073 B-3 DSM Status Report Page 7
167 Discount Rate 5.9% Number of Participants Savings per Participant Measure per Year (GJ) Life (Years) NPV Energy Savings over Measure Life (GJ) GHG Savings over Measure Life (tonnes) Free Rider Rate (%) Participant Result TRC Net Benefit Program Name RIM Result TRC Result Energy Star Heating System Upgrade ,369 17, $1,123,000 New Construction Energy Star Heating System Program ,950 12, $1,222,000 Efficient Boiler Program * ,041 7, $571,000 Destination Conservation , $55,000 Commercial Energy Utilization Advisory ,921 22, $3,397,000 Program Portfolio Result 1,203,596 61, $6,368,000 * note that the savings for the Efficient Boiler Program are not presented per participant per year, but are instead an aggregate of savings for all participants for the year B-3 DSM Status Report Page 8
168 Greenhouse Gas Reduction In its demand side management incentive offers, Terasen Gas informs participating customers of its intent to record resulting emission reductions as part of the company s Greenhouse Gas Management Program. The present value of the GHG savings over the projected lives of the various measure resulting from Terasen Gas energy efficiency incentive programs is estimated to be 61,010 tonnes. DSM Incentive Mechanism To qualify for the DSM Incentive, a threshold of 75% of the established energy savings target of 177,425 GJs simple annual savings must be achieved, entitling Terasen Gas to an incentive of 3% of the TRC net benefits. Where the energy savings meet or exceed the threshold target of 177,425 GJs, the incentive percentage increases to 5% of the TRC net benefits. The simple annual savings from Terasen Gas DSM programs in 2007 are shown in the table below. Given the projected simple annual energy savings and net TRC benefits for 2007, Terasen Gas would be eligible for a DSM incentive of approximately $164,822. Number of Participants Savings per Participant per Year (GJ) Annual Savings (GJ) Program Name Energy Star Heating System Upgrade ,561 New Construction Energy Star Heating System Program ,127 Efficient Boiler Program * 14650* Destination Conservation ,972 Commercial Energy Utilization Advisory ,000 Total Annual Savings 151,660 * note that the savings for the Efficient Boiler Program are not presented per participant per year, but are instead an aggregate of savings for all participants for the year B-3 DSM Status Report Page 9
169 6. SUMMARY OF COSTS Program and administration costs as well as customer incentive costs are forecasted to remain within the allowed levels in Program and administration costs are treated as O & M and incentives are recovered through a deferral account. Allowed ($000) Projected ($000) Administration, program costs, marketing and 1,624 1,600 research Customer Incentives 1,500 1, RESEARCH INITIATIVES Multi-Utility and Industry Studies Terasen Gas continues to participate in a number of multi-utility research initiatives. The City of Vancouver s Sustainability Office has been particularly active in this area, and Terasen Gas has participated or is participating in studies around Pre-Rinse Spray Valves, Building Recommissioning, Efficiency Upgrades in Strata Buildings and an Energy Consumption Benchmarking Study for Multi-Family Dwellings. One new area of participation for Terasen Gas is with the Consortium for Energy Efficiency based in the United States, and the company anticipates participating in various equipment studies led by that organization. 8. PROPOSED 2008 ACTIVITY As part of the 2006 Annual Review process as well as the extension of the PBR Settlement Agreement through 2009, the Company committed to filing an application in 2007 for Energy Efficiency and Conservation programs, commencing in Terasen Gas expects to submit this application later this year. Terasen Gas anticipates that the Company will be seeking increases in efficiency and conservation funding over the levels currently allowed for in the Settlement Agreement. The Company anticipates that the regulatory review of this application will not be complete until early in For the purposes of this Annual Review materials filing, the Company has assumed that the level of incentives and O&M costs for DSM activities equals that included in the Settlement Agreement of $3.1 million per year. As stated above, the Company expects that the regulatory B-3 DSM Status Report Page 10
170 review of this application will not be complete until early in 2008, with the new programs commencing in As a result, the Company has not included additional expenditures in the 2008 test year forecast. The Company will seek, subject to Commission approval, deferral account treatment in 2008 for any additional expenditures approved by the Commission for 2008, as part of the review of the Company s Energy Efficiency and Conservation application. B-3 DSM Status Report Page 11
171 REPORT ON THE ESTABLISHMENT OF INCENTIVE MECHANISM FOR REDUCING UNCONTROLLABLE / PARTIALLY CONTROLLABLE EXPENSES FOR THE YEAR ENDING DECEMBER 31, 2007 PROPERY TAX The Extension of the Multi-Year PBR Settlement addresses the issue of establishing incentive mechanisms for Terasen Gas for reducing uncontrollable or partially controllable costs. The Negotiated Settlement, Appendix A to BCUC Order No. G-51-03, indicates that the Company is to have a positive incentive around provincial and municipal government taxes, fees and expenses and that a specific mechanism was agreed to regarding property taxes. For purposes of determining the incentive, property taxes are divided between the 1% In-Lieu taxes and all other categories of property taxes. The other property taxes include General, School, First Nations, and other taxes, and will herein be referred to as Other Property Taxes. With respect to the 1% In-Lieu taxes, the Company is entitled to keep 10% of the savings related to achieving a reduced rate for the tax or a changed structure to the tax which lowers the amount payable. For the Other Property Taxes, a modified version of the formula-based approach applicable to O&M expenses and net gas plant in service will be applied. The 2006 actual amount forms the base to which 2007 customer growth, inflation, and inflation offset factors will be applied to determine the target for The Company is entitled to 10% of the amount by which its actual taxes are lower than the target. In the formula below the property taxes for Squamish, $59,500, have been added to derive the 2007 Other Property Taxes. The 2007 threshold for Other Property Taxes is: ($27,795,700+$59,500) x ( %) x ( % %) = $28,448,000 The 2007 Other Property Taxes total is projected to be $28,866,000, which is higher than the 2007 threshold of $28,448,000 (Table A). Since the projected 2007 property taxes are higher than the target, the Company is not entitled to an incentive based upon the 2007 results. However, it is important to note that had Terasen Gas not realized the property tax savings due B-4 Uncontrollable / Partially Controllable Expenses Page 1
172 to its mitigation efforts, the 2007 actual property taxes would have been higher by $142,567 (Table B). Table A 2006 Actual Change 2007 Average Number of Customers 805,844 11, ,480 Percentage Growth in Average Customers 1.44% Annual Inflation Rate - CPI 2.00% Adjustment Factor 1.32% Other Property Tax ($000) Formula Based $ 28,448 Actual / Projected $ 27,855 28,866 Difference $ (418) The table below summarizes the total property tax savings realized to-date following the Terasen Gas property tax mitigation plan: Table B Item Actual in Expected in No Particulars Total 1 Distribution Pipeline Update Factor Error 87,000 87,000 2 Office Appeals 134,300 50, ,700 3 Other Appeals 16,670 5,167 21,837 $150,970 $142,567 $293,537 If Terasen Gas is successful with current mitigation efforts, future property tax savings could reach $500,000 (see discussion on Mitigation Activities in Progress on Page 3 of this Tab). B-4 Uncontrollable / Partially Controllable Expenses Page 2
173 Background Details behind Property Tax Cost Mitigation Plans The 2007 property tax mitigation plans were based on preemptive strategies by Terasen Gas with the goal of minimizing property taxes and cost pressures to customers. The savings summarized below are based on actual performance or are based on current ongoing mitigation activities. Unrealized future savings relate to issues that are before the Property Assessment Appeal Board. Mitigation Activities during 2007: 1. Distribution Pipeline Update Factor Error Terasen Gas discovered an error in the update (or inflation) rates applied by BC Assessment in An agreement to correct the error in the 2006 taxation year, ensuring the overall assessment over the two years would be as originally agreed upon. This affected mainly Lower Mainland folios. It is estimated that tax savings, to be implemented in 2008, amount to $87, Office Appeal In 2006 it was discovered that the classification of several of the Company offices did not comply with the Property Assessment Appeal Board, this resulted in a further $81,400 savings. Further, refunds totaling $50,400 were received in 2007 relating to the prior year appeals. 3. Miscellaneous Appeals The Company achieved a further reduction of $5,167 through various other appeals on valuation and classification. 4. Other Activities Terasen Gas continues to be involved with a variety of groups specializing in Local Government taxation, these include the Canadian Property Tax Association, the Vancouver Board of Trade, and the Canadian Energy Pipeline Association. Mitigation Activities in progress: 5. Office Appeal In addition to the activities described under point #2, the Company is attempting to seek changes in the wording of the regulations. Terasen Gas met with Provincial Government officials to discuss changes in legislation to address the inequity in property classification applied to Utility offices. The Company is hopeful that changes in legislation will be forthcoming for the 2008 taxation year. Based on the 2007Assessment roll it is estimated a change in legislation would result in annual savings of $500,000. B-4 Uncontrollable / Partially Controllable Expenses Page 3
174 CODE OF CONDUCT AND TRANSFER PRICING POLICY REVIEWS CONDUCTED BY INTERNAL AND INDEPENDENT EXTERNAL AUDITORS The Commission stated, at page 21 of Appendix A to Commission Order G-51-03, the following relating to compliance with the Negotiated Settlement and extended by Order No. G : At each Annual Review, Terasen Gas will provide the report required by and filed with the Commission summarizing the results of the annual compliance review of the Code of Conduct and Transfer Pricing Policy of the Commission conducted by Terasen Gas Internal Audit Services. For each year during the Term of the Settlement, the Commission will provide Stakeholders with the proposed Commission directions to Terasen Gas Internal Audit Services. Any Stakeholder may request the Commission to add directions to review and report on other areas of concern. The Internal Audit Services has prepared a report entitled Annual Review of Compliance with the Terasen Gas Inc. Code of Conduct and Transfer Pricing Policy based on the same guidelines and framework as in 2005 and is attached as Appendix A to this Section B-5. In addition, the Commission continued to state at page 22 of Appendix A: In addition, before the first Annual Review, Terasen Gas independent external auditor will review the work performed by Terasen Gas Internal Audit Services Subsequent to the first Annual Review, Stakeholders and Terasen Gas may make submissions to the Commission regarding whether or not such a review and report by the independent external auditor of Terasen Gas should be continued for other Annual Reviews. For the 2007 Annual Review, Terasen Gas contracted the services of the firm Ernst & Young to provide a review of and report on Terasen Gas compliance with the Code of Conduct ( CoC ) and the Transfer Pricing Policy ( TPP ). Ernst & Young s report is attached as Appendix B. Based on their respective review procedures, both internal and external auditors concluded that nothing came to their attention that would cause them to conclude that Terasen Gas is not in compliance with either of the CoC or TPP. B-5 Code of Conduct and Transfer Pricing Policy Page 1

175 Andrew Lee Manager, Internal Audit Services (a subsidiary of Fortis Inc.) Fraser Highway Surrey, BC V3S 2X7 Tel: Fax: September 24, 2007 Mr. Randy Jespersen President, Terasen Gas Inc Fraser Highway Surrey, B.C. V3S 2X7 Dear Mr. Jespersen: Subject: Annual Review of Compliance with the Terasen Gas Inc. Code of Conduct and Transfer Pricing Policy Internal Audit Services (IAS) has completed a review of compliance with the Terasen Gas Inc. (Terasen Gas) Code of Conduct and Transfer Pricing Policy for the Provision of Utility Resources and Services (the Policies). This review is conducted to satisfy Terasen Gas requirements as documented in the Policies. Terasen Gas will monitor employee compliance with the Code of Conduct by conducting an annual compliance review, the results of which will be summarized in a report to be filed with the Commission (B.C. Utilities Commission) within 60 days of the completion of this review. 1 The Transfer Pricing Policy will be reviewed on an annual basis as part of the Code of Conduct compliance review. 2 Background The Policies were issued in August 1997 to govern the relationships between Terasen Gas and Non-Regulated Business (NRB) for the provision of Utility resources. NRBs are defined as: an affiliate of the Utility not regulated by the Commission or a division of the Utility offering unregulated products and/or services 3. Terasen Gas has processes and practices that are designed to ensure compliance with these Policies. Commission approval was obtained in July 2003 for the Terasen Gas Settlement Agreement for a Performance-Based Rate Plan. One of the conditions for compliance with this negotiated settlement is that: At each Annual Review, Terasen Gas will provide the report required by and filed with the Commission summarizing the results of the annual compliance review of the Code of Conduct and Transfer Pricing Policy of the Commission conducted by Terasen Gas Internal Audit Services. 1 Item 7 Compliance and Complaints, Code of Conduct 2 Item 7 Review of Transfer Pricing Policy, Transfer Pricing Policy 3 page 2 Definitions, both Code of Conduct and Transfer Pricing Policy Page 1
Diane Roy Director, Regulatory Services
 Diane Roy Director, Regulatory Services Gas Regulatory Affairs Correspondence Email: gas.regulatory.affairs@fortisbc.com Electric Regulatory Affairs Correspondence Email: electricity.regulatory.affairs@fortisbc.com
VIA October 27, 2005
 ROBERT J. PELLATT COMMISSION SECRETARY Commission.Secretary@bcuc.com web site: http://www.bcuc.com SIXTH FLOOR, 900 HOWE STREET, BOX 250 VANCOUVER, B.C. CANADA V6Z 2N3 TELEPHONE: (604) 660-4700 BC TOLL
Re: Project No Pacific Northern Gas (N.E.) Ltd Revenue Requirements Application Update for Fort St. John/Dawson Creek Division
 Ltd Revenue Requirements Application Update for Fort St. John/Dawson Creek Division") B-7 Craig P. Donohue Director, Regulatory Affairs & Gas Supply Pacific Northern Gas Ltd. Suite 950 1185 West Georgia Street Vancouver, BC V6E 4E6 Tel: (604) 691-5673 Tel: (604) 697-6210 Email: cdonohue@png.ca
B-7 Craig P. Donohue Director, Regulatory Affairs & Gas Supply Pacific Northern Gas Ltd. Suite 950 1185 West Georgia Street Vancouver, BC V6E 4E6 Tel: (604) 691-5673 Tel: (604) 697-6210 Email: cdonohue@png.ca
November 22, British Columbia Utilities Commission 6 th Floor, 900 Howe Street Vancouver, BC V6Z 2N3
 Diane Roy Director, Regulatory Affairs - Gas FortisBC Energy Inc. November 22, 2012 British Columbia Utilities Commission 6 th Floor, 900 Howe Street Vancouver, BC V6Z 2N3 16705 Fraser Highway Surrey,
TERASEN GAS INC PERFORMANCE BASED RATE SETTLEMENT AGREEMENT ANNUAL REVIEW & MID-TERM ASSESSMENT REVIEW WORKSHOP November 15, 2006
 TERASEN GAS INC. 2004 2007 PERFORMANCE BASED RATE SETTLEMENT AGREEMENT 2006 ANNUAL REVIEW & MID-TERM ASSESSMENT REVIEW WORKSHOP November 15, 2006 1 AGENDA REVIEW Scott Thomson 2 AGENDA Agenda - Scott Thomson
FortisBC Energy Inc. An indirect subsidiary of Fortis Inc. Consolidated Financial Statements For the years ended December 31, 2013 and 2012
 An indirect subsidiary of Fortis Inc. Consolidated Financial Statements Prepared in accordance with United States Generally Accepted Accounting Principles MANAGEMENT S REPORT The accompanying annual consolidated
TERASEN GAS (VANCOUVER ISLAND) INC REVENUE REQUIREMENT. Workshop Presentation. August 31, 2005
 INC REVENUE REQUIREMENT. Workshop Presentation. August 31, 2005") TERASEN GAS (VANCOUVER ISLAND) INC. 2006 2007 REVENUE REQUIREMENT Workshop Presentation August 31, 2005 Review of Agenda Scott Thomson Vice President Finance and Regulatory Affairs Workshop Agenda 1. Welcome
TERASEN GAS (VANCOUVER ISLAND) INC. 2006 2007 REVENUE REQUIREMENT Workshop Presentation August 31, 2005 Review of Agenda Scott Thomson Vice President Finance and Regulatory Affairs Workshop Agenda 1. Welcome
FORM F4 BUSINESS ACQUISITION REPORT
 FORM 51-102F4 BUSINESS ACQUISITION REPORT ITEM 1 IDENTITY OF COMPANY 1.1 Name and Address of Company Fortis Inc. ("Fortis" or the "Corporation") Suite 1201, 139 Water Street St. John's, Newfoundland and
FortisBC Inc. Annual Review of 2018 Rates Project No British Columbia Utilities Commission Information Request No. 1
 Patrick Wruck Commission Secretary Commission.Secretary@bcuc.com bcuc.com Suite 410, 900 Howe Street Vancouver, BC Canada V6Z 2N3 P: 604.660.4700 TF: 1.800.663.1385 F: 604.660.1102 September 6, 2017 Sent
Diane Roy Director, Regulatory Services
 Diane Roy Director, Regulatory Services Gas Regulatory Affairs Correspondence Email: gas.regulatory.affairs@fortisbc.com Electric Regulatory Affairs Correspondence Email: electricity.regulatory.affairs@fortisbc.com
ORDER NUMBER G IN THE MATTER OF the Utilities Commission Act, RSBC 1996, Chapter 473. and
 Suite 410, 900 Howe Street Vancouver, BC Canada V6Z 2N3 bcuc.com P: 604.660.4700 TF: 1.800.663.1385 F: 604.660.1102 ORDER NUMBER G-48-19 IN THE MATTER OF the Utilities Commission Act, RSBC 1996, Chapter
FORTISBC ENERGY PROPOSAL FOR DEPRECIATION & NET SALVAGE RATE CHANGES EXHIBIT A2-3
 Laurel Ross Acting Commission Secretary Commission.Secretary@bcuc.com Website: www.bcuc.com Sixth Floor, 00 Howe Street Vancouver, BC Canada VZ N TEL: (0) 0-00 BC Toll Free: -00-- FAX: (0) 0- Log No. VIA
August 29, British Columbia Utilities Commission 6 th Floor, 900 Howe Street Vancouver, BC V6Z 2N3
 Diane Roy Director, Regulatory Affairs - Gas FortisBC Energy Inc. August 29, 2012 British Columbia Utilities Commission 6 th Floor, 900 Howe Street Vancouver, BC V6Z 2N3 16705 Fraser Highway Surrey, B.C.
Terasen Gas Inc. A subsidiary of Fortis Inc. Annual Information Form. For the Year Ended December 31, 2008 dated February 18, 2009
 A subsidiary of Fortis Inc. Annual Information Form For the Year Ended December 31, 2008 dated February 18, 2009. 1 TABLE OF CONTENTS CORPORATE STRUCTURE... 3 DESCRIPTION OF THE BUSINESS... 4 DISTRIBUTION
FortisBC Energy Inc. An indirect subsidiary of Fortis Inc. Consolidated Financial Statements For the years ended December 31, 2017 and 2016
 An indirect subsidiary of Fortis Inc. Consolidated Financial Statements Prepared in accordance with accounting principles generally accepted in the United States of America MANAGEMENT S REPORT The accompanying
FEVI DEFERRAL ACCOUNT PEC EXHIBIT A2-1
 ERICA HAMILTON COMMISSION SECRETARY Commission.Secretary@bcuc.com web site: http://www.bcuc.com VIA EMAIL gas.regulatory.affairs@fortisbc.com April 4, 2013 SIXTH FLOOR, 900 HOWE STREET, BOX 250 VANCOUVER,
FORTISBC ENERGY CEC ROE 2016 EXHIBIT A-7
 ERICA HAMILTON COMMISSION SECRETARY Commission.Secretary@bcuc.com web site: http://www.bcuc.com SIXTH FLOOR, 900 HOWE STREET, BOX 250 VANCOUVER, BC CANADA V6Z 2N3 TELEPHONE: (604) 660-4700 BC TOLL FREE:
Pacific Northern Gas Ltd. (PNG-West)
") (PNG-West) #2550-1066 West Hastings Street Vancouver, B.C. V6E 3X2 2016 ANNUAL REPORT TO THE BRITISH COLUMBIA UTILITIES COMMISSION For the period January 1, 2016 to December 31, 2016 LIST OF SCHEDULES
(PNG-West) #2550-1066 West Hastings Street Vancouver, B.C. V6E 3X2 2016 ANNUAL REPORT TO THE BRITISH COLUMBIA UTILITIES COMMISSION For the period January 1, 2016 to December 31, 2016 LIST OF SCHEDULES
Mr. Robert J. Pellet, Commission Secretary. Terasen Gas Energy Services Inc. ( TES ) CPCN Application for Gateway Lakeview Estates Propane System
 CPCN Application for Gateway Lakeview Estates Propane System") 3700 2 nd Avenue Burnaby, BC V5C 6S4 Tel: 604-293-8642 Fax: 604-293-8640 e-mail: TerasenIncRegulatory@terasen.com www.terasenenergyservices.com B-1 September 6, 2006 British Columbia Utilities Commission
3700 2 nd Avenue Burnaby, BC V5C 6S4 Tel: 604-293-8642 Fax: 604-293-8640 e-mail: TerasenIncRegulatory@terasen.com www.terasenenergyservices.com B-1 September 6, 2006 British Columbia Utilities Commission
STARGAS APPLICATION TO ALTER RATES. Re: Stargas Utilities Ltd. Application to Alter Rates and Refinance
 ERICA HAMILTON COMMISSION SECRETARY Commission.Secretary@bcuc.com web site: http://www.bcuc.com SIXTH FLOOR, 900 HOWE STREET, BOX 250 VANCOUVER, BC CANADA V6Z 2N3 TELEPHONE: (604) 660 4700 BC TOLL FREE:
Re: Pacific Northern Gas (N.E.) Ltd. Project No /Order G Revenue Requirements Application
 Ltd. Project No /Order G Revenue Requirements Application") ERICA HAMILTON COMMISSION SECRETARY Commission.Secretary@bcuc.com web site: http://www.bcuc.com SIXTH FLOOR, 900 HOWE STREET, BOX 250 VANCOUVER, BC CANADA V6Z 2N3 TELEPHONE: (604) 660-4700 BC TOLL FREE:
ERICA HAMILTON COMMISSION SECRETARY Commission.Secretary@bcuc.com web site: http://www.bcuc.com SIXTH FLOOR, 900 HOWE STREET, BOX 250 VANCOUVER, BC CANADA V6Z 2N3 TELEPHONE: (604) 660-4700 BC TOLL FREE:
BC Gas Utility Ltd. Annual Report 2002
 Annual Report 2002 Corporate Profile is the largest distributor of natural gas serving British Columbia, with 774,000 residential, commercial and industrial customers in more than 100 communities., with
Attention: Mr. Patrick Wruck, Commission Secretary and Manager, Regulatory Support
 Diane Roy Vice President, Regulatory Affairs Gas Regulatory Affairs Correspondence Email: gas.regulatory.affairs@fortisbc.com Electric Regulatory Affairs Correspondence Email: electricity.regulatory.affairs@fortisbc.com
September 26, Via Original via Mail. British Columbia Utilities Commission Sixth Floor 900 Howe Street Vancouver, B.C.
 B-8 Diane Roy Director, Regulatory Affairs FortisBC Energy 16705 Fraser Highway Surrey, B.C. V4N 0E8 Tel: (604) 576-7349 Cell: (604) 908-2790 Fax: (604) 576-7074 Email: diane.roy@fortisbc.com www.fortisbc.com
REVENUE REQUIREMENT CGA Regulatory Course. Michelle Carman FortisBC Energy Inc.
 REVENUE REQUIREMENT 2016 CGA Regulatory Course Michelle Carman FortisBC Energy Inc. 1 Introduction Presentation Objectives Part 1: Explain and demonstrate the calculation of revenue requirement for the
B.C. Utilities Commission File No.: 4.2 (2015) 6 th Floor Howe Street Vancouver, B.C. V6Z 2N3
 6 th Floor Howe Street Vancouver, B.C. V6Z 2N3") B-3 Janet P. Kennedy Vice President, Regulatory Affairs & Gas Supply Pacific Northern Gas Ltd. 950, 1185 West Georgia Street Vancouver, BC V6E 4E6 Tel: (604) 691-5680 Fax: (604) 697-6210 Email: jkennedy@png.ca
B-3 Janet P. Kennedy Vice President, Regulatory Affairs & Gas Supply Pacific Northern Gas Ltd. 950, 1185 West Georgia Street Vancouver, BC V6E 4E6 Tel: (604) 691-5680 Fax: (604) 697-6210 Email: jkennedy@png.ca
Terasen Gas (Vancouver Island) Inc. ( TGVI ) 2010 and 2011 Revenue Requirements and Rate Design Application (the Application )
 Inc. ( TGVI ) 2010 and 2011 Revenue Requirements and Rate Design Application (the Application )") Tom A. Loski Chief Regulatory Officer 16705 Fraser Highway Surrey, B.C. V4N 0E8 Tel: (604) 592-7464 Cell: (604) 250-2722 Fax: (604) 576-7074 Email: tom.loski@terasengas.com www.terasengas.com Regulatory
Tom A. Loski Chief Regulatory Officer 16705 Fraser Highway Surrey, B.C. V4N 0E8 Tel: (604) 592-7464 Cell: (604) 250-2722 Fax: (604) 576-7074 Email: tom.loski@terasengas.com www.terasengas.com Regulatory
FortisBC Inc. Annual Review of 2018 Rates Project No Final Order with Reasons for Decision
 Patrick Wruck Commission Secretary Commission.Secretary@bcuc.com bcuc.com Suite 410, 900 Howe Street Vancouver, BC Canada V6Z 2N3 P: 604.660.4700 TF: 1.800.663.1385 F: 604.660.1102 February 13, 2018 Sent
Terasen Gas Inc. ( Terasen Gas ) Customer Choice Program 2010 Program Summary and Recommendations
 Customer Choice Program 2010 Program Summary and Recommendations") Diane Roy Director, Regulatory Affairs 16705 Fraser Highway Surrey, B.C. V4N 0E8 Tel: (604) 576-7349 Cell: (604) 908-2790 Fax: (604) 576-7074 Email: diane.roy@terasengas.com www.terasengas.com Regulatory
Diane Roy Director, Regulatory Affairs 16705 Fraser Highway Surrey, B.C. V4N 0E8 Tel: (604) 576-7349 Cell: (604) 908-2790 Fax: (604) 576-7074 Email: diane.roy@terasengas.com www.terasengas.com Regulatory
FortisBC Inc. s Preliminary 2011 Revenue Requirements Application for Approval Pursuant to Sections 60 and 61 of the Utilities Commission Act
 Dennis Swanson Director, Regulatory Affairs FortisBC Inc. Suite 00 - Springfield Road Kelowna, BC VY V Ph: (0) -00 Fax: --- regulatory@fortisbc.com www.fortisbc.com October, 00 B- Via Email Original via
Ms. Laurel Ross, Acting Commission Secretary and Director
 B- Diane Roy Director, Regulatory Services Gas Regulatory Affairs Correspondence Email: gas.regulatory.affairs@fortisbc.com Electric Regulatory Affairs Correspondence Email: electricity.regulatory.affairs@fortisbc.com
FEVI DEFERRAL ACCOUNT PEC EXHIBIT A2-3
 ERICA HAMILTON COMMISSION SECRETARY Commission.Secretary@bcuc.com web site: http://www.bcuc.com VIA EMAIL gas.regulatory.affairs@fortisbc.com April 4, 2013 SIXTH FLOOR, 900 HOWE STREET, BOX 250 VANCOUVER,
PNG WEST 2013 REVENUE REQUIREMENTS EXHIBIT A-9
 ERICA HAMILTON COMMISSION SECRETARY Commission.Secretary@bcuc.com web site: http://www.bcuc.com SIXTH FLOOR, 900 HOWE STREET, BOX 250 VANCOUVER, BC CANADA V6Z 2N3 TELEPHONE: (604) 660-4700 BC TOLL FREE:
FortisBC Energy (Vancouver Island) Inc Revenue Requirements and Rates Application
 Inc Revenue Requirements and Rates Application") February 20, 2014 File No.: 241455.00033/15275 Christopher R. Bystrom Direct 604 631 4715 Facsimile 604 632 4715 cbystrom@fasken.com BY ELECTRONIC FILING British Columbia Utilities Commission Sixth Floor,
February 20, 2014 File No.: 241455.00033/15275 Christopher R. Bystrom Direct 604 631 4715 Facsimile 604 632 4715 cbystrom@fasken.com BY ELECTRONIC FILING British Columbia Utilities Commission Sixth Floor,
Please direct any inquiries regarding this matter to the undersigned.
 B- David Bennett General Counsel and Corporate Secretary Regulatory Department FortisBC Inc. 90 Esplanade Box 0 Trail BC VR L Ph: (0) 77 08 Fax: 866 60 9 David.Bennett@fortisbc.com www.fortisbc.com September
DECISION and Order E and Letter L-15-16
 IN THE MATTER OF FortisBC Energy Inc. 2015 Price Risk Management DECISION and Order E-10-16 and Letter L-15-16 June 17, 2016 Before: D. A. Cote, Commissioner/Panel Chair B. A. Magnan, Commissioner R. D.
Financial Statements Year Ended March 31, 2011
 1980 1981 Built in the early 1980s, Revelstoke Generating Station has been powering British Columbia with four generating units for nearly 30 years, with two unit bays remaining empty. As part of BC Hydro
CONSOLIDATED FINANCIAL STATEMENTS 2011
 FINANCIAL RESULTS CONSOLIDATED FINANCIAL STATEMENTS 2011 MANAGEMENT REPORT The consolidated financial statements of British Columbia Hydro and Power Authority (BC Hydro) are the responsibility of management
SCHEDULE and 2019 Budget Assumptions
 SCHEDULE 3.4 2018 and 2019 Budget Assumptions 1 2018-19 Budgets Assumptions 2 3 The following assumptions were used by EGNB in the development of its 2018 and 2019 Budgets: 4 5 Budget Item Assumption 6
FEU COMMON RATES, AMALGAMATION RATE DESIGN RECONSIDERATION PHASE 2 EXHIBIT A-4
 ERICA HAMILTON COMMISSION SECRETARY Commission.Secretary@bcuc.com web site: http://www.bcuc.com VIA EMAIL gas.regulatory.affairs@fortisbc.com July 24, 2013 SIXTH FLOOR, 900 HOWE STREET, BOX 250 VANCOUVER,
FORTISBC INC PERFORMANCE BASED RATEMAKING REVENUE REQUIREMENTS EXHIBIT A-27
 ERICA HAMILTON COMMISSION SECRETARY Commission.Secretary@bcuc.com web site: http://www.bcuc.com VIA EMAIL rhobbs@shaw.ca January 16, 2014 SIXTH FLOOR, 900 HOWE STREET, BOX 250 VANCOUVER, B.C. CANADA V6Z
Revenue Requirement Application 2004/05 and 2005/06. Volume 1. Chapter 2. Consolidated Revenue Requirements and Financial Schedules
 Revenue Requirement Application 00/0 and 00/0 Volume 1 Chapter. Consolidated Revenue Requirements and Financial Schedules Table of Contents LIST OF FIGURES... -IV LIST OF TABLES... -IV LIST OF SCHEDULES...-V
For further information, please contact Guy Leroux at
 BChydro m R GENE IONS Joanna Sofield Chief Regulatory Officer Phone: (604 623-4046 Fax: (604 623-4407 bchyd roregulatorygroup@bchydro.com July 13 2009 Ms. Erica M. Hamilton Commission Secretary British
For further information, please contact Fred James at or by at
 Tom A. Loski Chief Regulatory Officer Phone: 604-623-4046 Fax: 604-623-4407 bchydroregulatorygroup@bchydro.com July 21, 2016 Ms. Laurel Ross Acting Commission Secretary British Columbia Utilities Commission
For further information, please contact Fred James at or by at
 Janet Fraser Chief Regulatory Officer Phone: 604-623-4046 Fax: 604-623-4407 bchydroregulatorygroup@bchydro.com August 30, 2013 Ms. Erica Hamilton Commission Secretary British Columbia Utilities Commission
MANAGEMENT S DISCUSSION AND ANALYSIS OF FINANCIAL CONDITION AND RESULTS OF OPERATIONS
 MANAGEMENT S DISCUSSION AND ANALYSIS OF FINANCIAL CONDITION AND RESULTS OF OPERATIONS For the three and twelve months ended February 8, 2011 The following discussion and analysis of financial condition
Financial Statements. AltaLink, L.P. Years ended December 31, 2010 and 2009
 Financial Statements FINANCIAL STATEMENTS INDEPENDENT AUDITOR S REPORT To the Partners of We have audited the accompanying financial statements of, which comprise the balance sheets as at December 31,
FEI 2017 PRICE RISK MANAGEMENT PLAN EXHIBIT A-6
 Patrick Wruck Commission Secretary Commission.Secretary@bcuc.com bcuc.com Suite 410, 900 Howe Street Vancouver, BC Canada V6Z 2N3 P: 604.660.4700 TF: 1.800.663.1385 F: 604.660.1102 March 8, 2018 Sent via
Doug Slater Director, Regulatory Affairs
 B- Doug Slater Director, Regulatory Affairs Gas Regulatory Affairs Correspondence Email: gas.regulatory.affairs@fortisbc.com Electric Regulatory Affairs Correspondence Email: electricity.regulatory.affairs@fortisbc.com
1. Background. March 7, 2014
 Janet Fraser Chief Regulatory Officer Phone: 604-623-4046 Fax: 604-623-4407 bchydroregulatorygroup@bchydro.com March 7, 2014 Ms. Erica Hamilton Commission Secretary British Columbia Utilities Commission
The following are the comments of Westcoast Energy Inc. ( Westcoast ) with respect to the referenced Application.
 with respect to the referenced Application.") C5-2 KIRSTEN B. JARON Director, Regulatory BC Pipeline and Field Services Divisions Duke Energy Gas Transmission Fifth Avenue Place, East Tower Suite 2600, 425 1 st Street SW Calgary, AB T2P 3L8 Telephone:
C5-2 KIRSTEN B. JARON Director, Regulatory BC Pipeline and Field Services Divisions Duke Energy Gas Transmission Fifth Avenue Place, East Tower Suite 2600, 425 1 st Street SW Calgary, AB T2P 3L8 Telephone:
Audited Financial Statements. March 31, 2007
 Audited Financial Statements March 31, 2007 Vancouver, Canada May 23, 2007 Report of the Office of the Auditor General of British Columbia To the Members of the Board of British Columbia Transmission
For further information, please contact Fred James at or by at
 Janet Fraser Chief Regulatory Officer Phone: 604-623-4046 Fax: 604-623-4407 bchydroregulatorygroup@bchydro.com February 28, 2014 Ms. Erica Hamilton Commission Secretary British Columbia Utilities Commission
On June 10 and July 5, 2013, FEI and FBC, respectively, filed the Applications as referenced above.
 Diane Roy Director, Regulatory Affairs FortisBC Energy 16705 Fraser Highway Surrey, B.C. V4N 0E8 Tel: (604) 576-7349 Fax: (604) 576-7074 www.fortisbc.com Regulatory Affairs Correspondence Email: gas.regulatory.affairs@fortisbc.com
Schedule Revised Financial Statements with notes
 Exhibit A Schedule 5 Schedule 5 2009 Revised Financial Statements with notes Exhibit A Schedule 5 Page 1 of 14 Enbridge Gas New Brunswick Balance Sheet for Regulatory Purposes For the year ended December
COMMUNITY LIVING BRITISH COLUMBIA. Financial Statements. For the year ended March 31, 2009
 Financial Statements AUDITORS' REPORT To the Board of Community Living British Columbia Financial Statements Statement of Management s Responsibility for Financial Reporting The financial statements of
For further information, please contact Fred James at or by at
 Janet Fraser Chief Regulatory Officer Phone: 604-623-4046 Fax: 604-623-4407 bchydroregulatorygroup@bchydro.com December 6, 2011 Ms. Alanna Gillis Acting Commission Secretary British Columbia Utilities
Creative Energy Response to BCOAPO IR 1 May 30, 2018
 B-8 Creative Energy Response to BCOAPO IR 1 May 30, 2018 1.0 Reference: Exhibit B1, Application, page 1, 2017 Load Forecast The applied for method for setting rates for Steam customers is simple; it begins
British Columbia Hydro and Power Authority
 2016/17 SECOND QUARTER REPORT MANAGEMENT S DISCUSSION AND ANALYSIS This Management s Discussion and Analysis (MD&A) reports on British Columbia Hydro and Power Authority s (BC Hydro or the Company) consolidated
British Columbia Hydro and Power Authority
 2017/18 THIRD QUARTER REPORT MANAGEMENT S DISCUSSION AND ANALYSIS This Management s Discussion and Analysis (MD&A) reports on British Columbia Hydro and Power Authority s (BC Hydro or the Company) consolidated
School District No. 85 (Vancouver Island North)
") Audited Financial Statements of School District No. 85 (Vancouver Island North) June 30, 2018 September 10, 2018 9:06 September 10, 2018 9:06 School District No. 85 (Vancouver Island North) June 30, 2018
Audited Financial Statements of School District No. 85 (Vancouver Island North) June 30, 2018 September 10, 2018 9:06 September 10, 2018 9:06 School District No. 85 (Vancouver Island North) June 30, 2018
AltaGas Utilities Inc.
 Decision 23898-D01-2018 2019 Annual Performance-Based Regulation Rate Adjustment Filing December 20, 2018 Alberta Utilities Commission Decision 23898-D01-2018 2019 Annual Performance-Based Regulation Rate
PACIFIC NORTHERN GAS (N.E.) LTD. (Fort St. John/Dawson Creek Division) 2005 Revenue Requirements Application to the B.C. Utilities Commission
 LTD. (Fort St. John/Dawson Creek Division) 2005 Revenue Requirements Application to the B.C. Utilities Commission") PACIFIC NORTHERN GAS (N.E.) LTD. (Fort St. John/Dawson Creek Division) 2005 Revenue Requirements Application to the B.C. Utilities Commission December 17, 2004 Pacific Northern Gas (N.E.) Ltd. (Fort St.
PACIFIC NORTHERN GAS (N.E.) LTD. (Fort St. John/Dawson Creek Division) 2005 Revenue Requirements Application to the B.C. Utilities Commission December 17, 2004 Pacific Northern Gas (N.E.) Ltd. (Fort St.
British Columbia Hydro and Power Authority
 2017/18 SECOND QUARTER REPORT MANAGEMENT S DISCUSSION AND ANALYSIS This Management s Discussion and Analysis (MD&A) reports on British Columbia Hydro and Power Authority s (BC Hydro or the Company) consolidated
June 22, British Columbia Utilities Commission Sixth Floor 900 Howe Street Vancouver, B.C. V6Z 2N3. Ms. Erica M. Hamilton, Commission Secretary
 Diane Roy Director, Regulatory Affairs - Gas FortisBC Energy Inc. B1-7 16705 Fraser Highway Surrey, B.C. V4N 0E8 Tel: (604) 576-7349 Cell: (604) 908-2790 Fax: (604) 576-7074 Email: diane.roy@fortisbc.com
BC Hydro FIrST QUArTEr report FISCAL 2015
 BC Hydro FIRST QUARTER REPORT FISCAL 2015 BC Hydro & Power Authority Management S Discussion and Analysis This Management s Discussion and Analysis (MD&A) reports on British Columbia Hydro and Power Authority
Financial Statements For the years ended December 31, 2015 and 2014
 FORTISALBERTA INC. Financial Statements MANAGEMENT S REPORT The accompanying annual financial statements of FortisAlberta Inc. (the Corporation ) have been prepared by management, who are responsible for
School District No. 85 (Vancouver Island North)
") Audited Financial Statements of School District No. 85 (Vancouver Island North) June 30, 2017 September 01, 2017 15:49 School District No. 85 (Vancouver Island North) June 30, 2017 Table of Contents Management
Audited Financial Statements of School District No. 85 (Vancouver Island North) June 30, 2017 September 01, 2017 15:49 School District No. 85 (Vancouver Island North) June 30, 2017 Table of Contents Management
School District Statement of Financial Information (SOFI) School District No. 85 (Vancouver Island North) Fiscal Year Ended June 30, 2017
 School District No. 85 (Vancouver Island North) Fiscal Year Ended June 30, 2017") School District Statement of Financial Information (SOFI) School District No. 85 (Vancouver Island North) Fiscal Year Ended June 30, 2017 Table of Contents. Documents are arranged in the following order:
School District Statement of Financial Information (SOFI) School District No. 85 (Vancouver Island North) Fiscal Year Ended June 30, 2017 Table of Contents. Documents are arranged in the following order:
Report of Management. Auditors Report
 Report of Management The consolidated financial statements and all the information in the 2007 annual report are the responsibility of management. The financial statements have been prepared in accordance
MANAGEMENT S REPORT. Financial Statements December 31, 2011
 Financial Statements December 31, 2011 MANAGEMENT S REPORT The accompanying financial statements of FortisAlberta Inc. (the Corporation ) have been prepared by management, who are responsible for the integrity
Diane Roy Vice President, Regulatory Affairs
 B- Diane Roy Vice President, Regulatory Affairs Gas Regulatory Affairs Correspondence Email: gas.regulatory.affairs@fortisbc.com Electric Regulatory Affairs Correspondence Email: electricity.regulatory.affairs@fortisbc.com
IN THE MATTER OF the Utilities Commission Act, R.S.B.C. 1996, Chapter 473. and
 BRITISH C OLUMBIA U TILITIES C OMMISSION O RDER NUMBER G-52-06 SIXTH FLOOR, 900 HOWE STREET, BOX 250 VANCOUVER, B.C. V6Z 2N3 CANADA web site: http://www.bcuc.com TELEPHONE: (604) 660-4700 BC TOLL FREE:
FEI Annual Review of 2018 Rates
 B-10 FEI Annual Review of 2018 Rates Workshop October 17, 2017 Agenda PBR Overview Diane Roy Vice President, Regulatory Affairs Revenue Requirements & Rates Rick Gosselin Manager, Cost of Service Demand
Attached is BC Hydro s annual filing of the Report on Demand-Side Management Activities for the 12 months ending March 31, 2012.
 Janet Fraser Chief Regulatory Officer Phone: 60-6-06 Fax: 60-6-07 bchydroregulatorygroup@bchydro.com July 0, 01 Ms. Erica Hamilton Commission Secretary British Columbia Utilities Commission Sixth Floor
b r e a k i n g gr o u n d c o n s o l i d at e d fi n a n c i a l stat e m e n t s
 SaskEnergy Annual Report b r e a k i n g gr o u n d 2008 c o n s o l i d at e d fi n a n c i a l stat e m e n t s 46 Management s Responsibility for Financial Statements The accompanying financial statements
Ms. Erica M. Hamilton, Commission Secretary. FortisBC Energy Utilities ("FEU") Common Delivery Rates Methodology Application, Project No.
 Common Delivery Rates Methodology Application, Project No.") D Bff!-,~y B L:ghtfoot' Cbnstopher P \\'e
D Bff!-,~y B L:ghtfoot' Cbnstopher P \\'e
School District No. 27 (Cariboo-Chilcotin)
") Audited Financial Statements of School District No. 27 (Cariboo-Chilcotin) June 30, 2018 September 25, 2018 15:30 School District No. 27 (Cariboo-Chilcotin) June 30, 2018 Table of Contents Management Report...
Audited Financial Statements of School District No. 27 (Cariboo-Chilcotin) June 30, 2018 September 25, 2018 15:30 School District No. 27 (Cariboo-Chilcotin) June 30, 2018 Table of Contents Management Report...
INTERIM MANAGEMENT DISCUSSION and ANALYSIS For the Three and Six Month Periods Ended June 30, 2011
 Second Quarter 2011 INTERIM MANAGEMENT DISCUSSION and ANALYSIS For the Three and Six Month Periods Ended June 30, 2011 Dated August 3, 2011 The following interim Management Discussion and Analysis ( MD&A
BRITISH COLUMBIA ASSESSMENT AUTHORITY
 Financial Statements of BRITISH COLUMBIA ASSESSMENT AUTHORITY Financial Statements Page Financial Statements Management s Responsibility for the Financial Statements... 1 Independent Auditors Report...
FortisBC Inc. (FBC) Application for Approval of Demand Side Management (DSM) Expenditures for 2015 and 2016 FBC Final Submission
 Application for Approval of Demand Side Management (DSM) Expenditures for 2015 and 2016 FBC Final Submission") Dennis Swanson Director, Regulatory Affairs FortisBC Inc. Suite 100 1975 Springfield Road Kelowna, BC V1Y 7V7 Tel: (250) 717-0890 Fax: 1-866-335-6295 www.fortisbc.com Regulatory Affairs Correspondence
Dennis Swanson Director, Regulatory Affairs FortisBC Inc. Suite 100 1975 Springfield Road Kelowna, BC V1Y 7V7 Tel: (250) 717-0890 Fax: 1-866-335-6295 www.fortisbc.com Regulatory Affairs Correspondence
JUSTICE INSTITUTE OF BRITISH COLUMBIA
 Financial Statements of JUSTICE INSTITUTE OF BRITISH COLUMBIA ABCD KPMG LLP Chartered Accountants Box 10426, 777 Dunsmuir Street Vancouver BC V7Y 1K3 Telephone (604) 691-3000 Telefax (604) 691-3031 Internet
EB Union Gas January 1, 2019 QRAM Application
 December 11, 2018 Ms. Kirsten Walli Board Secretary Ontario Energy Board 2300 Yonge Street, 27 th Floor Toronto, ON M4P 1E4 Dear Ms. Walli: RE: EB-2018-0315 Union Gas January 1, 2019 QRAM Application Enclosed
EB Union Gas Limited October 1, 2017 QRAM Application
 September 12, 2017 Ms. Kirsten Walli Board Secretary Ontario Energy Board 2300 Yonge Street, 27 th Floor Toronto, ON M4P 1E4 Dear Ms. Walli: RE: EB-2017-0278 Union Gas Limited October 1, 2017 QRAM Application
BC HYDRO F2017 F2019 REVENUE REQUIREMENTS EXHIBIT A-29
 Patrick Wruck Commission Secretary Commission.Secretary@bcuc.com Website: www.bcuc.com Sixth Floor, 900 Howe Street Vancouver, BC Canada V6Z 2N3 TEL: (604) 660-4700 BC Toll Free: 1-800-663-1385 FAX: (604)
PNG-West 2011 Revenue Requirements Application Response to BCOAPO Information Request No. 1 Project No
 B-6 Craig P. Donohue Director, Regulatory Affairs & Gas Supply Pacific Northern Gas Ltd. Suite 950 1185 West Georgia Street Vancouver, BC V6E 4E6 Tel: (604) 691-5673 Tel: (604) 697-6210 Email: cdonohue@png.ca
Shaw Communications Inc. MANAGEMENT S RESPONSIBILITY FOR FINANCIAL STATEMENTS AND REPORT ON INTERNAL CONTROL OVER FINANCIAL REPORTING August 31, 2008
 MANAGEMENT S RESPONSIBILITY FOR FINANCIAL STATEMENTS AND REPORT ON INTERNAL CONTROL OVER FINANCIAL REPORTING August 31, November 25, MANAGEMENT S RESPONSIBILITY FOR FINANCIAL REPORTING The accompanying
ENMAX POWER CORPORATION Distribution AUC Rule 005: ANNUAL OPERATIONS FINANCIAL AND OPERATING REPORTING For the Year Ended December 31, 2017 $M
 ENMAX POWER CORPORATION Distribution AUC Rule 005: ANNUAL OPERATIONS FINANCIAL AND OPERATING REPORTING For the Year Ended December 31, 2017 $M TABLE OF CONTENTS Schedule Schedule Name Page Sch 1 Summary
Management s Responsibility and Certification
 Management s Responsibility and Certification Management is responsible for the integrity, consistency and reliability of the financial statements and other information presented in the annual report.
Re: FortisBC Inc. Application for Approval of Demand Side Management Expenditures for the Period of 2015 and 2016
 ERICA HAMILTON COMMISSION SECRETARY Commission.Secretary@bcuc.com web site: http://www.bcuc.com VIA EMAIL August 22, 2014 SIXTH FLOOR, 900 HOWE STREET, BOX 250 VANCOUVER, BC CANADA V6Z 2N3 TELEPHONE: (604)
Shaw Communications Inc. MANAGEMENT S RESPONSIBILITY FOR FINANCIAL STATEMENTS AND REPORT ON INTERNAL CONTROL OVER FINANCIAL REPORTING August 31, 2010
 MANAGEMENT S RESPONSIBILITY FOR FINANCIAL STATEMENTS AND REPORT ON INTERNAL CONTROL OVER FINANCIAL REPORTING August 31, November 5, MANAGEMENT S RESPONSIBILITY FOR FINANCIAL REPORTING The accompanying
November 10, British Columbia Utilities Commission 6 th Floor, 900 Howe Street Vancouver, BC V6Z 2N3
 Tom A. Loski Chief Regulatory Officer November 10, 2009 16705 Fraser Highway Surrey, B.C. V4N 0E8 Tel: (604) 592-7464 Cell: (604) 250-2722 Fax: (604) 576-7074 Email: tom.loski@terasengas.com www.terasengas.com
November 16, British Columbia Utilities Commission 6th Floor, 900 Howe Street Vancouver, BC V6Z 2N3
 Diane Roy Director, Regulatory Affairs - Gas FortisBC Energy Inc. FORTISBC ENERGY BFI COMPLIANCE FILING EXHIBIT B-1 November 16, 2012 16705 Fraser Highway Surrey, B.C. V4N 0E8 Tel: (604) 576-7349 Cell:
Financials April 1, 2009 March 31, Management s Discussion and Analysis 23. Management Report 40
 Financials 2010 April 1, 2009 March 31, 2010 Management s Discussion and Analysis 23 Management Report 40 Report of the Auditor General of British Columbia 41 Audited Financial Statements 42 Financial
Second Quarter. Third Quarter 2012
 Second Quarter 2014 Third Quarter 2012 Dear Shareholder: Fortis achieved second quarter net earnings attributable to common equity shareholders of $47 million, or $0.22 per common share, compared to $54
444 Seventh Avenue S.W. Calgary, Alberta T2P 0X8. Attention: Ms. Anne-Marie Erikson, Acting Secretary of the Board
 450-1 st Street S.W. Calgary, Alberta, Canada T2P 5H1 Tel: (403) 920-2046 Fax: (403) 920-2347 Email: murray_sondergard@transcanada.com February 26, 2010 National Energy Board 444 Seventh Avenue S.W. Calgary,
FORENSIC PSYCHIATRIC SERVICES COMMISSION
 Financial Statements FORENSIC PSYCHIATRIC SERVICES COMMISSION KPMG LLP Chartered Accountants PO Box 10426 777 Dunsmuir Street Vancouver BC V7Y 1K3 Canada Telephone (604) 691-3000 Fax (604) 691-3031 Internet
Audited Financial Statements For the years ended December 31, 2018 and 2017
 FORTISALBERTA INC. Audited Financial Statements Deloitte LLP 700, 850 2 Street SW Calgary, AB T2P 0R8 Canada Independent Auditor s Report Tel: 403-267-1700 Fax: 587-774-5379 www.deloitte.ca To the Shareholder
Financial Statements (Expressed in thousands of dollars) FIRST NATIONS HEALTH AUTHORITY
 FIRST NATIONS HEALTH AUTHORITY") Financial Statements (Expressed in thousands of dollars) FIRST NATIONS HEALTH AUTHORITY KPMG LLP PO Box 10426 777 Dunsmuir Street Vancouver BC V7Y 1K3 Canada Telephone (604) 691-3000 Fax (604) 691-3031
Financial Statements (Expressed in thousands of dollars) FIRST NATIONS HEALTH AUTHORITY KPMG LLP PO Box 10426 777 Dunsmuir Street Vancouver BC V7Y 1K3 Canada Telephone (604) 691-3000 Fax (604) 691-3031
BC HYDRO F2012 F2014 REVENUE REQUIREMENTS EXHIBIT A2 8
 ERICA M. HAMILTON COMMISSION SECRETARY Commission.Secretary@bcuc.com web site: http://www.bcuc.com VIA EMAIL bchydroregulatorygroup@bchydro.com March 31, 2011 SIXTH FLOOR, 900 HOWE STREET, BOX 250 VANCOUVER,