TABLE OF CONTENTS TRANSPORTATION FUNDING SOURCES AND APPROPRIATION USES...
|
|
|
- Sabrina Green
- 5 years ago
- Views:
Transcription

1
2
3
4
5 TABLE OF CONTENTS TRANSPORTATION FUNDING SOURCES AND APPROPRIATION USES... 1 TRANSPORTATION FUNDING SOURCES STATE... 4 FEDERAL... 8 BONDS TRANSPORTATION APPROPRIATION USES OPERATING CAPITAL STATE INFRASTRUCTURE BANK LOAN PROGRAM BACKGROUND ACCOUNTS FUND BALANCES BANK LOANS AND BONDS AVAILABLE BALANCES LOAN/BOND LOCATION MAP PROJECTS DESCRIPTIONS PROJECT LOCATIONS APPENDIX OHIO DEPARTMENT OF TRANSPORTATION, CENTRAL OFFICE AND DISTRICT LOCATIONS STATE MOTOR FUEL TAX SOURCE AND DISTRIBUTION STATE VEHICLE REGISTRATION FEES FEDERAL AID HIGHWAY APPORTIONMENT FORMULAS FEDERAL TRANSIT PROGRAM APPORTIONMENT FORMULAS MAINTENANCE RESPONSIBILITIES CONTRACTS AWARDED IN OHIO S PUBLIC TRANSPORTATION SYSTEMS MAP OHIO S GENERAL AVIATION AIRPORTS MAP OHIO S RAILROAD SYSTEM MAP TRANSPORTATION FUNDING SOURCES... 47
6
7 Transportation Funding Sources and Appropriation Uses

8 Transportation Funding Sources and Appropriation Uses ODOT has three primary funding sources: State, Federal and Bond Revenue. These sources are used by ODOT to preserve the existing state infrastructure, provide funding for local infrastructure, complete major/new projects, provide funding for public transit, aviation and rail projects and cover the department s operating costs. Additionally, funds are provided through the SIB and local government participation. (1) Actual usage of legislatively approved appropriations for that fund year, established in the approved Legislative Budget, without regard to when the activity occurred. e = estimated 1
 All Fiscal Years had expenditures less than $500,000 and will not show on this chart due to rounding.")
9 Transportation Funding Sources and Appropriation Uses (1) Actual usage of legislatively approved appropriations for that fund year, established in the approved Legislative Budget, without regard to when the activity occurred. (2) All Fiscal Years had expenditures less than $500,000 and will not show on this chart due to rounding. (3) The Non Highway Operating uses consist of GRF, State Special Revenue (SSR), and FTA funding sources. 2
10 Transportation Funding Sources and Appropriation Uses STATEMENT OF CASH BALANCES ACTIVITY BETWEEN JULY 1st AND JUNE 30th FOR FISCAL YEARS 2014 AND 2015 (Without Regard to Fund Year) (1) (Amounts Expressed in Thousands) Net Change % Changed FY 2014 FY / / 2015 BEGINNING CASH BALANCE $1,539,164 $1,625,140 $85, % REVENUE AND RECEIPTS Bond Revenue (Includes Premiums/Discounts) $294,094 $275,094 ($18,999) 6.5% Motor Vehicle Fuel Tax (net of all draws) $1,001,734 $978,432 ($23,303) 2.3% Motor Vehicle Fuel Use Tax IFTA $21,804 $35,150 $13, % Turnpike Bonds $54,517 $221,698 $167, % Registrations, License fees, Permits $70,498 $68,900 ($1,598) 2.3% Investment Income $4,201 $6,144 $1, % Federal Aid (Highway Related Receipts) $1,455,272 $1,338,087 ($117,185) 8.1% Federal Aid Stimulus (Highway, Forest Highway, Transit) $28,729 $1,806 ($26,923) 93.7% Federal Aid (Transit, Aviation, and Rail) $34,475 $29,467 ($5,007) 14.5% Local Government Participation $71,626 $74,892 $3, % SIB Loan Revenue (Repayments and Fees) $86,012 $87,358 $1, % Rail Loan Revenue (Repayments and Fees) $470 $724 $ % From General Revenue $12,542 $9,380 ($3,162) 25.2% Other ODOT Income $53,869 $61,619 $7, % GRAND TOTAL REVENUE AND RECEIPTS: $3,189,843 $3,188,751 ($1,092) 0.0% TOTAL CASH AVAILABLE $4,729,007 $4,813,891 $84, % DISBURSEMENTS OPERATING PERSONAL SERVICE Payroll (Includes Fringe, Overtime, Early Retirement, etc.) $411,725 $402,512 ($9,213) 2.2% Purchased Personal Services $21,265 $29,094 $7, % Other (Tuition, Seminars, Awards) $1,222 $118 ($1,104) 90.3% Subtotal Personal Service $434,212 $431,724 ($2,488) 0.6% SUPPLIES AND MAINTENANCE General Maintenance Data Processing and Communication Equipment (Maintenance and Supplies) $5,803 $4,860 ($944) 16.3% Motor Vehicle and Aircraft Expense (Fuel, Lubricants, Tires, Parts, Repairs, etc.) $53,675 $48,257 ($5,418) 10.1% Utilities (Natural Gas, Oil, Electric, Water/Sewage, Telephone) $22,232 $23,030 $ % Building Maintenance (Repairs, Housekeeping, Supplies, etc.) $14,615 $11,305 ($3,310) 22.6% Office Supplies and Equipment (Repairs, Maintenance, etc.) $2,427 $2,672 $ % All Other General Maintenance and Supplies $21,257 $19,611 ($1,647) 7.7% Subtotal General Maintenance $120,009 $109,735 ($10,274) 8.6% Roadway Maintenance Lands and Buildings (includes Rest Area Janitorial) $41,831 $68,539 $26, % Roadway and Traffic Control Materials $22,660 $24,650 $1, % Roads, Bridges, Trails, Walks, Ground Structures (includes Landscaping) $2,435 $2,834 $ % Snow & Ice Materials $42,383 $78,536 $36, % Subtotal Roadway Maintenance $109,309 $174,559 $65, % (2) EQUIPMENT Rolling Stock (Trucks, Loaders, Trailers, Testing, Aerial, etc.) $29,664 $38,147 $8, % Data Processing and Communication $12,143 $7,264 ($4,880) 40.2% Motor Vehicles/Aircraft (Autos, Vans, Buses, Trucks 1 ton, Airplanes, etc.) $4,772 $13,942 $9, % Other (Not Otherwise Listed) $7,731 $7,056 ($674) 8.7% Subtotal Equipment $54,310 $66,409 $12, % CAPITAL HIGHWAY CONSTRUCTION System Preservation $1,408,397 $1,261,036 ($147,361) 10.5% Local Preservation $259,484 $321,273 $61, % Special Federal $228,419 $56,294 ($172,125) 75.4% Major / New $96,463 $332,410 $235, % GARVEE Bonds $55,652 $78,273 $22, % Rail Crossings / Transload Facilities $77,993 $13,465 ($64,527) 82.7% Statewide Programs $17,089 $244,470 $227, % Subtotal Highway Construction $2,143,496 $2,307,221 $163, % SUBSIDIES (Grants to Local Governments) Public Transportation $38,272 $33,859 ($4,413) 11.5% Aviation $2,355 $1,324 ($1,032) 43.8% Rail $2,467 $3,278 $ % Other $1,575 $5,317 $3, % Subtotal Subsidies $44,668 $43,778 ($891) 2.0% LOANS (Governmental/Non Governmental Entities) $19,450 $26,148 $6,699 $ 34.4% BOND PAYMENTS (Principal and Interest) $168,333 $170,922 $2, % MISCELLANEOUS $5,053 $3,157 ($1,896) 37.5% REFUNDS $5,026 $4,801 ($225) 4.5% GRAND TOTAL DISBURSEMENTS: $3,103,867 $3,338,456 $234, % ENDING CASH BALANCE: $1,625,140 $1,475,436 ($149,704) 9.2% (1) All activity posted between the first day of the fiscal year (July 1) and the last day of the fiscal year (June 30) without regard to the fund year appropriated. (2) The Increase in FY 15 is due to the purchase of salt. 3
11 Page Intentionally Left Blank
12 Transportation Funding Sources


13 Transportation Funding Sources: State The State Motor Fuel tax comprises approximately 87% of the total state revenue ODOT receives. The chart below represents the distribution of the 28 per gallon State Motor Fuel Tax. One penny of Motor Fuel Tax equates to approximately $64.2 million in revenue which would be distributed as shown below. The 28 fuel tax is comprised of a sum of five separate levies. After 2% is allocated to the Highway Operating Fund, the actual amount necessary to pay motor fuel tax refunds is transferred to the Tax Refund Fund, 0.275% is allocated to the Department of Taxation, 0.875% is allocated to the Waterways Safety Fund and 0.125% to the Wildlife Boater Angler Fund. The balance of the proceeds are distributed as follows: * See appendix (p 35) for explanation. First ORC section listed enacts tax, second ORC section enacts distribution. ** % share allocation shown is prior to distribution of special formula allocation for large townships, that requires equal reduction from state, municipal, and county share. For FY 2015, this was about $6.7M total. In addition to revenue from the cents per gallon tax, $174 M from the former Highway Patrol Draw was added to this section and distributed to local governments in proportion to the % shares shown. Of the 28 tax per gallon sold, ODOT receives approximately per gallon for use on construction projects, all associated operating costs and debt retirement. Of this, ODOT has dedicated approximately 2.18 per gallon to paying down the state bond debt. 4


14 Transportation Funding Sources: State The graph above illustrates the economic trends in motor fuel usage over the past 20 years: Overall motor fuel gallons consumed had been relatively flat for FY2004 to FY2007. Between FY2007 and FY2009, there was a 4.2% decrease in consumption. FY2013 consumption was down 1.3%. In FY15, consumption is up by 2.3% as compared to FY14, and has recovered to FY2007 levels. 5


15 Transportation Funding Sources: State The above graph illustrates the fact that overall gasoline consumption had gradually grown, along with the gradual growth in price/gallon, through FY07. However, in FY08, the sharp rise in the average price per gallon of gas, along with a struggling economy, affected gasoline consumption. The average price rose from approximately $1.48 in FY03, to $3.20 in FY08, and dropped to $2.65 per/gallon in FY10, and has continued to rise to a maximum of $3.60 per gallon in FY13, as gasoline consumption continues to fall year by year. In FY15, prices dropped and consumption increased. The graph above illustrates the effect that fuel price fluctuations have on the number of miles driven on Ohio roadways. As prices rise sharply, miles traveled decreases. Note that the percent change is for a 12 month period, as compared to the previous 12 month period. During FY11, fuel prices rose steadily during the year, and traffic volume decreases as expected. During FY12 FY14, prices remained relatively high, and miles traveled declined throughout the end of FY14. A dramatic drop in fuel prices during the summer and winter of 2015, led to a spike in miles traveled during
 Transportation Funding Sources:")
16 FY2015 State Highway Funding Sources and Allocations Total Funds $2.871 Billion (All amounts in Millions) Transportation Funding Sources: State 7

17 Transportation Funding Sources: Federal Along with the State Motor Fuel Tax, there is Federal Motor Fuel Tax collected that contributes to the preservation, rebuilding, and expansion of the nation's highway system, as well as providing funding for public transit systems. From 2008 to 2015, there have also been $73.3 Billion in Federal General Revenue Transfers into the Highway Trust Fund. Below is how both sources are distributed, based on percent share of contributions to Highway Trust Fund. $1.76 Billion Federal Funding Ohio's FY 2015 Federal Highway Formula funding levels under the current full year extension of MAP 21 is based on FY 2014 Federal funding levels provided to each state under MAP 21. For FY 2014, each state was guaranteed apportionment levels at 95% of their dollars contributed to the Highway Trust Fund. Apportionments for 4 states were adjusted upwards to meet this 95% requirement, resulting in apportionments in all other states being reduced proportionately. (See page 37). Prior to FY 2013, using Federal Highway Formulas in place under old SAFETEA LU Authorization, FY 2015 would have been based on Federal excise tax revenue from 6.29 billion gallons of motor fuel consumed in Ohio during Federal FY 2013 Motor Fuel Tax revenue attributed to these Ohio gallons totaled about $1.2 billion of the total $32.0 billion (3.79%) in the Highway Account of the Highway Trust Fund, and about $174.5 million (3.75%) of the total $4.6 billion in the Mass Transit Account. In FY 2015, Ohio received $1.4 billion in funding from the Highway Account and about $174.1 million from the Mass Transit Account. Because Ohio did not receive a full 3.79% share of the available funding, $97 million of FHWA funding and $126 million of Federal Transit funding was provided to other states or used by FHWA for other purposes. $836 Million for Ohio DOT Highway Programs not Earmarked Funds used for ODOT's Interstate Maintenance, Major New, Safety and System Preservation Programs. $144 Million for Debt Service This represents the Federal funding needed for the 2015 debt service on the GARVEE bonds issued for various Major New, Major Rehabilitation, Major Bridge, and Ohio Bridge Partnership Projects. $348 Million for Local Programs Although ODOT was required to pass through about $107 million in Federal Funding to local governments, by discretion ODOT provided $348 million to local governments, including funding for Metropolitan Planning Organizations, city and county pavements and bridges, and various enhancement projects. $27 million is used for various paving projects on state routes within urban areas, and $20 million was provided for Local Public Transit Assistance. (See page 9 for details) $174 Million for Mass Transit About $174 million, in total, was made available to Ohio for Mass Transit Programs. Of the $174 million, the full amount was from the Mass Transit Account of the Federal Highway Trust Fund. No funding was directly from the Federal General Fund. $24 Million for Emergency Relief FHWA provides funds for emergency repairs and permanent repairs on Federal aid highways that have suffered serious damage as a result of natural disasters or catastrophic failure from an external cause. $229 Million Not Available to Ohio DOT Not all federal trust fund excise tax revenues attributed to Ohio are returned to Ohio. As a result, about $97 million from the Highway Account and $126 million from the Mass Transit Account were provided to other states or used by FHWA for other purposes. Not all of the Federal Motor Fuel tax is distributed to the Highway Trust Fund. One tenth of one cent per gallon of all fuel sold is distributed to the Leaking Underground Storage Tank Fund. For Ohio, this means $6 million of Motor Fuel Taxes were diverted away from Highway & Transit programs. 8
 and Transportation Alternatives (TA) funds to Ohio s urban areas.")
18 Transportation Funding Sources: Federal $199.4 Million MPO / Large Cities ODOT was required to pass through about $107 million in Surface Transportation Program (STP) and Transportation Alternatives (TA) funds to Ohio s urban areas. In addition to the required suballocation, ODOT also provides additional STP funds, Congestion Mitigation & Air Quality funds, and Transportation Alternatives funds, which in total, amounts to almost twice the required amount. $4 Million Safe Routes to School The purpose of this program is to enable and encourage children, including those with disabilities, to walk and bicycle to school; to make walking and bicycling to school safe and more appealing; and to facilitate the planning, development and implementation of projects that will improve safety, and reduce traffic, fuel consumption, and air pollution in the vicinity of schools. $27 Million Urban Paving Initiative This annual allocation is provided to ODOT s districts to pay for resurfacing on state routes within municipalities. The districts prioritize projects based on pavement condition ratings. $9.5 Million Small Cities This program provides funds by application to Ohio s 58 small cities (between 5,000 to 25,000 population) for road, safety and signal projects on the Federal aid system. $20 Million Local Public Transit Assistance Funds provided in FY15 consist of Transit Preservation Partnership ($14m) and Urban Transit Programs, ($6m), to provide federal funds to maintain a sound state of transit systems in Ohio, and to help urban transit agencies with operational costs. $10.5 Million Transportation Alternatives Funds are available for ODOT owned/maintained facilities, and to local governments outside MPOs by an annual application process for projects that enhance surface transportation sites. Funding categories are Historic & Archaeological, Scenic & Environmental, and Bicycle & Pedestrian. $34.7 Million County Local Bridge ODOT passes through money to counties that must be spent on off system bridges. This amounts to about $29 million for FY15, and then adds additional bridge funds to help counties eliminate bridge deficiencies. These funds are administered by the County Engineer s Association of Ohio. $28.3 Million County STP Funds are provided to counties for projects that can be used for road and bridge work, and safety projects. These funds are administered by the County Engineer s Association of Ohio. $13.5 Million Municipal Bridge Municipal corporations may apply for funds for bridge replacement or bridge rehabilitation. There are approximately 1,300 eligible bridges. 9
19 The map below shows the Donor/Donee states for the Highway Account of the Highway Trust Fund. Transportation Funding Sources: Federal Donor states receive less than 100% share relative to their share of contributions to the federal highway trust fund. Donee states receive greater than 100% share relative to their share of contribution to the fund. Calculations compare the share of the total funding each state received through the apportioned programs with the estimated share of the national total that each state contributed in the corresponding revenue year. Congress defined this method in SAFETEA LU as the one FHWA uses for calculating rates of return for the Highway Account. This is not a "cents on the dollar" rate of return. The map below shows the range of "cents per dollar" rates of return for each State for the Formula Obligation Limitation provided from the Highway Account as compared to excise tax contributions into the Highway Account. Most states have recently been receiving formula obligation limitation in excess of their excise tax contributions, requiring the transfer of a total of $62.5 Billion in GRF and Leaking Underground Storage Tank Fund transfers into the Highway Account over the last 7 years. Calculations compare the dollars of FY15 formula obligation limitation each state received from the Highway Account, to the FY13 estimated contribution into the Highway Account. Source: Federal Highway Administration 10

, and Federal Highway bonds are issued under the authority of Section 13, Article VIII of the Ohio Constitution (ORC Section 5531.10).")
20 Transportation Funding Sources: Bonds ODOT uses two types of Highway Bonds: those that are retired with State Highway Revenue, and those that are retired with a combination of Federal Highway Revenue and State Highway Revenue. Both types of bonds are issued by the Office of the State Treasurer. Currently, ODOT State Highway bonds are issued under the authority of Section 2m, Article VIII, of the Ohio Constitution (ORC Section thru ), and Federal Highway bonds are issued under the authority of Section 13, Article VIII of the Ohio Constitution (ORC Section ). The current authority in Section 2m allows no more than $220 million of State Highway Capital Improvement Bonds to be issued in any fiscal year, plus any unused authority from prior years, and not more than $1.2 billion in principal amount thereof can be outstanding at any one time. Debt Service draws on State Motor Fuel Tax Revenues for debt owed in any one fiscal year begins with September of that fiscal year. Highway Capital Improvement Bonds are issued for the purpose of acquisition, construction, reconstruction, expansion, improvement, planning and equipping of highways, including those on the state highway system and urban extensions thereof, those within or leading to public parks or recreation areas, and those within or leading to municipal corporations, and for participation in such highway capital improvements with municipal corporations, counties, townships, or other governmental entities as designated by law. The American Reinvestment & Recovery Act (ARRA) provided for provisions that allowed state and local governments to take advantage of a new federal subsidy that provided for reimbursement of up to 35% of the total annual interest costs paid. This provision is known as Build America Bonds (BABs) the intent of which was to encourage state and local investment to further advance the economic recovery. ODOT had one state bond issuance in Fiscal Year 2010 which took full advantage of the BABs subsidy. In addition, ODOT had one State and one Federal bond issuance in Fiscal Year 2011 that took partial advantage of the BABs subsidy. 11


21 Transportation Funding Sources: Bonds ODOT S policy regarding State Bond Debt is to have no more than 20% of State Revenue dedicated to Debt Service. 12


22 Transportation Funding Sources: Bonds The second type of bonds is GARVEE Bonds, Federal Grant Anticipation Revenue Vehicles. A GARVEE bond is a debt financing instrument authorized to receive Federal reimbursement of debt service and related financing costs under Section 122 of Title 23, United States Code. GARVEEs can be issued by a state, a political subdivision of a state, or a public authority. States can receive Federal aid reimbursements for a wide array of debt related costs incurred in connection with an eligible debt financing instrument, such as a bond, note, certificate, mortgage, or lease. Reimbursable debt related costs include interest payments, retirement of principal and any other cost incidental to the sale of an eligible debt instrument. * The reason for the upward trend in Federal Bonds Outstanding is due to the Department s initiative to increase GARVEE Bond sales in Fiscal Years to save costs due to higher than normal construction inflation projections. ** The debt service dollar amount is based on the debt service payment schedule and is not reduced by proceeds from bond premiums or investment income earned. In addition, it includes both the state portion and federal portions of the GARVEE debt service. ODOT S policy regarding Federal Bond Debt is to have no more than 20% of Federal Revenue dedicated to Debt Service. 13

23 Transportation Funding Sources: Bonds A portion of State and Federal Motor Fuel Tax revenue is used to pay down ODOT s total bond debt (principal and interest). At the end of FY 2015, ODOT had approximately $1.9 billion dollars in outstanding principal and interest, where 51% represents the state bond debt and 49% represents federal bond debt. The vast majority of the bond issuances occur in the second and third years after appropriations are placed into the budget. 14


24 Transportation Funding Sources: Operating ODOT s business plan has focused on limiting the growth of operating expenses in order to redirect additional resources to ODOT s capital program or other priorities of the Department. The decrease in FY 15 payroll and personal service is the result of less ODOT employees. Ohio s snow and ice season was more severe than normal, and the price of salt was at a premium. Both components contributed to the overall increase in the Snow and Ice expense. The Department s staff level has been reduced from 7,800 employees in FY94 to 4,871 employees in FY15. The Department has continued to scrutinize the filling of positions to hold down operating costs. The agency has the authority to hire 5,115 employees. The savings from not filling these vacancies is used to help cover the increased operating costs in other areas such as fuel, salt, and utilities, in addition to redirecting funds to the capital program. Employee levels equal the number of permanent appointment types as of the last payroll paid out during that fiscal year (PPE mid June). Permanent appointment types include Full time Permanent, Part time Permanent and Full time Interim Internal employees. The Department has managed to maintain the largest construction program in Ohio history with personnel levels at a 30 year low. 15


25 Transportation Funding Sources: Operating Payroll is the largest component of operating expenses. The decrease in employer fringe and gross wages in FY 2013 can be attributed to the decrease in employee population. The increase in overtime in 2014 was the result of a severe snow and ice season. 1. FY 2011 had 27 pay periods as compared to 26 in all other fiscal years. This caused an increase in gross wages for fiscal year The employer fringe and gross wages continue to decrease due to less full time permanent employees. 3. Overtime was higher than usual in fiscal year 2014 due to a harsher snow and ice season. 16
26 Transportation Appropriation Uses: Operating Employer Paid Benefits $60 Health, Dental, Vision, Life $44.0 PERS $55 $42.0 Millions $50 $45 Millions $40.0 $38.0 $40 $36.0 $ Fiscal Year $ Fiscal Year $11 Workers' Comp $24 All Other $10 $22 Millions $9 $8 Millioins $20 $18 $7 $16 $ Fiscal Year $ Fiscal Year FISCAL YEAR Health Care, Dental, Vision, Life $56.3 $56.1 $53.9 $59.0 $58.5 PERS $43.1 $41.1 $39.8 $39.8 $38.8 Workers' Comp $7.1 $8.0 $8.4 $8.1 $8.0 All Other $19.4 $20.6 $21.9 $21.9 $20.8 Total $125.9 $125.9 $124.0 $128.9 $ In 2012 healthcare costs decreased.24%. In 2013 healthcare costs decreased 4.1%. In 2014 healthcare costs increased 10.4% part of the increase in total cost for FY 2014 was due to the fact that there were no health deductions for 2 pay periods in FY In 2015 healthcare costs decreased.80%. 2. In 2011 there was an additional pay period causing an increase in employer paid PERS for that year. 3. Annual fluctuations in ODOT's Workers' Compensation rates are the primary cause for variances from year to year. In 2011 the rate was %; in 2012 it rose to %; in 2013 it rose to %; in 2014 it fell to %; and in 2015 it rose to %. 4. The All Other benefit category includes a premium for disability, accrued leave fund, collective bargaining, medicare, EEO (Equal Employment Opportunity), HMO Communications Surcharge, Child Care Voucher Contribution, EAP (Employee Assistance Program), workforce development Fund, OBM Accounting, human resource charge, parental leave benefit fund, enterprise services and unemployment compensation. In 2011, the OAKS enterprise Rate was added. In 2014 the fee for EAP (Employee Assistance Program) was not charged to agencies. 5. The increase in All Other for 2012 and 2013 can be attributed to the increase in the rates for the net accrued leave fund and the OAKS enterprise rate both years. 17


27 Transportation Appropriation Uses: Operating The fluctuation in overtime hours is largely dependent on the severity of Ohio s winters. Fiscal years have been higher than normal due to harsh winters and multiple snow and ice events. Fiscal Year Overtime Dollars Total Gross Pay* % of Overtime out of Total Gross Pay 2011 $13.3 $ % 2012 $10.1 $ % 2013 $12.3 $ % 2014 $18.4 $ % 2015 $14.7 $ % *Total Gross Pay = Gross Wages+Overtime+Fringe Benefits 18

28 Transportation Appropriation Uses: Operating Along with its full time employees, ODOT uses outside services to complete tasks such as design work for construction projects, construction inspections, right of way acquisition and administrative services. These costs have averaged % in relation to ODOT s total payroll costs for the past five years. 19
29 Transportation Appropriation Uses: Operating Professional Contracts Encumbered for the Following Services *Note: Encumbrances are with regard to fund year and represent the encumbered balance as of the reporting date. ODOT s use of outside sources falls into one of the following nine categories: Design Environmental Right of Way Studies Personal Services (consultant work) Construction Inspection Management Review Bridge Inspection Research Notable Trends: o Personal Services The decrease in Personal Service is due to the following project: Division of Informational Technology Decreased 57% or $7.9M during Fiscal Year 2015 when compared to the same time frame in Fiscal year 2014 can be partially attributed to no new projects beginning in the quarter. o Design The decrease of 55% or $75.8M during Fiscal Year 2015 when compared to the same time frame in Fiscal Year o Construction Inspections The increase in Construction Inspections is partially due to the following projects: D04 $10M Widening to six lanes and total replacement on Interstate 80. Includes the widening and replacement of structures. D09 $9.7M This is for payment to a developer for the Design Build Finance Operate Maintain (DBFOM) contract for the Portsmouth Bypass. D4 $3.3M This project includes replacing and widening four structures over SR82 and Norfolk Southern Railroad. STW $3M Statewide Ohio Bridge Partnership Program Task Order. D12 $2.6M Construct a new structure to replace existing Inner belt Bridge, including the demolition of the existing structure. 20
 ODOT Budgeted figures attributed to Urban Paving in accordance with the Urban Paving Policy.")
30 Transportation Appropriation Uses: Capital (1) Actual usage of legislatively approved appropriations for that fund year, established in the approved Legislative Budget, without regard to when the activity actually occurred. (2) ODOT Budgeted figures attributed to Urban Paving in accordance with the Urban Paving Policy. Urban Paving is typically $35 million, but in FY10 ARRA provided $5 million of the funding for this program, and is included under ARRA. $27 million provided in FY15 budget. For additional information about funding sources for local government entities, see page 47 of the Appendix (Transportation Funding Sources). 21


31 Transportation Appropriation Uses: Capital *Total FY 15 Contracts Awarded by Transit and Aviation = $47.2M. The totals in the above chart DO NOT include Preliminary Engineering or Right of Way. Brief descriptions of each category can be found in the Appendix on page 41. 1) FY 14 and FY 15 awarded amounts higher due to Turnpike Bonds With contracts awarded over the past few years reaching record breaking numbers, capital expenditures have followed suit, averaging $2.0 billion of actual expenditures for the past five years. (1) 22
 has remained stagnant over the same time period.")
32 Transportation Appropriation Uses: Capital ODOT s actual capital dollar outlay for infrastructure has increased over the past 20 years; however, actual buying power ( real dollar value due to inflation) has remained stagnant over the same time period. If adjusted for inflation using the CPI, Highway and Maintenance contracts have actually increased by approximately $539M since FY 1996 based on real dollar value. Using the ODOT internal BART (Bid Analysis Review Team) index, real dollar value for Highway and Maintenance contracts has increased roughly $19M since FY The chart below shows this trend by taking the actual dollar amount of contracts sold for each fiscal year (which are shown in millions in the table below the graph) and comparing it with an amount that has been adjusted for inflation over the same period of time (this graph is using a Consumer Price Index base for , and a (BART) Producer Price Index base for 2001). Starting in FY 2014 the BART team changed its analysis methodology to a quarterly process. This change in methodology resulted in slightly elevated numbers as compared to the past. 23
33 State Infrastructure Bank
34 State Infrastructure Bank Loan Program Background The State Infrastructure Bank (SIB) program was capitalized with two authorizations from the Ohio State Legislature totaling $40 million in GRF funds, $10 million in State Motor Fuel Tax funds, and $87 million from Federal Title 23 Highway funds. Any highway or transit project eligible under Title 23, as well as aviation, rail and other intermodal projects are eligible for direct loan funding under the SIB. Bond Program Background With the assistance of the Ohio Treasurer s office, the Ohio Department of Transportation established two investment grade bond funds to leverage the SIB funds available to assist political entities. Both funds are structured with an open master indenture which allows bonds to be issued as needed, on a project by project basis. With each bond fund, all repayments from the existing GRF and Title 23 loan portfolio accounts are pledged to support any borrower repayment shortfall. This pledge is followed by all cash in each respective account and lastly the program reserve bond fund will be accessed in the event of a borrower defaulting or having a shortfall in its payment. The State Transportation Infrastructure Bond Fund (GRF account) was established in September The program received an AA rating from Fitch. This program is for projects that do not qualify as federally eligible. This account has approximately $35m remaining in bond issuance capacity. The Federal Title 23 Transportation Infrastructure Bond Fund (Title 23 account) was established in July The program received an AA rating from Fitch. This bond fund program is for projects that are classified as Title 23 eligible. Currently, this bond program can issue approximately $86.7m in bonds. Both programs are authorized under the Ohio Revised Code, Sections and Administration ODOT will be the primary decision maker for SIB projects. Within ODOT, the SIB Loan Committee manages the approval process. ODOT s Division of Finance promulgates the application process and is the contact source for information on the program. The Division of Finance receives applications, reviews, and makes recommendations to the SIB Loan Committee. ODOT administers the loans using prudent financial guidelines and policies related to desirability, timing, and relative risk of the project SIB Snapshot The portfolio of the SIB for Fiscal Year 2015 included fourteen loans totaling $70,380,416. Since inception, the Ohio SIB has issued 180 loans in the amount of $561.2 million and seven bond issuances in the amount of $45.1 million; totaling $606.3 million for the program. The bank has assisted communities with 155 highway, four railroad, two transit, fourteen aviation, one bikeway and eleven other infrastructure projects. 24
35 State Infrastructure Bank SIB ACCOUNTS FUND 2120 Federal Funding Known as First Generation, this funding originally capitalized the SIB. It is used for Title 23 eligible projects (highway or transit). Use of this funding requires that the borrower follow all Federal mandates. Federal funds cover only 80% of the project costs and a 20% match of Motor Fuel Tax (MFT) SIB funds or a local match must be used. Title 23 (Second Generation funds or Washed funds) This funding is known as Second Generation, or Washed funds and may be used on projects that are Title 23 eligible. All other federal requirements are removed with these funds yet all state guidelines must be followed. This funding is used for 100% of the funding for projects and has no required state match. Motor Fuel Tax (MFT) The state Motor Fuel Tax fund is used as the non federal match to a Title 23 federally eligible project (20% share), or as 100% pure state funds for local roadway projects. Constitutionally, these funds cannot be used for any other transportation mode. FUND 2130 General Revenue Fund (GRF) The GRF account is used to support industrial parks, service roads, railroad projects, aviation projects and local roads or for any infrastructure related project that is not Title 23 eligible. SIB BOND PROGRAM ACCOUNTS The bond programs were created to generate additional financing for political subdivisions and to fund larger transportation projects. Bonds are issued on behalf of the SIB borrower by the ODOT Division of Finance in conjunction with the State Treasurer s office. State Transportation Infrastructure (GRF) Bond Fund The projects eligible for this program include local roadways, rail, water, and aviation. This bond fund is another source of funding for projects that do not qualify under Title 23 regulations. Federal Title 23 Transportation Infrastructure Bond Fund Under this bond program, the highway or transit related project must be Title 23 Federal eligible to qualify for an issuance. A project may be funded at 100% with no State match requirement. For additional information about funding sources for local government entities, see page 47 of the Appendix (Transportation Funding Sources) 25
36 OHIO DEPARTMENT OF TRANSPORTATION STATE INFRASTRUCTURE BANK FUNDS 2120 AND 2130 COMBINED STATEMENT OF REVENUES AND EXPENDITURES IN FUND BALANCES FOR THE YEAR ENDING JUNE 30, 2015 State Infrastructure Bank Beginning Cash Balance: $ 141,554,438 Revenues: Investment Earnings $ 578,931 Principal Loan Repayment (GRF) 2,437,160 Interest Payment on Loan (GRF) 613,234 Principal Loan Repayment (FHWA) 4,192,932 Interest Payment on Loan (FHWA) 71,309 Principal Loan Repayment (2nd Generation) 7,443,201 Interest Payment on Loan (2nd Generation) 1,083,814 Principal Loan Repayment (State Motor Fuel) 1,360,228 Interest Payment on Loan (State Motor Fuel) 142,454 Administrative Fees 34,011 Total Revenues $ 17,957,275 Expenditures: Federal Highway Funds $ 1,355,717 General Revenue Funds 17,071,602 Motor Fuel Tax Funds 1,634,751 Second Generation/Title 23 Funds 8,878,482 Administrative Fees Court Claims / Refunds 4,000 Total Expenditures $ 28,944,551 Ending Cash Balance $ 130,567,161 26

37 State Infrastructure Bank OHIO DEPARTMENT OF TRANSPORTATION STATE INFRASTRUCTURE BANK FUNDS 2120 AND 2130 BALANCE SHEET FOR FUNDS 2120 AND 2130 FOR YEAR ENDING JUNE 30,


38 State Infrastructure Bank Number of Loans: 180 Amount of Approved Loans: $561.2 Number of Bonds: 7 Amount of Approved Bonds: $45.1 Total: 187 Total: $606.3 * Annual amounts may not equal to total due to rounding. Excludes loans that were approved, but cancelled prior to closing on the loan. 28

39 State Infrastructure Bank There were a total of 14 State Infrastructure Bank loans approved in FY 2015, for $70.4 million. All 14 of the loans were for roadway related projects. There were no bonds approved out of the State Infrastructure Bank for FY15. This brings the final number of loans/bonds in the SIB portfolio as of FY 2015 to 187, totaling approximately $606.3 million, since the inception of the program. 29

40 State Infrastructure Bank The graph below depicts the SIB cash balances as of June 30, 2015 available for future loans. These amounts represent the uncommitted cash balances for Federal, Title 23, State Motor Fuel Tax, and General Revenue Fund accounts. 30

41 State Infrastructure Bank 31
42 State Infrastructure Bank STATE INFRASTRUCTURE BANK (SIB) PROJECTS SIB projects include those found below and are depicted on the map on the following page. Village of Ottawa (Putnam County) The Village of Ottawa obtained two loans for projects. The Putnam Parkway extension added approximately 1,244 feet of roadway to accommodate a new facility at an industrial park. Williamstown Road re profiling entailed raising 300 feet of pavement to minimize road closures in the area due to flooding issues. Putnam Parkway Total Project Costs: $272,725 SIB Loan Amount: $272,725 Williamstown Road Total Project Costs: $211,000 SIB Loan Amount: $211,000 City of Ashtabula (Ashtabula County) Local Road paving program The City s financing for the local road paving program was blended with a SIB loan and SIB bond issuance. The entire program will improve a total of 71 roads over a two year period. The work will include mill and fill operations, resurfacing, chip and seal, along with ancillary improvements as required to modify grade elevations of manhole covers, water valves, etc. Also, curb ramps will be incorporated into the work to comply with ADA requirements. Total Project Costs: $4,952,000 SIB Loan Amount: $942,000 SIB Bond Amount: $4,010,000 City of Dublin/Mid Ohio Regional Planning Commission (MORPC) (Franklin County) Interstate 270 (I 270) and United States Route 33 (US 33) interchange The Phase 1 reconstruction of the I 270 and US 33 interchange includes the construction of additional lanes on US 33, removal of the Southeast and Northwest loop ramps and construction of new ramps for traffic movements between I 270 & US 33/SR 161. This first phase of construction will improve safety and reduce congestion in this area. Total Project Costs: $96,000,000 SIB Loan Amount: $35,000,000 MORPC Share: $25,000,000 Dublin Share: $10,000,000 City of Vandalia (Montgomery County) South Dixie Drive widening This is the third phase of the project to widen South Dixie Drive from three to five lanes. The project is a regional multiphase effort to widen the road from Dayton to Troy. The total project length is 3,000 feet and will be widened from Cresthill Drive to Elva Court. Total Project Costs: $4,222,180 SIB Loan Amount: $1,776,000 Ohio Kentucky Indiana (OKI) Regional Council of Governments City of Cincinnati (Hamilton County) Interstate 71 (I 71)/Martin Luther King (MLK) Jr. Drive interchange The new interchange along I 71 at MLK Drive will improve mobility, reduce travel time, and simplify wayfinding for more than 45,000 residents and 50,000 employees in the surrounding neighborhoods. Also, the new interchange will contribute to business retention, expansion, and promote economic vitality in the Uptown area, the City of Cincinnati s second largest economic generator. Total Project Costs: $80,000,000 SIB Loan Amount: $25,000,000 32


43 State Infrastructure Bank 33
44 Appendix


45 Appendix 34
46 Appendix SOURCE AND DISTRIBUTION OF OHIO 28 PER GALLON MOTOR FUEL TAX 35
47 Appendix DISTRIBUTION OF STATE MOTOR VEHICLE REGISTRATIONS FEES 36
48 APPORTIONMENT FORMULAS FEDERAL AID HIGHWAY PROGRAM MAP 21 extended by the Highway and Transportation Funding Act of 2015 (P.L ) through October 29, 2015 Main statutory citation(s): MAP , 1122; 23 USC 104, 130, 213 Appendix Overview Prior to MAP 21, each apportioned program had its own formula for distribution, and the total amount of Federal assistance a State received was the sum of the amounts it received for each program. MAP 21 instead provides a total apportionment for each State and then divides that State amount among individual apportioned programs. Total funding for Federal aid highway formula programs MAP 21 authorizes a total nationwide combined amount ($37.5 billion in FY13 and $37.8 billion in FY14) in contract authority to fund five formula programs (including certain setasides within the programs described below): National Highway Performance Program (NHPP); Surface Transportation Program (STP); Highway Safety Improvement Program (HSIP); Congestion Mitigation and Air Quality Improvement Program (CMAQ); and Metropolitan Planning Program. Division of total apportioned amount among States MAP 21 requires FHWA to divide the total authorized amount among the States in the following manner: In FY13, the State receives the same total apportionment that it received in FY12. In FY14, the State receives a total apportionment share equal to the State's share of FY12 formula funds. The resulting total apportionment is adjusted, if necessary, to ensure that the State receives at least 95% of the dollar amount of its contributions to the Highway Account of the Highway Trust Fund. Division of a State's apportionment among programs After determining the total apportionment for a State, MAP 21 divides that apportionment among the State's individual formula programs in the following manner: CMAQ [23 USC 104(b)(4)] Metropolitan Planning [23 USC 104(b)(5)] NHPP [23 USC 104(b)(1)] STP [23 USC 104(b)(2)] HSIP [23 USC 104(b)(3)] Railway Highway Crossings [23 USC 130] Transportation Alternatives (TA) [ 1122; 23 USC 213] Funded in an amount equal to the State's total apportionment multiplied by the following ratio: Funded in an amount equal to the State's total apportionment multiplied by the following ratio: The remainder (net of CMAQ and Metro Planning) is divided based on the following proportions: State's FY09 CMAQ $ State's total FY09 apportionments State's FY09 Metro Planning $ State's total FY09 apportionments 63.7% to NHPP 29.3% to STP 7.0% to HSIP Funded with an amount set aside from the State's HSIP apportionment Based on a current law formula for distribution; and Such that the national total for the program is $220 million per year. Funded via set aside from NHPP, STP, HSIP, CMAQ, & Metro Planning: The State receives a share of total TA funding equal to its share of total FY09 transportation enhancements (TE) funding. The set aside is taken proportionally from each of the five programs in relation to the relative sizes of the State's apportionments (e.g., if a State's NHPP apportionment makes up 50% of what the State receives for the five programs, 50% of the set aside is applied against NHPP). Unless the State opts out, an amount of TA equal to the State's FY09 Recreational Trails Program (RTP) apportionment is set aside for the RTP. 37
49 Appendix APPORTIONMENT FORMULAS FEDERAL TRANSIT PROGRAM MAP 21 extended by the Highway and Transportation Funding Act of 2015 (P.L ) through October 29, 2015 PROGRAM FACTORS WEIGHT STATUTE (Title 49 U.S. Code) Enhanced Mobility of Seniors and Individuals with Disabilities Formula Grants Rural Areas Formula Grants Urbanized Area Formula Grants Metropolitan and Statewide Planning Programs State of Good Repair Formula Grants Funds are apportioned for urbanized and rural areas based on the number of seniors and individuals with disabilities. Also adopts former New Freedom funding allocations: To designated recipients in urbanized areas with a population over 200,000. To states for small urbanized areas. To states for rural areas. State s land area/population in rural areas. State s land area/revenue vehicle miles/ lowincome individuals in rural areas. Based on population and population density, number of low income individuals, and levels of transit service. Based on a continuing and comprehensive transportation planning process the metropolitan planning organization carries out in cooperation with the State and affected mass transportation operators Fixed Guideway: 50% Based on old SAFETEA LU formula for Fixed Guideway Rail Modernization Program, and 50% based on revenue vehicle miles and directional route miles. Motorbus: 60% based on revenue vehicle miles and 40% based on directional route miles of buses. 100% 60% 20% 20% 83.15% 16.85% 100% 100% 97.15% 2.85% , , 5304, and Bus and Bus Facilities Formula Grants Fixed amount for each state. Remaining amount based on population, vehicle revenue miles and passenger miles % 86.72% 5339 Illustrative State Safety Oversight Formula Grants Base Tier: Fixed amount provided per eligible state. Oversight Complexity Tier: Fixed amount per rail mode per each Rail Fixed Guideway Public Transportation System. Service Tier: Based on vehicle passenger miles, vehicle revenue miles and directional route miles. 20% 20% 60% 5329(e) 38


50 Appendix MAINTENANCE RESPONSIBILTY GUIDELINES 39

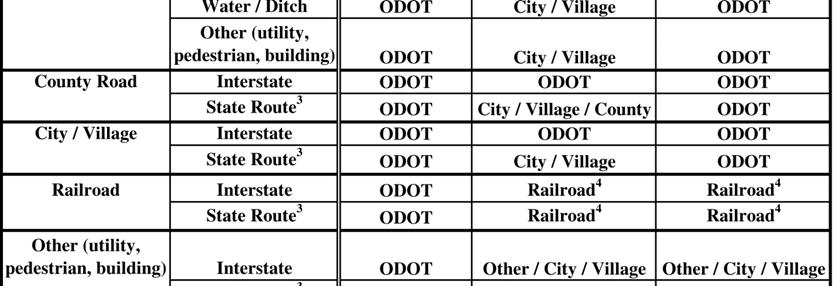


51 Appendix BRIDGE MAINTENANCE RESPONSIBILITY GUIDELINES 40
52 Page Intentionally Left Blank
53 Appendix Contracts Awarded by State Fiscal Year Definitions Pavement All Projects relating to resurfacing any road for which ODOT is responsible. These include interstate highways and state highways under ODOT s umbrella of responsibility. Bridges/Culverts All projects where the majority of the work on that project is for repairing, rebuilding, or building new bridges and/or culverts. Major / New Construction Projects that have gone before the Transportation Review Advisory Council (TRAC) and have been approved. These are large projects such as building a new bypass, constructing a new interchange, or rebuilding an existing road from the ground up. Local Government Projects on highways (mostly interstates) that run through municipalities, of which the municipalities have a share in maintaining. This is not to be confused with Local Let Projects (nontraditional) where ODOT only provides the funds (mostly federal) to local political divisions for them to award. Design / Build These are projects that are awarded to one company to do all of the preliminary engineering and design work as well as perform the construction portion of the project. 41

54 Appendix CONTRACTS AWARDED FY 2015 (Amounts expressed in millions) The Highway Information furnished in this report is from the award sheets issued by the Office of Contracts and Ellis and the dollars reflected are Construction only and do not include PE or RW costs. Modal information was provided by Transit and Aviation. (1) These projects consist of bridge/highway cleaning, crack sealing, pavement repair, railroad separation, salt domes, slide / slip correction / stabilization / facilities projects, tree removal, spot improvement, etc. (2) These totals also include Rural ARRA contract amounts. 42

55 Appendix CONTRACTS AWARDED FY 2015 (Amounts expressed in millions) The Highway Information furnished in this report is from the award sheets issued by the Office of Contracts and Ellis and the dollars reflected are Construction only and do not include PE or RW costs. Modal information was provided by Transit and Aviation. (1) These projects consist of bridge/highway cleaning, crack sealing, pavement repair, railroad separation, salt domes, slide / slip correction / stabilization / facilities projects, tree removal, spot improvement, etc. (2) These totals include all transit program contract amounts. 43


56 Shelby County Transit Scheduling Software OHIO TRANSIT SYSTEM PROJECTS Medina County ADA Services Appendix Steel Valley Regional Transit Authority (SVRTA) New Accessible Vehicle Central Ohio Transit Authority CNG facility Pickaway County Transit Replacement Cutaway Bus Chillicothe Transit System Replacement Cutaway Bus and Shop Equipment Southeastern Area Transit Shelters and Signage Bus Shelter xx 44


57 Appendix 45


58 Appendix 46

59 Appendix 47
DIVISION OF FINANCE FINANCIAL & STATISTICAL REPORT
 Division of Finance Annual Accomplishments Report DIVISION OF FINANCE FINANCIAL & STATISTICAL REPORT Fiscal Year 2017 John R. Kasich, Ohio Governor Jerry Wray, ODOT Director September 22, 2017 To the
Financial Snapshot October 2014
 Financial Snapshot October 2014 Financial Snapshot About the Financial Snapshot The Financial Snapshot provides answers to frequently asked questions regarding MoDOT s finances. This document provides
Financial. Snapshot An appendix to the Citizen s Guide to Transportation Funding in Missouri
 Financial Snapshot An appendix to the Citizen s Guide to Transportation Funding in Missouri November 2017 Financial Snapshot About the Financial Snapshot The Financial Snapshot provides answers to frequently
INVESTMENT STRATEGIES
 3 INVESTMENT STRATEGIES 70 INVESTMENT STRATEGIES 71 A key role of Mobilizing Tomorrow is to outline a strategy for how the region will invest in transportation infrastructure over the next 35 years. This
Technical Memorandum. Finance. Prepared for: Prepared by: In cooperation with: High Street Consulting Group
 Technical Memorandum Finance Prepared for: Prepared by: In cooperation with: High Street Consulting Group April 25, 2013 i Table of Contents 1. Ohio Finance... 1 1.1 Baseline Projection -- Highways...
INVESTING STRATEGICALLY
 11 INVESTING STRATEGICALLY Federal transportation legislation (Fixing America s Surface Transportation Act FAST Act) requires that the 2040 RTP be based on a financial plan that demonstrates how the program
WASATCH FRONT REGIONAL TRANSPORTATION PLAN FINANCIAL PLAN. Technical Report 47 May 2007 DAVIS MORGAN SALT LAKE TOOELE WEBER
 WASATCH FRONT REGIONAL TRANSPORTATION PLAN 2007-2030 FINANCIAL PLAN Technical Report 47 May 2007 DAVIS MORGAN SALT LAKE TOOELE WEBER 2030 RTP Financial Plan WASATCH FRONT REGIONAL TRANSPORTATION PLAN
Redbook. Department of Transportation
 LBO Analysis of Executive Transportation Budget Proposal Part I Tom Middleton, Senior Budget Analyst February 2019 TABLE OF CONTENTS Quick look...... 4 Overview... 5 Appropriation summary... 5 H.B. 62
Chapter 5: Cost and Revenues Assumptions
 Chapter 5: Cost and Revenues Assumptions Chapter 5: Cost and Revenues Assumptions INTRODUCTION This chapter documents the assumptions that were used to develop unit costs and revenue estimates for the
Chapter 6: Financial Resources
 Chapter 6: Financial Resources Introduction This chapter presents the project cost estimates, revenue assumptions and projected revenues for the Lake~Sumter MPO. The analysis reflects a multi-modal transportation
Interested Parties William E. Hamilton Transportation Needs and Revenue Distribution
 MEMORANDUM DATE: December 3, 2010 TO: FROM: RE: Interested Parties William E. Hamilton Transportation Needs and Revenue Distribution Introduction Michigan residents rely on a safe efficient transportation
Standard Policy No: (P) Effective: 4/17/1015 rev. 2/21/2018 Responsible Division: Finance STATE INFRASTRUCTURE BANK (SIB) LOANS AND BONDS
 Effective: 4/17/1015 rev. 2/21/2018 Responsible Division: Finance STATE INFRASTRUCTURE BANK (SIB) LOANS AND BONDS") Approved: Jerry Wray Director Standard Policy No: 18-012(P) Effective: 4/17/1015 rev. 2/21/2018 Responsible Division: Finance BACKGROUND: STATE INFRASTRUCTURE BANK (SIB) LOANS AND BONDS SIB LOANS In 1995
Approved: Jerry Wray Director Standard Policy No: 18-012(P) Effective: 4/17/1015 rev. 2/21/2018 Responsible Division: Finance BACKGROUND: STATE INFRASTRUCTURE BANK (SIB) LOANS AND BONDS SIB LOANS In 1995
OHIO MPO AND LARGE CITY CAPITAL PROGRAM SFY 2015 SUMMARY
 OHIO MPO AND LARGE CITY CAPITAL PROGRAM SFY 2015 SUMMARY TABLE OF CONTENTS MPO AND LARGE CITY PROGRAM OVERVIEW.. 3 MPO AND LARGE CITY SFY 2015 STP BUDGET SUMMARY......... 4 MPO AND LARGE CITY SFY 2015
Fiscal Year VDOT Annual Budget June 2017
 Fiscal Year 2018 VDOT Annual Budget June 2017 This Page Intentionally Left Blank Annual Budget FY 2018 2 Virginia Department of Transportation Table of Contents Overview.. 5 Revenues.. 7 Highway Maintenance
Joint Appropriations Subcommittee on Transportation
 Joint Appropriations Subcommittee on Transportation Funding Overview February 21, 2013 H. Tasaico, PE 1 NCDOT Funding Overview - Agenda State Transportation Comparative Data Transportation Funding Sources
The Oregon Department of Transportation Budget
 19 20 The Oregon Department of Transportation Budget The Oregon Department of Transportation was established in 1969 to provide a safe, efficient transportation system that supports economic opportunity
Appendix. G RTP Revenue Assumptions REGIONAL TRANSPORTATION PLAN/SUSTAINABLE COMMUNITIES STRATEGY
 Appendix G RTP Revenue Assumptions REGIONAL TRANSPORTATION PLAN/SUSTAINABLE COMMUNITIES STRATEGY Exhibit G-1 2014 RTP REVENUE FORECAST ASSUMPTIONS LOCAL REVENUES Measure K Sales Tax Renewal Program: Description:
APPENDIX 5 FINANCIAL ANALYSIS
 APPENDIX 5 FINANCIAL ANALYSIS Background Starting with the Intermodal Surface Transportation Equity Act of 1991, it has been a consistent requirement of federal law and regulation that the projects included
FY Statewide Capital Investment Strategy... asset management, performance-based strategic direction
 FY 2009-2018 Statewide Capital Investment Strategy.. asset management, performance-based strategic direction March 31, 2008 Governor Jon S. Corzine Commissioner Kris Kolluri Table of Contents I. EXECUTIVE
CHAPTER 5 INVESTMENT PLAN
 CHAPTER 5 INVESTMENT PLAN This chapter of the 2014 RTP/SCS plan illustrates the transportation investments for the Stanislaus region. Funding for transportation improvements is limited and has generally
Chapter 3: Regional Transportation Finance
 Chapter 3: Regional Transportation Finance This chapter examines the sources of funding for transportation investments in the coming years. It describes recent legislative actions that have changed the
OHIO MPO & LARGE CITY CAPITAL PROGRAM SFY 2017 SUMMARY
 OHIO MPO & LARGE CITY CAPITAL PROGRAM SFY 2017 SUMMARY Revised 9/19/2017 TABLE OF CONTENTS MPO AND LARGE CITY PROGRAM OVERVIEW... 3 MPO AND LARGE CITY SFY 2017 STBG BUDGET SUMMARY... 4 MPO AND LARGE CITY
State Highway Fund Annual Continuing Disclosure Report. For the Fiscal Year Ended August 31, 2015
 State Highway Fund Annual Continuing Disclosure Report For the Ended August 31, 2015 Filed by Texas Transportation Commission Pursuant to Undertaking Provided to Permit Compliance with SEC Rule 15c2-12
GLOSSARY. At-Grade Crossing: Intersection of two roadways or a highway and a railroad at the same grade.
 Glossary GLOSSARY Advanced Construction (AC): Authorization of Advanced Construction (AC) is a procedure that allows the State to designate a project as eligible for future federal funds while proceeding
1 (b) Reconstruct and rehabilitate state highways to better maintain 2 them and prevent and avoid costly future repairs; 3 (c) Support local
 Reconstruct and rehabilitate state highways to better maintain 2 them and prevent and avoid costly future repairs; 3 (c) Support local") 1 (b) Reconstruct and rehabilitate state highways to better maintain 2 them and prevent and avoid costly future repairs; 3 (c) Support local government efforts to fund local transportation 4 projects that
1 (b) Reconstruct and rehabilitate state highways to better maintain 2 them and prevent and avoid costly future repairs; 3 (c) Support local government efforts to fund local transportation 4 projects that
PENNSYLVANIA S 2017 TRANSPORTATION PROGRAM FINANCIAL GUIDANCE
 November 20, 2015 Revised December 18, 2015 to reflect FAST Act PENNSYLVANIA S 2017 TRANSPORTATION PROGRAM FINANCIAL GUIDANCE This is a collaborative product jointly developed by the Pennsylvania Planning
APPENDIX B TECHNICAL MEMORANDUM #2 TRANSPORTATION FUNDING
 APPENDIX B TECHNICAL MEMORANDUM #2 TRANSPORTATION FUNDING CONTENTS Purpose... B1 Summary of Transportation Funding Sources... B1 Figure B-1: Average Annual Transportation Revenue Breakdown by Source (2011-2015)...B1
City Engineers Association of Minnesota Annual Conference January 31, 2013
 City Engineers Association of Minnesota Annual Conference January 31, 2013 Highway User Tax Distribution (HUTD) Fund Gas Tax Registration Tax Motor Vehicle Sales Tax (MVST) Trunk Highway Fund County State
ALL Counties. ALL Districts
 TEXAS TRANSPORTATION COMMISSION ALL Counties rhnute ORDER Page of ALL Districts The Texas Transportation Commission (commission) finds it necessary to propose amendments to. and., relating to Transportation
Estimated Financial Summary for the Highway and Bridge Construction Schedule
 Estimated Financial Summary for the 2017-2021 Highway and Bridge Construction Schedule Overview Section 5 of the Statewide Transportation Improvement Program explains the sources and projected levels of
QUALITY TRANSPORTATION SUMMARY
 QUALITY TRANSPORTATION SUMMARY Quality Transportation Overview... 126 Department of Transportation... 127 Traffic Field Operations... 129 Winston-Salem Transit Authority... 131 Quality Transportation Non-Departmental...
Chapter 15. Transportation Improvements Financing. Ohio Kentucky Indiana Regional Council of Governments Regional Transportation Plan
 Chapter 15 Transportation Improvements Financing Ohio Kentucky Indiana Regional Council of Governments 2030 Regional Transportation Plan CHAPTER 15 TRANSPORTATION IMPROVEMENTS FINANCING INTRODUCTION As
FUNDING AND FINANCE FEDERAL TRANSPORTATION PROGRAMS STATE FUNDING OPTIONS
 Minnesota Transportation Advisory Committee FUNDING AND FINANCE FEDERAL TRANSPORTATION PROGRAMS STATE FUNDING OPTIONS Jack Basso Director of Program Finance and Management American Association of State
Transportation Budget Trends
 2018 2019 Transportation Budget Trends Transportation Budget Trends 2018 2019 Wisconsin Department of Transportation The report provides a comprehensive view of transportation budget information presented
Financial Forecasting Assumptions for Plan 2040 (DRAFT)
") Financial Forecasting Assumptions for Plan 2040 (DRAFT) Inflation and Long Range Cost Escalation For the FY 2012 2017 TIP period, ARC will use the GDOT recommended 4 percent inflation rate. This conservative
Financial Forecasting Assumptions for Plan 2040 (DRAFT) Inflation and Long Range Cost Escalation For the FY 2012 2017 TIP period, ARC will use the GDOT recommended 4 percent inflation rate. This conservative
In addition to embarking on a new dialogue on Ohio s transportation priorities,
 Strategic Initiatives for 2008-2009 ODOT Action to Answer the Challenges of Today In addition to embarking on a new dialogue on Ohio s transportation priorities, the Strategic Initiatives set forth by
Fiscal Year Commonwealth Transportation Fund Budget June 2014
 Fiscal Year 2015 Commonwealth Transportation Fund Budget June 2014 2 For Further Information Contact: Virginia Department of Transportation Financial Planning Division 1221 E. Broad Street, 4th Floor Richmond,
PROGRAM FINANCING FUNDING
 Program Financing PROGRAM FINANCING FUNDING The funding of highway improvements depends on the availability of funds and on criteria established by state and federal law for the use of those funds. Highway
Morgan County Engineer 2017 Annual Report Stevan Hook PE, PS - January 17, 2018
 Morgan County Engineer 2017 Annual Report Stevan Hook PE, PS - January 17, 2018 In accordance with the provisions of the Ohio Revised Code an annual report must be submitted to the Board of County Commissioners
Transportation Funds Forecast November 2018
 Transportation Funds Forecast November 2018 Released December 7th, 2018 Forecast Highlights FY 2018-19 HUTD revenues are up $12.9 million - 0.3 percent Gas tax is up $13.1 million (0.7 percent), registration
Fiscal Year Revised VDOT Annual Budget November 2014
 Fiscal Year 2015 Revised VDOT Annual Budget November 2014 Revised Annual Budget 2 Virginia Department of Transportation Table of Contents Overview.. 5 Revenues.. 7 Highway Maintenance and Operating Fund
Fiscal Year VDOT Annual Budget June 2018
 Fiscal Year 2019 VDOT Annual Budget June 2018 This Page Intentionally Left Blank Annual Budget FY 2019 2 Virginia Department of Transportation Table of Contents Overview. 5 Revenues. 7 Highway Maintenance
Technical Appendix. FDOT 2040 Revenue Forecast
 Technical Appendix FDOT 040 Revenue Forecast This page was left blank intentionally. APPENDIX FOR THE METROPOLITAN LONG RANGE PLAN 040 Forecast of State and Federal Revenues for Statewide and Metropolitan
APPENDIX FOR THE METROPOLITAN LONG RANGE TRANSPORTATION PLAN Forecast of State and Federal Revenues for Statewide and Metropolitan Plans
 APPENDIX FOR THE METROPOLITAN LONG RANGE TRANSPORTATION PLAN 2035 Forecast of State and Federal Revenues for Statewide and Metropolitan Plans Overview This appendix documents the current Florida Department
Financial Capacity Analysis
 FINANCIAL CAPACITY ANALYSIS Introduction Federal transportation planning rules require that metropolitan area transportation plans include a financial capacity analysis to demonstrate that the plan is
Technical Report No. 4. Revenue and Costs
 Technical Report No. 4 Revenue and Costs Technical Report No. 4 REVENUE AND COSTS PASCO COUNTY METROPOLITAN PLANNING ORGANIZATION 8731 Citizens Drive New Port Richey, FL 34654 Ph (727) 847-8140, fax (727)
Honolulu High-Capacity Transit Corridor Project Alternatives Analysis
 Alternatives Analysis Financial Feasibility Report November 30, 2006 Prepared for: City and County of Honolulu Prepared by: PB Consult Inc. Under Subcontract to: Parsons Brinckerhoff Quade & Douglas, Inc.
2035 Long Range Transportation Plan Update
 Broward MPO 2035 Long Range Transportation Plan Update Technical Report # 6 Prepared by: In association with: December 2009 TABLE OF CONTENTS 1.0 Introduction... 1 1.1 Purpose... 1 1.2 Methodology and
Financial Analysis Working Paper 1 Existing Funding Sources Draft: April 2007
 Financial Analysis Working Paper 1 Existing Funding Sources Draft: April 2007 Prepared for: By: TABLE OF CONTENTS INTRODUCTION... 1 REVIEW OF FRED AND VRE EXISTING FUNDING SOURCES... 1 Federal Funding...
Fiscal Year VDOT Annual Budget June 2011
 Fiscal Year 2011-2012 VDOT Annual Budget June 2011 For Further Information Contact: Virginia Department of Transportation Financial Planning Division 1221 E. Broad Street, 4th Floor Richmond, VA 23219
Appendix E: Revenues and Cost Estimates
 Appendix E: Revenues and Cost Estimates Photo Source: Mission Media Regional Financial Plan 2020-2040 Each metropolitan transportation plan must include a financial plan. In this financial plan, the region
Contents. Alamo Area Metropolitan Planning Organization. Introduction S. St. Mary s Street San Antonio, Texas 78205
 Contents Introduction 1 Alamo Area Metropolitan Planning Organization Tel 210.227.8651 Fax 210.227.9321 825 S. St. Mary s Street San Antonio, Texas 78205 www.alamoareampo.org aampo@alamoareampo.org Pg.
Chapter 4: Regional Transportation Finance
 4.1 Chapter 4: Regional Transportation Finance 2040 4.2 CONTENTS Chapter 4: Transportation Finance Overview 4.3 Two Funding Scenarios 4.4 Current Revenue Scenario Assumptions 4.5 State Highway Revenues
Transportation Trust Fund Overview
 Transportation Trust Fund Overview Created pursuant to New Jersey Transportation Trust Fund Authority Act of 1984 Established to finance the cost of planning, acquisition, engineering, construction, reconstruction,
Transportation Funding
 Transportation Funding TABLE OF CONTENTS Introduction... 3 Background... 3 Current Transportation Funding... 4 Funding Sources... 4 Expenditures... 5 Case Studies... 6 Washington, D.C... 6 Chicago... 8
Capital Improvement Projects
 Capital Improvement Projects This section highlights the Capital Improvement Program (CIP) projects proposed for FY 2017-2018. Capital projects are designed to enhance the City s infrastructure, extend
Wednesday, June 6, 2018
 Wednesday, June 6, 2018 Excellence in Program Administration Award 2018 AASHTO Civil Rights Training Symposium Excellence in Program Administration Award Joanna McFadden EEO/DBE Section Head APRIL 2017-2018
TRANSPORTATION IMPROVEMENT PROGRAM REVISION 19 F E D E R A L F I S C A L Y E A R S Expedited Administrative Modifications
 TRANSPORTATION IMPROVEMENT PROGRAM F E D E R A L F I S C A L Y E A R S 2 0 1 5 2 0 1 8 REVISION 19 Expedited Administrative Modifications TRANSPORTATION IMPROVEMENT PROGRAM FEDERAL FISCAL YEARS 2015-2018
This annual continuing disclosure report contains or references the following information:
 State Highway Fund Annual Continuing Disclosure Report For the Ended August 31, 2014 Filed by Texas Transportation Commission Pursuant to Undertaking Provided to Permit Compliance with SEC Rule 15c2-12
Analysis of Regional Transportation Spending
 Analysis of Regional Transportation Spending An overview of transportation revenues and expenses of Greater Des Moines June 2016 Contents Executive Summary Purpose Key Findings Regional Goals Federal Funding
CHAPTER 4 FINANCIAL STRATEGIES: PAYING OUR WAY
 The financial analysis of the recommended transportation improvements in the 2030 San Diego Regional Transportation Plan: Pathways for the Future (RTP or the Plan ) focuses on four components: Systems
Transportation Finance Overview. Presentation Contents
 Transportation Finance Overview Matt Burress House Research Department matt.burress@house.mn Andy Lee House Fiscal Analysis andrew.lee@house.mn January 5 th & 10 th, 2017 Presentation Contents 2 Part 1:
5/3/2016. May 4, Item #1 CITIZENS PARTICIPATION
 May 4, 2016 Item #1 CITIZENS PARTICIPATION 1 Item #2 ELECT AN ACTING CHAIR Item #3 APPROVAL OF MINUTES 2 Item #4 OVERVIEW OF TRAC AGENDA Committee Goals Learn about the RTC including its roadway and transit
Ohio Department of Transportation Central Office, P.O. Box 899, Columbus, Ohio
 Ohio Department of Transportation Central Office, P.O. Box 899, Columbus, Ohio 43216-0899 To: The Honorable Bob Taft, Governor Members of the Ohio Legislature Citizens of Ohio Good news is on the horizon
2017 Educational Series FUNDING
 2017 Educational Series FUNDING TXDOT FUNDING INTRODUCTION Transportation projects take many years to develop and construct. In addition to the design, engineering, public involvement, right-of-way acquisition,
APPENDIX I REVENUE PROJECTION AND ASSUMPTIONS
 APPENDIX I REVENUE PROJECTION AND ASSUMPTIONS The 2018 StanCOG Regional Transportation Plan/Sustainable Communities Strategy (RTP/SCS) financial forecasts provide revenue projections for StanCOG member
Administrative Modification #1 (as of 10/15/2015) to the Kansas FFY STIP
 to the Kansas FFY STIP") Administrative Modification #1 (as of 10/15/2015) to the Kansas FFY 2016-2019 STIP The attached administrative modification to the Kansas FFY 2016-2019 Statewide Improvement Program (STIP) updates the
Administrative Modification #1 (as of 10/15/2015) to the Kansas FFY 2016-2019 STIP The attached administrative modification to the Kansas FFY 2016-2019 Statewide Improvement Program (STIP) updates the
UNIFIED TRANSPORTATION PROGRAM
 2002 UNIFIED TRANSPORTATION PROGRAM Blank Page SUMMARY OF CATEGORIES CATEGORIES NUMBER, NAME AND YEAR ESTABLISHED PROGRAMMING AUTHORITY FUNDING BANK BALANCE (Yes/) RESPONSIBLE ENTITY RANKING INDEX OR ALLOCATION
Fiscal Year Commonwealth Transportation Fund Budget June 2015
 Fiscal Year 2016 Commonwealth Transportation Fund Budget June 2015 2 For Further Information Contact: Virginia Department of Transportation Financial Planning Division 1221 E. Broad Street, 4th Floor Richmond,
Transportation Funding Overview. Travis Brouwer, ODOT Assistant Director House Transportation Policy Committee March 8, 2017
 Transportation Funding Overview Travis Brouwer, ODOT Assistant Director House Transportation Policy Committee March 8, 2017 Major Funding Sources Federal Surface Transportation Funding Federal Highway
State of Nevada Department of Transportation
 State of Nevada Department of Transportation 2011-2013 Biennial Budget Overview March 15, 2011 E - 1 The Nevada Department of Transportation Summary of Agency Operations: The Nevada Department of Transportation
NCDOT Funding Overview
 NCDOT Funding Overview Joint Appropriations Subcommittee on Transportation Mark L. Foster, CFO H. Tasaico February 16, 2011 Transportation Outlook NCDOT Funding Sources Transportation Funding Equity Cash
10-Year Capital Highway Investment Plan DRAFT
 This document is made available electronically by the Minnesota Legislative Reference Library as part of an ongoing digital archiving project. http://www.leg.state.mn.us/lrl/lrl.asp 10-Year Capital Highway
7.0 Financially Feasible Plan
 Livability 2040 Regional Transportation Plan 7-1 7.0 Financially Feasible Plan The Memphis MPO used a performance-based approach to rank projects for Livability 2040 and incorporated state and local priorities
Pennsylvania Turnpike Commission Act 44 Financial Plan Fiscal Year 2017
 Act 44 Financial Plan Fiscal Year 2017 May 18, 2016 Submitted to: Secretary of the Budget, Commonwealth of Pennsylvania Submitted by: Prepared by: The PFM Group Table of Contents I. Summary 1 II. Serving
Transportation Funds Forecast November 2017
 This document is made available electronically by the Minnesota Legislative Reference Library as part of an ongoing digital archiving project. http://www.leg.state.mn.us/lrl/lrl.asp Transportation Funds
2040 Long Range Transportation Plan. Financial Summary
 2040 Long Range Transportation Plan Financial Summary FINANCIAL OUTLOOK Establishing MPO Transportation Plan fiscal forecasts for a twenty year planning horizon in today s transportation environment is
Transportation Funds Forecast February 2017
 Transportation Funds Forecast February 2017 Released March 3rd, 2017 Forecast Highlights FY 2018-19 HUTD revenues are up $72 million (1.6 percent) from November 2016 Forecast Gas taxes are up $30 million
Forecast Highlights. HUTD Revenues, FY Biennium Change from EOS '16 Forecast
 Forecast Highlights FY 2016-17 HUTD revenues down $45 million (1.1 percent) from 2016 EOS Forecast Gas taxes are up $6 million (0.3 percent), registration taxes are down $32 million (2.2 percent) and motor
State Street Aid Fund Expenditures: On the Road to Understanding
 University of Tennessee, Knoxville Trace: Tennessee Research and Creative Exchange MTAS Publications: Technical Bulletins Municipal Technical Advisory Service (MTAS) 7-8-2005 State Street Aid Fund Expenditures:
FEDERAL FUNDING SOURCES
 Financial Plan FINANCIAL PLAN INTRODUCTION This plan s financial analysis was developed in response to the requirements for a fiscally constrained plan that was introduced in the Intermodal Surface Transportation
SOUTHERN BELTWAY US-22 TO I-79 PROJECT 2013 FINANCIAL PLAN. Pennsylvania Turnpike Commission Allegheny and Washington Counties, Pennsylvania
 SOUTHERN BELTWAY US-22 TO I-79 PROJECT 2013 FINANCIAL PLAN Pennsylvania Turnpike Commission Allegheny and Washington Counties, Pennsylvania January 2013 Table of Contents... 1 Introduction... 2 Project
RECEIVED On in I #2. 3tPm
 2017.2012#2 RECEIVED On in I - Be it enacted by the People of the State of Colorado: Colorado Secretary of State SECTION 1. Legislative declaration. (1) The voters of the state of Colorado hereby find
FEDERAL FISCAL YEAR TRANSPORTATION IMPROVEMENT PROGRAM
 FEDERAL FISCAL YEAR 2016 2019 TRANSPORTATION IMPROVEMENT PROGRAM A regional program of surface transportation improvement projects to enhance the movement of goods and people along the greater Des Moines
Transportation Funds Forecast
 Transportation Funds Forecast February 2016 Released March 3,2016 Funds Forecast Executive Summary 2016-17 HUTD revenues down 23 million from Nov 2015 Forecast HUTD Fund revenues in the current 2016-17
OHIO DEPARTMENT OF TRANSPORTATION CENTRAL OFFICE, 1980 WEST BROAD STREET, COLUMBUS, OH TED STRICKLAND, GOVERNOR JOLENE M. MOLITORIS, DIRECTOR
 OHIO DEPARTMENT OF TRANSPORTATION CENTRAL OFFICE, 1980 WEST BROAD STREET, COLUMBUS, OH 43223 TED STRICKLAND, GOVERNOR JOLENE M. MOLITORIS, DIRECTOR To Ohio s Transportation Partners, Investments in transportation
REVENUE IMPACT OF PROPOSED LEGISLATION 79th Oregon Legislative Assembly 2017 Regular Session Legislative Revenue Office
 REVENUE IMPACT OF PROPOSED LEGISLATION 79th Oregon Legislative Assembly 2017 Regular Session Legislative Revenue Office Bill Number: Revenue Area: Economist: Date: HB 2017 A Transportation Mazen Malik
Pioneer Valley Transportation Improvement Program (TIP) Proposed Amendments January 2017
 Proposed Amendments January 2017") 2017-2021 Pioneer Valley Transportation Improvement Program (TIP) Proposed Amendments January 2017 HIGHWAY AMENDMENTS FEDERAL FISCAL YEAR 2017 Part 1A: Federal Aid Target Projects Increase cost of (604033)
2017-2021 Pioneer Valley Transportation Improvement Program (TIP) Proposed Amendments January 2017 HIGHWAY AMENDMENTS FEDERAL FISCAL YEAR 2017 Part 1A: Federal Aid Target Projects Increase cost of (604033)
Instructions for Completing the Annual Road and Street Finance Report
 Instructions for Completing the Annual Road and Street Finance Report Additional information you wish to submit may be attached to the report on 8.5" by 11" paper. Please round all amounts up or down to
Overview of State Highway Fund 0006 Revenues and Allocations, the Texas Mobility Fund, and the Texas Rail Relocation and Improvement Fund
 Overview of State Highway Fund 0006 Revenues and Allocations, the Texas Mobility Fund, and the Texas Rail Relocation and Improvement Fund Legislative Budget Board Contents General Overview of State Highway
P.L.2016, CHAPTER 56, approved October 14, 2016 Assembly, No. 10 (Fourth Reprint)
") - C.:B-. Title. Chapter B. (Rename) Infrastructure Trust.,-0 - C.:B-0. to :B-0. - C.:B-. - - C.:B-. & :B-. - Repealer - Note P.L., CHAPTER, approved October, Assembly, No. 0 (Fourth Reprint) 0 0 AN ACT
- C.:B-. Title. Chapter B. (Rename) Infrastructure Trust.,-0 - C.:B-0. to :B-0. - C.:B-. - - C.:B-. & :B-. - Repealer - Note P.L., CHAPTER, approved October, Assembly, No. 0 (Fourth Reprint) 0 0 AN ACT
TEX Rail Fort Worth, Texas Project Development (Rating Assigned November 2012)
") TEX Rail Fort Worth, Texas Project Development (Rating Assigned November 2012) Summary Description Proposed Project: Commuter Rail 37.6 Miles, 14 Stations (12 new, two existing) Total Capital Cost ($YOE):
TEX Rail Fort Worth, Texas Project Development (Rating Assigned November 2012) Summary Description Proposed Project: Commuter Rail 37.6 Miles, 14 Stations (12 new, two existing) Total Capital Cost ($YOE):
Total Current Revenue: $450 million Current need: $1.12 Billion Funding Deficiency: 60%
 Chris E. Bauserman, P.E., P.S., Delaware County Engineer, President CEAO Testimony House Bill 26 Ohio House of Representatives Finance Committee February 14, 2017 Chairman Smith, Ranking Member Cera, Sub.
CHAPTER 4 1 Transportation Financial Analysis
 CHAPTER 4 1 Transportation Financial Analysis COMPASS commissioned a financial analysis, finalized in 2012, to support the CIM 2040 update. The analysis, Financial Forecast for the Funding of Transportation
Northern Virginia Transportation Commission: 2018 Legislative and Policy Agenda
 Northern Virginia Transportation Commission: 2018 Legislative and Policy Agenda Northern Virginia s economic growth and global competitiveness are directly tied to the region s transit network. Transit
Administration and Projects Committee STAFF REPORT March 1, 2018 Page 2 of 9 Below is a summary of the FY adopted budget and the proposed midy
 Administration and Projects Committee STAFF REPORT Meeting Date: March 1, 2018 Subject Summary of Issues Recommendations Financial Implications Options Approval of FY 2017 18 Midyear Budget for the Contra
Fiscal Year Commonwealth Transportation Fund Budget June 2018
 Fiscal Year 2019 Commonwealth Transportation Fund Budget June 2018 This Page Intentionally Left Blank 2 Virginia Department of Transportation Financial Planning Division 1221 E. Broad Street, 4th Floor
APPENDIX B HIGH PRIORITY INVESTMENT PROGRAM (HPP) ( )
 ( )") APPENDIX B HIGH PRIORITY INVESTMENT PROGRAM (HPP) (2017-2020) (replaces previous Transportation Improvement Program) ACCESS2040 APPENDIX B HIGH PRIORITY INVESTMENT PROGRAM The High Priority Investment
APPENDIX B HIGH PRIORITY INVESTMENT PROGRAM (HPP) (2017-2020) (replaces previous Transportation Improvement Program) ACCESS2040 APPENDIX B HIGH PRIORITY INVESTMENT PROGRAM The High Priority Investment
Review and Update of Year 2035 Regional Transportation Plan
 Review and Update of Year 2035 Regional Transportation Plan #217752 1 Background Every four years, the Year 2035 Plan is reviewed Elements of review Validity of Plan Year 2035 forecasts Transportation
QUALITY TRANSPORTATION SUMMARY
 SUMMARY Transportation systems influence virtually every aspect of community life. They are the means for moving people, goods, and services throughout the community, and they play a significant role in