Public Disclosure Authorized. Public Disclosure Authorized. Public Disclosure Authorized. Public Disclosure Authorized ISBN
|
|
|
- Owen Cummings
- 5 years ago
- Views:
Transcription


1 Public Disclosure Authorized Public Disclosure Authorized Public Disclosure Authorized Public Disclosure Authorized National Statistics Bureau Royal Government of Bhutan The World Bank ISBN

2 BHUTAN Poverty Analysis 2012 National Statistics Bureau Royal Government of Bhutan The World Bank
3 ISBN: Copyright National Statistics Bureau, Photos contributed by Nima Tshering, Tashi Dorjee, Tshering Penjor and Dorji Phuntsho Design by Loday Natshog Communications

4 Contents Acknowledgement iv Foreword v Executive Summary vii Chapter 1: Introduction Background Objectives Data Source 1 Chapter 2: Updating the Poverty Lines Updated Food Poverty Line Updated Non-food Allowance and Total Poverty Line Spatial Price Index 6 Chapter 3: Patterns in Consumption Poverty Poverty Rate Depth and Severity of Poverty Poverty trend Poverty by Household Characteristics 12 Chapter 4: Basic Needs Education Income Health Household Amenities, Assets, and Access to Services Perception and Priorities 21 Chapter 5: Inequality Consumption Quintiles Gini Index 23 Chapter 6: Conclusion 27 Annex I: Additional Statistical Tables 30 Annex II: Technical Notes 36 iii
5 Acknowledgement This poverty analysis report is prepared by a four-member team from National Statistics Bureau Mr. Cheku Dorji (Dy. Chief Statistical Officer), Mr. Tashi Namgay (Statistical Officer), Mr. Sonam Gyeltshen (Research Officer), and Mr. Cheda Jamtsho (Research Officer). Experts from the World Bank Dr. Aphichoke Kotikula (Sr. Economist), Dr. Srinivasan Thirumalai (Sr. Economist),and Dr. Hiroki Uematsu (Junior Professional Officer) and Dr. Nobuo Yoshida (Sr. Economist) greatly contributed by verifying the results and conducting robustness tests for comparability with the 2007 poverty indicators. They also reviewed and provided comments on the draft report. Mr. Kuenga Tshering (Director General) and Mr. Phub Sangay (Chief Statistical Officer) through their advice and guidance that better shaped the report also deserve special thanks. Finally, the office wishes to acknowledge the support of the World Bank for all the technical and financial support in bringing out this report. iv
6 Foreword The National Statistics Bureau (NSB) is pleased to present the Poverty Analysis Report (PAR) It is based on the data from Bhutan Living Standards Survey (BLSS) 2012 conducted by NSB with the support of the Asian Development Bank. A key objective of this report is to prepare updated poverty estimates that are as comparable as possible with the estimates prepared in Both the BLSS 2007 and 2012 questionnaires were nearly identical and the data from both the surveys were checked for comparability by the experts from the World Bank. The variables included in estimating poverty lines and rates were also checked for robustness to confirm the comparability. This report measures poverty in Bhutan in 2012, and evaluates the change in poverty compared to It is reassuring to learn from the report that poverty, as measured by the percentage of poor has declined from about 23.2 percent in 2007 to 12 percent in Poverty is multi-dimensional and there is no single solution. In general, people are poor because they are stuck in circumstances which don t allow them to get ahead. One of the reasons for poverty reduction can be attributed to the noble Royal Kidu Program. Through the program, many landless households were able to get land permanently registered in their names which changed their lives forever. Generally, landless households are more vulnerable to poverty. The Kidu program also extends the education of the poor children and the support for elderly and needy citizens of the country. These initiatives could have direct impact in improving the living standard of the poor. It is our earnest hope that the report will undoubtedly cast light on a huge range of policy issues and that the poverty statistics presented in this report will be used to design policies and programs aimed at improving the living standards of the poor. Finally, NSB would like to acknowledge with deep appreciation the support of the Royal Government of Bhutan. Our sincere thanks extend to the World Bank for financial and technical support in bringing out the PAR The data analysis team deserves all the appreciation for the hard work and dedication exhibited in bringing out this report. Kuenga Tshering Director General v
7
8 Executive Summary Poverty Rate PAR 2012 established the total poverty line at Nu. 1, per person per month. The total poverty line is obtained by adding the food poverty line of Nu. 1, to non-food allowance of Nu An estimated 12 percent of the population is found to be poor. Thus, poverty has declined by about half from the estimate of 23.2 percent in Poverty in rural areas (16.7%) is significantly higher than urban areas (1.8%). Only about three percent of the population is subsistence poor i.e., persons belonging to households with per capita consumption below the cost of subsistence diet food. Poverty rates are observed to be high in Dagana, Samtse, Lhuentse, Pema Gatshel, and Zhemgang. Household Characteristics In both urban and rural areas, a poor household has a much larger family size than a non-poor household. However, the number of households with large size is much less than the number of small sized households. Persons living in households where the head is currently working have higher living standards than those living in a households whose head is either unemployed or out of the labour force. Among the employed, poverty levels are higher in households whose head works in agriculture. The poverty rate is about three percent for those below 25 years of age as compared to 14 percent for those aged 65 years and older. This may indicate a person s inability to engage productively in economic activity with age. At least 68 percent of the household heads in Bhutan are between 25 and 54 years old, while less than five percent are below 25, and about 13 percent are 65 and above. About 44 percent of the poor live in households whose head is engaged in agriculture; and at least 16 percent in households whose head is not actively participating in the labour force. Basic Needs The analysis shows that the poor have a much lower (52%) literacy rate than the non-poor (65%). The literacy rate of the poor in urban areas is 17 percentage points lower than the rate for the urban non-poor while in the rural areas the rate for the poor is six percentage points lower than the rural non-poor. About 50 percent of the non-poor adult population (15+) has not attended school/institute compared to about 70 percent of the adult poor population. Around 17 percent of the surveyed population reported that they had suffered from sickness or an injury in the four weeks prior to the survey, with no significant difference between the poor and non-poor. However, of this population, only about half (53%) of the poor visited a medical facility compared to 69 percent of the non-poor. Among those who gave birth during the 12 months prior to the BLSS 2012, a smaller proportion of poor women in rural areas received ante-natal care than non-poor women. However, a considerable proportion of women received pre-natal care in urban areas, even amongst the poor Majority (98%) of the population have access to improved water source with hardly any disparity existing between the poor and the non-poor households. At least 80 percent households have access to improved sanitation; between poor and non-poor households both in urban and rural areas the disparity is around 15 percentage points. Nearly all (97%) households in urban areas, even the poor use electricity for lighting purpose. In rural areas, however, only 69 percent of the poor households have electricity as their primary source of lighting. Nationally, only 21 percent among the poor households have TV compared to 59 percent in the non-poor households. Most of the poor, especially in the rural areas, suggest that road infrastructure and bridges, Commerce, transport and communication and water supply should be the priorities for the government. In urban areas, poor households specify housing, labour and employment creation, and land and resettlement, as priority concerns Inequality On average, a person in the top 20 percent of the national population consumers 6.2 times more than a person in the poorest 20 percent of the population he poorest 20 percent of the population. The Gini index, which measures inequality, has remained almost the same at the national level (0.35 in 2007 and 0.36 in 2012). However, it has slightly increased for the both urban (0.32 to 0.35) and the rural areas (0.32 to 0.34). vii

9
10 Chapter 1: Introduction 1.1. Background The purpose of this report is to provide updated poverty estimates for Bhutan using newly available data from the Bhutan Living Standards Survey (BLSS) Baseline poverty estimates were produced in 2003 and 2007 using the corresponding BLSS data. The updated poverty estimates in this report can be used to monitor Bhutan s success in reducing poverty during the past five years since the last poverty estimates in It is also useful for broadening and deepening our understanding of the changing dimensions of Bhutan s poverty and for designing appropriate interventions for poverty reduction and monitoring efforts Objectives A key objective of this report is to update poverty estimates that are as comparable as possible with the estimates prepared for This involves the following steps: The 2012 poverty lines are updated for inflation in food and non-food prices during the period. New estimates of per capita household consumption are prepared that are as comparable as possible with the consumption estimates prepared in The per capita consumption of each household in the sample is compared to the updated poverty lines to identify the poor and to calculate the relevant poverty indicators. Although there are a few changes in the components of questionnaire in the BLSS 2012 compared to BLSS 2007, robustness test carried out revealed that in both years the food consumption shares are roughly the same and the distribution of major food items are comparable thus suggesting a high degree of comparability between the results for 2007 and Chapter one describes briefly the BLSS 2012, which is the primary data source used in preparing these updated 2012 poverty estimates. Chapter two summarizes the work done to update the 2012 poverty lines for inflation. Chapter three presents patterns in consumption poverty. Chapter four presents an analysis of socio-economic indicators that provide an independent source of information on poverty reduction during the period Chapter five provides measures of income inequality (for example, estimates of Gini coefficient). Chapter six provides the report s conclusions and recommendations for future poverty monitoring Data Source The data used for this report is from the BLSS 2012 which is the latest and third in a series of national household surveys that have been conducted by the NSB. Like the previous rounds, the BLSS 2012 followed the World Bank s Living Standard Measurement Study (LSMS) Methodology. It is comparable in size to the 2007 survey, but more than twice the size of the survey in The BLSS 2012 surveyed 8,968 households across the country from a planned sample size of 10,000. It provides the same level of detailed information needed to prepare updated poverty estimates. The questionnaire that was administered in both the BLSS 2007 and 2012 is similar. 1 Using the BLSS 2012 data, an aggregate of household consumption was generated and subsequently analyzed. This aggregate excludes household expenditures on durables, irregular expenses, health expenses (on consultations and 1 In the 2012 questionnaire, the purchased item is broken into purchased domestic and purchased imported. The education expenditure in 2012 was the expenditure incurred in the last academic year unlike the 2007 survey that collected estimated expenditure for the current academic year. 1
11 Bhutan Poverty Analysis 2012 hospitalization) from the total household consumption expenditures (found in the BLSS 2012 report), but includes expenses on medicines. Details on the computation of this consumption aggregate are provided in Technical Note 1 of Annex-II. The BLSS 2012 gathered data on household consumption expenditure, and as such, provides a means of assessing the level of poverty and well-being in Bhutan. Besides collecting consumption expenditure data, it also collected data on demographic characteristics of household members, household assets, credit and income, remittances, housing, access to public facilities and services, education, employment, health of household members and prices paid for commodities. Also, it included an additional module on social capital and questions on happiness and self-rated poverty. The sample households for the BLSS 2012 were selected on the basis of two mutually exclusive sampling frames for rural and urban areas. The total sample size was set to about 10,000 (comparable in scale to BLSS 2007) and allocated equally between the rural and urban areas to capture higher variability of data in the urban areas. Sample sizes of urban and rural areas were allocated across all dzongkhags and strata in proportion to the number of households. The primary sampling units (PSUs) were blocks for urban (towns) areas and chiwogs for rural areas while the secondary sampling units (SSUs) were the households within the selected blocks/ chiwogs. A set of household weights are needed when interpreting statistics from the BLSS 2012 household data. These weights are needed to correct for the varying area and household in the survey design. They can be regarded as made up of three components: (a) a correction for the differing sampling rates of PSUs used in the strata at the area stage of sampling; (b) a correction for varying numbers of households selected in each PSU; and, (c) a correction for non-response. The survey population coverage included all households in the country except (a) diplomatic and expatriates households; (b) institutional households, i.e., residents of hotels, boarding and lodging houses, monasteries, nunneries, school hostels, orphanages, rescue homes, and under trials in jails and indoor patients of hospitals; and, (c) barracks of military and paramilitary forces, including the police. 2
12

13
14 Chapter 2: Updating the Poverty Lines Bhutan s poverty lines, defined in 2007, consist of a single national food poverty line and single non-food allowance and refer to monthly per capita levels of food and non-food consumption. Both the food poverty line and the non-food allowance measured in current prices must therefore be updated for inflation, i.e., they need to be converted into 2012 prices. This chapter of the report discusses the procedures used to update the 2007 poverty lines Updated Food Poverty Line The poverty line, the minimum acceptable standard of per capita consumption needed to assure a minimum standard of living, is obtained using the Cost of Basic Needs (CBN) approach, a commonly used methodology for constructing the poverty lines in many countries. This approach estimates the food component of the poverty line as the cost of a food bundle that provides a predetermined minimum required level of food energy. The total poverty line is obtained by adding to the food component the cost of the non-food allowance. The food poverty line is based on the estimated cost of a single national reference food bundle providing an average subsistence diet of 2,124 Kcal per day (i.e., averaged over persons of all ages and both sexes). 2 The reference food bundle was designed to reflect the actual food consumption patterns of Bhutanese in 2007 who consumed a diet yielding approximately 2,124 Kcal per day. The food basket used in this report is representative of the diet of a reference population, namely population in the second, third or fourth decile based on nominal per capita consumption. The selection of households in the second to the fourth deciles of the per 2 There are 53 food items in the food bundle capita expenditure distribution ensures that expensive nor cheap food items are heavily represented in the basket. After all, prices paid even of the same items could differ across the population. Although food consumption patterns differ across the country, a single food basket was used to ensure a consistent comparison of welfare levels of people living in different areas of Bhutan. The 2007 poverty line is updated for inflation to the year The methodology used to update for inflation involves (1) updating the food poverty line using the ratio of the food CPI is 2012 to the food CPI in 2007 CPI (2) using the food price data collected in the BLSS 2012 to estimate spatial (regional) differences in food prices in the survey year. The CPI is believed to be a reliable source of information about inflation because of its rigorous collection. Households (and their members) consuming (in real terms) less than the food poverty line, of Nu. 1, per person per month are considered subsistence poor Updated Non-food Allowance and Total Poverty Line The 2007 baseline non-food allowance was estimated as the per capita monthly non-food consumption of households in the reference population whose food spending was near the food poverty line. This is a conservative non-food allowance because it represents non-food consumption that is at the expense of food consumption that could otherwise be used to achieve the reference food bundle of 2,124 calories per day per person. 3 3 Although persons with total per capita consumption below the food poverty line would have to sacrifice some food consumption to purchase non-food items, they would presumably substitute cheaper foods for more expensive foods within the reference food bundle. 5
15 Bhutan Poverty Analysis 2012 In order to update the non-food allowance for inflation in different regions, it is necessary to develop regional nonfood price indices similar to the food price index. Estimates of inflation in non-food prices developed in this report are based on non-food price data collected for the 2007 and 2012 CPI. Nationwide, the non-food allowance was estimated at Nu per person per month. Adding this non-food allowance to the food poverty line yields the total poverty line, estimated to be Ngultrum 1, per person per month, at 2012 prices. Households (and their members) consuming (in real terms) less than the total poverty line, of Nu.1, per person per month are considered poor. Table 2.1 shows the comparison of poverty lines (foodpoverty line, non-food allowance and poverty line) for 2007 and 2012 along with the inflation in the Consumer Price Index (CPI). As mentioned, the 2012 food and non-food poverty lines are derived from the 2007 values by adjusting for inflation that occurred between 2012 and Table 2.1. Poverty Lines of 2007 and 2012 and CPI Inflation Poverty lines CPI inflation Food poverty line , Non-food allowance Total poverty line 1, , Table 2.2. Regional Price Deflator (Median of Household-level Paasche Indices), by Dzongkhag and Area Dzongkhag Urban Rural Bumthang Chhukha Dagana Gasa Haa Lhuentse Monggar Paro Pema Gatshel Punakha Samdrup Jongkhar Samtse Sarpang Thimphu Trashigang Trashi Yangtse Trongsa Tsirang Wangdue Phodrang Zhemgang Bhutan Spatial Price Index Prices differ across the country and therefore per capita consumption expenditures (in nominal terms) across regions are not directly comparable. An important staple food like rice is found to be much more expensive in Gasa than in Wangdue Phodrang, so that a household in Gasa consumes less with the same nominal consumption expenditure on rice than a household in Wangdue Phodrang. To make per capita consumption between regions comparable, values must be deflated using a cost of living index. However, no such index is available. The usual approach to controlling for spatial price differences is to use a price index that approximates the true cost-of-living index. One possible spatial price index is the Paasche index, which calculates the cost of buying a region s basket of goods using base reference prices. A Paasche index was computed with food items using the BLSS 2012 median price data. Details on these computations are provided in Technical Note 1 (d). Consequently, the average monthly household consumption in 2012 for Bhutan was estimated at Nu.20,913 in real terms as a result of adjustments in differences in cost of living (and exclusion of some non-food expenditures on durable items and other irregular expenses). Average monthly per capita consumption in real terms was estimated at Nu. 5,493 per person per month. In 2007, average monthly household consumption was estimated at Nu.11,777 and Average monthly per capita consumption in real terms was estimated at Nu. 2,745 per person. 6
16
17
18 Chapter 3: Patterns in Consumption Poverty Households with per capita real consumptions below the poverty line are said to be poor and those with per capita real consumption below the food poverty line are subsistence poor. Subsistence poverty may be viewed as extreme poverty, i.e., those whose consumption expenditure is insufficient even to meet basic food needs even if they devote their entire consumption expenditure to food alone. Consumption poverty in this report is measured at the household level since data from the BLSS 2012 does not allow intra-household analysis. Consequently, if a household is considered poor, then all its members are considered poor. Similarly, if a household is non-poor, then none of its members is poor. Three aspects of consumption poverty are of particular interest: Poverty Incidence the proportion of persons (or households) identified as poor; Poverty Gap (or Depth of Poverty) the extent to which those identified as poor fall below the poverty line (in relation to the poverty line); Poverty Squared Gap (or Severity of Poverty) a measure of the inequality among the poor. These poverty measures are presented in this report for the country as a whole, and for certain groups of the population, such as for households in urban and rural areas, and in dzongkhags, and in by the sex of the household head, among others. For more information on indices of poverty, see Technical Note Poverty Rate The food poverty line and total poverty line are used to compute subsistence and poverty incidence, respectively. Figure 3.1 illustrates subsistence and poverty rates for population across urban and rural areas. These rates are poverty head counts i.e., the percentage of the poor persons. For the 2012 the total poverty rate for Bhutan is estimated to be 12 percent. This means that, around one out of eight persons belong to households whose per capita real consumption is below the total poverty line of Nu. 1, per person per month. It can be observed that subsistence incidence, i.e. extreme poverty, is relatively small in the country: only about three percent of the population in Bhutan belongs to households that are spending less per person than the food poverty line of Nu. 1, Poverty in Bhutan is still a rural phenomenon with about 17 percent of the rural population being poor as against only about two percent in the urban areas. While the four percent of extremely poor persons in rural areas is quite small, it is quite large in relation to that of urban area rate of 0.3 percent. Figure 3.1. Poverty and Subsistence Poverty in Bhutan Percent Urban Rural 3.9 Poverty Headcount Subsistence Headcount 12.0 Bhutan 2.8 9
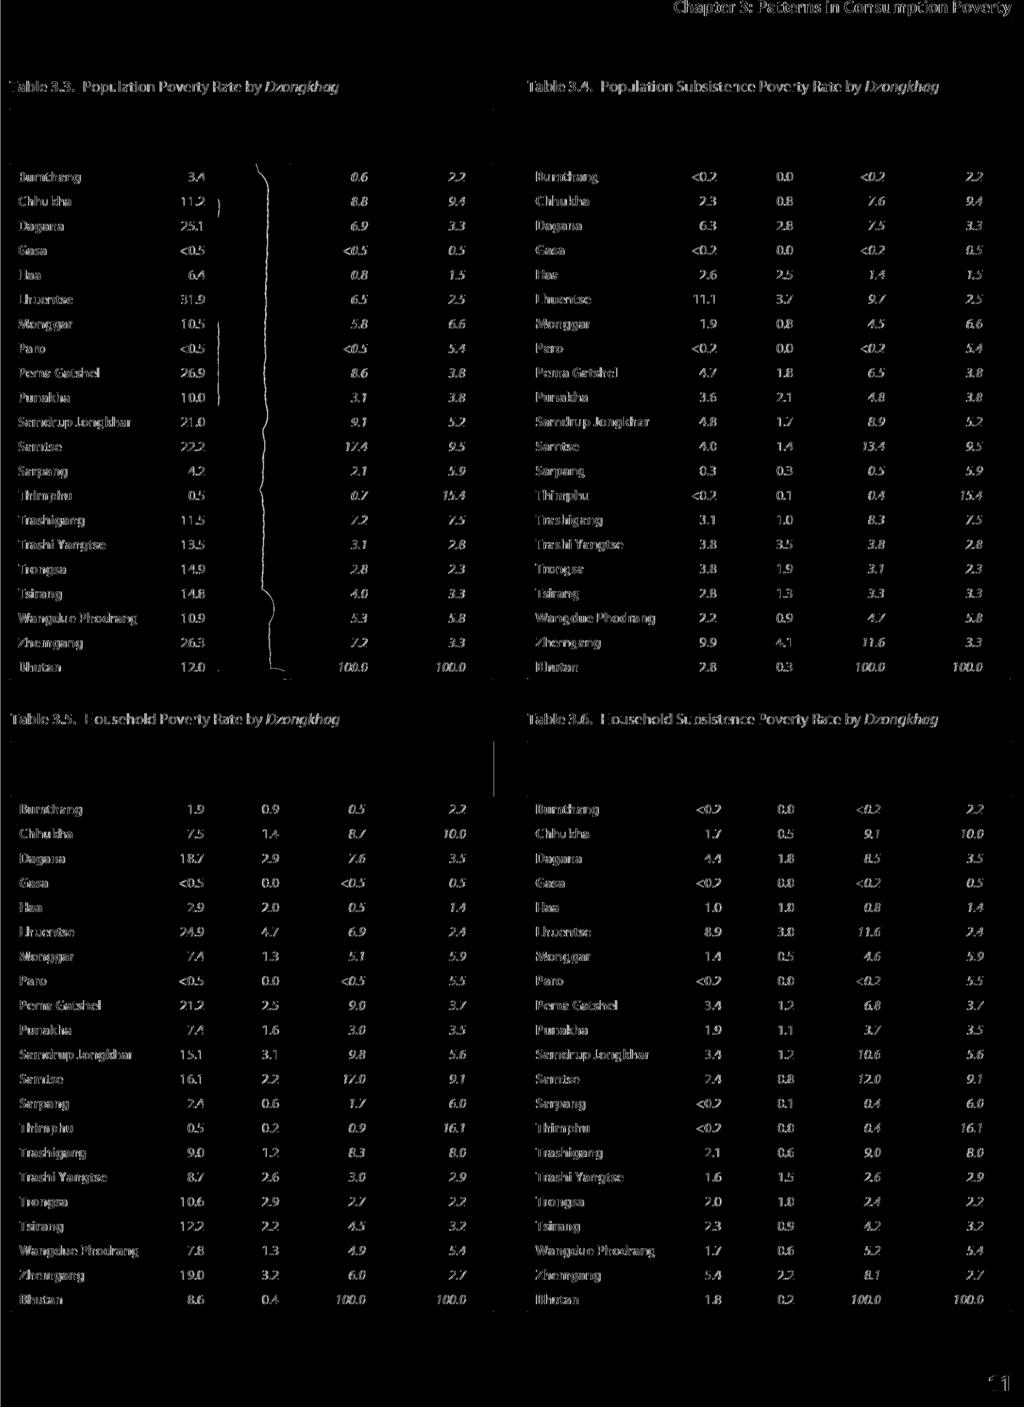
19 Bhutan Poverty Analysis 2012 Table 3.1. Population Poverty and Subsistence Poverty by Area Area Table 3.2. Household Poverty and Subsistence Poverty by Area Area Poverty Rate Standard Contribution error to National Poverty Rate Standard Contribution error to National Subsistence Poverty Rate Standard Contribution error to National Subsistence Poverty Rate Standard Contribution error to National Population Share Urban Rural Bhutan Population Share Urban Rural Bhutan The poverty and subsistence poverty statistics are shown in Table 3.1 together with their standard errors. Because the poverty incidence figures are estimates from a sample survey, it is important to consider their standard error when evaluating the precision of these estimates. While the best estimate of poverty rate in Bhutan in 2012 is 12 percent, this estimate has a margin of error of 1.2 percentage points. That is, we are 95 percent confident that the true poverty rate is between 10.9 percent and 13.2 percent. We are also confident that urban poverty, estimated at 1.8 percent (but could range between 1.2% to 2.3%) is much lower than rural poverty of 16.7 percent (that could range between 15.1% to 18.3%). In addition, we observe that about 95 percent of poor persons throughout the country reside in rural areas. Among the extremely poor, the proportion is even higher: 97 percent resides in rural areas. Consequently, efforts toward poverty reduction ought to continue to focus on ural development. The poverty estimates of 2012 (Table 3.1) are comparable with previous estimates of 23.2 percent poor and 5.9 percent subsistence poor in Table 3.2 presents poverty incidence and subsistence incidence as a percent of households. About nine percent of households are poor, and about two percent are subsistence poor households. Hence, of the estimated 127,942 households, 11,049 are poor, and 2,322 are extremely poor. A comparison of the poverty statistics in Table 3.1 and Table 3.2 indicates that poverty measures based on population are larger than those based on the number of households because poor households, on average, have more household members Dzongkhag level estimates of poverty incidence and subsistence poverty for the population and for households are shown in Table 3.3 (together with their standard errors). Ranks for dzongkhags are difficult to determine due to overlapping confidence intervals, but it can be observed that poverty rates are highest in Dagana, Lhuentse, Pema Gatshel, Samdrup Jongkhar, Samtse, and Zhemgang. However, the survey shows that Gasa and Paro have the least poverty. It is also important to observe the distribution of the poor population. Among the dzongkhags, 17 percent of the poor population resides in Samtse followed by Samdrup Jongkhar (9.1%), Chukha (8.8%) and Pema Gatshel (8.6%). In terms of the subsistence poverty, the rates are high in Lhuentse (11.1%) and Zhemgang (9.9%). In terms of the distribution of subsistence poor, Samtse and Zhemgang have the highest proportion of the subsistence poor population (Table 3.4). The estimated number of poor and subsistence poor households across dzongkhags are provided in Table 3.5 and Table 3.6. These tables include the contribution of each dzongkhag to household poverty and subsistence poverty. Dagana and Lhuentse have high proportion of poor households. The largest proportion of poor and subsistence poor households is in Samtse Depth and Severity of Poverty Poverty analysis is not limited to examining poverty rates and comparing the statistics across sub groups of the population. It is important to also look into the depth and severity of poverty. The poverty gap and poverty squared gap indices measure the depth and severity of poverty, respectively. For an individual, the poverty gap is the difference between the poverty line and actual per capita expenditure (the gap is zero for all non-poor individuals). The poverty gap index measures the average extent to which individuals in a population fall below the poverty line and expresses it as a percentage of the poverty line. The poverty squared gap index gives more weight to the very poor than those who are less poor. It is the average value of the square of depth of poverty for each individual measured relative to the poverty line. More explanation on these indices is available in Technical Note 4. For both the poverty gap and poverty squared gap, as well as for poverty rate, the larger the value of the index, the greater the degree of poverty. These poverty measures are important for planning poverty reduction programs. All things being equal, sub-groups of the population with higher measures should receive priority for poverty reduction programs. 10
20
21 Bhutan Poverty Analysis 2012 Figure 3.2. Depth and Severity of Poverty in Bhutan Figure 3.3 Population Poverty Rates for 2007 and Poverty Gap Poverty Squared Gap Percent Percent Urban 0.1 Rural Bhutan Urban Rural Bhutan Figure 3.2 shows that poverty is deeper and more severe in rural areas than in urban areas. The poverty gap and poverty squared gap (with their standard errors) across dzongkhags are listed in Annex I (Table A-1). The table also includes the contribution of the dzongkhags to the national poverty measures. Some dzongkhags such as Lhuentse, Pema Gatshel and Zhemgang have very high poverty measures (whether in terms of poverty rate, gap or severity). However, Samtse has a very high share of the contribution to the national poverty measures, partly because of its high population share Poverty trend Figure 3.3 shows that the over poverty reduced from 23 percent in 2007 to 12 percent in 2012 and the reduction rural poverty from 31 to about 17 percent. However, the proportion of poor in urban areas remained practically unchanged at about two percent. As shown in Figure 3.4 subsistence poverty decreased from six percent (2007) to about three percent (2012). In the rural areas, the rate was reduced from eight percent in 2007 to four percent in In the urban areas, the subsistence poverty rate is quite low and remains unchanged (around three in 100 persons) Poverty by Household Characteristics Households differ in their demographic composition and characteristics. Household sizes in Bhutan are, on average, larger in rural than urban areas. Table 3.7 shows that, across the country, a poor household typically has much larger family (6.3) than a non-poor household (4.4). The difference Figure 3.4. Population Subsistence Poverty Rates for 2007 and 2012 Percent Urban Rural 2012 Bhutan is larger in rural areas than in urban areas. As shown in the figure 3.5 the poverty rates and subsistence poverty rates also increase with the size of the household. The increase in the poverty rate is faster than the subsistence rate as the household size increases. The share of households increases rapidly reaching a maximum of 40 percent for households containing four or five members. However, the share then decreases and reaches a minimum with four percent of the households containing nine or more members This indicates that, although the poverty rates are higher among the larger household size, especially those with an average size of more than five, the corresponding share of total households is much less
22 Chapter 3: Patterns in Consumption Poverty Table 3.7. Average Household Size by Area, Poverty Status and Sex of Head Area/Poverty status Male Household head Female Total Urban Poor Non-poor Rural Poor Non-poor Bhutan Poor Non-poor Table 3.8. Household Poverty and Subsistence Poverty Rates, by Area and Sex of Household Head Area/ Household Head Index Poverty Rate Contribution to National Subsistence Rate Index Contribution to National Share of Total Heads Urban Figure 3.5. Household Poverty and Subsistence Poverty Rates by Household Size Percent Poverty Rate Subsistence Rate 40.1 Figure 3.6. Population Poverty Rate by Economic Activity of the Household Head Share of total households 3.9 Male Female Bhutan Rural Male Female Bhutan Male Economically Inactive Unemployed Services Contribution to national poverty rate Poverty incidence Female Industry Typically, welfare and household demographic composition are observed to have a nexus with the characteristics of the household head. Male headed households are observed to be, on average, less poor than female headed households. This difference is more pronounced for subsistence poverty (Table 3.8). Figure 3.6 combines information on poverty, participation in the labour force, and main sector of employment of the household head. Persons living in households where the head is currently working have higher living standards than those whose head is either unemployed or out of the labour force. Among the employed, poverty rates are higher in households whose head works in agriculture. About 44 percent of the poor live in households whose head is engaged in agriculture; and 16 percent in households whose head is not actively participating in the labour force. Agriculture 18.5 Figure 3.7 displays poverty rates by the highest level of educational attainment of the household head. The education levels in Bhutan are generally quite low, especially among household heads. As expected, the higher the level of learning completed by the household head, the lower the poverty rate. The returns to education increase considerably if the head has attended secondary levels irrespective of whether the household is in an urban or rural area. Poverty rates increase with the age of the household head (Table 3.9). The poverty rate is about three percent for those below 25 years as compared to 14 percent for those aged 65 years and older. This may indicate an inability to actively engage in economic activity with age. It is noticed that most
23 Bhutan Poverty Analysis 2012 Figure 3.7. Household Poverty Rate by Educational Attainment of Household Head by Area Figure 3.9. Household Distribution and Poverty in Rural Areas Poverty rate Percent of households None At most grade VIII XI to XII Educational attainment 0.0 Beyond XII Landless Upto 1 acre 1-2 acres Poverty incidence 2-3 acres acres 4-5 acres 5 + acres Distribution of households Urban Rural Bhutan Figure 3.8. Distribution of (a) Type of Floor and (b) Type of External Walls by Household Poverty Status (a) Poor Non-poor Total (b) Poor Non-poor Total Percent Percent Wood 10.9 Cement/tile Concrete Clay/earthen Plank/shingles Other 10 0 Mud-bonded 6.1 Cement-bonded Concrete Mud Wood/branches Other Table 3.9. Household Poverty and Subsistence Poverty Rates by Age of Household Heads Age of Household Head Rate Poverty Contribution to National Subsistence Poverty Rate Contribution to National Share of Total Heads < All ages Table Household Land ownership by Area and Poverty Status Area Poor Non-poor Total Urban Rural Bhutan
24 Chapter 3: Patterns in Consumption Poverty household heads (68%) in Bhutan are aged 25 to 54 years, while less than five percent are below age 25, and about 13 percent are 65 and above. Figure 3.8 shows the distribution of floor and external wall types by household poverty status. There is not much difference between poor and non-poor households in the use of materials, except for cement/tile and plank/shingles. Just over 10 percent of the poor households has cement/tile compared to 30 percent for the non-poor. At least 23 percent of the poor have clay/earthen floor while less than 10 percent of non-poor have such flooring. Regarding the main materials of the wall, only seven percent of the poor households have cement-bonded or concrete compared to 37 percent for the non-poor households. Table 3.10 shows land ownership in urban and rural areas by poverty status. Across the country, 66 percent of households own land with a higher proportion owned by poor households. The proportion of households owning land in rural areas is at least two and half times that of urban areas. Figure 3.9 illustrates the distribution of the number of households and the poverty rate by size of land holdings in rural areas. The largest proportion of households own up to one acre of land but the proportion decreases with the size of land holding. The poverty rate is the lowest for landless households. The incidence of poverty is slightly lower for households who own two to three acres compared to those who own one to two acres, but is almost similar to those households who own more than three acres. 15
25
26 Chapter 4: Basic Needs Other non-monetary dimensions of welfare, such as health and education status that pertain to basic needs, are complementary to consumption poverty. The health status of an individual undoubtedly determines her/his quality of life. Literacy and education status are widely recognized to be important for improving the living standards of the population. People with little or no education are likely to be unemployed, or if they do get employed, they often have lowpaying labour-intensive occupations. Such occupations often put them at risk of staying poor. More education provides individuals with the basic knowledge, skills and competence required for economic productivity, which, in turn, will provide her/him assets and other capabilities for further improving her/his living standards and consequently some degree of social mobility Education According to Figure 4.1, poor persons in Bhutan have a much lower literacy rate than non-poor persons: 52 percent against 65 percent, respectively. Disparities persist in literacy rates between poor and non-poor both in the urban and rural areas. The literacy rate of the poor in urban areas is 17 percent lower than the non-poor while in the rural areas the literacy rate of the poor is just 6 percent lower than the non-poor. At least 70 percent of the poor population 15 years and older have never attended school/institute while just over half of the non-poor have not attended. Although there is almost equal proportions of the poor and non-poor adult population that have some educational attainment up to at most class eight, the proportion who have XI and XII qualifications among the poor is just half that of the non-poor population. Just about one percent of the poor population has beyond Figure 4.1. Literacy Rate by Area and Poverty Status Percent Urban Rural Bhutan Poor Non-poor Total secondary qualification while adult population among the non-poor has seven percent (Figure 4.2) Income The BLSS 2012 collected information on the household income. Figure 4.3 illustrates that the average monthly income in urban areas is higher than in rural areas by about Nu. 10,000. The disparities between the poor and non-poor households in terms of average income exist both in urban and rural areas. In urban areas, the average income of the non-poor households is Nu. 23,784: more than three times that of the poor households. In the rural areas, the average income of the non-poor is Nu. 9,348: more than twice that of the poor households Health The BLSS 2012 collected information about the health conditions and access to health services. Around 17 percent of 17
27 Bhutan Poverty Analysis 2012 Figure 4.2. Distribution of Adult (15+) Educational Attainment by Poverty Status Non-poor Poor Total None At most grade VIII XI to XII Beyond XII Figure 4.3. Average Monthly Household Income by Poverty Status and Area Average monthly household income 25,000 20,000 15,000 10,000 5, ,387 4,096 3,905 Poor Urban 23,784 14,647 9,348 Non-poor Rural the population reported that they had suffered from sickness or an injury in the four weeks prior to the survey, with no significant difference between the poor and non-poor (Figure 4.4). However, of the population that reported some illness only over half (53%) of the poor visited a medical facility compared to 69 percent of the non-poor. Table 4.1 illustrates a disparity between the percentage of the poor (36%) and the non-poor (58%) who first visited JDWNRH, or a regional referral or district hospital when they suffered from sickness or injury four weeks before the interview. At least 60 percent of the poor visited BHU/ORC compared against only 38 percent of non-poor. The disparity is more common in rural areas. When examining women who gave birth during the 12 months prior to the BLSS 2012 interview, there is no difference between poor and non-poor women. However, in rural areas, a smaller proportion of poor women received ante-natal care than non-poor women. A considerable proportion of women received pre-natal care in urban areas, especially among the poor (Figure 4.5) ,784 13,736 8,674 Total Bhutan Figure 4.4. Health Seeking Behaviour by Area and Poverty Status Poor Non-Poor Poor Non-Poor Non-Poor Percentage of Persons Who Reported Sick During the Four Weeks Prior to the Enumeration Date Proportion of Persons Who Reported Sick and Consulted Health Provider 4.4. Household Amenities, Assets, and Access to Services The living conditions of a household are often highly correlated with its amenities, assets and access to services. Household amenities, including suitable sanitation facilities, and access to safe water sources, are not only wealth indicators, but also improve welfare conditions of the household. Lack of safe water or basic sanitation affects an individual s health by increasing her/his chances of contracting diseases that are transmitted in Poor Urban Rural Bhutan Figure 4.5. Proportion of Women Who Received Ante-Natal Care by Areas and Poverty Status Percent Urban Rural Bhutan Poor Non-poor Total 18
28 Chapter 4: Basic Needs Table 4.1. Distribution of Persons who Suffered from Sickness/Injury four weeks prior to the survey with Health Seeking Behaviour by Area and Poverty Status Health Service Provider Consulted Urban Rural Bhutan Poor Non-Poor Total Poor Non-Poor Total Poor Non-Poor Total JDWNRH Govt. regional referral hospital Govt. district hospital Govt. BHU/ORC Indigenous centres Traditional practitioner Others Total Figure 4.6. Proportion of Households with Access to Improved Water Source by Poverty Status and Area Poor Non-poor Total Figure 4.7. Proportion of Households with Access to Improved Sanitation by Poverty Status and Area Poor Non-poor Total Percent Percent Urban Rural Bhutan unsanitary environments. Some assets may allow households to cope with the risks brought about by seasonal variations in incomes from farming, or other sources of vulnerability. If the head of the household suddenly becomes unemployed, or dies, or if a natural disaster occurs, the household could use its assets to smooth consumption. Consequently, it is important to look at the amenities and assets of a household as well as their access to basic social services to get a comprehensive assessment of their welfare conditions. The BLSS 2012 shows that across the country, about all (98%) households have access to an improved water source, i.e., piped water, public tap, protected wells/spring, bottled water and rain water collection. There is hardly any disparity in access to improved water source between poor and non- 0 Urban Rural Bhutan Table 4.2. Household Distribution of Subjective Poverty by Area and Poverty Status Area/ Poverty Status Not poor Neither poor nor non-poor Poor Very poor Don t know Urban Poor Non-poor Rural Poor Non-poor Bhutan Poor Non-poor
29 Bhutan Poverty Analysis 2012 Table 4.3. Household Distribution of Subjective Happiness by Area and Poverty Status Area/Poverty Status Very happy Moderately happy Neither happy unhappy Moderately unhappy Very unhappy Urban Poor Non-poor Rural Poor Non-poor Bhutan Poor Non-poor Figure 4.8. Proportion of Households Fuel Use for Lighting by Poverty Status and Area Figure Rate of Characteristics for Perceived Poor and Poor Households Urban Rural Bhutan Poor Non-poor Poor Non-poor Poor Non-poor poor, both in urban and rural areas (Figure 4.6). However, further observation reveals that piped water into dwelling is less common among poor households forcing about onethird of the poor households to depend on a neighbour s pipe or public outdoor tap Electricity Kerosene Candles Others Figure 4.9. Proportion of the Population with Ownership of Mobiles, TV and Internet by Poverty Status Percent Mobile TV Internet Poor Non-poor Total Percent Literacy rate of household head Land ownership TV ownership Perceived Poor Antenatal care Poor Safe sanitation Regarding access to improved sanitation (Figure 4.7), at least 80 percent households have access to improved sanitation (sewers or septic tanks, flush-latrines, pit with slab, or ventilated improved pit latrines). The disparity of around 15 percentage point is observed between poor and non-poor households both in urban and rural areas. In urban areas, 81 percent of poor households have access to improved sanitation compared to only 62 percent in the rural areas. The BLSS 2012 found that the main source of energy for lighting throughout the country is electricity (88%) which is proportionally higher in urban areas (98%) than in rural areas (83%). Figure 4.8 illustrates that nearly all (97%) of poor and non-poor households in urban areas depend on electricity for lighting in rural areas, however, only 69 percent of the poor households have electricity as their main source of lighting. Figure 4.9 shows that 82 percent of poor households own mobile phone, but the corresponding proportion for the non
30 Chapter 4: Basic Needs poor is much higher (94%). The disparity between the poor and the non-poor is also evident for ownership of TV and internet connection in their homes. Only 21 percent among the poor households have TV compared to 59 percent in the non-poor households. The internet connection at home is low at 12 percent. Among the poor households, barely about two percent have a connection Perception and Priorities In the BLSS 2012, questions about the perception of poverty and happiness were included. The household head was asked if he considered the household to be poor. This can be thought of as a measure of perceived poverty. Across the country, at least a quarter (26%) of the household heads considers their households to be either poor or very poor. In the urban areas, the perceived poverty rate is 14 percent which is mostly driven by the poor households (56%). There is at least 10 percent of the household heads, who do not consider their households poor yet the analysis of survey data shows they are actually poor. About a quarter (23%) of the household heads belonging to non-poor households consider their households to be poor and the proportion is more than double in urban areas (30%) compared to rural areas (13%). Table 4.2 further shows that in the urban areas there is no household head that belongs to a poor household that considers itself to be nonpoor. It could be useful to develop a different poverty profile based on the perceived (subjective) poverty. It is generally true that the subjective poverty line is much higher than the poverty line. The mean per-capita expenditure of the perceived poor is Nu. 3,201 compared to Nu. 1,353 for the poor. Figure 4.10 shows the difference for some indicators. The literacy rate of the household heads, TV ownership, access to ante-natal care and safe sanitation are lower for the poor than for the perceived poor. The only exception is for the rate of land ownership. Regarding the perception on happiness (Table 4.3), the majority of the household heads reported they are moderately happy (52%) or very happy (33%). Although there is hardly any difference between the poor and non-poor who reported on moderate happiness, the proportion of household heads who reported being very happy is much higher among the poor households; around 20 percentage point and 10 percentage point higher in urban area rural areas, respectively. It is more likely that the non-poor households report being neither happy nor unhappy compared to poor households especially in the urban areas. The BLSS 2012 respondents were asked to identify an action agenda for the government that would improve their welfare. Most of the poor, especially in the rural areas, suggest that road infrastructure and bridges, commerce, transport and communication and water supply should be the priorities of government. In urban areas, poor households specified housing, labour and employment creation, and land and resettlement, as priority concerns. 21
31
32 Chapter 5: Inequality While poverty indicators focus on the population or households at the bottom of the per capita consumption distribution, it is also important to look at the spread of consumption over the entire population using inequality indicators. There is much interest in measuring inequality since high levels of inequality may contribute to, if not exacerbate, poverty. Growth is known to be important for poverty reduction. High inequality may result to lower subsequent economic growth and, consequently, in less poverty reduction. A high level of inequality may make it difficult for the poor to have a substantial share of the benefits of subsequent economic growth. Inequality indicators attempt to measure the deviation of a given consumption distribution from the ideal distribution, called perfect equality Consumption Quintiles Consider the distribution of real per capita consumption. Typically the population is ranked by ascending order of per capita consumption and the distribution is divided into fifths, i.e., 20 percent of the population, or equivalently quintiles. In Bhutan, the share (7.1%) of national consumption of the poorest quintile is only one sixth that of the share of the richest quintile of the population (Figure 5.1). Table 5.1 shows that a person belonging to the richest 20 percent of the national population consumes on average 6.7 times more than a person belonging to the poorest 20 percent of the population. This difference represents a decrease compared to the estimates in the BLSS 2007 suggesting improvements in consumption inequality. As is to be expected from Engel s Law, the proportion of total consumption allocated to food tends to decrease as the level of per capita real consumption increases Gini Index Consumption inequality can also be examined using graphical tools, such as the Lorenz curve, which maps the cumulative consumption share on the vertical axis against the distribution of the population on the horizontal axis. If each household had the same consumption, the resulting curve would be a 45-degree line known as the line of perfect equality. Figure 5.2 illustrates the Lorenz curve of total household consumption in Bhutan. The further away is the Lorenz curve from the line of perfect equality, the higher is the level of inequality. The Lorenz curve indicates that inequality in urban and rural areas is very pronounced. The degree of inequality is similar in urban and rural areas. This similarity may be the result of within country remittances, or households residing in rural areas that have some members who are earning in urban areas. In addition, it may suggest the need to examine the current definition of urban and rural areas. Figure 5.1. Per Capita Consumption Quintiles Percent Lowest 11.3 Lower Middle 15.5 Middle 22.4 Upper Middle 43.7 Upper Bhutan 23
33 Bhutan Poverty Analysis 2012 Table 5.1. Average Monthly Real Per Capita Consumption (Nu), Share in National Consumption, Average Share of Food to Total Consumption, Average Household Size by Consumption Quintile Indicator Lowest Lower Middle Middle Upper Middle Upper Overall Average Per Capita Consumption 1, , , , , ,603.2 Share of National Consumption Average Share of Food Consumption to Total Consumption Average Household Size Figure 5.2. Lorenz Curve of Per Capita Household Consumption by Area Cumulative proportion of real per capita consumption Lorenz curve for Bhutan Urban Areas Cumulative Percent of Population Line of Perfect Equality Rural Areas The Gini coefficient, measured by the ratio of the area between the line of perfect equality to the Lorenz curve, to the area (of the triangle) under the line of perfect equality, is a commonly used indicator of inequality. The Gini index ranges between 0 to 1 (with zero meaning perfect equality and one meaning perfect inequality). The typical values of the Gini coefficient is between 0.2 to 0.5. While comparisons with previous estimates and international comparisons may be done, such comparisons should be done with much caution. Comparisons are more meaningful across groups within the country. Figure 5.3 provides the Gini index at the national level and within urban and rural areas. The Gini at the national level (0.36) is observed to almost equal that of urban (0.35) and rural areas (0.34). Figure 5.3. Gini Coefficient by Area Urban Rural Bhutan 24
34

35
36 Chapter 6: Conclusion The Royal Government of Bhutan has been, over the past years, implementing developmental activities with the focus of increasing the living standards of its citizens. The 10th FYP in particular aimed to alleviate poverty under the theme of Poverty Reduction. Such themes reflect the Government s commitment towards improving the welfare of the people especially those who live in poverty. The Millennium Declaration, signed by the global community in 2000 at the United Nations, was a commitment to ensuring that poverty is reduced to half its 1990 by The PAR 2004 was the first attempt to measure the poverty situation in Bhutan based on consumption data from the BLSS It highlighted the poverty conditions in the country and unquestionably contributed to putting poverty on the development policy agenda, even though the FYPs have always had a pro-poor focus. The second analysis was carried out in 2007 using the BLSS 2007 data, which was designed to provide a portrait of the poverty conditions down to the dzongkhag level. The report examined an enriched set of information from the BLSS 2007, coming up with two poverty lines: a food poverty line of Nu per person per month for measuring subsistence (or extreme) poverty, and a total poverty line of Nu. 1, per person per month for measuring absolute poverty. Using these poverty lines, 23.2 percent of the population was living in poverty in The rate of subsistence (or extreme) poverty was estimated at 5.9 percent, - one in sixteen Bhutanese did not have enough income to purchase even their food needs. The current analysis report using BLSS 2012 data is based on a similar questionnaire, sample size and sampling methodology as BLSS 2007 that allows valid comparisons of poverty indicators over time. The poverty lines for the current analysis are updated from 2007 using the ratio of the Consumer Price Indices of 2012 and The total poverty line is obtained at Nu. 1, per person per month and subsistence poverty line of Nu. 1, per person per month. Consequently, the poverty rate is observed to be at 12 percent and subsistence poverty at 2.8 percent. Compared to the poverty rate in 2007, the result in 2012 represents a reduction of about 50 percent. However, in urban areas there is considerably smaller (i.e., from 0.2% to 0.3%) increase in the estimated total poverty index relative to the food poverty index, reflecting the more rapid inflation in food prices than in nonfood prices during 2012 and Besides providing comparable and updated poverty profiles, the PAR 2012 also presents a spatial distribution of poverty in Bhutan down to the dzongkhag level. Updated information about the conditions of the poor presented in this report conveys information necessary to guide the implementing plans and programs needed to eradicate poverty and improve the living standards of the poor in Bhutan. This report shows that poverty is still very much a rural phenomenon in Bhutan, and that living standards vary considerably across the dzongkhags. In terms of demographic characteristics and educational attainment, the analysis shows the households that are poor tend to be larger in size with more children, and to have heads with no education and whose employment is concentrated in the agricultural sector. Estimated literacy rates and inequality measures in this report appear to be improvements from the 2007 levels, thus giving a sense that public investments in basic social services, especially in education, have been successful in the rural areas. 27
37 Bhutan Poverty Analysis 2012 Such efforts must be continued and intensified. Like previous poverty analyses, this report confirms that poverty is still a very much a rural phenomenon where the majority (66%) of the population resides. While building a causal role for public policy in poverty reduction in Bhutan is beyond the scope of this report, some tentative conclusions can be suggested. Efforts in rural and regional development will thus have to be continued, and even expanded and accelerated. Improving access to credit in rural areas, assisting farmers in bringing their produce to vegetable markets in the towns, training farmers as entrepreneurs to transform their rural products should enable farmers to better reap the fruits of their labour.. Livestock development is an excellent way to reduce poverty in the poorest of rural areas as it increases the standard of living for the recipients. Families get better nutrition and a source of income by selling surplus dairy products. Another option is to create market opportunities to enable the rural population sell their goods at favourable prices. Poverty is bad not only for those who are poor but also represents a social problem that entail a joint responsibility by the government, private sector and the development partners in addressing this issue. Development plans should promote inclusive growth, speeding up growth in lagging regions, and reduce poverty in more deprived population groups. There is a need to look into the successes and failures in poverty reduction in other countries, and customize plans for Bhutan. It is hoped that this report will help all development stakeholders to understand the living conditions of the poor, and to listen to their often unheard voices, thereby leading to informed discussion and policy action. 28

38
selected poverty relevant indicators
 Public Disclosure Authorized Public Disclosure Authorized selected poverty relevant indicators December 217 ure Authorized Ministry of Planning and Finance Table of Contents 1. Introduction 3 2. Trends
CONSUMPTION POVERTY IN THE REPUBLIC OF KOSOVO April 2017
 CONSUMPTION POVERTY IN THE REPUBLIC OF KOSOVO 2012-2015 April 2017 The World Bank Europe and Central Asia Region Poverty Reduction and Economic Management Unit www.worldbank.org Kosovo Agency of Statistics
PART 4 - ARMENIA: SUBJECTIVE POVERTY IN 2006
 PART 4 - ARMENIA: SUBJECTIVE POVERTY IN 2006 CHAPTER 11: SUBJECTIVE POVERTY AND LIVING CONDITIONS ASSESSMENT Poverty can be considered as both an objective and subjective assessment. Poverty estimates
THE IMPACT OF SOCIAL TRANSFERS ON POVERTY IN ARMENIA. Abstract
 THE IMPACT OF SOCIAL TRANSFERS ON POVERTY IN ARMENIA Hovhannes Harutyunyan 1 Tereza Khechoyan 2 Abstract The paper examines the impact of social transfers on poverty in Armenia. We used data from the reports
Copies can be obtained from the:
 Published by the Stationery Office, Dublin, Ireland. Copies can be obtained from the: Central Statistics Office, Information Section, Skehard Road, Cork, Government Publications Sales Office, Sun Alliance
1. The Armenian Integrated Living Conditions Survey
 MEASURING POVERTY IN ARMENIA: METHODOLOGICAL EXPLANATIONS Since 1996, when the current methodology for surveying well being of households was introduced in Armenia, the National Statistical Service of
Contribute to nation building through the development of an effective revenue system
 Vision Contribute to nation building through the development of an effective revenue system Mission To ensure that the tax and customs administration has the capacity to collect taxes efficiently and effectively
Developing Poverty Assessment Tools
 Developing Poverty Assessment Tools A USAID/EGAT/MD Project Implemented by The IRIS Center at the University of Maryland Poverty Assessment Working Group The SEEP Network Annual General Meeting October
THE WELFARE MONITORING SURVEY SUMMARY
 THE WELFARE MONITORING SURVEY SUMMARY 2015 United Nations Children s Fund (UNICEF) November, 2016 UNICEF 9, Eristavi str. 9, UN House 0179, Tbilisi, Georgia Tel: 995 32 2 23 23 88, 2 25 11 30 e-mail:
Ministry of National Development Planning/ National Development Planning Agency (Bappenas) May 6 th 8 th, 2014
 May 6 th 8 th, 2014") Ministry of National Development Planning/ National Development Planning Agency (Bappenas) May 6 th 8 th, 2014 Schedule for this Session TIME TOPICS 13.00 14.00 Identification of the Poor 14.00 15.00 Measurement
Ministry of National Development Planning/ National Development Planning Agency (Bappenas) May 6 th 8 th, 2014 Schedule for this Session TIME TOPICS 13.00 14.00 Identification of the Poor 14.00 15.00 Measurement
Appendix 2 Basic Check List
 Below is a basic checklist of most of the representative indicators used for understanding the conditions and degree of poverty in a country. The concept of poverty and the approaches towards poverty vary
Updates on Development Planning and Outcomes. Presentation by. Dr Julius Muia, EBS PS, Planning, The National Treasury and Planning
 Updates on Development Planning and Outcomes Presentation by Dr Julius Muia, EBS PS, Planning, The National Treasury and Planning 4th CEOs Forum, Whitesands, Mombasa;30 th May 2018 Outline of the Presentation
Inter-Regional Variations in the Inequality and Poverty in Bhutan
 Inter-Regional Variations in the Inequality and Poverty in Bhutan Abstract Sanjeev Mehta The findings of this sample study suggest existence of high income disparities between the urban and rural areas
MONTENEGRO. Name the source when using the data
 MONTENEGRO STATISTICAL OFFICE RELEASE No: 50 Podgorica, 03. 07. 2009 Name the source when using the data THE POVERTY ANALYSIS IN MONTENEGRO IN 2007 Podgorica, july 2009 Table of Contents 1. Introduction...
The Moldovan experience in the measurement of inequalities
 The Moldovan experience in the measurement of inequalities Veronica Nica National Bureau of Statistics of Moldova Quick facts about Moldova Population (01.01.2015) 3 555 159 Urban 42.4% Rural 57.6% Employment
BOTSWANA MULTI-TOPIC HOUSEHOLD SURVEY POVERTY STATS BRIEF
 BOTSWANA MULTI-TOPIC HOUSEHOLD SURVEY Private Bag 0024, Gaborone. Tel: 3671300 Fax: 3952201 Toll Free: 0800 600 200 E-mail: info@statsbots.org.bw Website: http://www.statsbots.org.bw Preface This Stats
Characteristics of Eligible Households at Baseline
 Malawi Social Cash Transfer Programme Impact Evaluation: Introduction The Government of Malawi s (GoM s) Social Cash Transfer Programme (SCTP) is an unconditional cash transfer programme targeted to ultra-poor,
Poverty and Inequality in the Countries of the Commonwealth of Independent States
 22 June 2016 UNITED NATIONS ECONOMIC COMMISSION FOR EUROPE CONFERENCE OF EUROPEAN STATISTICIANS Seminar on poverty measurement 12-13 July 2016, Geneva, Switzerland Item 6: Linkages between poverty, inequality
1 For the purposes of validation, all estimates in this preliminary note are based on spatial price index computed at PSU level guided
 Summary of key findings and recommendation The World Bank (WB) was invited to join a multi donor committee to independently validate the Planning Commission s estimates of poverty from the recent 04-05
Executive summary WORLD EMPLOYMENT SOCIAL OUTLOOK
 Executive summary WORLD EMPLOYMENT SOCIAL OUTLOOK TRENDS 2018 Global economic growth has rebounded and is expected to remain stable but low Global economic growth increased to 3.6 per cent in 2017, after
CHAPTER 5. ALTERNATIVE ASSESSMENT OF POVERTY
 CHAPTER 5. ALTERNATIVE ASSESSMENT OF POVERTY Poverty indicator is very sensitive and reactive to all modifications introduced during the aggregation of the consumption indicator, building of the poverty
Research Report No. 69 UPDATING POVERTY AND INEQUALITY ESTIMATES: 2005 PANORA SOCIAL POLICY AND DEVELOPMENT CENTRE
 Research Report No. 69 UPDATING POVERTY AND INEQUALITY ESTIMATES: 2005 PANORA SOCIAL POLICY AND DEVELOPMENT CENTRE Research Report No. 69 UPDATING POVERTY AND INEQUALITY ESTIMATES: 2005 PANORAMA Haroon
Monitoring Poverty in rural Nicaragua through the Community Based Monitoring System: A SDGs and MPI report.
 Monitoring Poverty in rural Nicaragua through the Community Based Monitoring System: A SDGs and MPI report. Milagros Romero NITLAPAN CENTRAL AMERICAN UNIVERSITY UCA June 12, 2018 2018 PEP Annual Conference,
Welcome to the presentation on
 Welcome to the presentation on Poverty Reduction strategy in Bangladesh : Estimating and Monitoring of Poverty Mu. Mizanur Rahman Khandaker Deputy Director National Accounting Wing Bangladesh Bureau of
THE CAYMAN ISLANDS LABOUR FORCE SURVEY REPORT SPRING 2017
 THE CAYMAN ISLANDS LABOUR FORCE SURVEY REPORT SPRING 2017 Published AUGUST 2017 Economics and Statistics Office i CONTENTS SUMMARY TABLE 1: KEY LABOUR FORCE INDICATORS BY STATUS... 1 SUMMARY TABLE 2: KEY
Analysis of Affordability of Cost Recovery: Communal and Network Energy Services. September 30, By Clare T. Romanik The Urban Institute
 Analysis of Affordability of Cost Recovery: Communal and Network Energy Services September 0, 1998 By Clare T. Romanik The Urban Institute under contract to The World Bank EXECUTIVE SUMMARY The following
2000 HOUSING AND POPULATION CENSUS
 Ministry of Finance and Economic Development CENTRAL STATISTICS OFFICE 2000 HOUSING AND POPULATION CENSUS REPUBLIC OF MAURITIUS ANALYSIS REPORT VOLUME VIII - ECONOMIC ACTIVITY CHARACTERISTICS June 2005
Indicator 1.2.1: Proportion of population living below the national poverty line, by sex and age
 Goal 1: End poverty in all its forms everywhere Target: 1.2 By 2030, reduce at least by half the proportion of men, women and children of all ages living in poverty in all its dimensions according to national
Automated labor market diagnostics for low and middle income countries
 Poverty Reduction Group Poverty Reduction and Economic Management (PREM) World Bank ADePT: Labor Version 1.0 Automated labor market diagnostics for low and middle income countries User s Guide: Definitions
ANNEX 1: Data Sources and Methodology
 ANNEX 1: Data Sources and Methodology A. Data Sources: The analysis in this report relies on data from three household surveys that were carried out in Serbia and Montenegro in 2003. 1. Serbia Living Standards
POVERTY ANALYSIS IN MONTENEGRO IN 2013
 MONTENEGRO STATISTICAL OFFICE POVERTY ANALYSIS IN MONTENEGRO IN 2013 Podgorica, December 2014 CONTENT 1. Introduction... 4 2. Poverty in Montenegro in period 2011-2013.... 4 3. Poverty Profile in 2013...
STATISTICS ON INCOME AND LIVING CONDITIONS (EU-SILC))
)") GENERAL SECRETARIAT OF THE NATIONAL STATISTICAL SERVICE OF GREECE GENERAL DIRECTORATE OF STATISTICAL SURVEYS DIVISION OF POPULATION AND LABOUR MARKET STATISTICS HOUSEHOLDS SURVEYS UNIT STATISTICS ON INCOME
GENERAL SECRETARIAT OF THE NATIONAL STATISTICAL SERVICE OF GREECE GENERAL DIRECTORATE OF STATISTICAL SURVEYS DIVISION OF POPULATION AND LABOUR MARKET STATISTICS HOUSEHOLDS SURVEYS UNIT STATISTICS ON INCOME
Statistics Botswana. Tel: (267) , Fax (267) , All correspondence should be addressed to Statistician General
 , Fax (267) , All correspondence should be addressed to Statistician General") All correspondence should be addressed to Statistician General No 2011/15 November 2011 PRELIMINARY RESULTS OF THE BOTSWANA CORE WELFARE INDICATORS (Poverty) SURVEY 2009/10 1. Introduction This Statsbrief
All correspondence should be addressed to Statistician General No 2011/15 November 2011 PRELIMINARY RESULTS OF THE BOTSWANA CORE WELFARE INDICATORS (Poverty) SURVEY 2009/10 1. Introduction This Statsbrief
Internationally comparative indicators of material well-being in an age-specific perspective
 Internationally comparative indicators of material well-being in an age-specific perspective 1. Which international indicators in this area are currently available and published? Review of selected recent
MONITORING POVERTY AND SOCIAL EXCLUSION IN SCOTLAND 2015
 MONITORING POVERTY AND SOCIAL EXCLUSION IN SCOTLAND 2015 This study is the seventh in a series of reports monitoring poverty and social exclusion in Scotland since 2002. The analysis combines evidence
INSTITUTO NACIONAL DE ESTADÍSTICA. Descriptive study of poverty in Spain Results based on the Living Conditions Survey 2004
 INSTITUTO NACIONAL DE ESTADÍSTICA Descriptive study of poverty in Spain Results based on the Living Conditions Survey 2004 Index Foreward... 1 Poverty in Spain... 2 1. Incidences of poverty... 3 1.1.
Hüsnü M. Özyeğin Foundation Rural Development Program
 Hüsnü M. Özyeğin Foundation Rural Development Program Bitlis Kavar Pilot Final Impact Evaluation Report (2008-2013) Date: March 5, 2014 Prepared for Hüsnü M. Özyeğin Foundation by Development Analytics
Poverty in Afghanistan
 Poverty in Afghanistan Socio-economic, demographic and geographic aspects of poverty from the NRVA 2007-08 Prepared by: Dean Jolliffe, Silvia Redaelli, and Andy Kotikula, World Bank, for the 7 th meeting
Impact Evaluation of Savings Groups and Stokvels in South Africa
 Impact Evaluation of Savings Groups and Stokvels in South Africa The economic and social value of group-based financial inclusion summary October 2018 SaveAct 123 Jabu Ndlovu Street, Pietermaritzburg,
THAILAND DEVELOPMENT INDICATORS 2003
 THAILAND DEVELOPMENT INDICATORS 2003 Table 1. Population 1.1 Number of Population Table 1 Number of Population by Sex : 1990-2005 1.2 Population Structure Table 2 Percentage of Population by Age Group
Labour force, Employment and Unemployment First quarter 2018
 Introduction Labour force, Employment and Unemployment First quarter 2018 1. This issue of Economic and Social Indicators (ESI) presents a set of estimates of labour force, employment and unemployment
Over the five year period spanning 2007 and
 Poverty, Shared Prosperity and Subjective Well-Being in Iraq 2 Over the five year period spanning 27 and 212, Iraq s GDP grew at a cumulative rate of over 4 percent, averaging 7 percent per year between
INTEGRATED HOUSEHOLD SURVEY
 Republic of Malawi INTEGRATED HOUSEHOLD SURVEY 2004-2005 85+ 80-84 75-79 70-74 65-69 60-64 55-59 50-54 45-49 40-44 35-39 30-34 25-29 20-24 15-19 10-14 5-9 0-4 Poor 1,500 1,000 500 0 500 1,000 1,500 Population
THE EVOLUTION OF POVERTY IN RWANDA FROM 2000 T0 2011: RESULTS FROM THE HOUSEHOLD SURVEYS (EICV)
") REPUBLIC OF RWANDA 1 NATIONAL INSTITUTE OF STATISTICS OF RWANDA THE EVOLUTION OF POVERTY IN RWANDA FROM 2000 T0 2011: RESULTS FROM THE HOUSEHOLD SURVEYS (EICV) FEBRUARY 2012 2 THE EVOLUTION OF POVERTY
REPUBLIC OF RWANDA 1 NATIONAL INSTITUTE OF STATISTICS OF RWANDA THE EVOLUTION OF POVERTY IN RWANDA FROM 2000 T0 2011: RESULTS FROM THE HOUSEHOLD SURVEYS (EICV) FEBRUARY 2012 2 THE EVOLUTION OF POVERTY
IJPSS Volume 2, Issue 4 ISSN:
 Poverty and inequality in Services Sector of Sudan Ali Musa Abaker* Ali Abd Elaziz Salih** ABSTRACT: This research paper aims to address income poverty and inequality in service sector of Sudan. Poverty
Chapter 6 Micro-determinants of Household Welfare, Social Welfare, and Inequality in Vietnam
 Chapter 6 Micro-determinants of Household Welfare, Social Welfare, and Inequality in Vietnam Tran Duy Dong Abstract This paper adopts the methodology of Wodon (1999) and applies it to the data from the
Labour force, Employment and Unemployment First quarter 2017
 Introduction Labour force, Employment and Unemployment First quarter 2017 1. This issue of Economic and Social Indicators (ESI) presents a set of estimates of labour force, employment and unemployment
POVERTY IN TIMOR-LESTE
 Public Disclosure Authorized Public Disclosure Authorized Public Disclosure Authorized Public Disclosure Authorized POVERTY IN TIMOR-LESTE 2014 V E R R E S T PREFACE 01 EXECUTIVE SUMMARY 03 INTRODUCTION
Monitoring the Performance
 Monitoring the Performance of the South African Labour Market An overview of the Sector from 2014 Quarter 1 to 2017 Quarter 1 Factsheet 19 November 2017 South Africa s Sector Government broadly defined
Shifts in Non-Income Welfare in South Africa
 Shifts in Non-Income Welfare in South Africa 1993-2004 DPRU Policy Brief Series Development Policy Research unit School of Economics University of Cape Town Upper Campus June 2006 ISBN: 1-920055-30-4 Copyright
Chapter 5 Poverty, Inequality, and Development
 Chapter 5 Poverty, Inequality, and Development Distribution and Development: Seven Critical Questions What is the extent of relative inequality, and how is this related to the extent of poverty? Who are
The at-risk-of poverty rate declined to 18.3%
 Income and Living Conditions 2017 (Provisional data) 30 November 2017 The at-risk-of poverty rate declined to 18.3% The Survey on Income and Living Conditions held in 2017 on previous year incomes shows
The poor in Iraq are disproportionately dependent
 Transfers, Safety Nets, and Poverty 8 The poor in Iraq are disproportionately dependent on non-labor incomes, and lacking assets, in particular, on transfers including through the Public Distribution System
METHODOLOGICAL ISSUES IN POVERTY RESEARCH
 METHODOLOGICAL ISSUES IN POVERTY RESEARCH IMPACT OF CHOICE OF EQUIVALENCE SCALE ON INCOME INEQUALITY AND ON POVERTY MEASURES* Ödön ÉLTETÕ Éva HAVASI Review of Sociology Vol. 8 (2002) 2, 137 148 Central
AUGUST THE DUNNING REPORT: DIMENSIONS OF CORE HOUSING NEED IN CANADA Second Edition
 AUGUST 2009 THE DUNNING REPORT: DIMENSIONS OF CORE HOUSING NEED IN Second Edition Table of Contents PAGE Background 2 Summary 3 Trends 1991 to 2006, and Beyond 6 The Dimensions of Core Housing Need 8
Income and Non-Income Inequality in Post- Apartheid South Africa: What are the Drivers and Possible Policy Interventions?
 Income and Non-Income Inequality in Post- Apartheid South Africa: What are the Drivers and Possible Policy Interventions? Haroon Bhorat Carlene van der Westhuizen Toughedah Jacobs Haroon.Bhorat@uct.ac.za
Serbia. Country coverage and the methodology of the Statistical Annex of the 2015 HDR
 Human Development Report 2015 Work for human development Briefing note for countries on the 2015 Human Development Report Serbia Introduction The 2015 Human Development Report (HDR) Work for Human Development
Economic Standard of Living
 DESIRED OUTCOMES New Zealand is a prosperous society where all people have access to adequate incomes and enjoy standards of living that mean they can fully participate in society and have choice about
Social Protection Strategy of Vietnam, : 2020: New concept and approach. Hanoi, 14 October, 2010
 Social Protection Strategy of Vietnam, 2011-2020: 2020: New concept and approach Hanoi, 14 October, 2010 Ministry of Labour,, Invalids and Social Affairs A. Labour Market Indicators 1. Total population,
Harnessing Demographic Dividend: The Future We Want
 Harnessing Demographic Dividend: The Future We Want Presented at 5th Commission on Population and Development April 5th, 217 Republik Indonesia Ministry of National Development Planning/ Bappenas National
. Document of the World Bank. Afghanistan Poverty in Afghanistan. Results based on ALCS Public Disclosure Authorized. Report No: AUS
 Public Disclosure Authorized Public Disclosure Authorized.... Report No: AUS000046 Afghanistan Poverty in Afghanistan Results based on ALCS 016-17 July 018 POV Public Disclosure Authorized Public Disclosure
Nemat Khuduzade, Deputy Head Labour Statistics Department, SSC of Azerbaijan
 Decent Work Situation and Overview of the Labour Force Survey in Azerbaijan and New Opportunities with the implementation of the 19 th ICLS Resolution concerning statistics of work, employment and labour
Canada Social Report. Poverty Reduction Strategy Summary, Manitoba
 Canada Social Report Poverty Reduction Strategy Summary, Manitoba Updated: This series summarizes the poverty reduction strategies now in place or in development in provinces and territories across Canada.
Labour. Labour market dynamics in South Africa, statistics STATS SA STATISTICS SOUTH AFRICA
 Labour statistics Labour market dynamics in South Africa, 2017 STATS SA STATISTICS SOUTH AFRICA Labour Market Dynamics in South Africa 2017 Report No. 02-11-02 (2017) Risenga Maluleke Statistician-General
2005 National Strategy Report on Adequate and Sustainable Pensions; Estonia
 2005 National Strategy Report on Adequate and Sustainable Pensions; Estonia Tallinn July 2005 CONTENTS 1. PREFACE...2 2. INTRODUCTION...3 2.1. General socio-economic background...3 2.2. Population...3
Health Status, Health Insurance, and Health Services Utilization: 2001
 Health Status, Health Insurance, and Health Services Utilization: 2001 Household Economic Studies Issued February 2006 P70-106 This report presents health service utilization rates by economic and demographic
2011 Annual Socio- Economic Report
 2011 Annual Socio- Economic Report This abstract contains the Nigerian Unemployment Report 2011 National Bureau of Statistics Page 1 Introduction Employment Statistics is a section under the General Household
THE SUSTAINABLE DEVELOPMENT GOALS AND SOCIAL PROTECTION
 THE SUSTAINABLE DEVELOPMENT GOALS AND SOCIAL PROTECTION Ms Nelisiwe Vilakazi Acting Director General- Ministry of Social Development REPUBLIC OF SOUTH AFRICA Global Practitioners Learning Event Oaxaca,
ASSESSMENT OF FINANCIAL PROTECTION IN THE VIET NAM HEALTH SYSTEM: ANALYSES OF VIETNAM LIVING STANDARD SURVEY DATA
 WORLD HEALTH ORGANIZATION IN VIETNAM HA NOI MEDICAL UNIVERSITY Research report ASSESSMENT OF FINANCIAL PROTECTION IN THE VIET NAM HEALTH SYSTEM: ANALYSES OF VIETNAM LIVING STANDARD SURVEY DATA 2002-2010
MULTIDIMENSIONAL POVERTY IN TURKEY
 14 April 2015 UNITED NATIONS ECONOMIC COMMISSION FOR EUROPE CONFERENCE OF EUROPEAN STATISTICIANS Seminar on poverty measurement 5-6 May 2015, Geneva, Switzerland Agenda item 5: Multidimensional poverty
National Revenue Report
 National Revenue Report 2008-2009 Department of Revenue & Customs Ministry of Finance Bhutan Vision Contribute to nation building through the development of an effective revenue system Mission To ensure
Labor Participation and Gender Inequality in Indonesia. Preliminary Draft DO NOT QUOTE
 Labor Participation and Gender Inequality in Indonesia Preliminary Draft DO NOT QUOTE I. Introduction Income disparities between males and females have been identified as one major issue in the process
between Income and Life Expectancy
 National Insurance Institute of Israel The Association between Income and Life Expectancy The Israeli Case Abstract Team leaders Prof. Eytan Sheshinski Prof. Daniel Gottlieb Senior Fellow, Israel Democracy
QUALITY OF SOCIAL PROTECTION IN PERU
 QUALITY OF SOCIAL PROTECTION IN PERU HUGO ÑOPO 1 1 Economist, Department of Research, Inter-American Development Bank (IADB). 407 INTRODUCTION This presentation is based on the preliminary results of some
INTEGRATED HOUSEHOLD LIVING CONDITIONS SURVEY IN MYANMAR:
 INTEGRATED HOUSEHOLD LIVING CONDITIONS SURVEY IN MYANMAR: POVERTY PROFILE PREPARED BY: IDEA INTERNATIONAL INSTITUTE QUEBEC CITY, CANADA IHLCA PROJECT TECHNICAL UNIT YANGON, UNION OF MYANMAR WITH SUPPORT
Central Administration for Statistics and World Bank
 Public Disclosure Authorized Central Administration for Statistics and World Bank Snapshot of Poverty and Labor Market Outcomes in Lebanon based on Household Budget Survey 211/212 1 May 25, 216 Version
PART B Details of ICT collections
 PART B Details of ICT collections Name of collection: Household Use of Information and Communication Technology 2006 Survey Nature of collection If possible, use the classification of collection types
Downloads from this web forum are for private, non-commercial use only. Consult the copyright and media usage guidelines on
 Econ 3x3 www.econ3x3.org A web forum for accessible policy-relevant research and expert commentaries on unemployment and employment, income distribution and inclusive growth in South Africa Downloads from
Toward Active Participation of Women as the Core of Growth Strategies. From the White Paper on Gender Equality Summary
 Toward Active Participation of Women as the Core of Growth Strategies From the White Paper on Gender Equality 2013 Summary Cabinet Office, Government of Japan June 2013 The Cabinet annually submits to
Fighting Hunger Worldwide. Emergency Social Safety Net. Post-Distribution Monitoring Report Round 1. ESSN Post-Distribution Monitoring Round 1 ( )
") Emergency Social Safety Net Post-Distribution Monitoring Report Round 1 ESSN Post-Distribution Monitoring Round 1 ( ) Table of Contents 1. Introduction 3 2. Approach, methodology and Data 3 2.1. Method
Emergency Social Safety Net Post-Distribution Monitoring Report Round 1 ESSN Post-Distribution Monitoring Round 1 ( ) Table of Contents 1. Introduction 3 2. Approach, methodology and Data 3 2.1. Method
FinScope Myanmar 2018 Launch
 FinScope Myanmar 2018 Launch Nay Pyi Taw, Myanmar 19 June 2018 Sampling and weighting Respondent profile Universe: Adult population in Myanmar Myanmar residents 18 years and older Coverage and methodology
THE CONSUMPTION AGGREGATE
 THE CONSUMPTION AGGREGATE MEASURE OF WELFARE: THE TOTAL CONSUMPTION 1. People well-being, or utility, cannot be measured directly, therefore, consumption was used as an indirect measure of welfare. The
Monitoring poverty and social exclusion
 Monitoring poverty and social exclusion The New Policy Institute has constructed the first set of indicators to present a wide view of poverty and social exclusion in Britain. Forty-six indicators show
REDUCING CHILD POVERTY IN GEORGIA:
 REDUCING CHILD POVERTY IN GEORGIA: A WAY FORWARD REDUCING CHILD POVERTY IN GEORGIA: A WAY FORWARD TINATIN BAUM ANASTASIA MSHVIDOBADZE HIDEYUKI TSURUOKA Tbilisi, 2014 ACKNOWLEDGEMENTS This paper draws
1. Overall approach to the tool development
 Poverty Assessment Tool Submission USAID/IRIS Tool for Ethiopia Submitted: September 24, 2008 Revised (correction to 2005 PPP): December 17, 2009 The following report is divided into six sections. Section
Human Development in India
 Human Development in India Challenges for a Society in Transition Sonalde B. Desai Amaresh Dubey Brij Lal Joshi Mitali Sen Abusaleh Shariff Reeve Vanneman 1 1 YMCA Library Building, Jai Singh Road, New
Pattern and Trends of Poverty in Ghana
 Pattern and Trends of Poverty in Ghana 1991-2006 Ghana Statistical Service April 2007 Copyright 2007 Ghana Statistical Service Ghana Statistical Service P O Box GP 1098 Accra ii Preface and Acknowledgement
Montenegro. Country coverage and the methodology of the Statistical Annex of the 2015 HDR
 Human Development Report 2015 Work for human development Briefing note for countries on the 2015 Human Development Report Montenegro Introduction The 2015 Human Development Report (HDR) Work for Human
Poverty in the United Way Service Area
 Poverty in the United Way Service Area Year 4 Update - 2014 The Institute for Urban Policy Research At The University of Texas at Dallas Poverty in the United Way Service Area Year 4 Update - 2014 Introduction
Monitoring the Performance of the South African Labour Market
 Monitoring the Performance of the South African Labour Market An overview of the South African labour market for the Year Ending 2012 8 October 2012 Contents Recent labour market trends... 2 A labour market
A Case Study on Socio - Economic Conditions of Agricultural Labourers in Idaikal Village in Tirunelveli District. Dr. T.
 Volume: 3; No: 2; June-2017. pp 256-264. ISSN: 2455-3921 A Case Study on Socio - Economic Conditions of Agricultural Labourers in Idaikal Village in Tirunelveli District Dr. T. Vijayanthi Assistant Professor
Poverty and Income Inequality in Scotland: 2013/14 A National Statistics publication for Scotland
 Poverty and Income Inequality in Scotland: 2013/14 A National Statistics publication for Scotland EQUALITY, POVERTY AND SOCIAL SECURITY This publication presents annual estimates of the percentage and
Coping with Population Aging In China
 Coping with Population Aging In China Copyright 2009, The Conference Board Judith Banister Director of Global Demographics The Conference Board Highlights Causes of Population Aging in China Key Demographic
Economics 448 Lecture 13 Poverty and Malnutrition
 Economics 448 Poverty and Malnutrition October 18, 2012 Underdevelopment Poverty is the most visible characteristic of underdevelopment. Easy to descriptive examples of the development process. But it
Impact of fglobal lfinancial i and. Lao CBMS Sites
 Ministry of Planning and Investment Department of Statistics Impact of fglobal lfinancial i and Economic Crisis on Poverty Lao CBMS Sites 9 th Poverty and economic policy (PEP) research network policy
BASELINE SURVEY OF MINORITY CONCENTRATION DISTRICT. Executive Summary of Leh District (Jammu and Kashmir)
") BASELINE SURVEY OF MINORITY CONCENTRATION DISTRICT Background: Executive Summary of Leh District (Jammu and Kashmir) The Ministry of Minority Affairs (GOI) has identified 90 minority concentrated backward
BASELINE SURVEY OF MINORITY CONCENTRATION DISTRICT Background: Executive Summary of Leh District (Jammu and Kashmir) The Ministry of Minority Affairs (GOI) has identified 90 minority concentrated backward
THE CAYMAN ISLANDS LABOUR FORCE SURVEY REPORT FALL. Published March 2017
 THE CAYMAN ISLANDS LABOUR FORCE SURVEY REPORT FALL 2017 Published March 2017 Economics and Statistics Office i CONTENTS SUMMARY TABLE 1: KEY LABOUR FORCE INDICATORS BY STATUS... 1 SUMMARY TABLE 2: KEY
CONTENTS CHAPTER 1 INTRODUCTION
 Particulars LIST OF TABLES LIST OF FIGURES LIST OF APPENDIX LIST OF ANNEXURE ABBREVIATIONS CONTENTS Page No. CHAPTER 1 INTRODUCTION 1-17 1.1 1.2 1.3 1.4 1.5 1.6 1.7 1.8 Trends in Poverty at National and
MEASURING ECONOMIC INSECURITY IN RICH AND POOR NATIONS
 MEASURING ECONOMIC INSECURITY IN RICH AND POOR NATIONS Lars Osberg - Dalhousie University Andrew Sharpe - Centre for the Study of Living Standards IARIW-OECD INTERNATIONAL CONFERENCE ON ECONOMIC SECURITY
Interaction of household income, consumption and wealth - statistics on main results
 Interaction of household income, consumption and wealth - statistics on main results Statistics Explained Data extracted in June 2017. Most recent data: Further Eurostat information, Main tables and Database.