ASSET MANAGEMENT UPDATE MISE À JOUR DE LA GESTION DES IMMOBILISATIONS
|
|
|
- Jemimah Sims
- 5 years ago
- Views:
Transcription

 directing the administration to submit a grant application for the project proposed by Public Sector Digest (Schedule B3).")
1 REPORT TO COUNCIL: RAPPORT AU CONSEIL: AM DATE: 20/02/2018 SUBJECT ASSET MANAGEMENT UPDATE MISE À JOUR DE LA GESTION DES IMMOBILISATIONS Asset Management Plan update and a briefing of next steps for the department. SUJET Mise à jour du plan de gestion des immobilisations et des prochaines étapes pour le département. RECOMMENDATION That Council receive report AM dated February 20 th, 2018 and acknowledges receipt of the updated Asset Management Plan (Schedule A1- A3). Also, that Council adopts the proposed resolution (Schedule B1) directing the administration to submit a grant application for the project proposed by Public Sector Digest (Schedule B3). FINANCIAL IMPLICATION The cost of the proposed project is $60, (including 1.76% of nonrefundable HST). The grant will cover 80% of these costs. The township share, including consulting services additional to the quote will represent about $15,000. About $37,000 is included in the 2018 budget from a 2017 year-end transfer of the project Condition Assessment / AMP update. RECOMMANDATION Que le conseil reçoit le rapport AM daté du 20 février, 2018 et accuse réception de la mise à jour du plan de gestion des immobilisations (annexes A1 A3) Et que le conseil adopte la résolution proposée (annexe B2) dirigeant l administration de soumettre une application d octroi pour le projet proposé par Public Sector Digest (annexe B3). IMPLICATIONS FINANCIÈRES Le coût du projet proposé est de ,92$ (incluant 1.76% de TVH non-remboursable). Le montant de l octroi représentera 80% de ces coûts. La portion de la municipalité, incluant des services de consultation additionnels à la cotation représentera environ $. Environ $ est inclus au budget 2018 par la mise d un transfert de fin d année de 2017 du projet
2 Évaluation de condition / Mise à jour du PGI. BUSINESS PLAN Asset Management Work Group progress and requirement compliance. COMMUNICATION PLAN The updated Asset Management Plan will be added to our Website. PLAN D AFFAIRES Gestion des immobilisations progrès du comité et conformité aux exigences PLAN DE COMMUNICATION La mise à jour du plan de gestion des immobilisations sera affichée sur notre site Web. SUBMITTED BY SOUMIS PAR: Richard Godin Director of Finance / Treasurer Directeur des Finances / Trésorier APPROVAL(S) APPROBATION(S): Date: February 20 février 2018 Jean Leduc Chief Administrative Officer Directeur général Date : February 20 février 2018 PROJECT DESCRIPTION DU PROJET AM Asset Management Plan Update Page 2 of 10 2/21/2018
3 HISTORY AND SUPPORT INFORMATION New Provincial Requirements (Schedule C) New provincial requirements were released by the province at the end of Schedule C presents details on each of the requirements. Below is a summary: -July 1 st, 2019: Adoption of a Strategic Asset Management Policy (this requirement is not yet met but is included as part of the proposed Asset Management Program Development project); -July 1 st, 2021: AMPs must include detailed current levels of services for our core assets (this requirement is partially met but specific levels of service categories as identified by the province will need to be added); -July 1 st, 2023: AMPs must include detailed current levels of services for all assets (this requirement is not yet met); -July 1 st, 2024: Council will need to identify desired levels of services in order to be able to evaluate the variance between the current LOS and the desired ones (this requirement is not yet met). HISTORIQUE ET INFORMATION DE SUPPORT Nouvelles exigences provinciales (annexe C) De nouvelles exigences provinciales ont été annoncées à la fin L annexe C présente le détail de chacune des exigences. En voici un sommaire: -1er juillet, 2019: Mise en place d une politique sur la gestion des immobilisation stratégique (cette exigence n est pas encore remplie mais fait partie du projet proposé de développer un programme de gestion des immobilisations); -1er juillet, 2021: Les PGI doivent inclure les niveaux de services actuels détaillés pour les actifs de base de la municipalité (cette exigence est remplie en partie mais certaines catégories identifiées par la province devront être ajoutées); -1er juillet, 2023: Les PGI doivent inclure les niveaux de services actuels détaillés pour tous les actifs de la municipalité (cette exigence n est pas encore remplie); -1er juillet, 2024: Le conseil devra identifier les niveaux de services voulus afin de pouvoir évaluer la variance entre ceux-ci et les niveaux de services actuels (cette exigence n est pas encore remplie). AM Asset Management Plan Update Page 3 of 10 2/21/2018
4 Passed Activities on Asset Management In 2009, new PSAB requirement imposed municipalities in Ontario to include assets in their Financial Statements. This was the beginning of Asset Management and looked only at the financial accounting side with the goal of identifying the value of our assets and amortizing their cost over time. In 2012, the Province requested that Municipalities put in place an Asset Management Plan that identified the state of our local infrastructure, levels of services and asset management strategies as well as their financial implications. This requirement was specific to core infrastructure, meaning roads, bridges & culverts and water, sanitary and storm sewer networks. Russell s first Asset Management Plan was presented to Council on December 2 nd, 2013 and included all of those asset categories. The total annual funding deficit presented in 2013 was $3,511,000. While the Asset Management Plan included only our core infrastructure, the inventory of all of the Township s assets was gathered and is managed through our Asset Management software from Public Sector Digest, Citywide. In order to meet all of those requirements, the Township of Russell identified a department for Asset Activités passés de la gestion des immobilisations En 2009, de nouvelles exigences de la CCSP imposait aux municipalités d Ontario d inclure leurs actifs dans leurs états financiers. Ceci était le début de la gestion des immobilisations mais c était strictement pour la comptabilité avec comme objectif d identifier une valeur à nos actifs et d amortir leur coût sur leur durée de vie. En 2012, la province a demandé à ce que les municipalités adoptent un plan de gestion des immobilisations identifiant l état des actifs locaux, leurs niveaux de service ainsi que des stratégies de gestion d immobilisations et leurs impacts financières. Cette exigence était spécifique aux actifs de base soit les routes, les ponts et ponceaux et les réseaux d eau, d égout sanitaire et d égout pluvieux. Le premier plan de gestion des immobilisations de la municipalité de Russell a été présenté le 2 décembre, 2013 et incluait toutes ces catégories. Notre déficit annuel d investissement en 2013 était de $. Malgré que notre plan de gestion des immobilisations incluait que les actifs de base, l inventaire de tous nos actifs était compilée et est gérée dans notre logiciel de gestion des immobilisations, Public Sector Digest Citywide. Afin d être en mesure de répondre à toutes ces exigences, la municipalité a identifier un département de AM Asset Management Plan Update Page 4 of 10 2/21/2018
5 Management under the responsibility of the Director of Finances. In collaboration with all other departments, the Asset Management department first gathered the inventory of all Township capital assets and infrastructure going above the provincial requirements. This Database was maintained over the years in an Asset Management Software from Public Sector Digest called Citywide. Condition assessments that are performed over the years are also integrated into this software to keep asset condition up to date. In late 2017 and early 2018, discussions between departments were held to put together a working committee to ensure efficient use of the Asset Management Plan and the Asset database in order to help Management and Council make informed investment decisions into infrastructure. Schedule D presents the proposed structure for the said committee. Asset Management Update (Schedules A1 A3) An updated Asset Management Plan has been produced by WSP for our Core infrastructure assets (Water and Sewer infrastructure as well as roads) and for our Recreation department s assets, which includes multiple facilities and parks. Here are the key takeaways from the gestion des immobilisations sous la responsabilité du directeur des finances. En collaboration avec les autres départements, le département a d abord été au-delà des exigences en compilant l inventaire de toutes les catégories d actifs de la municipalité. Cette inventaire a été maintenu dans le logiciel Citywide depuis ce temps incluant les mises à jours requises suivant les évaluations de conditions qui ont été effectuées au fils des années. À la fin 2017 et début 2018, des discussions ont eu lieu entre départements afin de mettre en place un comité qui aura comme but d assurer l utilisation efficace du plan de gestion des immobilisations ainsi que de la base de donnée afin d aider l équipe de gestion et le conseil d effectuer des décisions informées en ce qui consiste les investissements dans nos infrastructures. L annexe D présente la structure proposée de ce comité. Mise à jour du plan de gestion des immobilisations (annexes A1 A3) Une mise à jour du plan de gestion des immobilisations a été produite par WSP pour nos actifs de base (Eau, égout et routes) ainsi que pour les actifs du département des récréations, incluant certains édifices et des parcs. Voici un résumé des résultats de AM Asset Management Plan Update Page 5 of 10 2/21/2018
6 updated Asset Management Plan: Mandatory as per provincial requirement: Roads and other transportation infrastructure (Schedule A1) -Overall Condition Score: B -Overall Levels of Service: B -Annual Funding Deficit: $2,090,000 Water and Wastewater (Schedule A2) -Overall Condition Score: B -Overall Levels of Service: B -Annual Funding Deficit: None Over and above provincial requirement: Parks (Schedule A3) -Overall Condition Score: C- -Overall Levels of Service: B -Annual Funding Deficit: $18,100 Recreational Facilities (Schedule A3) -Overall Condition Score: B- -Overall Levels of Service: B -Annual Funding Surplus: $56,400 Our total annual funding deficit for the four categories is $2,051,700, down from $3,511,000 in the 2013 plan. This reduction can be explained in part from increased investments in the infrastructure fund over the past years as well as further development of our asset inventory including more in depth assessments of certain asset classes. cette exercice: Mandataire, tel que les exigences de la province: Routes et autres actifs relié à la transportation (annexe A1) -pointage sur la condition: B -pointage du niveau de service: B -déficit annuel d investissement: $ Eau et égout (annexe A2) -pointage sur la condition: B -pointage du niveau de service: B -déficit annuel d investissement: aucun Au-delà des exigences provinciales: Parcs (annexe A3) -pointage sur la condition: C- -pointage du niveau de service: B -déficit annuel d investissement: $ Édifices de récréation (annexe A3) -pointage sur la condition: B- -pointage du niveau de service: B -surplus annuel d investissement: $ Notre déficit annuel d investissement total pour les quatre catégories est de $, une réduction par rapport au montant de en Cette réduction peut être expliquée en partie par des augmentations à nos investissements dans le fond d infrastructure dans les dernières années ainsi que du développement de notre inventaire d actifs incluant des évaluations plus détaillées pour AM Asset Management Plan Update Page 6 of 10 2/21/2018
7 certaines catégories d actifs. With the proposed project and next steps presented below, we should expect the funding deficit to continue to trend downwards following implementation of certain lifecycle cost management strategies as well as funding strategies where we will include the use of our reserves and the evaluation of certain grants received on a yearly basis (our total asset management reserve of about $976,101 as well as OCIF and Gas Tax grants for which we will be receiving about $895,000 in 2018 are not included in the calculation of the funding deficit). Grant, Proposed Asset Management Program Development Project and Next Steps (Schedule B) FCM S new Municipal Asset Management Program (Schedule B2) Aging infrastructure, including roads, buildings and bridges, competing priorities, limited budgets. These are some of the challenges municipalities face in making infrastructure decisions today. FCM's new Municipal Asset Management Program is a five-year, $50-million program designed to help Canadian municipalities make informed infrastructure investment decisions based on sound asset management practices. The program is funded by the Government of Canada.* Avec le projet qui est proposé ainsi que les prochaines étapes présentées ci-dessous, nous pouvons s attendre à ce que le déficit d investissement continue à être réduit suivant l implantation de certaines stratégies de réduction de coût de vie ainsi que de stratégies de financements où seront inclus l utilisation de réserves et d octrois potentiels (nos réserves de remplacement d immobilisations d environ $ ainsi que les octrois d OCIF et de Taxes sur l essence dont nous recevrons environ $ en 2018 ne sont présentement pas inclus dans le calcul du déficit d investissement). Octroi, projet de développement du programme de gestion d immobilisation et prochaines étapes (annexe B) Le nouveau Programme de gestion des actifs municipaux de la FCM (annexe B2) Les défis dans la gestion des actifs sont multiples pour les municipalités: les infrastructures vieillissantes telles que les routes, les bâtiments, les ponts, et ainsi de suite, sans oublier les budgets limités et les nombreuses priorités. Quelles décisions prendre? Doté de 50 millions de dollars et échelonné sur cinq ans, le nouveau Programme de gestion des actifs municipaux permettra aux villes et aux collectivités de prendre des décisions éclairées en matière AM Asset Management Plan Update Page 7 of 10 2/21/2018
8 d'infrastructures en se fondant sur de saines pratiques de gestion des actifs. Ce programme est financé par le gouvernement du Canada. * Schedule E contains further information on the grant. Asset Management Program Development Project (Schedule B3): The proposed project to be done with Public Sector Digest would address the following points: -Asset Management Maturity Assessment (will evaluate our current Asset Management Program and identify gaps. This will be essential in ensuring our new Asset Management Committee addresses goals and priorities efficiently); -Development of a Strategic Asset Management Policy (as required by provincial regulation by July 1 st, 2019); -Data disaggregation, consolidation and refinement (this will allow the use of further information when making investment decisions. Will allow Management to better evaluate the criticality of each infrastructure investment and will help Council make informed budget decisions; -Condition assessment program development (having this program will allow the Township to be consistent and to gather relevant data when hiring L annexe E contient plus d informations sur l octroi. Projet de développement du programme de gestion d immobilisation (annexe B3) : Le projet qui est proposé par Public Sector Digest adressera les points suivants: -Évaluation de maturité de la gestion des immobilisations (évaluera nos pratiques actuelles de gestion d immobilisations et identifiera les sections à améliorer. Ceci facilitera à identifier des objectifs et priorités clairs et précises pour le comité de gestion d immobilisations); -Développement d une politique stratégique sur la gestion d immobilisations (tel que requis par la province par le 1er juillet, 2019); -Amélioration des donnés (ceci permettra d utiliser de la meilleure information lorsque vient le temps de prendre des décision d investissement. Ça permettra à la gestion de mieux évaluer la criticité de chaque investissement potentiel et aidera le conseil d effectuer des décisions plus informées; -Développement d un programme d évaluation d actif (ce programme assurera la consistance et la compilation de bonnes données lors AM Asset Management Plan Update Page 8 of 10 2/21/2018
9 consultants for condition assessments); -Asset Management Training Sessions (training will be provided to staff on asset management best practices as well as on risk and criticality and proper lifecycle management of infrastructure assets). Next Steps: At the conclusion of this project, the Asset Management Committee will be in a position to provide Council with yearly updates on our Asset Management Plan s report card (Asset condition, current levels of service and annual funding deficits/surpluses) on not only our core infrastructure and recreational facilities and parks but on all of the Township s assets. Future phases, in order to ensure that the Township complies with the new provincial requirements, will include risk and criticality model development, lifecycle model development, level of service framework development as well as financial strategy development. The Asset Management Committee will be responsible to ensure the compliance to provincial regulations. ATTACHMENT(S) Schedule A1 - AMP - Roads and Other Transportation Infrastructure de l embauche de contracteurs pour les évaluations d actifs); -Session de formation sur la gestion des immobilisations (de la formation sera donnée aux employés par rapport aux bonnes pratiques ainsi que sur la question de risque et criticité et de bonne gestion de coût de vie des actifs). Prochaines étapes: À la conclusion de ce projet, le comité de gestion des immobilisations sera en position de faire parvenir au conseil des mises à jours annuelles sur les pointages de notre plan de gestion des immobilisations (condition, niveau de service et déficit/surplus d investissement annuel) pour non seulement nos actifs de base et les récréations mais pour toutes les actifs de la municipalité. Afin d assurer que nous répondons aux exigences de la province, les prochaines phases incluront le développement d un model sur le risque et criticité, sur l analyse du coût du cycle de vie ainsi qu un cadre sur les niveaux de service et le développement d une stratégie financière. Le comité de gestion des immobilisations sera responsable d assurer la conformité aux exigences. PIÈCE(S) JOINTE(S) Annexe A1 PGI Routes et autres infrastructures reliés au AM Asset Management Plan Update Page 9 of 10 2/21/2018
10 transport Schedule A2 - AMP Water and Wastewater Schedule A3 - AMP Recreations Schedule B1 Resolution for grant application Schedule B2 FCM s Municipal Asset Management Program Annexe A2 PGI Eau et égout Annexe A3 PGI - Récréations Annexe B1 Résolution pour application d octroi Annexe B2 FCM : Programme de gestion des actifs municipaux Schedule B3 - Asset Management Program Development Quote Schedule C - Asset Management Regulations As summarized by Watson & Associates Schedule D - Asset Management Committee Structure Annexe B3 Cotation : Programme de développement de la gestion des immobilisations Annexe C Réglementation de gestion des immobilisations Résumé par Watson & Associates Annexe D Structure du comité de gestion des immobilisations *Wording for the FCM s new Municipal Asset Management Program description was copied from the following Website: *Le texte pour la description du nouveau Programme de gestion des actifs municipaux de la FCM a été copié du site suivant : AM Asset Management Plan Update Page 10 of 10 2/21/2018

11 TOWNSHIP OF RUSSELL ASSET MANAGEMENT PLAN PUBLIC WORKS INFRASTRUCTURE JUNE 2017 WSP 100 Commerce Valley Drive West Thornhill, ON L3T 0A1 Contact: Kevin Morawski Phone
12 CONTENTS EXECUTIVE SUMMARY... 1 INTRODUCTION Background Purpose Development of an Asset Management Plan Relationship to other Planning Documents 18 STATE OF THE LOCAL INFRASTRUCTURE Inventory of Assets Asset Value Asset Condition Next Steps 28 EXPECTED LEVELS OF SERVICE Minimum Regulatory Requirements Levels of Service by Asset Category Next Steps 37 ASSET MANAGEMENT STRATEGY Planned Action Strategies Analysis of Planned Actions Asset Life Cycle Treatments Inflation Procurement Overview of Risks Next Steps 50 FINANCING STRATEGY Expenditure Forecasts Expenditure History vs Forecasts Funding Strategy Next Steps 57
13 CONTENTS LIST OF TABLES Table 2-1 PS 3150 vs. Asset Management 20 Table 2-2 Asset Condition Rating Scale 22 Table 2-3 Road and Sidewalk Condition Rating Scale 23 Table 2-4 OSIM General Condition Ratings 24 Table 2-5 Storm Sewers Condition Rating Scale 24 Table 2-6 Condition Rating and Grade 25 Table 2-7 Average Roads Condition 26 Table 2-8 Average Sidewalks Condition 26 Table 2-9 Average Bridge Condition 27 Table 2-10 Average Bridge Culvert Condition 27 Table 2-11 Average Storm Sewer Condition 27 Table 2-12 State of Local Infrastructure Next Steps 28 Table 3-1 Minimum Regulatory Requirements 34 Table 3-2 Level of Service Performance Measures Success Scoring 35 Table 3-3 Level of Service Performance Measures for Roads 35 Table 3-4 Roads by Highway Class and Surface Type 36 Table 3-5 Level of Service Performance Measures for Sidewalks 36 Table 3-6 Level of Service Performance Measures for Bridges & Culverts 37 Table 3-7 Level of Service Performance Measures for Storm Sewers 37 Table 4-1 Recommended Maintenance for Roads 40 Table 4-2 Recommended Maintenance for Storm Water 41 Table 4-3 Recommended Lifecycle Treatments for Roads, Sidewalks and Street Lighting 44 Table 4-4 Recommended Lifecycle Treatments for Bridges and Culverts 44 Table 4-5 Recommended Lifecycle Treatments for Storm Water Collection 45 Table 4-6 Risk Likelihood Rating Scale 47 Table 4-7 Risk Severity Rating Scale 47 Table 4-8 Risk Levels 48 Table 4-9 Average Asset Category Risk 49 Table 5-1 Ten Year Needs by Infrastructure Category 52 Table 5-2 Ten Year Needs by Planned Action Strategy 53
 by Asset Category 21 Figure 2-2 Township of Russell Road Surface types 26 Figure 4-1 Small but Timely Renewal Investments Save Money (Figure 1, Ministry of Infrastructure, Guide for Municipal")
14 CONTENTS Table 5-3 Annual Expenses for Roads, Sidewalks, Storm Sewer, Bridges and Culverts 54 LIST OF FIGURES Figure 1-1 Typical Asset Management Framework 17 Figure 2-1Total Replacement Values (2016 CAD) by Asset Category 21 Figure 2-2 Township of Russell Road Surface types 26 Figure 4-1 Small but Timely Renewal Investments Save Money (Figure 1, Ministry of Infrastructure, Guide for Municipal Asset Management Plans ) 42 Figure 4-2 Asset Ownership Lifecycle 43 Figure 4-3 Risk Classification Chart 49 Figure 5-1 Ten Year Needs by Planned Action Strategy 53 Figure 5-2 Roads, Sidewalks, Storm Sewers, Bridges and Culverts 10-Year Investment Requirements 54 APPENDICES Appendix A Asset Inventory

15 EXECUTIVE SUMMARY
16 2 EXECUTIVE SUMMARY WSP was retained to undertake the development of a comprehensive Asset Management Plan that the Township of Russell (Township) can utilize to assist with decisions regarding the construction, operation, maintenance, renewal, replacement, disposal, and funding of their Road, Bridge, Sidewalk, and Storm Water infrastructure assets. This Asset Management Plan was prepared in accordance with the Ontario Ministry of Infrastructure s, Guide for Municipal Asset Management Plans and has been structured based on the following sections. 1. Executive Summary 2. Introduction 3. State of Local Infrastructure 4. Expected Levels of Service 5. Asset Management Strategy 6. Financing Strategy The scope of this Asset Management Plan includes the transportation and storm water infrastructure owned and operated by the Township of Russell. The Town s transportation and storm water linear infrastructure consists of approximately km of roads, 27.2 km of sidewalks, and 89.5 km of storm sewers. Additionally, there are 14 bridges and 11 culverts. Information documented in the 2012 Road Inventory and Needs Study and the 2015 Road Inventory and Needs Study, the 2012 Storm Water Drainage System Management Plan and Maintenance Program (McIntosh Perry), and OSIM Inspections of 14 Bridges and 11 Culverts by HP Engineering Inc., were used to establish the baseline inventory. The asset condition for the paved roads was updated based on a 2016 condition assessment completed by WSP per the MTO SP-024 Manual for Condition Rating of Flexible Pavement. However, WSP s assessment did not include earth and gravel roads. For these, the baseline condition information from the previous studies was updated using an age-based approach. For sidewalks, storm water, bridge and culvert assets the available condition information from the previous reports was used. A desktop assessment of risk was undertaken to provide an understanding of safety and functionality of the Township s infrastructure at a system level. The priority of works associated with the infrastructure, however, has largely been determined by the Township s 2015 Road Inventory and Needs Study, augmented with the results from WSP s condition assessment. EXECUTIVE SUMMARY
17 3 Full life cycle investments for maintenance, rehabilitation, renewal and replacement needs were applied over a 10 year planning period from 2017 to The major capital projects for the Township projected over the 10 year planning period include: Rehabilitation / replacement studies of seven bridges (for the full bridge, or individual bridge components) per OSIM Reports Two bridges may require complete replacement (R-006, R-027). Note the needs forecast includes only recommendations for work as specified in the OSIM reports. Minor rehabilitation of 12 bridges Rehabilitation / replacement study of 10 culverts (full, or components) per OSIM Reports Replacement of three culverts (RC-001, RC-029, and RC-039) Minor rehabilitation of five culverts (RC-002, RC-007, RC-008, RC-030, and RC-038) Replacement of 12.1 km of sidewalks Rehabilitation or replacement of 57.0 km of road segments (refer to Table 2-12 or Appendix A) Condition assessment of Storm Sewers and replacement / rehabilitation program Yearly expenditure forecasts were summarized by infrastructure category to determine the annual average investment required for infrastructure sustainability. The projected infrastructure investment needs were compared to the Township s historical expenditures to identify potential funding gaps or surpluses. Next steps have been provided at the end of each section of this plan to elaborate on how the Township can continue to improve and update this Asset Management Plan in the future. A brief summary of the next steps is provided below in Table 0-1. Table 0-1 Summary of Next Steps EXECUTIVE SUMMARY SECTION State of the Local Infrastructure (Section 2.0) Expected Levels of Service (Section 3.0) NEXT STEPS Maintain and update the asset inventory: Expand the bridge / culvert inventory to separately track individual components per the OSIM inspections. Review and revise sidewalk IDs to ensure unique identification for each asset. Ongoing condition assessment programme: Institute a routine programme for road condition assessments, and track changes over time. Institute a periodic CCTV inspection program for buried infrastructure. Implement operational practices to capture condition information details whenever buried infrastructure is exposed. Track values for technical performance measures each year.
18 4 SECTION Asset Management Strategy (Section 4.0) Financial Strategy (Section 5.0) NEXT STEPS Conduct risk assessment on sidewalks. Establish project prioritization framework to prioritize between asset types. Track ongoing expenditures and their impact / efficacy. Determine the appropriate funding strategy (strategies) for any identified funding gaps. Determine the appropriate funding strategy for the proposed intervention activities.


19 TRANSPORTATION INFRASTRUCTURE 14 CONDITION CONDITION TARGET AVERAGE CONDITION SCORE B CONDITION RATING ROADS 3.0 to B- SIDEWALKS C- STORM SEWERS A- BRIDGES Fair to Good Fair B CULVERTS Fair to Good Fair B SCORE B To provide a smooth, comfortable riding surface at the posted speed limit LEVELS OF SERVICE Roads RISK QUICK FACTS 245 Kilometers of Road Infrastructure 28 Average age of Road Surfaces in Years 90 Kilometers of Storm Sewers 27 Average age of Storm Sewers in Years EXECUTIVE SUMMARY RISK RATING RISK LEVEL ROADS 4.0 Low SIDEWALKS 7.4 Medium STORM SEWER 5.5 Medium BRIDGES 10.4 Medium CULVERTS 9.1 Medium ROAD SURFACE TYPE CURRENT LEVEL OF SUSTAINABLE FUNDING CURRENT AVERAGE ANNUAL INVESTMENT ANNUAL FUNDING DEFICIT $3.55M $1.45M $2.09M
20 INTRODUCTION
21 16 INTRODUCTION The Township of Russell is a lower tier municipality within the United Counties of Prescott Russell, located southeast of Ottawa in Eastern Ontario. There are four urban communities within the Township s boundaries: Embrun, Russell, Marionville and Limoges. INTRODUCTION The Town s linear transportation infrastructure consists of approximately km of roads, 27.2 km of sidewalks and 89.5 km of storm sewers. Additionally, there are 14 bridges and 11 culverts. 1.1 BACKGROUND The Ontario Ministry of Infrastructure s, Building Together: Guide for Municipal Asset Management Plans (June 2011), indicates that any municipality seeking provincial infrastructure funding must demonstrate how its proposed project fits within a detailed Asset Management Plan. This helps to ensure that limited resources are directed to the most critical needs. WSP was retained to undertake the development of a comprehensive Asset Management Plan that the Township of Russell (Township) can use to guide decisions related to the management of their road, sidewalk, bridge, culvert, and storm water infrastructure assets. This Asset Management Plan was prepared in accordance with the Ontario Ministry of Infrastructure s, Guide for Municipal Asset Management Plans. 1.2 PURPOSE INTRODUCTION The objective of this Asset Management Plan is to provide a strategic document that will guide decisions related to how the Township s road, bridge, culvert, sidewalk, and storm water infrastructure will be managed most efficiently and effectively allocate resources in a manner that will meet the Township s desired levels of service within the lowest overall lifecycle costs. This Plan identifies the costs and benefits of infrastructure investment decisions across the organization s asset portfolio. To demonstrate the impact of investment decisions, target Levels of Services were set for each asset class so that performance against these targets could be measured. A Financial Plan is also included in this document which shows how current levels of investment are measuring up against the asset needs. This plan will help to demonstrate the impacts of investment decisions across the organization. It ultimately provides a 10 year capital needs forecast based on available condition assessment information, from 2017 to 2026, and makes recommendations for how the Township may advance its asset management programme moving forward. 1.3 DEVELOPMENT OF AN ASSET MANAGEMENT PLAN This Asset Management Plan only documents the asset management strategy for the core public infrastructure of Transportation systems: roads, sidewalks, bridges, culverts, and storm water. It is
22 17 anticipated that future government funding of infrastructure projects will be contingent on an Asset Management Plans. It is highly recommended that the Township consider future integration of Asset Management Plans to promote consideration of mutual needs, infrastructure interdependencies, and avoidance of institutional siloing. While the previous Plan by Public Sector Digest documented all of the Township s infrastructure categories, it had two major deficiencies. First, the condition rating assigned to infrastructure asset systems was a blend of theoretical asset condition based on age and a theoretical annual investment that was calculated using assumed economic Service Life Spans for infrastructure that were inconsistent with the actual engineering Service Lives. This approach produced inaccurately poor infrastructure condition scores. The second deficiency was that, though an annual cost was identified for the plan, no actual infrastructure investments were identified. This document looks at a 10 year planning horizon from 2017 to 2026 but should be re-evaluated on a five year basis. It has been developed so that regular updates can be made to reflect the Township s changing needs and funding availability. Below is a typical asset management framework as presented in the International Infrastructure Management Manual. It outlines the relationship between the processes and procedures being presented in this Plan. Figure 1-1 Typical Asset Management Framework INTRODUCTION Asset management is the philosophy of actively managing assets with the intention of achieving a specific objective; in this case, delivering the Township s services at the lowest lifecycle cost. This plan should not be a standalone document; it is an iteration of a continually-evolving framework for best management of the Township s infrastructure, to be integrated into day-to-day operations and reviewed on an annual basis. Although certain principles of asset management such as Condition Assessment, Levels of Service and Capital Planning are addressed within this document, these are high level approaches and assessments that are to be refined as the Township s asset management program grows. This Asset Management Plan will require on-going and continual work to ensure its success.
23 18 On-going work or next steps to the refinement of the asset management strategy are presented at the end of each section. 1.4 RELATIONSHIP TO OTHER PLANNING DOCUMENTS This Asset Management Plan relied upon other targeted planning documents in developing the overall strategy. This document has already drawn upon the valuable work completed under other planning documents such as the: Township of Russell. "Township of Russell, Master Plan, Transportation chapter". Township of Russell Municipal Council Storm Water Drainage System Management Plan and Maintenance Program (McIntosh Perry). INTRODUCTION

24 STATE OF THE LOCAL INFRASTRUCTURE
25 20 STATE OF THE LOCAL INFRASTRUCTURE 2.1 INVENTORY OF ASSETS Key asset inventory information including location, size, length, material and other attribute information is displayed in the inventory of assets. PS 3150 VS ASSET MANAGEMENT Effective January 1, 2009, the Public Sector Accounting Board s (PSAB) Rules on Tangible Capital Assets (PS 3150) required that local governments record their Tangible Capital Assets on the statement of financial position and amortize them over their useful lives, moving all governments to a universal full accrual accounting system. In order to comply with this directive, municipalities across Ontario needed to develop an inventory of all of their infrastructure assets, along with an assumed replacement cost. PS 3150 provides accounting information for all tangible capital assets (TCA) using historical cost valuation. An Asset Management Plan needs to provide the financial information and timing associated with future replacements, rehabilitations, disposals, expansions and maintenance for the tangible capital assets. Table 2-1 below summarizes key differences between PS 3150 and asset management. Table 2-1 PS 3150 vs. Asset Management STATE OF THE LOCAL INFRASTRUCTURE Use Valuation Procedure Reporting PS 3150 To inventory TCAs and provide valuations Amortize costs of assets Use assumed economic service life to determine asset amortization Audited Financial Statements, Financial Information Returns ASSET MANAGEMENT To inventory TCAs and provide a long term, sustainable forecast Project future costs (taking into account inflation) of assets Use condition and risk to determine asset needs Asset Management Plans The majority of the information used in the development of this Asset Management Plan was based on the Township s 2016 PS 3150 data. This includes road, bridge, culvert, sidewalk, and storm sewer assets. Where more recent data meeting the requirements of this plan was available, best efforts were made to incorporate the newer data. The information was augmented by available condition inspection reports and Road Needs Study data.


26 ASSET VALUE The estimated life expectancy of each asset type and current year (2016 CAD) replacement value are both listed in the inventory of assets. The life expectancy and assumed replacement values used in this plan are based on the replacement values assigned to each asset under the previous PS 3150 compliance exercise and subsequent condition assessments. The life expectancies are based on a number of factors, including industry accepted standards, engineering best practice, and local experience by Township of Russell Staff. While the PS 3150 values were escalated forward to 2016 at a rate of 3% per year to determine the 2016 replacement cost, this is an approximation of the actual costs that may be incurred due to changes in technology, designs, and even infrastructure requirements. The total current year (2016 CAD) replacement costs for each asset category are displayed below in Figure 2-1. Figure 2-1Total Replacement Values (2016 CAD) by Asset Category Bridges & Culverts, $18,198,715 Storm Sewers, $25,855,272 STATE OF THE LOCAL INFRASTRUCTURE Roads, $94,679,844 Sidewalks, $2,546,548 Net book value depicts an assets value as the difference between the purchase or original construction price and the final accumulated amortization. 2.3 ASSET CONDITION ASSET CONDITION RATING SCALE The condition of the individual assets was estimated based on the age and expected life of each asset, condition information documented by Township staff, and available inspection reports and condition assessments. WSP conducted a road condition assessment for the paved roads, in compliance with the MTO SP-024 Manual for Condition Rating of Flexible Pavements, and applied these revised conditions to the asset inventory. Assets were assigned a condition rating of 1 to 5 based on the rating scale shown in Table 2-2.
27 22 Table 2-2 Asset Condition Rating Scale RATING DESCRIPTION DEFINITION & ESTIMATED INTERVENTION COST 1 Very Poor Requires asset replacement, replacement cost 2 Poor Required major rehabilitation, large dollar amount 3 Fair Minor maintenance, small dollar amount 4 Good No work required, no dollar amount, perform normal maintenance 5 Excellent No work required, no dollar amount It is important to undertake regular condition assessments of all infrastructure assets to compare against baseline condition and performance information, known risks, and organizational priorities in order to determine and prioritize capital projects. The field inspection work involved in a condition assessment provides a snapshot representation of each asset s condition at that point in time. It should be noted that the condition ratings developed in this Asset Management Plan have been assigned using a mixture of previous field inspections of transportation infrastructure as provided to WSP depreciated via desktop analysis, where our condition assessment did not review a particular road segment, with a review of paved roads condition conducted by our inspectors. To complete future updates of the Asset Management Plan, it is recommended that the Township undertake regular condition assessments of its infrastructure and use maintenance records, local knowledge and CCTV records of piping to update condition ratings of buried infrastructure on an ongoing basis. STATE OF THE LOCAL INFRASTRUCTURE ROADS AND SIDEWALKS The Township s Road Inventory and Needs Study (2012) previously established the structural adequacy of the roads and sidewalk, and projected future works and maintenance expenditures over a 10 year period. The need to improve an individual road and sidewalk section was determined by comparing the existing physical characteristics of the road system to the minimum standards, as defined in the Inventory Manual for Municipal Roads (Ministry of Ontario guidelines). The condition rating which was provided in the study is a score on a 100 points basis. It provides an overall indication of the physical condition of the road and sidewalk segment the higher the condition rating, the better the asset condition. WSP converted the 100 point score to a 5 point Condition Rating scale as shown in Table 2-3. The development of the sidewalk condition rating method was based on the three most critical deficiencies. The importance for repair or greatest safety concern of the deficiencies was determined to be a vertical step separation, followed by a horizontal crack and then spalling.
28 23 Table 2-3 Road and Sidewalk Condition Rating Scale RATING CONDITION ROAD INVENTORY AND NEEDS STUDY S SCORE 1 Very Poor Poor Fair Good Excellent From the Township s 2012 Road Inventory and Needs Study and the 2015 Road Inventory AADT and basic road information was obtained, which was used to compare the relative importance and benefit of improving each road and sidewalk segment. Each segment assessed by WSP was rated based on the Ministry of Transportation s priority rating scheme: PPPPPPPPPPPPPPPP RRRRRRRRRRRR = 0.2(100 PPPPPP) (AAAAAAAA + 40) 1 4 The study used an empirical approach for the road segment, which considers not only the existing condition (as per the condition rating), but also the traffic volumes that it serves. In this regard, roads of equal condition are prioritized based on their traffic volumes, with priority given to those which serve the greater number of users. While a road may be in poor condition and hence have a low condition rating, it may have a low priority if the volume of traffic served is also low. The study also developed a priority rating method for each sidewalk segment. The priority is based not only on the sidewalk condition, but also its purpose and use. Sidewalk segments along major roadways through the Municipality as well as those along school walking routes were determined to be of higher importance than those through residential areas, because of their higher potential use. Thus, the lower the prioritized condition rating the higher the segment is on the list for repairs. This would be considered the worst case if their locations are also of higher potential use. WSP has recommended road and sidewalk segments to be improved within the 10 year planning period ( ) based on the Priority Rating. Focusing on higher risk assets (assets in a worse condition with a greater traffic flow) will ensure that the greatest benefits to be achieved for the improvement dollar expended. STATE OF THE LOCAL INFRASTRUCTURE BRIDGES AND CULVERTS According to Ontario Regulation 104/97, every public bridge in Ontario must undergo an inspection every two years. Bridge and culvert condition was established based on the most recent Ontario Structure Inspection Manual (OSIM) report which was prepared by HP Engineering Inc. in August An OSIM report for each structure has been prepared and recommended works identified in the report are being implemented in the next 10 year planning period ( ). Bridges and culverts were assigned a condition rating of Excellent, Good, Fair or Poor. The OSIM reports provide condition state tables for each material type and for specialized elements where required. As a general rule of thumb, the following table is used for most condition states.
29 24 Table 2-4 OSIM General Condition Ratings RATING 2 Poor 3 Fair 4 Good 5 Excellent DESCRIPTION DEFINITION This refers to an element (or part of an element) where severe and very severe defects are visible. In concrete, any type of spalling or delamination would be considered poor since these defects usually indicate more serious underlying problems in the material (e.g. corroding reinforcing steel). These types of defects would normally trigger rehabilitation or replacement if the extent and location affect the overall performance of that element. This refers to an element (or part of an element) where medium defects are visible. These types of defects may trigger a preventative maintenance type of remedial action (e.g. sealing, coating, etc.) where it is economical to do so. This refers to an element (or part of an element) where the first sign of light (minor) defects are visible. This usually occurs after the structure has been in service for a number of years. These types of defects would not normally trigger any remedial action since the overall performance of the element is not affected. This refers to an element (or part of an element) that is in new (as constructed) condition No visible deterioration type defects are present and remedial action is not required. Minor construction defects do not count as visible deterioration type defects. STATE OF THE LOCAL INFRASTRUCTURE STORM SEWERS The Township s Storm Water Drainage System Management Plan and Maintenance Program (McIntosh Perry, 2012) previously established the inventory and assessed the drainage system within the urban boundaries of Russell Township. It also formulated a capital and maintenance plan over a 10 year period. Over 12,000 m of sewers were CCTV inspected in The pipe sections and associated manholes inspected were given a basic condition rating of either A, B or C based on the CCTV reports. A rating of A indicates the pipe is in good condition and no work is needed, B rating requires minor repairs in six to 10 years and a rating C requires major repairs in one to five years. WSP converted the A,B & C Condition Rating scale to Good, Fair and Poor as shown in Table 2-5. Table 2-5 Storm Sewers Condition Rating Scale RATING CONDITION DRAINAGE SYSTEM STUDY S SCORE 1 Very Poor C- 2 Poor C
30 25 RATING CONDITION DRAINAGE SYSTEM STUDY S SCORE 3 Fair B 4 Good A 5 Excellent A+ WSP recommends pipes and manholes to be repaired within the 10 year planning period ( ) based on the aforementioned Management Plan and Maintenance Program. It will ensure that the greatest benefits to be achieved for the improvement dollar expended AVERAGE ASSET CATEGORY CONDITION The Township of Russell s average condition ratings for each of the asset categories: roads, sidewalks, bridges, culverts, and storm sewers, are presented below. A letter grade corresponding to the average asset category condition has been assigned based on the breakdown provided in Table 2-6. Table 2-6 Condition Rating and Grade CONDITION RATING A A A B B B C C C D D D- GRADE STATE OF THE LOCAL INFRASTRUCTURE ROADS The Township of Russell is responsible for approximately km of roads which include high cost bituminous (HCB), low cost bituminous (LCB), gravel and earth surfaces. The breakdown of the Township s roads by surface type is displayed in Figure 2-2.
 EXPECTED SERVICE LIFE (YEARS) 2016 AVERAGE CONDITION RATING AVERAGE GRADE Earth 35 5 3.")
31 26 Figure 2-2 Township of Russell Road Surface types The average condition of each surface type and the overall condition rating for the Township of Russell s roads are displayed below in Table 2-7. Table 2-7 Average Roads Condition SURFACE TYPE AVERAGE AGE (YEARS) EXPECTED SERVICE LIFE (YEARS) 2016 AVERAGE CONDITION RATING AVERAGE GRADE Earth D- High Cost Bituminous Low Cost Bituminous A A Gravel B- OVERALL GRADE A- STATE OF THE LOCAL INFRASTRUCTURE SIDEWALKS The Township of Russell has approximately 27.2 km of sidewalks. The average condition rating for the Township of Russell s sidewalks is shown in Table 2-8. Table 2-8 Average Sidewalks Condition ASSET CATEGORY AVERAGE AGE (YEARS) EXPECTED SERVICE LIFE (YEARS) 2016 AVERAGE CONDITION RATING OVERALL GRADE Sidewalks C-
32 27 BRIDGES The Township of Russell is responsible for the operation and maintenance of 14 bridges. Four of the bridges have exceeded their expected service lives. However, recent condition reports, as well as planned rehabilitation works indicate that the Bridges are in relatively good condition for their age. The overall condition rating for the Township of Russell s bridges is shown in Table 2-9. Table 2-9 Average Bridge Condition BRIDGE STRUCTURE AVERAGE AGE (YEARS) EXPECTED SERVICE LIFE (YEARS) 2016 AVERAGE CONDITION RATING OVERALL GRADE Concrete B BRIDGE CULVERTS The Township of Russell is responsible for the operation and maintenance of 12 culverts. The culverts are generally in good condition. However, three culverts have been identified for replacement based on the 2015 OSIM inspections. The average condition of each culvert type and the overall condition rating for the Township of Russell s culverts are shown in Table Table 2-10 Average Bridge Culvert Condition STATE OF THE LOCAL INFRASTRUCTURE CULVERT TYPE AVERAGE AGE (YEARS) EXPECTED SERVICE LIFE (YEARS) 2016 AVERAGE CONDITION RATING AVERAGE GRADE Steel B Concrete C OVERALL GRADE B STORM SEWERS The Township of Russell is responsible for the operation and maintenance of approximately 89.5km of storm sewers, 1302 catch basins and 563 storm sewer manholes. The overall condition rating for the Township of Russell s storm sewers is shown in Table Table 2-11 Average Storm Sewer Condition ASSET CATEGORY AVERAGE AGE (YEARS) EXPECTED SERVICE LIFE (YEARS) 2016 AVERAGE CONDITION RATING AVERAGE GRADE Storm Sewer Main A- Catch Basin B+ OVERALL GRADE A-
33 28 ASSET CATEGORY AVERAGE AGE (YEARS) EXPECTED SERVICE LIFE (YEARS) 2016 AVERAGE CONDITION RATING AVERAGE GRADE Manhole B Storm Service Pipe A- Storm Outlet A- 2.4 NEXT STEPS OVERALL GRADE This section has been prepared based on the most complete data set available for each asset category. Moving forward, the Township s asset inventory will need to be maintained and augmented to support the objectives of the Township s Asset Management Planning framework. This may include improved segmentation for Township bridge and culvert assets (per the OSIM inspections). This will ensure a more accurate representation of the state of the local infrastructure for future updates to this Asset Management Plan. Recommended updates to the Township s current infrastructure inventory systems are presented in Table 2-12 for each asset category. Note that this table does not include all the needs that may be expected for the Township s bridge or bridge culvert assets, as these can be expected to be refined on a biennial basis as recommendations from OSIM inspections. Table 2-12 State of Local Infrastructure Next Steps STATE OF THE LOCAL INFRASTRUCTURE Asset Category Identified Need Year Cost (2016 CAD) Roads Sidewalks Storm Repair or rehabilitation of 11 road segments: 01100, 02110, 02120, 02600, 02610, 02620, 03000, 03010, 02630, 02640, Lifecycle replacement of 440m of sidewalk segments: Concession (R136) - Legion to First St., First St. to Castor, Castor to Main, Main to Craig Year 1 of 5 year program to repair / replace Condition 2 segments MH repair program (year 1 of 10) 2017 $1,026, $74, $73,670 Bridges & Culverts Bridges & Culverts Repairs per OSIM reports 2017 $1,249,000 Studies per OSIM reports 2017 $295,500
34 29 Asset Category Identified Need Year Cost (2016 CAD) Total 2017 $2,718,406 Total Immediate $2,718,406 Roads Storm Bridges & Culverts Repair or rehabilitation of 9 road segments: , 03720, , 01200, , 06100, 88160, 50010, Year 2 of 5 year program to repair / replace Condition 2 segments MH repair program (year 2 of 10) 2018 $1,058, $73,670 Repairs per OSIM reports 2018 $2,206,500 Total 2018 $3,338,330 Roads Repair or rehabilitation of 9 road segments: 01210, 03920, 07000, 07050, 07100, 07300, 07500, 88050, $969,800 STATE OF THE LOCAL INFRASTRUCTURE Sidewalks Repairs to 8.1 km of sidewalk segments 2019 $789,975 Storm Year 3 of 5 year program to repair / replace Condition 2 segments MH repair program (year 3 of 10) 2019 $73,670 Bridges & Culverts Repairs per OSIM reports 2019 $119,700 Total 2019 $1,953,145 Roads Repair or rehabilitation of 8 road segments: 01430, 01440, , 03200, 03215, 52050, 55480, $1,131,360 Sidewalks Repairs to 6.7 km of sidewalk segments 2020 $267,301 Storm Year 4 of 5 year program to repair / replace Condition 2 segments MH repair program (year 4 of 10) 2020 $73,670 Total 2020 $1,472,331 Total Short-Term $6,763,806
35 30 Asset Category Roads Identified Need Repair or rehabilitation of 6 road segments: , 04520, 52040, 80150, 82080, Year Cost (2016 CAD) 2021 $1,033,705 Sidewalks Repairs to 1.5 km of sidewalk segments 2021 $20,930 Storm Year 5 of 5 year program to repair / replace Condition 2 segments MH repair program (year 5 of 10) 2021 $73,670 Total 2021 $1,128,305 Roads Repair or rehabilitation of 4 road segments: 03220, 03910, , $799,800 Sidewalks Repair of 223 m of sidewalk 2022 $1,170 Storm Year 1 of 5 year program to repair / replace Condition 3 segments MH repair program (year 6 of 10) 2022 $107,576 STATE OF THE LOCAL INFRASTRUCTURE Bridges & Culverts Replacement of Bridge RC-001 per OSIM recommendations 2022 $334,000 Total 2022 $1,242,546 Total Medium-Term $2,370,851 Roads Repair or rehabilitation of 3 road segments: 01015, 01150, $255,000 Sidewalks Repair of 227 m of sidewalk 2023 $1,114 Storm Year 2 of 5 year program to repair / replace Condition 3 segments MH repair program (year 7 of 10) 2023 $107,576 Total 2023 $363,690 Roads Repair or rehabilitation of 14 road segments: 02320, 52020, 52030, 52280, 55250, 58000, 58110, 58190, 58220, 58230, 80075, 82000, 86010, $1,242,680 Sidewalks Repair of 500 m of sidewalk 2024 $2,527
36 31 Asset Category Storm Identified Need Year 3 of 5 year program to repair / replace Condition 3 segments MH repair program (year 8 of 10) Year Cost (2016 CAD) 2024 $107,576 Total 2024 $1,352,783 Roads Repair or rehabilitation of 19 road segments: 01420, 01300, 52340, 52350, 52360, 52365, 52370, 55020, 55400, 55460, 55470, 55490, 55500, 55510, 55520, 58160, 58180, 58200, $1,265,680 Sidewalks Lifecycle replacement of 12.1 km of sidewalk segments 2025 $2,263,804 Storm Year 4 of 5 year program to repair / replace Condition 3 segments MH repair program (year 9 of 10) 2025 $107,576 Total 2025 $3,637,060 STATE OF THE LOCAL INFRASTRUCTURE Roads Storm Repair or rehabilitation of 24 road segments: 01110, , 04200, 55190, 55320, 55330, 55340, 55350, 55360, 55370, 55390, 82250, 82260, 82270, 82280, 82300, 82330, 82340, 82350, 82360, 82370, 82420, 82440, Year 5 of 5 year program to repair / replace Condition 3 segments MH repair program (year 10 of 10) 2026 $1,623, $107,576 Total 2026 $1,731,456 Total Long-Term $7,084,989 ASSET CATEGORY Roads INVENTORY UPDATES TO SUPPORT ASSET MANAGEMENT PLANNING Continue to update Road Inventory and Needs studies (condition of paved surfaces assessed within this project) Inventory updates including Actual Year of Last Resurfacing Works and Year of Road Construction as work is completed Update Annual Average Daily Traffic Counts (AADT)
37 32 ASSET CATEGORY Sidewalks Bridges & Culverts Storm INVENTORY UPDATES TO SUPPORT ASSET MANAGEMENT PLANNING Update condition assessment study Review & revise asset identification to ensure unique IDs provided to each segment N/A Assessed condition (CCTV results) Update 2012 Storm Water Drainage System Management Plan and Maintenance Program STATE OF THE LOCAL INFRASTRUCTURE

38 EXPECTED LEVELS OF SERVICE
39 34 EXPECTED LEVELS OF SERVICE Levels of service are qualitative and quantitative descriptions of the Township s objectives for their infrastructure. They provide the means to measure affordability of the infrastructure and its management against infrastructure users needs and expectations. The asset management decision making process is driven by the impact of the levels of service on citizens, communities and the natural environment. This section outlines the Township s desired levels of service for their road, sidewalk, bridge, culvert, and storm water infrastructure. EXPECTED LEVELS OF SERVICE 3.1 MINIMUM REGULATORY REQUIREMENTS As a minimum level of service, there are regulatory requirements associated with the Township s infrastructure that must be met. The regulatory requirements applicable to the Township are summarized in Table 3-1. These requirements are not being identified as a Level of Service since they are already a minimum target and therefore must be met by the Township. Table 3-1 Minimum Regulatory Requirements ASSET CATEGORY Roads, Sidewalks, Bridges & Culverts Storm REGULATORY REQUIREMENTS Minimum Maintenance Standards (Ontario Regulation 239/02, Municipal Act, 2001) Ontario Structure Inspection Manual (OSIM) Public Transportation and Highway Improvement Act (Ontario Regulation 104/97, Standards for Bridges) Environmental Protection Act Ontario Water Resources Act, R.S.O LEVELS OF SERVICE BY ASSET CATEGORY The levels of service have been defined for each of the asset categories: Roads, Sidewalks, Bridges, Culverts, and Storm Water Collection System. Each level of service has been defined through technical performance measures. In order to actively track the Township s performance in meeting the desired levels of service, an assigned value will provide a means to measure the performance. The target values, existing values and target timeframes for each technical performance measure by asset category are listed in Table 3-3 to Table 3-7. A letter grade has been assigned to indicate how well the Township is meeting their desired performance measures for each category. Table 3-2 below outlines the Service Level Scoring.
40 35 Table 3-2 Level of Service Performance Measures Success Scoring ROADS GRADE A B C F GUIDELINES Currently meeting or exceeding performance level targets for the asset category Asset category is showing positive improvement in achieving Levels of Service targets by target timeframe Asset category is showing no improvement in achieving levels of Service Targets by target timeframe Actual Level of Service is trending away from Level of Service target LEVEL OF SERVICE: TO PROVIDE A SMOOTH, COMFORTABLE RIDING SURFACE AT THE POSTED SPEED LIMIT EXPECTED LEVELS OF SERVICE Table 3-3 Level of Service Performance Measures for Roads TECHNICAL PERFORMANCE MEASURE Average condition rating of gravel roads Average condition rating of LCB roads Average condition rating of HCB roads Average condition rating of earth roads Frequency of gravel road maintenance (grading, dust control) Frequency of LCB, HCB and EXP road maintenance (crack sealing, pothole repair) Percentage of Class 4 roads with HCB/LCB Percentage of Class 5 roads with HCB/LCB Percentage of Class 6 roads with LCB/HCB UNIT EXISTING VALUE TARGET VALUE TARGET TIMEFRAME (YEAR) CURRENTLY MEETING TARGET? X No/yr < X No/yr TBD X % X % % X
41 36 TECHNICAL PERFORMANCE MEASURE Traffic Loading: Vehicles per hour per lane per direction UNIT EXISTING VALUE TARGET VALUE TARGET TIMEFRAME (YEAR) CURRENTLY MEETING TARGET? No. TBD X The existing breakdown of the Town s roads by Highway Class and surface type is summarized in Table 3-4. Table 3-4 Roads by Highway Class and Surface Type SURFACE TYPE CLASS 3 CLASS 4 CLASS 5 CLASS 6 KM % KM % KM % KM % Earth G/S HCB LCB Total 23.2 km 100.0% km 100.0% 66.2 km 100.0% 37.0 km 100.0% EXPECTED LEVELS OF SERVICE SIDEWALKS LEVEL OF SERVICE: TO PROVIDE PEDESTRIAN FRIENDLY SIDEWALKS THAT PROMOTE WALKING IN RUSSELL S COMMUNITIES Table 3-5 Level of Service Performance Measures for Sidewalks TECHNICAL PERFORMANCE MEASURE Average condition rating of sidewalks Percentage of sidewalks adjacent development frontage UNIT EXISTING VALUE TARGET VALUE TARGET TIMEFRAME (YEAR) % TBD 90% 2026 CURRENTLY MEETING TARGET? BRIDGES & CULVERTS LEVEL OF SERVICE: TO PROVIDE A COMFORTABLE RIDING SURFACE AND SAFE MEANS OF PASSAGE THAT MEETS THE NEEDS OF ALL USERS
42 37 Table 3-6 Level of Service Performance Measures for Bridges & Culverts TECHNICAL PERFORMANCE MEASURE Average condition rating of bridges Average condition rating of culverts UNIT STORM WATER COLLECTION LEVEL OF SERVICE: EXISTING VALUE TARGET VALUE TARGET TIMEFRAME (YEAR) Table 3-7 Level of Service Performance Measures for Storm Sewers CURRENTLY MEETING TARGET? TO PROVIDE RELIABLE AND EFFICIENT STORM WATER COLLECTION WITH A STRONG FOCUS ON THE ENVIRONMENT PROTECTION EXPECTED LEVELS OF SERVICE TECHNICAL PERFORMANCE MEASURE UNIT EXISTING VALUE TARGE T VALUE TARGET TIMEFRAM E (YEAR) CURRENTLY MEETING TARGET? Average condition rating of storm sewers NEXT STEPS It is recommended that the Township continue to track the values for the above technical performance measures on an annual basis, rather than on the same cycle as the Asset Management Plan update, so that corrective actions can be implemented to achieve the target Levels of Service.

43 ASSET MANAGEMENT STRATEGY
44 ASSET MANAGEMENT STRATEGY 39 Infrastructure sustainability is dependent on activities such as maintenance, repairs, upgrades and replacements when necessary. The application of these activities relies heavily on the level of funding available and the effective allocation of that funding. To ensure recommended works are appropriately prioritized, an assessment of risk was undertaken to determine the urgency of the works associated with the Township s infrastructure. The asset management strategy outlines the planned action strategies and determines the risk for the Township s infrastructure assets. 4.1 PLANNED ACTION STRATEGIES Recommended works were classified based on six (6) planned action strategies: non-infrastructure solutions, maintenance activities, renewal/rehabilitation activities, replacement activities, disposal activities and expansion activities, as outlined in the Ministry of Infrastructure Ontario s, Guide for Municipal Asset Management Plans. A description of each strategy is outlined below. ASSET MANAGEMENT STRATEGY NON-INFRASTRUCTURE SOLUTIONS Non-infrastructure solutions produce lower costs for long-term asset sustainability. Cost and time savings are optimized by implementing an organizational approach for all infrastructure works. Important non-infrastructure solutions include implementation of an Asset Management Plan and regular inspections of the various infrastructure assets. Results of inspections should be used to regularly update the Asset Management Plan. Bridges and culverts are to be inspected every two (2) years, roads are to be inspected every three (3) years and other infrastructure should generally be inspected at least every five (5) years MAINTENANCE ACTIVITIES Maintenance is essential to managing infrastructure, as the expected level of service often relies on maintenance activities. Regular maintenance can also add significant life to assets. It is important that the Township of Russell schedule regular inspections of its assets to identify maintenance requirements. Annual maintenance expenditures for the Township s infrastructure have been estimated and incorporated into the final investment requirements. The Township should track the sufficiency and efficacy of its ongoing maintenance expenditures over time, and adjust as needs dictate. Specific maintenance actions recommended for the Township are described in Table 4-1 and Table 4-2.
45 40 Table 4-1 Recommended Maintenance for Roads ACTIVITY UNIT COST ANNUAL COST Annual Earth Maintenance Grass Cutting, Ditch Cleaning, Culvert Cleaning $228/km $5,560 Routine Grading $158/km $3,853 SUBTOTAL EARTH $9,413 Annual HCB Road Maintenance: Grass Cutting, Ditch Cleaning, Culvert Cleaning $247/km $72,189 Rout and Seal Cracks $2/m $116,905 Patching Potholes (est. ~2 potholes/km) $5/m 2 $2,923 Repair of pavement edges $75/m 2 $547,991 SUBTOTAL HCB $740,007 Annual LCB Road Maintenance: Grass Cutting, Ditch Cleaning, Culvert Cleaning $247/km $84,415 Rout and Seal Cracks $2/m $136,705 Patching Potholes (est. ~2 potholes/km) $5/m 2 $3,418 Repair of pavement edges $75/m 2 $640,804 SUBTOTAL LCB $865,341 Annual Gravel Road Maintenance: Dust Control (est. 0.6kg/m 2 ) $1.21/kg $25,247 Grass Cutting, Ditch Cleaning, Culvert Cleaning $228/km $11,286 Routine Grading $158/km $7,821 SUBTOTAL GRAVEL $44,354 TOTAL ANNUAL ROAD MAINTENANCE $1,659,115 ASSET MANAGEMENT STRATEGY
46 41 Table 4-2 Recommended Maintenance for Storm Water SERVICE QUANTITY RUSSELL EMBRUN UNIT COST / UNIT FREQUENCY ANNUAL BUDGET Flush Sewers m $ $41,093 CCTV m $ $11,741 Inspect Manholes ea $ $874 Inspect Catchbasins ea $ $1,042 Clean Catchbasins ea $ $7,812 TOTAL ANNUAL MAINTENANCE $62, RENEWAL / REHABILITATION ACTIVITIES Rehabilitation is necessary when an asset does not perform to its desired level of service. Significant repairs designed to extend the life of the asset are determined through regular inspections. Rehabilitation over replacement is advantageous when there are only a few components that need repair. Recommended renewal/rehabilitation activities are found in Section 6.1 and include, but are not limited to resurfacing roads, and repair of sidewalks, storm sewers, bridges and culverts. ASSET MANAGEMENT STRATEGY REPLACEMENT ACTIVITIES Occasionally, the extent of damage or deterioration to an asset is too great and rehabilitation is deemed unfeasible. At this point, replacement is necessary. As an asset approaches the end of its service life, more frequent inspection may be necessary to determine if replacement of the asset is critical in the short-term, or if deferral of the asset replacement is possible. The recommended replacement activities within the 10 year planning period include, but are not limited to, the replacement of 12.1km of sidewalks, two bridges, and three culverts DISPOSAL ACTIVITIES Disposal costs are associated with the reduction of services or elimination of demands placed on systems. By establishing target levels of service, an organization can clearly determine whether or not infrastructure or particular assets are needed. For the Township of Russell s road, sidewalk, bridge, culvert, and storm systems, no superfluous assets were identified. Asset disposal costs associated with infrastructure replacement activities are generally included with the estimates made for asset replacement EXPANSION ACTIVITIES Expansion activities are required to extend services to previously un-serviced areas or to expand services to accommodate growth demands. At present, no expansion activities have been included in this Plan. 4.2 ANALYSIS OF PLANNED ACTIONS An analysis of planned actions was used to determine the most effective strategy for managing the Township s infrastructure. The analysis compares two strategies for managing infrastructure; one with
47 42 timely renewal investments, and one without timely investments. These two strategies are depicted in Figure 4-1. Figure 4-1 Small but Timely Renewal Investments Save Money (Figure 1, Ministry of Infrastructure, Guide for Municipal Asset Management Plans ) ASSET MANAGEMENT STRATEGY Implementing an annual maintenance program and completing timely renewal works will keep the infrastructure performing at the desired levels of service, and at the same time prolong the life of the infrastructure and reduce overall spending. Therefore, the most cost effective strategy for managing the Township s infrastructure is to perform annual maintenance and complete timely renewal works. Figure 4-2 summarizes the typical asset lifecycle needs that will promote a financially sustainable, longterm forecast for the Township s road, sidewalk, bridge, culvert, and storm system infrastructure. After the recommended works have been identified to ensure each asset will perform at the desired level of service, the recommended works will be distributed over a ten year planning period. The recommended works for the infrastructure will be distributed based on priority levels determined through the assessment of risk. Following the application of full life cycle investments for maintenance, rehabilitation, renewal and replacement needs, the projected reinvestment needs will be compared to the current annual capital budget to determine the adequacy of the funding for the sustainability of the infrastructure.
48 43 Figure 4-2 Asset Ownership Lifecycle ASSET MANAGEMENT STRATEGY 4.3 ASSET LIFECYCLE TREATMENTS The following sections outline the assumptions made in determining the total costs to undertake the projected lifecycle treatments for each of the Township s road, sidewalk, bridge, culvert, and storm system assets ROADS AND SIDEWALKS Recommended lifecycle treatments for roads and sidewalks have been included in Table 4-3. Please note that it has been assumed that roads will undergo continued maintenance and rehabilitation and will not require complete road base replacement over the 10 year planning period.
49 44 Table 4-3 Recommended Lifecycle Treatments for Roads, Sidewalks and Street Lighting RECOMMENDED TREATMENT TIMING ESTIMATED COST Resurfacing (HCB) Every 25 years $240,000/km Resurfacing (LCB) Every 15 years $170,000/km Dragging and Rolling (G) Every 10 years $100,000/km Sidewalk Replacement End of Service Life (50 years) $125/m² Pothole Repair As required $5/m² Rout and Seal Cracks As required $3/m Manual Chip Seal of Pavement Edges As required $75/m² Dust Control Annually $0.726/m² Routine Grading Annually $160/km Grass cutting, ditch cleaning and culvert cleaning Annually $250/km ASSET MANAGEMENT STRATEGY BRIDGES AND CULVERTS Recommended lifecycle treatments for the bridges and culverts have been included in Table 4-4 Recommended Lifecycle Treatments for Bridges and Culverts. Table 4-4 Recommended Lifecycle Treatments for Bridges and Culverts RECOMMENDED TREATMENT TIMING ESTIMATED COST Bridge Replacement (Concrete Structure) Culvert Replacement (Steel) Culvert Replacement (Concrete) Bridge Maintenance/Cleaning (including washing of bearings, bearing seats, truss members, sweeping of bridge decks, curbs and gutters, removal of debris from expansion joints, debris pick-up or minor removal of aggregate, cleaning of catch-basins, man-holes and deck drains) STORM WATER COLLECTION SYSTEM End of Service Life (50 years) End of Service Life (40 years) End of Service Life (50 years) Annually Cost varies by bridge $107,000 - $2,911,000 Cost varies by diameter $255,000/m - $500,000/m Cost varies by diameter $325,000/m - $475,000/m Cost varies by bridge type, size (Average ~1% of initial cost) Recommended lifecycle rehabilitation for the storm water collection system has been included in Table 4-5.
50 45 Table 4-5 Recommended Lifecycle Treatments for Storm Water Collection RECOMMENDED TREATMENT TIMING ESTIMATED COST Replacement of Sewers End of Service Life (80 years) Cost varies by diameter, material $200 - $800 per meter Replacement of Manholes End of Service Life (80 years) $8,100 per manhole Replacement of Catch Basins End of Service Life (80 years) $2,300 per catch basin Flushing and Cleaning of Sewer As required $4,000 per km It is recommended that storm sewers (pipes and manholes) be flushed every two years and CCTV d every five years. Catch basins should be cleaned yearly and should be inspected every five years. The camera and flushing programs are recommended to be implemented for identifying and forecasting replacement and repair needs. Emergency repairs can cost significantly more than a repair under normal circumstances. The need for emergency repairs of buried infrastructure can be significantly reduced if critical sections can be identified and repaired before a failure occurs. Maintenance and inspections of these mains can prolong the life of these assets. A yearly maintenance cost will be included in the maintenance activities for the next ten years as identified in Section 5 of Financing Strategy. ASSET MANAGEMENT STRATEGY 4.4 INFLATION The rehabilitation, renewal and replacement costs for the Township s infrastructure have been projected over a ten year planning period from 2017 to Due to the uncertainty of annual inflation, present value dollars (2016 CAD) have been utilized in all calculations. An inflation rate of can be applied to help assess rehabilitation costs in future years, but care should be taken and consideration given to conducting a sensitivity analysis when relying on this information for capital needs analyses. 4.5 PROCUREMENT Procurement is the act of obtaining goods, services or works from an external source. The Ministry of Infrastructure s Guide for Municipal Asset Management Plans recommends that municipalities have procurement by-laws in place to serve as a basis for considering various delivery mechanisms. The Township of Russell established Procurement Policy ADM/019 in 2004 (revised June 2007, and November 2009), as well as By-law # (passed June 2013), which establish the process for which goods and services are procured. The by-law has been subsequently amended in September 2015 with by-law # The intent of these policies and by-laws was to ensure competitive procurement and transparency to the public. The levels of service and the Township s ability to meet the associated targets and timeframes may be affected by any limitations of these by-laws.
51 OVERVIEW OF RISKS Understanding risks is important to the safety and functionality of the Township s infrastructure. An assessment of risk was undertaken in order to determine the priority of the works associated with the infrastructure. The recommended works were distributed over the ten (10) year planning period based on the priority determined through the risk assessment. In determining the recommended capital plan, risk-based prioritization methods were applied. For needs identified with the road systems, MTO s prioritization framework was followed. For Bridges and Culverts, recommendations from the OSIM inspections were adopted directly. Sidewalks and storm water systems were prioritized based on their condition. In order to provide a general risk overview of the systems as a whole, asset risks were normalized using the risk assessment approach summarized below, outlining how the assessment was carried out for the Township of Russell s infrastructure. Every risk is expressed in terms of the following components: A hazardous event or incident; A cause; The probability (likelihood) of its occurrence; and A consequence. Risk is expressed as: Risk = Likelihood x Severity The likelihood (or probability) is assigned to the individual risk events; in this case, the likelihood of asset failure as a whole. The severity is also assigned to the specific consequence regardless of its probability. For the purposes of this Asset Management Plan, the only hazardous event considered was the failure of each asset. Please note that this assessment of risk is not a formal or comprehensive risk assessment of the Township s infrastructure and therefore does not include all potential risks associated with each asset. To complete future updates of the Asset Management Plan, it is recommended that the Township undertake regular risk assessments of its infrastructure. This approach is similar to that already followed by the Township for their DWQMS risk assessments. Table 4-6 and Table 4-7 were used to assign likelihood and severity scores to the failure of each asset. ASSET MANAGEMENT STRATEGY
52 47 Table 4-6 Risk Likelihood Rating Scale LIKELIHOOD DESCRIPTION Rare Unlikely Possible Likely Very Likely The associated infrastructure is new (within warranty period) and therefore not expected to fail in the near future; or Condition rating of 5 ( Excellent ). The infrastructure is not new, but is still within the first quarter of its anticipated service life; or Condition of 4 ( Good ). The associated infrastructure is part way through its anticipated service life; or The asset has already been refurbished or rebuilt; or Condition Rating of 3 ( Fair ). The associated infrastructure is approaching the end of its life cycle and therefore it is expected to fail in the near future; or Condition Rating of 2 ( Poor ). The associated infrastructure has exceeded its life cycle and failure is considered imminent. Condition Rating of 1 ( Very Poor ). RATING ASSET MANAGEMENT STRATEGY Table 4-7 Risk Severity Rating Scale SEVERITY DESCRIPTION RATING Insignificant Minor Moderate No disruption to normal operation, no environmental impact, no financial investment. Some manageable operation disruption, minor environmental impact, small financial investment; or Failure of a: lower priority road with less than 500 AADT a sidewalk small diameter storm sewer ( mm) Significant modification to normal operation but manageable, easy to mitigate environmental impact, moderate financial investment; or Failure of a: medium priority of road with AADT from 500 to 1000 medium priority (rural ) Bridge culvert medium diameter storm sewer ( mm) 1 2 3
53 48 SEVERITY DESCRIPTION RATING Major Reduced production with inability to meet demand imminent, significant environmental impact, large financial investment; or Failure of a: higher priority road with AADT over higher priority (semi-urban) bridge culvert large diameter storm sewer ( mm) or bridge (rural) Catastrophic Inability to meet demand, potential injury, severe environmental impact, significant financial investment; or Failure of a: very large diameter storm sewer ( mm) or bridge (semi-urban or urban) 5 The risk score is determined as the product of the likelihood and severity ratings assigned to the event. This value was then used to assign priorities to the recommended works. Three risk levels were defined, based on the risk score of the particular event. These are shown in Table 4-8 and illustrated in Figure 4-3. Table 4-8 Risk Levels ASSET MANAGEMENT STRATEGY RISK = LIKELIHOOD X SEVERITY LEVEL ASSOCIATED RESPONSE 1 4 Low Acceptable 5 14 Medium Review and Address High Action Required
54 49 Figure 4-3 Risk Classification Chart ASSET MANAGEMENT STRATEGY AVERAGE ASSET CATEGORY RISK The recommended works were prioritized in order to minimize the average risk level over the ten year planning period. The average risk ratings for the Township of Russell s infrastructure by asset category are presented in Table 4-9. Table 4-9 Average Asset Category Risk ASSET CATEGORY TYPE 2016 AVERAGE RISK RATING AVERAGE LEVEL OVERALL LEVEL High Cost Bituminous 4.0 Low Low Cost Bituminous 4.2 Low Low (4.0) *Gravel 6.0 Medium Sidewalks N/A 7.4 Medium Medium (7.4) Storm sewer N/A 5.5 Medium Medium (5.5) Bridges Concrete 9.9 Medium Medium (9.9) Bridge Culverts Steel 8.5 Medium Concrete 12.0 Medium Medium (9.1)
55 NEXT STEPS It is recommended that a more detailed risk assessment be undertaken for the Township s infrastructure through future Asset Management Planning activities to refine the results of the high level risk analysis performed under this study. In addition to enhancing the risk assessment, it is recommended that the Township establish an integrated project prioritization frameworks to assist in capital planning and risk management. It is important to concurrently track the efficacy / impact of ongoing expenditures to validate or refine the investment strategy.

56 FINANCING STRATEGY

57 FINANCING STRATEGY EXPENDITURE FORECASTS TEN YEAR INVESTMENT NEEDS BY ASSET CATEGORY Based on approaches to asset lifecycle investments, including installation, maintenance and replacement at the end of service life, ten year asset needs profiles have been created for the asset categories. The forecasted needs do not include the costs associated with staffing or the staffing growth requirements to meet the future infrastructure needs, nor does it include any expansion or upgrade activities that may be necessary to meet growing demands on the infrastructure. A summary of the ten year asset needs (in thousands of dollars) is included in Table 5-1. Table 5-1 Ten Year Needs by Infrastructure Category FINANCING STRATEGY ASSET CATEGORY Roads $2,685 $2,717 $2,629 $2,790 $2,693 $2,459 $1,914 $2,902 $2,925 $3,283 Sidewalks $74 $0 $773 $267 $21 $1 $1 $0 $1,593 $0 Storm Sewers $175 $175 $175 $175 $175 $131 $131 $131 $131 $131 Bridges & Culverts $1,545 $2,207 $120 $0 $0 $334 $0 $0 $0 $0 Total (thousands 2016 CAD) $4,479 $5,099 $3,697 $3,233 $2,889 $2,925 $2,046 $3,033 $4,648 $3,414 The major capital projects for the Town projected over the ten year planning period include: Rehabilitation / replacement studies of seven bridges (for the full bridge, or individual bridge components) per OSIM Reports o Two (2) bridges may require complete replacement (R-006, R-027). Note the needs forecast includes only recommendations for work as specified in the OSIM reports. Minor rehabilitation of 12 bridges Rehabilitation / replacement study of ten culverts (full, or components) o Replacement of three culverts (RC-001, RC-029, and RC-039) Minor rehabilitation of five culverts (RC-002, RC-007, RC-008, RC-030, and RC-038) Replacement of 12.1 km of sidewalks Rehabilitation or replacement of 72 km of road segments (refer to Table 2-12 or Appendix A)
58 53 Condition assessment of Storm Sewers and replacement / rehabilitation program TEN YEAR INVESTMENT NEEDS BY PLANNED ACTION STRATEGY A summary of the recommended works categorized by the previously defined planned action strategies over the next ten year period (in thousands of dollars) is included in Table 5-2. This forecast will assist Township staff in planning for the expenses associated with replacement, maintenance, rehabilitation and expansion of the Township s infrastructure. Table 5-2 Ten Year Needs by Planned Action Strategy PLANNED ACTION STRATEGY Maintenance Activities Renewal / Rehabilitation Activities Replacement Activities Total (thousands 2016 CAD) $2,017 $1,722 $1,722 $1,722 $1,722 $1,722 $1,722 $1,722 $1,722 $1,722 $1,355 $2,939 $741 $744 $113 $70 $89 $535 $611 $791 $1,107 $439 $1,234 $767 $1,054 $1,134 $235 $776 $2,316 $901 $4,479 $5,099 $3,697 $3,233 $2,889 $2,925 $2,046 $3,033 $4,648 $3,414 FINANCING STRATEGY Figure 5-1 Ten Year Needs by Planned Action Strategy

59 EXPENDITURE HISTORY VS FORECASTS ROADS, SIDEWALKS, STORM SEWERS, BRIDGES AND CULVERTS The recommended annual maintenance investment for the roads and storm sewers is approximately $1,721,675. The current average annual sustainable infrastructure investment projected for the roads, sidewalks, storm sewers, bridges, and culverts over the ten year planning period, inclusive of the annual maintenance, is approximately $3,546,299. The projected annual expenditures over the planning period are summarized in Figure 5-2. Figure 5-2 Roads, Sidewalks, Storm Sewers, Bridges and Culverts 10-Year Investment Requirements FINANCING STRATEGY Per the Township s audited financial records, the average annual capital and maintenance expenditure for the roads, sidewalks, storm sewers, bridges, and culverts between the years of 2012 to 2016 has been $1,448,224. The breakdown of the yearly expenses is presented in Table 5-3. Note that the expenses listed for 2016 reflect budgeted values, not actuals. Table 5-3 Annual Expenses for Roads, Sidewalks, Storm Sewer, Bridges and Culverts CATEGORY PROPOSED BUDGET Roads (capital) Sidewalks (capital) AVERAGE ( ) $204,059 $453,887 $656,426 $650,300 $1,365,000 $665,934 $0
60 55 CATEGORY PROPOSED BUDGET AVERAGE ( ) Storm (capital) $334,208 $410,739 $55,350 $100,000 $136,230 $207,305 Bridge (capital) $41,309 $184,819 $60,000 $615,000 $180,226 Roads (operation) $484,378 $426,885 $298,132 $380,400 $0 $317,959 Sidewalks (operation) $0 Storm (operation) $0 Bridge (operation) $0 Average Annual Expenditure $1,448,224 FINANCING STRATEGY The difference between the forecasted annual sustainable investment and the existing average annual investment is $2,098,175. However, this figure does not necessarily reflect the actual funding situation in the Township as it does not capture transfers to and from reserves. 5.3 FUNDING STRATEGY The funding strategy has not been explicitly identified for this AMP. The exact funding of the sustainable infrastructure plan will be further determined through other studies to be undertaken by the Finance and Budget Departments. Numerous potential sources of funding are available to the Township of Russell to support the sustainable infrastructure investments, ranging from use of reserve accounts to grants, taxes to user fees. RESERVE ACCOUNTS The Township currently contributes a portion of revenue to reserve accounts, from which funds can be drawn upon when needed. Reserve accounts play an important role in long term financial planning. The benefits of having reserve accounts for infrastructure are as follows: Provides a buffer for unexpected expenditures Accumulation of funding for significant future infrastructure investments The Township of Russell s budget includes contributions to reserves, primarily for lifecycle replacement of assets, future capital projects, and contingencies. DEBENTURE Debenture financing involves taking out a loan to fund infrastructure needs at a fixed interest rate. It is a long term debt that is paid back over time according to a fixed payment schedule. Both corporations and governments frequently issue this type of bond in order to secure capital.
61 56 USER FEES User fees are levies charged to the users of a good or service. A rate is typically used to determine the user fees, which may or may not be based on full cost recovery. DEVELOPMENT CHARGES Development charges are fees collected from developers to help fund growth related capital infrastructure. Development charges are used by most municipalities in Ontario to ensure that the cost to provide infrastructure in new developments is not passed on to existing residents through higher property taxes. The Development Charges Background Study determines the appropriate charges to apply for new developments. PUBLIC PRIVATE PARTNERSHIPS The Public Private Partnership program, P3 Canada, is a federally funded program that aims to improve the delivery of infrastructure with contracts between the public sector and private parties. Public private partnerships are a long term approach to developing infrastructure that enhances the accountability of the private sector for infrastructure assets over their expected service lives. The private party assumes responsibility for the design, construction, financing and operation of the infrastructure. The public sector repays the operating and capital expenditures to the private party throughout the life of the infrastructure. This allows for a significant portion of the risk associated with infrastructure development to be passed over to the private party. Public private partnerships are not the right solution for all infrastructure developments; however they can provide many benefits when applied to the right projects. FINANCING STRATEGY FEDERAL GAS TAX The Federal Gas Tax Fund (GTF) provides predictable, long term funding for municipalities to help build and revitalize infrastructure. Funding is provided twice a year to provinces and territories who then distribute this funding to their municipalities. Municipalities can pool, bank and borrow against this funding. Currently, federal GTF can be used for the following: PUBLIC TRANSIT wastewater infrastructure drinking water solid waste management community energy systems LOCAL ROADS AND BRIDGES capacity building HIGHWAYS local and regional airports short-line rail short-sea shipping disaster mitigation broadband and connectivity brownfield redevelopment culture tourism sport recreation
62 57 GRANTS/RECOVERIES This Asset Management Plan is intended to be used as a tool during capital grant application processes. Although grants may become available in the future, the sustainable funding plan cannot rely on awarded grants in order to balance the funding needs. TAXATION Property taxes are levies on a property which are issued by the governing municipality in which the property is located. Two components make up the property tax calculation for Ontario Municipalities: The annual operating expenditure to provide services to residents; and The total current market value of the assessment base (property) over which the operating expenditure is to be recovered. The tax rate is determined by divided the annual operating expenditure by the total assessment value. FINANCING STRATEGY 5.4 NEXT STEPS After identifying the Township of Russell s infrastructure funding gaps and the available funding strategies/sources, it is recommended that the Township determine the appropriate strategy (strategies) going forward to fund the identified gaps. It is also recommended that the Township seek approval to adopt this Asset Management Plan in principle, as a sustainable strategy. It is understood that annual funding will still be subject to the annual budget approval process. The Township should continue to develop its infrastructure inventory in GIS. This will allow the Township to view where various infrastructure assets are located in relation to each other. The benefit of incorporating GIS with Asset Management Planning is that future projects will be able to be combined based on location, and as such lower costs. For example, the resurfacing of a road segment will be combined with the replacement of the respective sewer main. This Asset Management Plan should be updated when regular inspections are completed and when conditions are re-assessed; every two years for bridges, every three years for roads and at least every five years for other infrastructure. Asset management is a cost effective measure to help optimize investments, create long-term savings, and better manage infrastructure risks. The ten-year action plan has been developed with the goal of further enriching the Township s holistic and progressive approach to asset management. The implementation of this Asset Management Plan will assist the Township of Russell in making informed decisions to meet the desired levels of service, reduce overall risk and improve the infrastructure over the ten year timeframe of the plan.
63 Appendix A Asset Inventory
64 ABOUT US WSP is one of the world s leading professional services firm, working with governments, businesses, architects and planners and providing integrated solutions across many disciplines. The firm provides services to transform the built environment and restore the natural environment, and its expertise ranges from environmental remediation to urban planning, from engineering iconic buildings to designing sustainable transport networks, and from developing the energy sources of the future to enabling new ways of extracting essential resources. It has approximately 15,000 employees, mainly engineers, technicians, scientists and architects, as well as various environmental experts, based in more than 300 offices, across 35 countries, on every continent. Head office WSP Canada Inc René-Lévesque Blvd West, Floor 16 Montréal (Québec) H3H 1P9 Phone Fax

65 TOWNSHIP OF RUSSELL ASSET MANAGEMENT PLAN WATER / WASTEWATER JUNE 2017 WSP 100 Commerce Valley Drive West Thornhill, ON L3T 0A1 Contact: Kevin Morawski kevin.morawski@wspgroup.com Phone
66
67 CONTENTS EXECUTIVE SUMMARY... 1 INTRODUCTION Background Purpose Development of an Asset Management Plan Relationship to other Planning Documents 9 STATE OF THE LOCAL INFRASTRUCTURE Inventory of Assets Asset Value Asset Condition Next Steps 14 EXPECTED LEVELS OF SERVICE Minimum Regulatory Requirements Levels of Service by Asset Category Next Steps 28 ASSET MANAGEMENT STRATEGY Planned Action Strategies Analysis of Planned Actions Asset Life Cycle Treatments Inflation Procurement Overview of Risks Next Steps 43 FINANCING STRATEGY Expenditure Forecasts Expenditure History vs Forecasts Funding Strategy Next Steps 56
68 CONTENTS LIST OF TABLES Table 2-1 PSAB 3150 vs. Asset Management 10 Table 2-2 Asset Condition Rating Scale 12 Table 2-3 Condition Rating and Grade 12 Table 2-4 Average Water Distribution Asset Condition 13 Table 2-5 Average Sanitary Sewer Condition 13 Table 2-6 Average Pumping Station Condition 14 Table 2-7 State of Local Infrastructure Next Steps 15 Table 3-1 Minimum Regulatory Requirements 26 Table 3-2 Level of Service Performance Measures Success Scoring 27 Table 3-3 Level of Service Performance Measures for Water Distribution 27 Table 3-4 Level of Service Performance Measures for Wastewater Collection 28 Table 4-1 Recommended Lifecycle Treatments for Water Distribution 38 Table 4-2 Recommended Lifecycle Treatments for Wastewater Collection 39 Table 4-3 Recommended Lifecycle Treatments for Pumping Stations 39 Table 4-4 Risk Likelihood Rating Scale 40 Table 4-5 Risk Severity Rating Scale 41 Table 4-6 Risk Levels 41 Table 4-7 Average Asset Category Risk 42 Table 5-1 Ten Year Needs by Infrastructure Category (in thousands of dollars) 51 Table 5-2 Ten Year Needs by Planned Action Strategy (in thousands of dollars) 52 Table 5-3 Annual Expenses for Water and Wastewater 54
 37 Figure 4-2 Asset Ownership Lifecycle 38 Figure 4-4 Risk Classification Chart 42 Figure 5-1 Ten Year Needs by")
69 CONTENTS LIST OF FIGURES Figure 1-1 Typical Asset Management Framework 8 Figure 2-1 Total Replacement Values (2014) by Asset Category 11 Figure 4-1 Small but Timely Renewal Investments Save Money (Figure 1, Ministry of Infrastructure, Guide for Municipal Asset Management Plans ) 37 Figure 4-2 Asset Ownership Lifecycle 38 Figure 4-4 Risk Classification Chart 42 Figure 5-1 Ten Year Needs by Planned Action Strategy 52 Figure 5-2 Water and Wastewater Systems 10-Year Investment Requirements 53 APPENDICES Appendix A Asset Inventory
70

71 EXECUTIVE SUMMARY
72
73 1 EXECUTIVE SUMMARY WSP was retained to undertake the development of a comprehensive asset management plan that the Township of Russell (Township) can utilize to assist with decisions regarding the building, operating, maintaining, renewing, replacing, disposing and funding of their water and wastewater infrastructure assets. This asset management plan was prepared in accordance with the Ontario Ministry of Infrastructure s, Guide for Municipal Asset Management Plans and has been structured based on the following sections. 1. Executive Summary 2. Introduction 3. State of Local Infrastructure 4. Expected Levels of Service 5. Asset Management Strategy 6. Financing Strategy The scope of this project encompasses only the Water and Wastewater infrastructure owned and operated by the Township of Russell. The Township s linear infrastructure consists of approximately 65 km of watermains, and 40 km of sanitary sewers. Additionally, there are 8 Pumping stations, 2 Water Treatment Plants, 3 elevated towers, 1 reservoir, and 2 lagoons. Asset condition was established for the Township of Russell s infrastructure based on the age and expected life of each asset. However, condition information documented by Township staff and inspection reports (e.g., Russell Water and Wastewater Systems Condition Assessment Report, WSP, 2014) was used when available. Furthermore, an assessment of risk was undertaken to determine the priority of works associated with the Township s infrastructure. Full life cycle investments for maintenance, rehabilitation, renewal and replacement needs were applied over a 10-year planning period from 2017 to The capital projects for the Township projected over the 10-year planning period include: EXECUTIVE SUMMARY
74 2 Table 0-1 Water System Needs Immediate Needs (0 years) 2017 Short Term Needs (1 to 2 years) Medium Term Needs (3 to 5 years) Long Term Needs (6 to 10 years) Facility Identified Need Year Cost (2016 CAD) - Pumping station radio 2017 $25,000 - Replacement utility van 2017 $75,000 - Pumping station radio 2017 $25,000 - Russell water tower study 2017 $25,000 - Valve replacement 2017 $40,000 - Water leak detection 2017 $20,000 - Water meter replacement 2017 $500,000 Total 2017 $710,000 Total Immediate $710,000 Embrun Booster Station Protect insulation around perimeter foundation wall 2018 $2,000 Russell ET Grout crack along tower section 2018 $1,000 Total 2018 $3,000 Russell WTP Resurface & repaint structural steel (pre-eng bldg.) 2019 $4,000 Total 2019 $4,000 Total Short-Term $7,000 Embrun Booster Station Seal floor cracks 2020 $2,000 Marionville ET Seal crack along tower section 2020 $8,000 Total 2020 $10,000 Embrun ET Replace I&C / SCADA equipment 2021 $31,000 Marionville ET Replace I&C / SCADA equipment 2021 $31,000 Russell WTP Replace missing floor tiles 2021 $2,000 Russell WTP Replace I&C / SCADA equipment 2021 $104,000 Embrun Booster Station Replace mixer stand baseplates 2021 $1,000 Total 2021 $169,000 - Valve replacement allowance 2022 $941,100 Total 2022 $941,100 Total Medium-Term $1,120,100 - Valve replacement allowance 2023 $391,700 Total 2023 $391,700 - Valve replacement allowance 2024 $1,487,900 Total 2024 $1,487,900 Embrun Booster Station Replace I&C / SCADA equipment 2025 $104,000 Total 2025 $104,000 Total Long-Term $1,983,600 EXECUTIVE SUMMARY
75 3 Table 0-2 Wastewater System Needs Immediate Needs (0 years) 2017 Short Term Needs (1 to 2 years) Medium Term Needs (3 to 5 years) Long Term Needs (6 to 10 years Facility Identified Need Year Cost (2016 CAD) Embrun SPS 4 Replace I&C / SCADA equipment 2017 $21,000 Embrun SPS 4 Replace process piping and pumps 2017 $31,000 Embrun SPS 4 Install new grating in the wet well 2017 $21,000 Embrun SPS 5 Rebuild pumps every 10 years 2017 $10,000 Embrun SPS 7 Resurface and repaint electrical enclosure 2017 $1,000 Embrun SPS 7 Replace pumps 2017 $10,000 Russell Lagoon Replace corroded anchor bolts and plates holding down alum tanks 2017 $1,000 Total 2017 $95,000 Total Immediate $95,000 - Facility repair allowance 2018 $20,000 Total 2018 $20,000 Embrun SPS 1 Repair odour control stack, install condensate drain 2019 $1,000 Embrun SPS 1 Replace dry well exhaust fan 2019 $1,000 Embrun SPS 1 Replace roof membrane 2019 $10,000 Embrun SPS 3 Replace Pumps 2019 $42,000 Russell Lagoon Reseal concrete knocked out of slab at location where alum lines enter building 2019 $1,000 Russell Lagoon Clean and paint floor grating with rust protective paint 2019 $1,000 Russell Lagoon Replace chemical feed pumps 2019 $6,000 Total 2019 $62,000 Total Short-Term $82,000 Embrun SPS 2 Replace I&C / SCADA equipment 2021 $31,000 Embrun SPS 3 Replace I&C / SCADA equipment 2021 $31,000 Embrun Lagoon Sludge removal of Cell $208,000 Total 2021 $270,000 Embrun SPS 7 Replace I&C / SCADA equipment 2022 $21,000 Embrun Lagoon Replace blowers 2022 $78,000 Embrun Lagoon Sludge removal of Cell $208,000 - Sewer replacement allowance 2022 $120,000 Total 2022 $427,000 Total Medium-Term $697,000 Embrun SPS 5 Replace I&C / SCADA equipment 2023 $31,000 Embrun SPS 5 Replace generator 2023 $21,000 Embrun Lagoon Sludge removal of Cell $208,000 Total 2023 $260,000 Embrun SPS 1 Replace generator 2024 $105,000 Embrun SPS 1 Replace I&C / SCADA equipment, incl. flowmeter 2024 $52,000 Embrun SPS 1 Replace pumps 2024 $104,000 EXECUTIVE SUMMARY
76 4 Embrun Lagoon Sludge removal of Cell $208,000 Total 2024 $469,000 Russell SPS 2 Replace I&C / SCADA equipment 2025 $52,000 Embrun Lagoon Sludge removal of Cell $208,000 Total 2025 $260,000 Russell SPS 1 Replace I&C / SCADA equipment 2026 $104,000 Embrun Lagoon Sludge removal of Cell $208,000 Russell Lagoon Replace I&C / SCADA equipment 2026 $21,000 Total 2026 $333,000 Embrun SPS 5 Rebuild pumps every 10 years 2027 $10,000 Embrun SPS 7 Replace pumps 2027 $10,000 Russell Lagoon Sludge removal of Cell A 2027 $208,000 - Sewer replacement allowance 2027 $120,000 Total 2027 $348,000 Total Long-Term $1,670,000 EXECUTIVE SUMMARY In addition to the projects listed in the above tables, a $30,000 annual allowance for watermain breaks and separate hydrant replacement program have been recommended for the water system, as well as $165,000 annually in reserve contributions for the eventual Ottawa feedermain replacement. For the wastewater system, costs not included in the above table include a $32,000 annual sewer flushing program. These costs have been included in Table 5-1 and Table 5-2, summarizing the total 10-year program costs. Finally, yearly expenditure forecasts were summarized to determine the annual average investment required for infrastructure sustainability. The projected infrastructure investment needs were compared to the Township s historical expenditures to identify potential funding gaps or surpluses. Next steps have been provided at the end of each section to elaborate on how the Township can continue to develop and update this Asset Management Plan in the future. A brief summary of the next steps is provided in Table 0-3.
77 5 Table 0-3 Summary of Next Steps SECTION State of the Local Infrastructure Expected Levels of Service Asset Management Strategy Financial Strategy NEXT STEPS Recompile / replace the asset inventory. The existing inventory was maintained for legacy reasons and augmented insofar as was possible, but the current structure does not provide the granularity nor the asset information to support focused asset management initiatives. Current asset entries are largely summarized at a process level, with insufficient details available to permit further discretization. Facilities capital recommendations for this report were based on the results from a relatively recent condition assessment project, but the corresponding inventory was again found insufficient for the Township s needs moving forward. Conduct condition assessments: Thermographic inspection of electrical, SCADA, generators. These assets are approaching the end of their service lives, but are often known to last significantly longer. A thermographic inspection will establish a performance baseline, identify hot spots for immediate intervention, and establish a justifiable program for interventions. Mechanical systems, including process piping and valves, in the Russell and Embrun WTP sites. Per the process group estimated service lives, these systems are coming due for replacement in 2034 and 2035, respectively, and their condition should be reassessed to ascertain whether this intervention is necessary or the extent of work required to maintain the systems in good working order. Track values for technical performance measures each year Conduct detailed risk assessments Establish project prioritization framework Track ongoing expenditures and their impact / efficacy A separate financial strategy has been prepared for the Township, and should be considered to take precedence over this document. EXECUTIVE SUMMARY The following pages summarize the findings of this Asset Management Plan.
78

79 WATER AND WASTEWATER INFRASTRUCTURE 6 CONDITION CONDITION TARGET AVERAGE CONDITION SCORE B CONDITION RATING WATERMAINS A- SANITARY SEWERS A SERVICES (W/WW) B APPURTENANCES A- FACILITIES B- SCORE LEVELS OF SERVICE B All new subdivisions are to be serviced by communal water and sewage systems. Growth in the rural areas of the municipality will continue on private wells. The existing water treatment and distribution system should satisfy the required demand including fire protection and community. The existing sanitary collection and treatment system should likewise be capable of meeting the required demands. RISK QUICK FACTS 65 Kilometers of Watermains 40 Kilometers of Sanitary Sewers 24 Average age of Watermains and Sanitary Sewers in Years EXECUTIVE SUMMARY RISK RATING RISK LEVEL WATERMAINS 4.8 Low SANITARY SEWERS 3.3 Low SERVICES (W/WW) 2.5 Low APPURTENANCES 8.2 Medium FACILITIES 8.8 Medium CURRENT LEVEL OF SUSTAINABLE FUNDING $966k
80
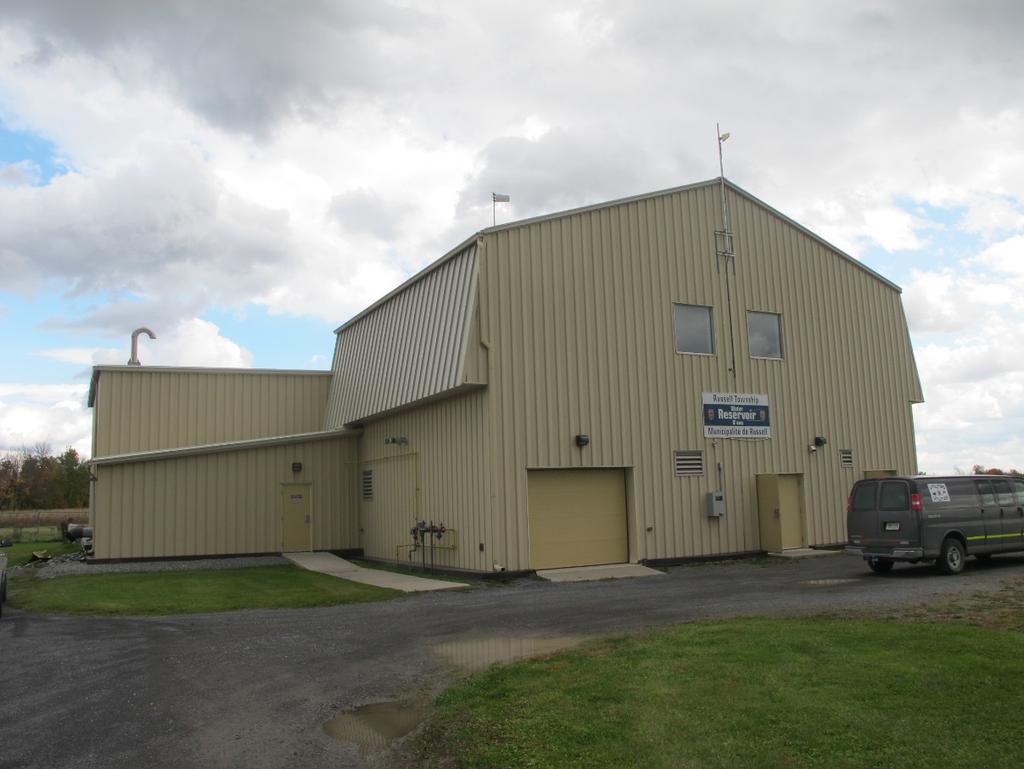
81 INTRODUCTION
82
83 7 INTRODUCTION The Township of Russell is a lower tier municipality within the United Counties of Prescott Russell, located Southeast of Ottawa. There are four urban communities within the Township s boundaries: Embrun, Russell, Marionville and Limoges. Based on the Township s PSAB database, the water and wastewater systems consist of approximately 65 km of watermains and 40 km of sanitary sewers. There is one water booster station (located in Russell), a reservoir and booster station (located between Russell and Embrun), three elevated tanks (in Russell, Embrun, and Marionville), eight sewage pumping stations (two in Russell and six in Embrun), two water treatment plants and two sewage lagoon treatment facilities. INTRODUCTION 1.1 BACKGROUND The Ontario Ministry of Infrastructure s, Building Together: Guide for Municipal Asset Management Plans (June 2011), indicates that any municipality seeking provincial infrastructure funding must demonstrate how its proposed project fits within a detailed asset management plan. This helps to ensure that limited resources are directed to the most critical needs. WSP was retained to undertake the development of a Water / Wastewater asset management plan that the Township of Russell (Township) can use to guide decisions related to the management of their water and wastewater infrastructure assets. This asset management plan is structured in accordance with the Ontario Ministry of Infrastructure s, Guide for Municipal Asset Management Plans. 1.2 PURPOSE The objective of this Asset Management Plan is to provide a strategic document that will guide decisions related to how the Township s water and wastewater infrastructure (both linear and vertical) will be managed to most efficiently and effectively allocate resources in a manner that will meet the Township s desired levels of service in the lowest overall lifecycle costs. This Plan identifies the costs and benefits of infrastructure investment decisions across the organizations asset portfolio. To demonstrate the impact of investment decisions, target Levels of Services were set so that performance against these targets could be measured. A Financial Plan is also included in this document which shows how current levels of investment are measuring up against the asset needs. This plan will help to demonstrate the impacts of investment decisions across the organization. It ultimately provides a ten (10) year capital needs forecast based on recent condition assessment information, from 2017 to 2026, and makes recommendations for how the Township may advance its asset management programme moving forward.
84 8 1.3 DEVELOPMENT OF AN ASSET MANAGEMENT PLAN This Asset Management Plan only documents the asset management strategy for the core public Water and Wastewater systems. A separate Asset Management Plan is being prepared for the Township s Roads, Bridges, and Storm Water assets; another for the Recreational Facilities. Future government funding of infrastructure projects will be contingent on asset management plans and therefore these asset categories were selected as a starting point for Asset Management within the Township of Russell to match with potential future funding programs. It is highly recommended that the Township consider future integration of Asset Management Plans to promote consideration of mutual needs, infrastructure interdependencies, and avoidance of institutional siloing. While the previous Plan documented all of the Township s infrastructure categories, it had two major deficiencies. First, the condition rating assigned to infrastructure asset systems was a blend of theoretical asset condition based on age and a theoretical annual investment calculated using assumed economic Service Life Spans for infrastructure that were consistent with the actual engineering Service Lives. This produced inaccurately poor infrastructure condition scores. The second deficiency was that, though an annual cost was identified for the plan, no actual infrastructure investments were identified. This document looks at a 10-year planning horizon from 2017 to 2026 but should be re-evaluated on a five year basis. This Asset Management Plan has been developed so that regular updates can be made to reflect the Township s changing needs and funding availability. Below is a typical asset management framework as presented in the International Infrastructure Management Manual. It outlines the relationship between the processes and procedures being presented in this Plan. Figure 1-1 Typical Asset Management Framework INTRODUCTION Asset management is the philosophy of actively managing infrastructure with the intention of achieving a specific objective; in this case, delivering the Township s services at the lowest lifecycle cost. This Plan should not be a standalone document that will simply be updated every five years; it is an iteration of a continually-evolving framework for best management of the Township s infrastructure, to be
85 9 integrated into day-to-day operations and reviewed on an annual basis. Although certain principles of asset management such as Condition Assessment, Levels of Service and Capital Planning are addressed within this document, these are high level approaches and assessments that are to be refined as the Township s asset management program grows. This asset management plan will require on-going and continual work to ensure its success. On-going work or next steps to the refinement of the asset management strategy are presented at the end of each section. 1.4 RELATIONSHIP TO OTHER PLANNING DOCUMENTS This Asset Management Plan relied upon other targeted planning documents in developing the overall asset strategy. This document has already drawn upon the valuable work completed under other planning documents such as: Water and Wastewater Systems Condition Assessment, WSP (2015) Russell Master Plan Phases 1 & 2, Stantec (2004) Russell Master Plan Update, WSP (2016) Asset Management Plan, Public Sector Digest (2013) Russell TCA by Department, Russell Township (2016) Other internally developed planning resources INTRODUCTION
86

87 STATE OF THE LOCAL INFRASTRUCTURE
88
89 10 STATE OF THE LOCAL INFRASTRUCTURE 2.1 INVENTORY OF ASSETS Key asset inventory information including location, size, length, material and other attribute information is displayed in the inventory of assets. PSAB 3150 VS ASSET MANAGEMENT Effective January 1, 2009, the Public Sector Accounting Board s (PSAB) Rules on Tangible Capital Assets (PS3150) required that local governments record their Tangible Capital Assets on the statement of financial position and amortize them over their useful lives, moving all governments to a universal full accrual accounting system. In order to comply with this directive, municipalities across Ontario needed to develop an inventory of all of their infrastructure assets, along with an assumed replacement cost. PSAB 3150 provides accounting information for tangible capital assets (TCA) using historical cost valuation. An asset management plan needs to provide the financial information and timing associated with future replacements, rehabilitations, disposals, expansions and maintenance for the tangible capital assets. Table 2-1 summarizes key differences between PSAB 3150 and asset management. Table 2-1 PSAB 3150 vs. Asset Management STATE OF THE LOCAL INFRASTRUCTURE Use Valuation Procedure Reporting PSAB 3150 To inventory TCAs and provide valuations Amortize costs of assets Use assumed economic service life to determine asset amortization Audited Financial Statements, Financial Information Returns ASSET MANAGEMENT To inventory TCAs and provide a long term, sustainable services Project future costs (taking into account inflation) of assets Use condition and risk to determine asset needs Asset Management Plans The foundational information used in the development of this Asset Management Plan was based on the Township s 2016 PSAB 3150 data. This information was augmented by the 2015 Condition Assessment of the Township s Water and Wastewater infrastructure, prepared by WSP. Where more recent data meeting the requirements of this plan was available, best efforts were made to incorporate the newer data.

90 ASSET VALUE The estimated life expectancy of each asset type and current year (2016) replacement value are both listed in the inventory of assets. The life expectancy and assumed replacement values used in this plan are based on the replacement values assigned to each asset under the previous PSAB 3150 compliance exercise and subsequent condition assessment. The life expectancies are based on a number of factors, including industry accepted standards, engineering best practice, and local experience by Township of Russell Staff. While the PSAB 3150 values were escalated forward to 2016 at a rate of 3% per year to determine the 2016 replacement cost, this is an approximation of the actual costs that may be incurred due to changes in technology, designs, and even infrastructure requirements. The total current year (2016) replacement costs for each asset category are displayed in Figure 2-2. Figure 2-1 Total Replacement Values (2014) by Asset Category STATE OF THE LOCAL INFRASTRUCTURE 2.3 ASSET CONDITION ASSET CONDITION RATING SCALE The condition of the linear assets (watermains and sewers) was established based on the age and expected life of each asset. For the vertical assets (pump stations, lagoons, etc.), the condition was established based on a theoretical deterioration of the asset condition as recorded in the previous condition assessment project. No field investigations were conducted as part of this assessment. Assets were assigned a condition rating of 1 to 5 based on the rating scale shown in Table 2-2.
91 12 Table 2-2 Asset Condition Rating Scale RATING DESCRIPTION DEFINITION & EST. INTERVENTION COST 1 Very Poor Requires asset replacement, replacement cost 2 Poor Required major rehabilitation, large dollar amount 3 Fair Minor maintenance, small dollar amount 4 Good No work required, no dollar amount, perform normal maintenance 5 Excellent No work required, no dollar amount It is important to undertake regular condition assessments of all infrastructure assets to establish a baseline that can be used to determine and prioritize capital projects. The field inspection work involved in a condition assessment provides an accurate representation of each asset s condition at that point in time. Please note that the condition ratings developed in this asset management plan have been assigned without undertaking field inspections and are therefore limited in accuracy. To complete future updates of the Asset Management Plan, it is recommended that the Township undertake regular condition assessments of its infrastructure and use maintenance records, local knowledge and CCTV records of piping to update condition ratings of buried infrastructure AVERAGE ASSET CATEGORY CONDITION The Township of Russell s average condition ratings for watermains, sanitary sewers, and vertical facilities are presented below. A letter grade corresponding to the average asset category condition has been assigned based on the breakdown provided in Table 2-3. Table 2-3 Condition Rating and Grade STATE OF THE LOCAL INFRASTRUCTURE CONDITION RATING GRADE A A A B B B C C C D D D-
92 13 WATER DISTRIBUTION The Township of Russell is responsible for the operation and maintenance of approximately 65 km of watermains, including 3,344 valves and 374 fire hydrants throughout the distribution system. There are no watermains that have surpassed their expected service life. The average condition of each type of water distribution asset and the overall condition rating for the Township of Russell s water distribution system are displayed in Table 2-4. Table 2-4 Average Water Distribution Asset Condition ASSET TYPE AVERAGE AGE (YEARS) EXPECTED SERVICE LIFE (YEARS) 2016 AVERAGE CONDITION RATING AVERAGE GRADE Hydrant * A- Valves * A- Water Services B Curb Stops B Watermain A OVERALL GRADE * The condition has been set based on the Township s annual maintenance program. All defective assets are replaced. A- STATE OF THE LOCAL INFRASTRUCTURE WASTEWATER COLLECTION The Township of Russell is responsible for the operation and maintenance of approximately 40km of sanitary sewers, including 262 maintenance holes throughout the system. There are no sanitary sewers that have surpassed their expected service life. The average condition of each type of wastewater collection asset and the overall condition rating for the Township of Russell s sanitary sewer system is displayed in Table 2-5. Table 2-5 Average Sanitary Sewer Condition ASSET TYPE AVERAGE AGE (YEARS) EXPECTED SERVICE LIFE (YEARS) 2016 AVERAGE CONDITION RATING AVERAGE GRADE Sanitary Sewer A+ Maintenance B Hole Lid Sanitary B Service OVERALL GRADE A FACILITIES The Township of Russell is responsible for the operation and maintenance of the following facilities:
93 14 WATER (6 total) 1. Embrun Water Tower 2. Marionville Water Tower 3. Russell Water Tower 4. Russell Reservoir 5. Russell WTP 6. Embrun WTP WASTEWATER (11 total) 1. Embrun SPS 1 2. Embrun SPS 2 3. Embrun SPS 3 4. Embrun SPS 4 5. Embrun SPS 5 6. Embrun SPS 7 7. Russell SPS 1 (old) 8. Russell SPS 1 (new) 9. Russell SPS Embrun Lagoon 11. Russell Lagoon The average condition of each type of pumping station and the overall condition rating for the Township of Russell s pumping stations are displayed in Table 2-6. Table 2-6 Average Pumping Station Condition PUMPING STATION TYPE AVERAGE AGE (YEARS) EXPECTED SERVICE LIFE (YEARS) 2016 AVERAGE CONDITION RATING AVERAGE GRADE Water B- Wastewater B- OVERALL GRADE B- STATE OF THE LOCAL INFRASTRUCTURE 2.4 NEXT STEPS The State of Local Infrastructure Report has been prepared based on the most complete data set for each asset category. The available datasets are based upon the Township s PSAB registry and refined with the results from previous condition assessment work. In future endeavors, we recommend that the Township complete a bottom up inventory of their facilities and equipment along with replacement cost estimates to better integrate enhanced PSAB reporting and maintenance management. The inventory for individual facilities should be refined during future condition assessments of the sites. This will ensure a more accurate representation of the state of the local infrastructure for future updates to this Asset Management Plan, and permit more detailed management of the Township s asset portfolio. Recommended work to the Township s facilities are presented in Table 2-7.
94 15 Table 2-7 State of Local Infrastructure Next Steps Wastewater Facility Identified Need Year Cost (2016 CAD) Embrun SPS 4 Replace I&C / SCADA equipment 2017 $21,000 Embrun SPS 4 Replace process piping and pumps 2017 $31,000 Embrun SPS 4 Install new grating in the wet well 2017 $21,000 Embrun SPS 5 Rebuild pumps every 10 years 2017 $10,000 Embrun SPS 7 Resurface and repaint electrical enclosure 2017 $1,000 Embrun SPS 7 Replace pumps 2017 $10,000 Russell Lagoon Replace corroded anchor bolts and plates holding down alum tanks 2017 $1,000 Total 2017 $95,000 Total Immediate $95,000 - Facility repair allowance 2018 $20,000 Total 2018 $20,000 Embrun SPS 1 Repair odour control stack, install condensate drain 2019 $1,000 Embrun SPS 1 Replace dry well exhaust fan 2019 $1,000 Embrun SPS 1 Replace roof membrane 2019 $10,000 Embrun SPS 3 Replace Pumps 2019 $42,000 Russell Lagoon Reseal concrete knocked out of slab at location where alum lines enter building 2019 $1,000 Russell Lagoon Clean & paint floor grating with rust protective paint 2019 $1,000 Russell Lagoon Replace chemical feed pumps 2019 $6,000 Total 2019 $62,000 Total Short-Term $82,000 Embrun SPS 2 Replace I&C / SCADA equipment 2021 $31,000 Embrun SPS 3 Replace I&C / SCADA equipment 2021 $31,000 Embrun Lagoon Sludge removal of Cell $208,000 Total 2021 $270,000 Embrun SPS 7 Replace I&C / SCADA equipment 2022 $21,000 Embrun Lagoon Replace blowers 2022 $78,000 Embrun Lagoon Sludge removal of Cell $208,000 - Sewer replacement allowance 2022 $120,000 Total 2022 $427,000 Total Medium-Term $697,000 STATE OF THE LOCAL INFRASTRUCTURE
95 16 Embrun SPS 5 Replace I&C / SCADA equipment 2023 $31,000 Embrun SPS 5 Replace generator 2023 $21,000 Embrun Lagoon Sludge removal of Cell $208,000 Total 2023 $260,000 Embrun SPS 1 Replace generator 2024 $105,000 Embrun SPS 1 Replace I&C / SCADA equipment including flowmeter 2024 $52,000 Embrun SPS 1 Replace pumps 2024 $104,000 Embrun Lagoon Sludge removal of Cell $208,000 Total 2024 $469,000 Russell SPS 2 Replace I&C / SCADA equipment 2025 $52,000 Embrun Lagoon Sludge removal of Cell $208,000 Total 2025 $260,000 Russell SPS 1 Replace I&C / SCADA equipment 2026 $104,000 Embrun Lagoon Sludge removal of Cell $208,000 Russell Lagoon Replace I&C / SCADA equipment 2026 $21,000 Total 2026 $333,000 Embrun SPS 5 Rebuild pumps every 10 years 2027 $10,000 Embrun SPS 7 Replace pumps 2027 $10,000 Russell Lagoon Sludge removal of Cell A 2027 $208,000 - Sewer replacement allowance 2027 $120,000 Total 2027 $348,000 Total Long-Term $1,670,000 STATE OF THE LOCAL INFRASTRUCTURE Water Facility Identified Need Year Cost (2016 CAD) - Pumping station radio 2017 $25,000 - Replacement utility van 2017 $75,000 - Pumping station radio 2017 $25,000 - Russell water tower study 2017 $25,000 - Valve replacement 2017 $40,000 - Water leak detection 2017 $20,000 - Water meter replacement 2017 $500,000 Total 2017 $710,000 Total Immediate $710,000
96 17 Embrun Booster Protect insulation around perimeter foundation wall 2018 $2,000 Russell ET Grout crack along tower section 2018 $1,000 Total 2018 $3,000 Russell WTP Resurface & repaint structural steel in pre-eng bldg 2019 $4,000 Total 2019 $4,000 Total Short-Term $7,000 Embrun Booster Seal floor cracks 2020 $2,000 Marionville ET Seal crack along tower section 2020 $8,000 Total 2019 $10,000 Embrun ET Replace I&C / SCADA equipment 2021 $31,000 Marionville ET Replace I&C / SCADA equipment 2021 $31,000 Russell WTP Replace missing floor tiles 2021 $2,000 Russell WTP Replace I&C / SCADA equipment 2021 $104,000 Embrun Booster Replace mixer stand baseplates 2021 $1,000 Total 2021 $169,000 - Valve replacement allowance 2022 $941,000 Total 2022 $941,100 Total Medium-Term $1,120,100 - Valve replacement allowance 2023 $391,700 Total 2023 $391,700 - Valve replacement allowance 2024 $1,487,900 Total 2024 $1,487,900 Embrun Booster Replace I&C / SCADA equipment 2025 $104,000 Total 2025 $104,000 Total Long-Term $1,879,600 STATE OF THE LOCAL INFRASTRUCTURE In addition to the projects listed in the above tables, a $30,000 annual allowance for watermain breaks and a separate hydrant replacement program have been recommended for the water system, as well as $165,000 annually in reserve contributions for the eventual Ottawa feedermain replacement. For the wastewater system, costs not included in the above table include a $32,000 annual sewer flushing program. These costs have been included in Table 5-1 and Table 5-2, summarizing the total 10-year program costs.

97 EXPECTED LEVELS OF SERVICE
98
99 26 EXPECTED LEVELS OF SERVICE Levels of service are qualitative and quantitative descriptions of the Township s objectives for your infrastructure. They provide the means to measure affordability of the infrastructure and its management against infrastructure users needs and expectations. The asset management decisionmaking process is driven by the impact of the levels of service on citizens, communities and the natural environment. This section outlines the Township s desired levels of service for their water and wastewater linear and vertical infrastructure. EXPECTED LEVELS OF SERVICE 3.1 MINIMUM REGULATORY REQUIREMENTS As a minimum level of service, there are regulatory requirements associated with the Township s infrastructure that must be met. The regulatory requirements applicable to the Township are summarized in Table 3-1. These requirements are not being identified as a Level of Service since they are already a minimum target and therefore must be met by the Township. Table 3-1 Minimum Regulatory Requirements ASSET CATEGORY Water, Wastewater, Pumping Stations, Retention Ponds Facilities REGULATORY REQUIREMENTS Environmental Protection Act Ontario Water Resources Act, R.S.O Safe Drinking Water Act, 2002 Building Code Act, 1992 (Ontario Regulation 332/12) Accessibility for Ontarians with Disabilities Act (AODA) 3.2 LEVELS OF SERVICE BY ASSET CATEGORY The levels of service have been defined for each of the asset categories: Water Distribution System, Wastewater Collection System, and Facilities. Each level of service has been defined through technical performance measures. In order to actively track the Township s performance in meeting the desired levels of service, an assigned value will provide a means to measure the performance. The target values, existing values and target timeframes for each technical performance measure by asset category are listed in Table 3-3 to Table A letter grade has been assigned to indicate how well the Township is meeting their desired performance measures for each category. Table 3-2 outlines the Service Level Scoring.
100 27 Table 3-2 Level of Service Performance Measures Success Scoring GRADE A B C F GUIDELINES WATER DISTRIBUTION Currently meeting or exceeding performance level targets for the asset category Asset category is showing positive improvement in achieving Levels of Service targets by target timeframe Asset category is showing no improvement in achieving levels of Service Targets by target timeframe Actual Level of Service is trending away from Level of Service target LEVEL OF SERVICE: TO PROVIDE UNINTERRUPTED SERVICE OF CLEAN, POTABLE WATER EXPECTED LEVELS OF SERVICE Table 3-3 Level of Service Performance Measures for Water Distribution TECHNICAL PERFORMANCE MEASURE UNIT EXISTING VALUE TARGET VALUE TARGET TIMEFRAME (YEAR) CURRENTLY MEETING TARGET? Watermain breaks No/ 100km TBD TBD /yr Unplanned Repairs No/yr TBD TBD Percentage of valves annually cycled % 100* Average condition rating of watermains Average condition rating of water facilities * All road valves are operated annually. Any defective assets are replaced.
101 28 WASTEWATER COLLECTION LEVEL OF SERVICE: TO PROVIDE RELIABLE AND EFFICIENT WASTEWATER COLLECTION WITH A STRONG FOCUS ON THE PROTECTION OF THE ENVIRONMENT Table 3-4 Level of Service Performance Measures for Wastewater Collection TECHNICAL PERFORMANCE MEASURE Wastewater backups Percentage of sewers flushed annually Percentage of sewers CCTV d annually Average condition rating of sanitary sewers Average condition rating of wastewater facilities UNIT No/ 100km /yr EXISTING VALUE TARGET VALUE TARGET TIMEFRAME (YEAR) CURRENTLY MEETING TARGET? TBD TBD % TBD TBD % TBD TBD EXPECTED LEVELS OF SERVICE 3.3 NEXT STEPS It is recommended that the Township continue to track the values for the above technical performance measures on an annual basis, rather than on the same cycle as the asset management plan update, so that corrective actions can be implemented to achieve the target Levels of Service.
102

103 ASSET MANAGEMENT STRATEGY
104
105 ASSET MANAGEMENT STRATEGY 35 Infrastructure sustainability is dependent on activities such as maintenance, repairs, upgrades and replacements when necessary. The application of these activities relies heavily on the level of funding available and the effective allocation of that funding. To ensure recommended works are appropriately prioritized, an assessment of risk was undertaken to determine the urgency of the works associated with the Township s infrastructure. The asset management strategy outlines the planned action strategies and determines the risk for the Township s infrastructure assets. 4.1 PLANNED ACTION STRATEGIES Recommended works were classified based on six (6) planned action strategies: non-infrastructure solutions, maintenance activities, renewal/rehabilitation activities, replacement activities, disposal activities and expansion activities, as outlined in the Ministry of Infrastructure Ontario s, Guide for Municipal Asset Management Plans. A description of each strategy is outlined below. ASSET MANAGEMENT STRATEGY NON-INFRASTRUCTURE SOLUTIONS Non-infrastructure solutions produce lower costs for long-term asset sustainability. Cost and time savings are optimized by implementing an organizational approach for all infrastructure works. Important non-infrastructure solutions include implementation of an asset management plan and regular inspections of the various infrastructure assets. Results of inspections should be used to regularly update the asset management plan. Infrastructure should generally be inspected every five (5) years MAINTENANCE ACTIVITIES Maintenance is essential to managing infrastructure, as the expected level of service often relies on maintenance activities. Regular maintenance can also add significant life to assets. It is important that the Township of Russell schedule regular inspections of its assets to identify maintenance requirements. Annual maintenance expenditures for the Township s infrastructure have been estimated and incorporated into the final investment requirements. The Township should track the sufficiency and efficacy of its ongoing maintenance expenditures over time, and adjust as needs dictate RENEWAL / REHABILITATION ACTIVITIES Rehabilitation is necessary when an asset does not perform to its desired level of service. Significant repairs designed to extend the life of the asset are determined through regular inspections. Rehabilitation over replacement is advantageous when there are only a few components that need repair. Recommended renewal/rehabilitation activities are found in Section 6.1 and include, but are not limited to cleaning retention ponds and rehabilitations pumping stations and facilities.
106 REPLACEMENT ACTIVITIES Occasionally, the extent of damage or deterioration to an asset is too great and rehabilitation is deemed unfeasible. At this point, replacement is necessary. As an asset approaches the end of its service life, more frequent inspection may be necessary to determine if replacement of the asset is critical in the short-term, or if deferral of the asset replacement is possible. The recommended replacement activities within the 10-year planning period include, but are not limited to, the replacement of assets exceeding their service lives, and select facility assets according to their condition and assumed deterioration DISPOSAL ACTIVITIES Disposal costs are associated with the reduction of services or elimination of demands placed on systems. By establishing target levels of service, an organization can clearly determine whether or not infrastructure or particular assets are needed. For the Township of Russell s water and wastewater systems, no superfluous assets were identified. Asset disposal costs associated with infrastructure replacement activities are generally included with the estimates made for asset replacement. ASSET MANAGEMENT STRATEGY EXPANSION ACTIVITIES Expansion activities are required to extend services to previously un-serviced areas or to expand services to accommodate growth demands. The Township of Russell had a population of 16,180 in 2013, and is expected to grow to a population of 19,800 by the year 2023 (2015 Water & Wastewater Master Plan). While the 2004 Master Plan forecast a water shortage based on demands at the time, the 2015 Master Plan indicates that with the decrease in per capita water usage experienced since 2010, it is expected that current sources augmented with the supply capacity from Ottawa will be sufficient to service the forecasted growth. 4.2 ANALYSIS OF PLANNED ACTIONS An analysis of planned actions was used to determine the most effective strategy for managing the Township s infrastructure. The analysis compares two strategies for managing infrastructure; one with timely renewal investments, and one without timely investments. These two strategies are depicted in figure 4-1.
107 37 Figure 4-1 Small but Timely Renewal Investments Save Money (Figure 1, Ministry of Infrastructure, Guide for Municipal Asset Management Plans ) ASSET MANAGEMENT STRATEGY Implementing an annual maintenance program and completing timely renewal works will keep the infrastructure performing at the desired levels of service, and at the same time prolong the life of the infrastructure and reduce overall spending. Therefore, the most cost effective strategy for managing the Township s infrastructure is to perform annual maintenance and complete timely renewal works. Figure 4-2 summarizes the typical asset lifecycle needs that will promote a financially sustainable, long term forecast for the Township s water and wastewater infrastructure. After the recommended works have been identified to ensure each asset will perform at the desired level of service, the recommended works will be distributed over a 10-year planning period. The recommended works for the infrastructure will be distributed based on priority levels determined through the assessment of risk. Following the application of full life cycle investments for maintenance, rehabilitation, renewal and replacement needs, the projected reinvestment needs will be compared to the current annual capital budget to determine the adequacy of the funding for the sustainability of the infrastructure.
108 38 Figure 4-2 Asset Ownership Lifecycle ASSET MANAGEMENT STRATEGY 4.3 ASSET LIFE CYCLE TREATMENTS The following sections outline the assumptions made in determining the total costs to undertake the projected lifecycle treatments for each of the Township s water and wastewater assets WATER DISTRIBUTION SYSTEM Recommended lifecycle rehabilitation for the water distribution system has been included in Table 4-1. Table 4-1 Recommended Lifecycle Treatments for Water Distribution RECOMMENDED TREATMENT TIMING ESTIMATED COST Replacement of Watermains Replacement of Fire Hydrants Replacement of Valves Watermain Maintenance (Winterization of Hydrants, Watermain and hydrant flushing) End of Service Life (80-90 years) End of Service Life (60 years) End of Service Life (40 years) Annually Cost varies by diameter $360-$2,060 per meter $4,000 Cost varies by diameter and valve type (50mm-600mm) $2,500-$23,400 Negligible
109 WASTEWATER COLLECTION SYSTEM Recommended lifecycle rehabilitation for the wastewater collection system has been included in Table 4-2. Table 4-2 Recommended Lifecycle Treatments for Wastewater Collection RECOMMENDED TREATMENT TIMING ESTIMATED COST Replacement of Sanitary Sewers Sewer Maintenance (Flushing and Cleaning of Sewer) PUMPING STATIONS End of Service Life (80-90 years) Every 5 years Cost varies by diameter $270-$1,575 per meter $4,000 per km Recommended lifecycle rehabilitation for the pumping stations has been included in Table 4-3. Table 4-3 Recommended Lifecycle Treatments for Pumping Stations RECOMMENDED TREATMENT TIMING ESTIMATED COST Wastewater Pumping Station Replacement Water Pumping Station Replacement End of Service Life (Varies by system) End of Service Life (Varies by system) Cost varies by capacity $120,000 - $2,680,000 Cost varies by capacity $960,000 - $1,085,000 *Station Rehabilitation At 50% of Service Life ~15% of overall capital cost *Includes replacement of instrumentation and control equipment. ASSET MANAGEMENT STRATEGY 4.4 INFLATION The rehabilitation, renewal and replacement costs for the Township s infrastructure have been projected over a 10-year planning period from 2017 to Due to the uncertainty of annual inflation, present value (2016 CAD) has been utilized in all calculations. An estimated inflation rate of 3.0% per year can be applied to help assess rehabilitation costs in future years, but care should be taken and consideration given to conducting a sensitivity analysis when relying on this information for capital needs analyses. 4.5 PROCUREMENT Procurement is the act of obtaining goods, services or works from an external source. The Ministry of Infrastructure s Guide for Municipal Asset Management Plans recommends Municipalities have procurement by-laws in place to serve as a basis for considering various delivery mechanisms. Per the requirements of Section 270(1) of the Municipal Act, 2011, stipulating that municipalities are to adopt policies with respect to procurement of goods and services, the Township of Russell established Procurement Policy ADM/019 in 2004 (revised June 2007, and November 2009), as well as By-law # (passed June 2013), which establish the process for which goods and services are procured. The by-law has been subsequently amended in September 2015 with by-law # The intent of these policies and by-laws was to ensure competitive procurement and transparency to the public. The
110 40 levels of service and the Township s ability to meet the associated targets and timeframes may be affected by any limitations of these by-laws. 4.6 OVERVIEW OF RISKS Understanding risks is important to the safety and functionality of the Township s infrastructure. An assessment of risk was undertaken in order to determine the priority of the works associated with the infrastructure. The recommended works were distributed over the 10-year planning period based on the priority determined through the risk assessment WSP completed as part of the previous condition assessment work. Below is a summary of the risk assessment approach, outlining how the assessment was carried out for the Township of Russell s infrastructure at a system level. Table 4-4 and Table 4-9 were used to assign likelihood and severity scores to the failure of each asset in order to derive system risk ratings. Table 4-4 Risk Likelihood Rating Scale LIKELIHOOD DESCRIPTION Rare Unlikely Possible Likely Very Likely The associated infrastructure is new (within warranty period) and therefore not expected to fail in the near future; or Condition rating of 5 ( Excellent ). The infrastructure is not new, but is still within the first quarter of its anticipated service life; or Condition of 4 ( Good ). The associated infrastructure is part way through its anticipated service life; or The asset has already been refurbished or rebuilt; or Condition Rating of 3 ( Fair ). The associated infrastructure is approaching the end of its life cycle and therefore it is expected to fail in the near future; or Condition Rating of 2 ( Poor ). The associated infrastructure has exceeded its life cycle and failure is considered imminent. Condition Rating of 1 ( Very Poor ). RATING ASSET MANAGEMENT STRATEGY
111 41 Table 4-5 Risk Severity Rating Scale SEVERITY DESCRIPTION RATING Insignificant Minor Moderate Major Catastrophic No disruption to normal operation, no environmental impact, no financial investment. Some manageable operation disruption, minor environmental impact, small financial investment; or Failure of a: fire hydrant small diameter watermain/valve (50-150mm), or sanitary sewer ( mm) Significant modification to normal operation but manageable, easy to mitigate environmental impact, moderate financial investment; or Failure of a: medium diameter watermain/valve ( mm), or sanitary sewer ( mm) Reduced production with inability to meet demand imminent, significant environmental impact, large financial investment; or Failure of a: large diameter watermain/valve ( mm), or sanitary sewer ( mm) pumping station (capacity<30l/s) Inability to meet demand, potential injury, severe environmental impact, significant financial investment; or Failure of a: very large diameter watermain/valve ( mm) or sanitary sewer ( mm) building, pumping station (capacity >30L/s) The risk score is determined as the product of the likelihood and severity ratings assigned to the event. This value was then used to assign priorities to the recommended works. Three risk levels were defined, based on the risk score of the particular event. These are shown in Table 4-6 and illustrated in Figure 4-4. Table 4-6 Risk Levels ASSET MANAGEMENT STRATEGY RISK = LIKELIHOOD X SEVERITY LEVEL ASSOCIATED RESPONSE 1 4 Low Acceptable 5 14 Medium Review and Address High Action Required
112 42 Figure 4-3 Risk Classification Chart ASSET MANAGEMENT STRATEGY AVERAGE ASSET CATEGORY RISK The recommended works were prioritized in order to minimize the Township s overall average risk level over the 10-year planning period. The average risk ratings for the Township of Russell s infrastructure by asset category are presented in Table 4-7. Table 4-7 Average Asset Category Risk ASSET CATEGORY Buried Infrastructure Facilities TYPE 2016 AVERAGE RISK RATING AVERAGE LEVEL Watermains 4.0 Low Sanitary Sewers 2.8 Low Water 14.0 Medium Wastewater 11.9 Medium OVERALL LEVEL
113 NEXT STEPS It is recommended that a more detailed risk assessment be undertaken for the Township s infrastructure through future asset management planning activities to refine the results of the high level risk analysis performed under this study. In addition to enhancing the risk assessment, it is recommended that the Township establish formal integrated project prioritization frameworks to assist in capital planning and risk management between asset categories / classes. It is important to concurrently track the efficacy / impact of ongoing expenditures to validate or refine the investment strategy. ROSTER CATEGORY: ##
114

115 FINANCING STRATEGY
116

117 FINANCING STRATEGY 51 Note that a more detailed financial strategy has been prepared for the Township s water and wastewater asset categories. That document has been derived using the information presented herein. 5.1 EXPENDITURE FORECASTS FINANCING STRATEGY YEAR INVESTMENT NEEDS BY ASSET CATEGORY Based on approaches to asset lifecycle investments, including installation, maintenance and replacement at the end of service life, 10-year asset needs profiles have been created for the asset categories. The forecasted needs do not include the costs associated with staffing or the staffing growth requirements to meet the future infrastructure needs, nor does it include any expansion or upgrades that may be necessary to meet a growing demand on the infrastructure. A summary of the 10-year asset needs (in thousands of dollars, 2016 CAD) is included in Table 5-1. Table 5-1 Ten Year Needs by Infrastructure Category (in thousands of dollars) ASSET CATEG ORY Watermains $50 $30 $30 $30 $30 $30 $30 $30 $30 $30 Valves $0 $0 $0 $0 $0 $941 $392 $1,488 $0 $0 Hydrants $552 $27 $754 $11 $5 $15 $19 $0 $24 $14 Water $690 $3 $4 $10 $169 $0 $0 $0 $104 $0 Facilities Sanitary $32 $32 $32 $32 $32 $152 $32 $32 $32 $32 Sewers Wastewater $95 $20 $62 $0 $270 $307 $260 $469 $260 $333 Facilities Total (2016 CAD, 000) $1,419 $112 $882 $83 $506 $1,445 $733 $2,019 $450 $ YEAR INVESTMENT NEEDS BY PLANNED ACTION STRATEGY A summary of the recommended works categorized by the previously defined planned action strategies over the next 10-year period (in thousands of dollars, 2016 CAD) is included in Table 5-2. This forecast will assist Township staff in planning for the expenses associated with replacement, maintenance, rehabilitation and expansion of the Township s infrastructure.
118 52 Table 5-2 Ten Year Needs by Planned Action Strategy (in thousands of dollars) PLANNED ACTION STRATEG Y Maintenance Activities Renewal / Rehabilitation Activities Replacement Activities Expansion Activities Total (2016 CAD, 000) $82 $62 $62 $62 $62 $182 $62 $62 $62 $62 $- $3 $4 $10 $202 $200 $200 $200 $200 $200 $1,337 $48 $816 $12 $242 $1,063 $471 $1,757 $188 $ $1,419 $112 $882 $83 $506 $1,445 $733 $2,019 $450 $409 FINANCING STRATEGY Figure 5-1 Ten Year Needs by Planned Action Strategy
119 EXPENDITURE HISTORY VS FORECASTS WATER AND WASTEWATER The recommended annual maintenance investment for the water and wastewater systems is approximately $62,000. The current annual sustainable infrastructure investment projected for the water and wastewater systems is approximately $834,000. The projected annual expenditures over the 10-year planning period are summarized in Figure 5-2. Figure 5-2 Water and Wastewater Systems 10-Year Investment Requirements FINANCING STRATEGY The Township s average expenditure for the water and wastewater systems between the years of 2013 to 2017 is $434,271. The breakdown of the yearly expenses is presented in Table 5-3.
120 54 Table 5-3 Annual Expenses for Water and Wastewater CATEGORY PROPOSED BUDGET AVERAGE ( ) Water (capital) - $29,686 $1,024,688 $137,000 $100,000 $258,275 Wastewater (capital) - - $398,730 $181,500 $92,000 $134,446 Water (operation) - $126,321 $19,427 - $30,000 $35,150 Wastewater (operation) $32,000 $6,400 Average Annual Expenditure $434,271 FINANCING STRATEGY The difference between the forecasted annual sustainable investment and the existing average annual investment is $289,499, however this does not represent a gap in funding. The historical investments made reflect a fully funded system, therefore it is anticipated that future investments will reflect the actual future needs as well. 5.3 FUNDING STRATEGY A full cost recovery Financial Plan has been completed for the Township that should be considered to take priority over the findings of this AMP. The Financial Plan is based on the capital plan defined in this AMP, with more detail placed in the analysis REVENUE SOURCES Several sources of funding are available to the Township of Russell to support the sustainable infrastructure investments over the next ten years. Typical funding sources are outlined below for discussion purposes however, funding of the sustainable infrastructure plan will be further determined through other studies to be undertaken by the Finance and Budget Departments. RESERVE ACCOUNTS The Township currently contributes a portion of revenue to reserve accounts, from which funds can be drawn upon when needed. Reserve accounts play an important role in long term financial planning. The benefits of having reserve accounts for infrastructure are as follows: Provides a buffer for unexpected expenditures Accumulation of funding for significant future infrastructure investments DEBENTURE Debenture financing involves taking out a loan to fund infrastructure needs at a fixed interest rate. It is a long term debt that is paid back over time according to a fixed payment schedule. Both corporations and governments frequently issue this type of bond in order to secure capital.
121 55 USER FEES User fees are levies charged to the users of a good or service. A rate is typically used to determine the user fees, which may or may not be based on full cost recovery. The Township currently charges a water and sewer user fee at a rate dependent upon property type and cubic meter usage. The Township currently has 2,903 water connections. DEVELOPMENT CHARGES Development charges are fees collected from developers to help fund growth related capital infrastructure. Development charges are used by most municipalities in Ontario to ensure that the cost to provide infrastructure in new developments is not passed on to existing residents through higher property taxes. The Development Charges By-Law Number establishes the development charges applicable for the Township of Russell. FINANCING STRATEGY PUBLIC PRIVATE PARTNERSHIPS The Public Private Partnership program, P3 Canada, is a federally funded program that aims to improve the delivery of infrastructure with contracts between the public sector and private parties. Public private partnerships are a long term approach to developing infrastructure that enhances the accountability of the private sector for infrastructure assets over their expected service lives. The private party assumes responsibility for the design, construction, financing and operation of the infrastructure. The public sector repays the operating and capital expenditures to the private party throughout the life of the infrastructure. This allows for a significant portion of the risk associated with infrastructure development to be passed over to the private party. Public private partnerships are not the right solution for all infrastructure developments; however they can provide many benefits when applied to the right projects. FEDERAL GAS TAX The Federal Gas Tax Fund (GTF) provides predictable, long-term funding for municipalities to help build and revitalize infrastructure. Funding is provided twice a year to provinces and territories who then distribute this funding to their municipalities. Municipalities can pool, bank and borrow against this funding. Currently, federal GTF can be used for the following: public transit WASTEWATER INFRASTRUCTURE DRINKING WATER solid waste management community energy systems local roads and bridges capacity building highways local and regional airports short-line rail short-sea shipping disaster mitigation broadband and connectivity brownfield redevelopment culture tourism sport recreation
122 56 GRANTS/RECOVERIES This Asset Management Plan is intended to be used as a tool during capital grant application processes. Although grants may become available in the future, the sustainable funding plan cannot rely on awarded grants in order to balance the funding needs. TAXATION Property taxes are levies on a property which are issued by the governing municipality in which the property is located. Two components make up the property tax calculation for Ontario Municipalities: The annual operating expenditure to provide services to residents; and The total current market value of the assessment base (property) over which the operating expenditure is to be recovered. The tax rate is determined by divided the annual operating expenditure by the total assessment value. FINANCING STRATEGY 5.4 NEXT STEPS After identifying the Township of Russell s infrastructure funding gaps and the available funding strategies/sources, it is recommended that the Township determine the appropriate strategy (strategies) going forward to fund the identified gaps. A full cost recovery strategy will have been developed as part of the Financial Plan document. It is also recommended that the Township seek approval to adopt this Asset Management Plan in principle, as a sustainable strategy. It is understood that annual funding will still be subject to the annual budget approval process, and that the Financial Plan should be taken as taking precedence over this AMP. Before future updates to this Asset Management Plan are undertaken, it is recommended that the Township review, redesign, and revise their asset inventory. This will provide the Township with one comprehensive asset inventory, including key asset management themes such as condition, technical performance measures and risk, for all assets at a functional level and related to one another through practical asset hierarchies. We recommend that the Township should continue to develop its infrastructure inventory in GIS. This will allow the Township to view where various infrastructure assets are spatially located in relation to each other. The benefit of incorporating GIS with asset management planning is that future projects will be able to be combined based on location, potentially empowering the Township to apply corridor management techniques, and help to reduce costs and preserve asset condition. For example, the resurfacing of a road segment will be combined with the replacement of the respective watermain such that a newly resurfaced road will not have to be dug up and patched to repair the buried infrastructure underneath. This asset management plan should be updated when regular inspections are completed and when conditions are re-assessed; at least every five (5) years. Asset management is a cost effective measure to help optimize investments, create long-term savings and better manage infrastructure risks. The implementation of this asset management plan will assist the Township of Russell in making informed decisions to meet the desired levels of service, reduce overall risk and improve the infrastructure over the 10-year timeframe of the plan.
123 Appendix A Asset Inventory
124
125
126 ABOUT US WSP is one of the world s leading professional services firm, working with governments, businesses, architects and planners and providing integrated solutions across many disciplines. The firm provides services to transform the built environment and restore the natural environment, and its expertise ranges from environmental remediation to urban planning, from engineering iconic buildings to designing sustainable transport networks, and from developing the energy sources of the future to enabling new ways of extracting essential resources. It has approximately 15,000 employees, mainly engineers, technicians, scientists and architects, as well as various environmental experts, based in more than 300 offices, across 35 countries, on every continent. Head office WSP Canada Inc René-Lévesque Blvd West, Floor 16 Montréal (Québec) H3H 1P9 Phone Fax

127 TOWN OF RUSSELL ASSET MANAGEMENT PLAN JUNE 2017 WSP 600 Cochrane Drive, 5 th Floor Markham, ON L3R 5K3 Contact: Kevin Morawski kevin.morawski@wspgroup.com Phone Fax
128
129 CONTENTS EXECUTIVE SUMMARY... 1 INTRODUCTION Background Purpose Development of an Asset Management Plan Relationship to other Planning Documents 9 STATE OF THE LOCAL INFRASTRUCTURE Inventory of Assets Asset Value Asset Condition Next Steps 17 EXPECTED LEVELS OF SERVICE Minimum Regulatory Requirements Levels of Service Next Steps 23 ASSET MANAGEMENT STRATEGY Planned Action Strategies Analysis of Planned Actions Asset LifeCycle Treatments Inflation Procurement Overview of Risks Next Steps 35 FINANCING STRATEGY Expenditure Forecasts Expenditure History vs Forecasts Funding Strategy Next Steps 50
130 CONTENTS LIST OF TABLES Table 2-1 PSAB 3150 vs. Asset Management 13 Table 2-2 Asset Condition Rating Scale 15 Table 2-3 Condition Rating and Grade 15 Table 2-4 Average Condition 16 Table 2-5 Average Facility Condition 17 Table 2-6 State of Local Infrastructure Next Steps 18 Table 3-1 Minimum Regulatory Requirements 21 Table 3-2 Level of Service Performance Measures Success Scoring 22 Table 3-3 Parks Level of Service Performance Measures 22 Table 3-4 Recreational Facility Level of Service Performance Measures 23 Table 4-1 Recommended Lifecycle Treatments for Parks and Recreational Facilities 30 Table 4-2 Risk Likelihood Rating Scale 32 Table 4-3 Risk Severity Rating Scale 33 Table 4-4 Risk Levels 33 Table 4-5 Average Asset Category Risk 34 Table 5-1 Ten Year ( ) Needs by Park Name 40 Table 5-2 Ten Year ( ) Needs by Recreational Facility Name 41 Table 5-3 Ten Year ( ) Needs by Planned Action Strategy 42 Table 5-4 Annual Expenses for Parks 44 Table 5-5 Annual Expenses for Facilities 46
 29 Figure 4-2 Asset")
131 CONTENTS LIST OF FIGURES Figure 1-1 Typical Asset Management Framework 8 Figure 2-1 Total Replacement Values (2016 CAD) by Park Type _ 14 Figure 2-2 Total Replacement Values (2016 CAD) by Recreational Facility Type 14 Figure 4-1 Small but Timely Renewal Investments Save Money (Figure 1, Ministry of Infrastructure, Guide for Municipal Asset Management Plans ) 29 Figure 4-2 Asset Ownership Lifecycle 30 Figure 4-3 Risk Classification Chart 34 Figure 5-1 Park 10-Year Needs Summary 39 Figure 5-2 Recreational Facility 10-Year Needs Summary 41 Figure 5-3 Ten Year Needs by Planned Action Strategy 43 Figure 5-4 Parks 25-Year Investment Requirements 44 Figure 5-5 Inflated Parks Expenditures 45 Figure 5-6 Recreational Facilities 10-Year Investment Requirements 45 Figure 5-7 Inflated Facilities Expenditures 46 Figure 5-8 Proposed 2016 Funding Sources for Park Infrastructure 49 Figure 5-9 Proposed 2016 Funding Sources for Recreational Facility 49 APPENDICES Appendix A Asset Inventory
132

133 EXECUTIVE SUMMARY
134
135 1 WSP was retained to undertake the development of a comprehensive Asset Management Plan that the Township of Russell (Township) can utilize to assist with decisions regarding the building, operating, maintaining, renewing, replacing, disposing and funding of their recreational infrastructure assets (parks and facilities). This Asset Management Plan was prepared in accordance with the Ontario Ministry of Infrastructure s, Guide for Municipal Asset Management Plans and has been structured based on the following sections as outlined for a detailed Asset Management Plan. 1. Executive Summary 2. Introduction 3. State of Local Infrastructure 4. Expected Levels of Service 5. Asset Management Strategy 6. Financing Strategy The scope of this project encompassed the recreational infrastructure owned and operated by the Township of Russell. The township is responsible for the operation and maintenance of 25 parks including six outdoor baseball fields, five outdoor ice rinks, two outdoor tennis courts, four basketball courts and 12 play structures. Additionally, the Township of Russell owns and operates approximately nine facilities including an arena, two community centers, an outdoor pool, a sports and youth center and other recreational buildings such as museums. Asset condition was established for the Township s recreational infrastructure based on the age and expected life of each asset. For the recreational facilities, WSP sent an inspector on site to complete a high-level condition assessment and inventory. Additional condition information documented by Township staff and inspection reports was used when available. Furthermore, an assessment of risk was undertaken to determine the priority of works associated with the Township s infrastructure. Full life cycle investments for maintenance, rehabilitation, renewal and replacement needs were applied over a 25-year planning period from 2017 to The major capital projects for the Township projected over the 25-year planning period include: EXECUTIVE SUMMARY Replacement of the HVAC system in Russell Arena and Palais des Sports (Embrun Arena) Rehabilitation of baseball field in Richelieu Park Baseball field lighting system replacement in Lafortune Park and Séraphin Marion Park Rehabilitation of parking lots in Palais des Sports Baseball infield upgrade in Russell Ball Park EXECUTIVE SUMMARY
136 2 Rehabilitation of New York Station Trail Replacement of electrical service and distribution system in Russell Arena Finally, yearly expenditure forecasts were summarized by infrastructure category to determine the annual average investment required for infrastructure sustainability. The projected infrastructure investment needs were compared to the Township s historical expenditures to identify potential funding gaps. Next steps have been provided at the end of each section of this plan to identify how the Township can continue to develop and update this Asset Management Plan in the future. A brief summary of the next steps is provided below in Table 0-1. Table 0-1 Summary of Next Steps SECTION State of the Local Infrastructure Expected Levels of Service Asset Management Strategy Financial Strategy NEXT STEPS Maintain and update the asset inventory Preliminary inventories were prepared for the recreational facilities. Additional granularity may be useful for future planning. The inventory for parks and trails was established based on existing PSAB information, review of aerial photography, and use of Google Street View. Additional granularity may be useful for future planning. Conduct condition assessments on an ongoing basis Track values for technical performance measures each year Conduct detailed risk assessments Establish project prioritization framework Track ongoing expenditures and their impact / efficacy Determine the appropriate funding strategy (strategies) for the identified funding gaps Determine the appropriate funding strategy for the proposed EXECUTIVE SUMMARY The following pages summarize the findings of this Asset Management Plan.

137 PARKS 3 CONDITION PARK TYPES CONDITION TARGET AVERAGE CONDITION SCORE C- CONDITION RATING ACTIVE D+ NEIGHBORHOOD C- PARKETTE C- LINEAR C SCORE B To promote community recreation and wellbeing through safe and aesthetically pleasing spaces LEVELS OF SERVICE Parks RISK QUICK FPCTS Hectares of Parks 10.4 Average Age of Parks in Years $3.63 Parks Amenities Replacement Value in 2016 (000,000) EXECUTIVE SUMMARY PARK TYPES RISK RATING RISK LEVEL ACTIVE 12.0 Medium NEIGHBOURHOOD 9.6 Medium PARKETTE 5.5 Medium LINEAR 4 Low PARK INVENTORY Active Parks Neighborhood Parks Parkettes Linear Parks CURRENT LEVEL OF SUSTAINABLE FUNDING ANNUAL FUNDING DEFICIT $73.9k $18.1k

138 RECREATIONAL FACILITIES 4 CONDITION CONDITION TARGET AVERAGE CONDITION SCORE B- CONDITION RATING MUSEUMS B- ARENA B- COMMUNITY CENTERS B SPORTS CENTER B+ OURDOOR POOL A- YOUTH SPACES B+ REC. BUILDINGS D- SCORE B To provide energy efficient buildings, satisfactory work environments for Town staff and reliable space for the community LEVELS OF SERVICE Facilities RISK QUICK FACTS 9 Number of Facilities 41 Average Age of Facilities in years $6.69 Recreational Facilities Replacement Value in 2016 (000,000) EXECUTIVE SUMMARY RISK RATING RISK LEVEL ALL FACILITIES 14.9 High CURRENT LEVEL OF SUSTAINABLE FUNDING ANNUAL FUNDING SURPLUS $53.5K $56.4K
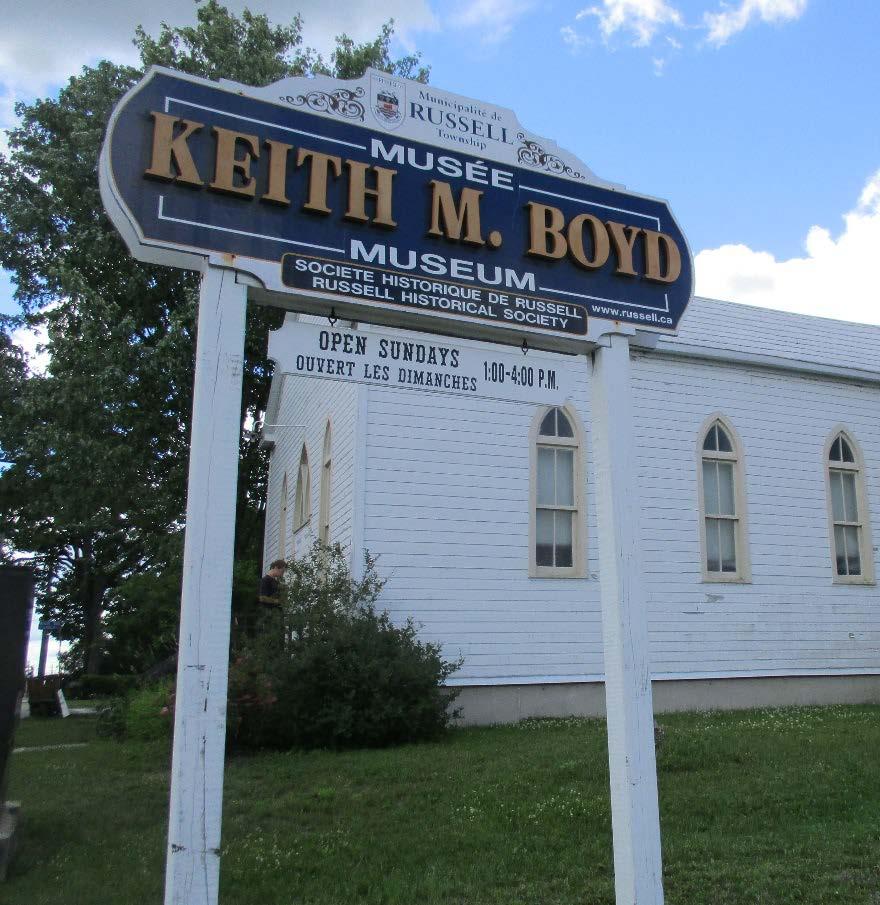
139 INTRODUCTION
140
141 7 INTRODUCTION The Township of Russell is a lower tier municipality within the United Counties of Prescott Russell, located southeast of Ottawa in Eastern Ontario. There are four urban communities within the Township s boundaries: Embrun, Russell, Marionville and Limoges. The Township owns and operates 25 parks including six outdoor baseball fields, five outdoor rinks, two outdoor tennis courts, four basketball courts and 12 play structures. Additionally, the Township of Russell is responsible for the operation and maintenance of nine facilities including two arenas, two community centers, an outdoor pool, a sports and youth center and other recreational buildings. INTRODUCTION 1.1 BACKGROUND The Ontario Ministry of Infrastructure s, Building Together: Guide for Municipal Asset Management Plans (June 2011), indicates that any municipality seeking provincial infrastructure funding must demonstrate how its proposed project fits within a detailed Asset Management Plan. This helps to ensure that limited resources are directed to the most critical needs. WSP was retained to undertake the development of a comprehensive Asset Management Plan that the Township of Russell can use to guide decisions related to the management of their recreational infrastructure assets. This Asset Management Plan is structured in accordance with the Ontario Ministry of Infrastructure s, Guide for Municipal Asset Management Plans. 1.2 PURPOSE The objective of this Asset Management Plan is to provide a strategic document that will guide decisions related to how the Township s recreational infrastructure (parks and facilities) will be managed to most efficiently and effectively allocate resources in a manner that will meet the Township s desired Levels of service in the lowest overall lifecycle costs. This Plan identifies the costs and benefits of recreational infrastructure investment decisions across the organization s asset portfolio. To demonstrate the impact of investment decisions, target Levels of Services were set so that performance against these targets could be measured. A Financial Plan is also included in this document which shows how current levels of investment are measuring up against the asset needs. This plan will help to demonstrate the impacts of investment decisions across the organization. It ultimately provides a ten (10) year capital needs forecast based on recent condition assessment information, from 2017 (year 0) to 2027 (year 10), and makes recommendations for how the Township may advance its asset management programme moving forward.
142 8 1.3 DEVELOPMENT OF AN ASSET MANAGEMENT PLAN This Asset Management Plan only documents the asset management strategy for the Township s key Parks and Recreation Facilities public infrastructure. Future government funding of infrastructure projects will be contingent on an Asset Management Plan and therefore these asset categories were selected as a starting point for Asset Management within the Township of Russell to match with potential future funding programs. It is highly recommended that the Township consider future integration of Asset Management Plans to promote consideration of mutual needs, infrastructure interdependencies, and avoidance of institutional siloing. This document looks at a 25 year planning horizon from 2017 to 2041 but should be re-evaluated on a five-year basis. This Asset Management Plan has been developed so that regular updates can be made to reflect the Township s changing needs and funding availability. Below is a typical asset management framework as presented in the International Infrastructure Management Manual. It outlines the relationship between the processes and procedures being presented in this Plan. Figure 1-1 Typical Asset Management Framework INTRODUCTION Asset management is the philosophy of actively managing infrastructure with the intention achieving a specific objective; in this case, delivering the Township s services at the lowest lifecycle cost. This Plan should not be a standalone document just to be updated every five years; it is an iteration of a continually-evolving framework for best management of the Township s infrastructure, to be integrated into day-to-day operations and reviewed on an annual basis. Although certain principles of asset management such as Condition Assessment, Levels of Service and Capital Planning are addressed within this document, and need to be refined as the Township s asset management processes are developed. This Asset Management Plan will require on-going and continual work to ensure its success. On-going work or next steps to the refinement of the asset management strategy are presented at the end of each section.
143 9 1.4 RELATIONSHIP TO OTHER PLANNING DOCUMENTS This Asset Management Plan relied upon other targeted planning documents in developing the overall asset strategy. This document has already drawn upon the valuable work completed under other planning documents such as: Russell Recreation Master Plan 2013 Asset Management Plan, Public Sector Digest Russell TCA by Department, Russell Township (2016) Township of Russell 2016 Budget Report Other internally developed planning resources INTRODUCTION
144

145 STATE OF THE LOCAL INFRASTRUCTURE
146
147 13 STATE OF THE LOCAL INFRASTRUCTURE 2.1 INVENTORY OF ASSETS Key parks and recreational facilities inventory information including location, estimated service life, quantity, year of original construct installation and other attribute information is displayed in the inventory of assets. PSAB 3150 VS ASSET MANAGEMENT Effective January 1, 2009, the Public Sector Accounting Board s (PSAB) Rules on Tangible Capital Assets (PS3150) required that local governments record their Tangible Capital Assets on the statement of financial position and amortize them over their useful lives, moving all governments to a universal full accrual accounting system. In order to comply with this directive, municipalities across Ontario needed to develop an inventory of all of their infrastructure assets, along with an assumed replacement cost. PS 3150 provides accounting information for all tangible capital assets (TCA) using historical cost valuation. An Asset Management Plan needs to provide the financial information and timing associated with future replacements, rehabilitations, disposals, expansions and maintenance for the tangible capital assets. Table 2-1 summarizes key differences between PS 3150 and asset management. Table 2-1 PSAB 3150 vs. Asset Management STATE OF THE LOCAL INFRASTRUCTURE Use Valuation Procedure Reporting PS 3150 To inventory TCAs and provide valuations Amortize costs of assets Use assumed economic service life to determine asset amortization Audited Financial Statements, Financial Information Returns ASSET MANAGEMENT To inventory TCAs and provide a long term, sustainable forecast Project future costs (taking into account inflation) of assets Use condition and risk to determine asset needs Asset Management Plans The foundational information used in the development of this Asset Management Plan was based on the 2004 Russell Master Plan and Township s 2016 PS 3150 data. This information was augmented by the 2016 Condition Assessment of the Township s recreational infrastructure, conducted by WSP. Recreational facility elements included: foundation, super structure, exterior enclosure, roofing, partitions, stairs and interior finishes. Where more recent data meeting the requirements of this plan was available, best efforts were made to incorporate the newer data.


148 ASSET VALUE The estimated life expectancy of each asset type and current year (2016) replacement value are both listed in the inventory of assets. The life expectancy and assumed replacement values used in this plan are based on the replacement values assigned to each asset under the previous PSAB 3150 compliance exercise and subsequent condition assessment. The life expectancies are based on a number of factors, including industry accepted standards, engineering best practice, and local experience by Township of Russell Staff. While the PSAB 3150 values were escalated forward to 2016 at a rate of 3% per year to determine the 2016 replacement cost, this is an approximation of the actual costs that may be incurred. Changes in technology, designs, and even infrastructure requirements can result in significant deviation from this estimated value. The total current year (2016 CAD) replacement costs for parks and recreational facilities are displayed in Figure 2-1 and Figure 2-2. Figure 2-1 Total Replacement Values (2016 CAD) by Park Type STATE OF THE LOCAL INFRASTRUCTURE Figure 2-2 Total Replacement Values (2016 CAD) by Recreational Facility Type
149 ASSET CONDITION ASSET CONDITION RATING SCALE Asset condition was established for the Township of Russell s recreational infrastructure based on the age and expected life of each asset. For facilities, the condition was established based on a visual inspection conducted by WSP. No on-site inspection was completed for the parks or trails. Condition information documented by Town staff and other inspection reports were also used when available. Assets were assigned a condition rating of 1 to 5 based on the rating scale shown in Table Table 2-2 Asset Condition Rating Scale RATING DESCRIPTION DEFINITION & EST. INTERVENTION COST 1 Very Poor Requires asset replacement, replacement cost 2 Poor Required major rehabilitation, large dollar amount 3 Fair Minor maintenance, small dollar amount 4 Good No work required, no dollar amount, perform normal maintenance 5 Excellent No work required, no dollar amount It is important to undertake regular condition assessments of all infrastructure assets to establish a baseline that can be used to determine and prioritize capital projects. The field inspection work involved in a condition assessment provides an accurate representation of each asset s condition at that point in time. For the scope of this project, physical inspections were limited to the recreational facilities. To complete future updates of the Asset Management Plan, it is recommended that the Township undertake regular condition assessments of its infrastructure and use maintenance records and local knowledge to update condition ratings. STATE OF THE LOCAL INFRASTRUCTURE AVERAGE ASSET CATEGORY CONDITION The Township of Russell s average condition ratings for park and recreational infrastructure are presented below. A letter grade corresponding to the average asset category condition has been assigned based on the breakdown provided in Table 2-3. Table 2-3 Condition Rating and Grade CONDITION RATING A A A B B B- GRADE
150 16 CONDITION RATING C C C D D D- PARKS GRADE The Township of Russell is responsible for the operation and maintenance of 25 parks (approximately 98 ha) including four active parks, ten (10) neighbourhood parks, ten (10) parkettes and a linear park. The types of parks are described as follows: Active parks - feature recreational buildings, sports fields and usually parking spaces and contain large catchment area and have community service radius. Neighbourhood parks - are typically within walking distance from residential areas and offer play opportunities including playgrounds, courts and spaces for unorganized activities. Parkettes - are typically smaller than 0.3 hectares and offer benches and pathways for a small group of residents. Linear parks often in conjunction with public roads, provide means for residents to commute or recreate. In the absence of park inspections, the condition of each park was estimated based on the installation year of the associated playground and their estimated service lives. Play structures are to be inspected monthly and are given a pass or fail based on the requirements of the Canadian Standards Association (CSA), regardless of the age of the play structure. Those requiring replacement in the near future will have a lower condition grading than those not require replacement for many years even though all parks meet the required safety guidelines. Inspection of park trails, lands, and other related infrastructure should be completed on an ongoing basis during regular maintenance activities. The estimated average condition of each park type and the overall condition rating for the Township of Russell s parks are displayed in Table 2-4. Table 2-4 Average Condition STATE OF THE LOCAL INFRASTRUCTURE PARK TYPE AVERAGE AGE (YEARS) 1 EXPECTED SERVICE LIFE (YEARS) AVG. CONDITION RATING AVERAGE GRADE Active D+ Neighbourhood C- Parkette C- Linear C OVERALL GRADE C-
151 17 1Based on estimated installation year by Township staff. 2 Average asset expected service life RECREATIONAL FACILITIES The Township of Russell owns and operates approximately nine recreational facilities. Those facilities include museums, arenas, pools, and community and sports centers. La Maison des Arts is a recreational facility that provides a variety of programs to residents; however, it was not included in the inventory since the facility is currently not operated and maintained by the Township. The Township should consider revisiting these recommendations if the lease for La Maison des Arts is not renewed. Most facilities are in fair condition. There are several buildings which have exceeded their estimated expected service life however. The average condition of each type of facility and the overall condition rating for the Township of Russell s recreational facilities are shown in Table 2-5. Table 2-5 Average Facility Condition FACILITY TYPE AVERAGE AGE (YEARS) 1 EXPECTED SERVICE LIFE (YEARS) 2016 AVG CONDITION RATING AVERAGE GRADE Museums B- Arena B- Community Centers B Outdoor Pool A- Sports & Youth B+ Center Other Recreational Building D- (New York Station) 1 Age of assets in each facility was not available. The average age of facilities was estimated from the inspections. 2 Russell Arena was originally constructed in1978, however records suggest that it may have been upgraded in OVERALL GRADE B STATE OF THE LOCAL INFRASTRUCTURE 2.4 NEXT STEPS The State of Local Infrastructure has been prepared based on the most complete data set available for each asset category, augmented by the results of WSP s inspection of the recreational facilities. Moving forward, the Township s asset inventory will need to be maintained and augmented to support the objectives of the Township s Asset Management Planning framework. This will ensure a more accurate
152 18 representation of the state of the local infrastructure for future updates to this Asset Management Plan. Recommended updates to the Township s current recreational infrastructure inventory systems are presented in Table 2-6. Table 2-6 State of Local Infrastructure Next Steps ASSET CATEGORY Parks Recreational Facilities INVENTORY UPDATES TO SUPPORT ASSET MANAGEMENT PLANNING Inventory updates including exact installation year Assessed condition (Park Condition Assessments) Year, description and cost of past facility renovations Inventories should be updated as work is completed. Inventories should be cross-referenced with other available reports, drawings, and specifications, and refined as appropriate. Updated Building Condition Assessments STATE OF THE LOCAL INFRASTRUCTURE

153 EXPECTED LEVELS OF SERVICE
154
155 21 EXPECTED LEVELS OF SERVICE Levels of service are qualitative and quantitative descriptions of the Township s objectives for your infrastructure. They provide the means to measure affordability of the infrastructure and its management against infrastructure users needs and expectations. The asset management decision making process is driven by the impact of the levels of service on citizens, communities and the natural environment. This section outlines the Township s desired levels of service for their recreational parks and facility infrastructure. EXPECTED LEVELS OF SERVICE 3.1 MINIMUM REGULATORY REQUIREMENTS As a minimum level of service, there are regulatory requirements associated with the Township s recreational infrastructure that must be met. The regulatory requirements applicable to the Township are summarized below in Table 3-1. These requirements are not being identified as a level of service since they are already a minimum target and therefore must be met by the Township. Table 3-1 Minimum Regulatory Requirements ASSET CATEGORY Parks Facilities REGULATORY REQUIREMENTS Canadian Standards Association (CSA) Accessibility for Ontarians with Disabilities Act (AODA) Planning Act Development Charges Act (DCA) Building Code Act, 1992 (Ontario Regulation 332/12) Accessibility for Ontarians with Disabilities Act (AODA) Development Charges Act (DCA) 3.2 LEVELS OF SERVICE The levels of service have been defined for the Township s Parks and Recreational Facilities through technical performance measures. The target values (extracted from existing documentation or estimated based on current state and industry benchmarks), existing values, and target timeframes for each technical performance measure by asset category are listed in Table 3-3 and Table 3-4. A letter grade has been assigned to indicate how well the township is meeting their desired performance measures for each category. Table 3-2 below outlines the Service Level Scoring.
156 22 Table 3-2 Level of Service Performance Measures Success Scoring PARKS GRADE A B C F GUIDELINES Currently meeting or exceeding performance level targets for the asset category Asset category is showing positive improvement in achieving Levels of Service targets by target timeframe Asset category is showing no improvement in achieving levels of Service Targets by target timeframe Actual Level of Service is trending away from Level of Service target LEVEL OF SERVICE: TO PROMOTE COMMUNITY RECREATION AND WELLBEING THROUGH SAFE AND AESTHETICALLY PLEASING SPACES EXPECTED LEVELS OF SERVICE Table 3-3 Parks Level of Service Performance Measures TECHNICAL PERFORMANCE MEASURE Avg. condition rating of parks Soccer fields per capita Baseball diamonds per capita Skating/Hockey rinks per capita Tennis courts per capita Basketball courts per capita Playgrounds per capita EMBRUN EXISTING VALUE 1 RUSSELL EXISTING VALUE 1 OVERALL (TWP) 1 TARGET VALUE TARGET TIMEFRAME MEETING TARGET? 2.2 / / / / No 0 1:4003 1:16,400 1:20, :2,400 1:2,000 1:2,700 1:3, :3,600 1:4,000 1:3,300 1:13, :3, :8,200 1:10, :2,000 1:4,000 1:6, :1,000 1:1,000 1:1,400 1:1, Existing Value is the ratio between the number of target park and community population. There are four communities in the Township of Russell. Embrun and Russell are the two largest communities, representing approximately 67% of the total township population. The 2016 population is estimated based on 2011 Canadian Census.
157 23 RECREATIONAL FACILITIES LEVEL OF SERVICE: TO PROVIDE ENERGY EFFICIENT BUILDINGS, SATISFACTORY RECREATION ENVIRONMENTS AND RELIABLE SPACE FOR THE COMMUNITY Table 3-4 Recreational Facility Level of Service Performance Measures TECHNICAL PERFORMANCE MEASURE Time to complete minor building repairs Average condition rating of buildings Time to complete contracted building repairs Frequency of condition inspections Indoor ice rinks per population in community UNIT EXISTING VALUE TARGET VALUE TARGET TIMEFRAME (YEAR) days MEETING TARGET? days No yrs No - 1:8193 1:13, EXPECTED LEVELS OF SERVICE 3.3 NEXT STEPS It is recommended that the Township continue to track technical performance measures on an annual basis so that corrective actions can be implemented to achieve the target Levels of Service.
158

159 ASSET MANAGEMENT STRATEGY
160
161 ASSET MANAGEMENT STRATEGY 27 Infrastructure sustainability is dependent on activities such as maintenance, repairs, upgrades and replacements when necessary. The application of these activities relies heavily on the level of funding available and the effective allocation of that funding. To ensure recommended works are appropriately prioritized, an assessment of risk was undertaken to determine the urgency of the works associated with the Township s recreational infrastructure. The asset management strategy outlines the planned action strategies and determines the risk for the Township s recreational infrastructure assets. 4.1 PLANNED ACTION STRATEGIES Recommended works were classified based on six planned action strategies: non-infrastructure solutions, maintenance activities, renewal/rehabilitation activities, replacement activities, disposal activities and expansion activities, as outlined in the Ministry of Infrastructure Ontario s, Guide for Municipal Asset Management Plans. A description of each strategy is outlined below. ASSET MANAGEMENT STRATEGY NON-INFRASTRUCTURE SOLUTIONS Non-infrastructure solutions produce lower costs for long-term asset sustainability. Cost and time savings are optimized by implementing an organizational approach for all infrastructure works. Important non-infrastructure solutions include implementation of an Asset Management Plan and regular inspections of the various infrastructure assets. Results of inspections should be used to regularly update the Asset Management Plan. Recreational infrastructure should generally be inspected every five years. Play structures at public parks are to be inspected on a monthly basis as per Canadian Standards Association (CSA) MAINTENANCE ACTIVITIES Maintenance is essential to managing infrastructure, as the expected level of service often relies on maintenance activities. Regular maintenance can also add significant life to assets. It is important that the Township of Russell schedule regular inspections of its assets to identify maintenance requirements. Annual maintenance expenditures for the Township s infrastructure have been estimated and incorporated into the final investment requirements. The Township should track the sufficiency and efficacy of its ongoing maintenance expenditures over time, and adjust as needs dictate RENEWAL / REHABILITATION ACTIVITIES Rehabilitation is necessary when an asset does not perform to its desired level of service. Significant repairs designed to extend the life of the asset are determined through regular inspections. Rehabilitation over replacement is advantageous when there are only a few components that need repair. Recommended renewal/rehabilitation activities for recreational infrastructure are found Section
162 Those activities within the 25-year planning period include, but are not limited to rehabilitation of baseball infield in Russell Ball Park, rehabilitation of a tennis court in Palais des Park, and upgrades to the ice rink in Russell Arena. More information on the facility components forecast to need repair or rehabilitation can be found in asset inventory REPLACEMENT ACTIVITIES Occasionally, the extent of damage or deterioration to an asset is too great and rehabilitation is deemed unfeasible. At this point, replacement is necessary. As an asset approaches the end of its service life, more frequent inspection may be necessary to determine if replacement of the asset is critical in the short-term, or if deferral of the asset replacement is possible. The recommended replacement activities within the 25-year planning period include, but are not limited to replacement of all baseball field lights in Palais des Park, replacement of 400 meters of fence in Séraphin Marion Park, and replacement of the HVAC systems in recreational facilities DISPOSAL ACTIVITIES Disposal costs are associated with the reduction of services or elimination of demands placed on systems. By establishing target levels of service, an organization can clearly determine whether or not infrastructure or particular assets are needed. Asset disposal costs associated with infrastructure replacement activities are generally included with the estimates made for asset replacement. ASSET MANAGEMENT STRATEGY EXPANSION ACTIVITIES Expansion activities are required to extend services to previously un-serviced areas or to expand services to accommodate growth demands. The Township of Russell had a population of 15,247 in 2011 and is expected to grow to a population of 18,121 by the year This increase in population will affect the ratios of facilities or parks to population, though the possible need for construction or acquisition of additional recreational assets has not been considered in this Plan. 4.2 ANALYSIS OF PLANNED ACTIONS An analysis of planned actions was used to determine the most effective strategy for managing the Township s recreational infrastructure. The analysis compares two strategies for managing infrastructure; one with timely renewal investments, and one without timely investments. These two strategies are depicted in Figure 4-1.
163 29 Figure 4-1 Small but Timely Renewal Investments Save Money (Figure 1, Ministry of Infrastructure, Guide for Municipal Asset Management Plans ) ASSET MANAGEMENT STRATEGY Implementing an annual maintenance program and completing timely renewal works will keep the infrastructure performing at the desired levels of service, and at the same time prolong the life of the infrastructure and reduce overall spending. Therefore, the most cost effective strategy for managing the Township s recreational infrastructure is to perform annual maintenance and complete timely renewal works. Figure 4-2 summarizes the typical asset lifecycle needs that will promote a financially sustainable, long term forecast for the Township s recreational infrastructure. After the recommended works have been identified to ensure each asset will perform at the desired level of service, the recommended works will be distributed over a 25-year planning period. The recommended works for the infrastructure will be distributed based on priority levels determined through the assessment of risk. Following the application of full lifecycle investments for maintenance, rehabilitation, renewal and replacement needs, the projected reinvestment needs will be compared to the current annual capital budget to determine the adequacy of the funding for the sustainability of the infrastructure.
164 30 Figure 4-2 Asset Ownership Lifecycle ASSET MANAGEMENT STRATEGY 4.3 ASSET LIFECYCLE TREATMENTS The following sections outline the assumptions made in determining the total costs to undertake the projected lifecycle treatments for each of the Township s recreational assets PARKS AND FACILITIES Recommended maintenance and rehabilitation for the parks and facilities has been included in Table 4-1. Table 4-1 Recommended Lifecycle Treatments for Parks and Recreational Facilities RECOMMENDED TREATMENT TIMING ESTIMATED COST Park Maintenance Materials (lawn mowing, fertilizing, seeding) As required $35,000/yr Park Maintenance Equipment As required $70,000/yr Toilet Servicing As required $14,000/yr
165 31 Rehabilitation of Wood Stair Construction Replacement of park amenities (playgrounds, picnic shelters, soccer nets, basketball nets, etc.) Replacement of Picnic Tables and Benches Replacement of Foot Bridges Replacement of Park Sign Board Replacement of HVAC System Facility Replacement As required $5,000 End of Service Life (15 years) End of Service Life (5 years) End of Service Life (25 years) End of Service Life (10 years) End of Service Life (Average: 30 years) End of Service Life (25-50 years) Cost varies by park $2,500 $80,000 $1,000 Varies by buildings $5,000 - $160,000 Varies by building $50,000 - $12,000,000 ASSET MANAGEMENT STRATEGY It should be noted that this approach results in an order of magnitude estimate and should be considered as plus or minus 50% for any given building or system. Smaller buildings or older buildings which may require extensive refurbishments are likely to have greater cost variances. 4.4 INFLATION The rehabilitation, renewal and replacement costs for the Township s parks and recreational facilities have been projected over a 25-year planning period from 2017 to Present value dollars (2016 CAD) have been utilized for all calculations. In other words, future costs have not been inflated or adjusted to Future Value CAD. An inflation rate of can be applied to help assess rehabilitation costs in future years, but care should be taken and consideration given to conducting a sensitivity analysis when relying on this information for capital needs analyses. 4.5 PROCUREMENT Procurement is the act of obtaining goods, services or works from an external source. The Ministry of Infrastructure s Guide for Municipal Asset Management Plans recommends Municipalities have procurement by-laws in place to serve as a basis for considering various delivery mechanisms. Per the requirements of Section 270(1) of the Municipal Act, 2011, stipulating that municipalities are to adopt policies with respect to procurement of goods and services, the Township of Russell established Procurement Policy ADM/019 in 2004 (revised June 2007, and November 2009), as well as By-law # (passed June 2013), which establish the process for which goods and services are procured. The by-law has been subsequently amended in September 2015 with by-law # The intent of these policies and by-laws was to ensure competitive procurement and transparency to the public. The levels of service and the Township s ability to meet the associated targets and timeframes may be affected by any limitations of these by-laws.
166 OVERVIEW OF RISKS Understanding risks is important to the safety and functionality of the Township s recreational infrastructure. An assessment of risk was undertaken in order to determine the priority of the works associated with the infrastructure. The recommended works were distributed over the 25-year period based on the priority determined through the risk assessment. Below is a summary of the risk assessment approach, outlining how the assessment was carried out for the Township of Russell s recreational infrastructure. Every risk is expressed in terms of the following components: A hazardous event or incident; A cause; The probability (likelihood) of its occurrence; and A consequence. Risk is expressed as: Risk = Likelihood x Severity The likelihood (or probability) is assigned to individual risk events; in this case, the likelihood of asset failure as a whole. The severity is also assigned to the specific consequence regardless of its probability. For the purposes of this Asset Management Plan, the only hazardous event considered was the failure of each asset. Please note that this assessment of risk is not a formal or comprehensive risk assessment of the Township s recreational infrastructure and therefore does not include all potential risks associated with each asset. To complete future updates of the Asset Management Plan, it is recommended that the Township undertake regular risk assessments of its infrastructure. Table 4-2 and Table 4-3 were used to assign likelihood and severity scores to the failure of each asset. Table 4-2 Risk Likelihood Rating Scale ASSET MANAGEMENT STRATEGY LIKELIHOOD DESCRIPTION Rare Unlikely Possible Likely The associated infrastructure is new (within warranty period) and therefore not expected to fail in the near future; or Condition rating of 5 ( Excellent ). The infrastructure is not new, but is still within the first quarter of its anticipated service life; or Condition of 4 ( Good ). The associated infrastructure is part way through its anticipated service life; or The asset has already been refurbished or rebuilt; or Condition Rating of 3 ( Fair ). The associated infrastructure is approaching the end of its life cycle and therefore it is expected to fail in the near future; or Condition Rating of 2 ( Poor ). RATING
167 33 LIKELIHOOD DESCRIPTION The associated infrastructure has exceeded its life cycle and failure is Very Likely considered imminent. Condition Rating of 1 ( Very Poor ). Table 4-3 Risk Severity Rating Scale RATING SEVERITY DESCRIPTION RATING Insignificant Minor Moderate Major Catastrophic No disruption to normal operation, no environmental impact, no financial investment. Some manageable operation disruption, minor environmental impact, small financial investment. Significant modification to normal operation but manageable, easy to mitigate environmental impact, moderate financial investment. Reduced production with inability to meet demand imminent, significant environmental impact, large financial investment. Inability to meet demand, potential injury, severe environmental impact, significant financial investment ASSET MANAGEMENT STRATEGY The risk score is determined as the product of the likelihood and severity ratings assigned to the event. This value was then used to assign priorities to the recommended works. Three risk levels were defined, based on the risk score of the particular event. These are shown in Table 4-4 and illustrated in Figure 4-3. Table 4-4 Risk Levels RISK = LIKELIHOOD X SEVERITY LEVEL ASSOCIATED RESPONSE 1 4 Low Acceptable 5 12 Medium Review and Address High Action Required

168 34 Figure 4-3 Risk Classification Chart ASSET MANAGEMENT STRATEGY AVERAGE ASSET CATEGORY RISK The recommended works were prioritized in order to minimize the Township s overall average risk level over the ten-year planning period. The average risk ratings for the Township of Russell s infrastructure by asset category are presented in Table 4-5. Table 4-5 Average Asset Category Risk ASSET CATEGORY Parks Recreational Facilities TYPE 2016 AVERAGE RISK RATING AVERAGE LEVEL Active Park 12.0 Medium Neighbourhood Park 9.6 Medium Parkette 5.5 Medium Linear Park 4 Low Museums 16 High Arena 13.5 Medium Community Centers 15.0 High Sports Center 15.0 High OVERALL LEVEL Medium (7.8) High (14.9)
169 35 ASSET CATEGORY 4.7 NEXT STEPS TYPE 2016 AVERAGE RISK RATING AVERAGE LEVEL Outdoor Pool 11.7 Medium Sports & Youth Spaces 15.0 High Other Recreational Buildings 18.3 High OVERALL LEVEL It is recommended that a more detailed risk assessment be undertaken for the Township s park and recreational infrastructure through future Asset Management Planning activities to refine the results of the high level risk analysis performed under this study. This would include consideration of which facilities are more critical to the Township, and what the risks are to the overall service delivery. In addition to enhancing the risk assessment, it is recommended that the Township establish formal project prioritization frameworks to assist in capital planning and risk management. It is important to concurrently track the efficacy / impact of ongoing expenditures to validate or refine the investment strategy. ASSET MANAGEMENT STRATEGY
170

171 FINANCING STRATEGY
172

173 FINANCING STRATEGY EXPENDITURE FORECASTS YEAR INVESTMENT NEEDS BY ASSET CATEGORY Based on approaches to asset lifecycle investments, including installation, maintenance and replacement at the end of service life, 10-year asset needs profiles have been created for the asset categories. The forecasted needs do not include the costs associated with staffing or the staffing growth requirements to meet the future infrastructure needs, nor does it include any expansion or upgrades that may be necessary to meet a growing demand on the infrastructure. A summary of the 10-year asset needs (in thousands of dollars) on park and recreational facility is included in Figure 5-1, Figure 5-2, Table 5-1, and Table 5-2. The forecast has been extended to 25 years on the figures to illustrate what the future cash flow needs may be. FINANCING STRATEGY PARKS Figure 5-1 Park 10-Year Needs Summary $350, Year Average Annual Investment = $ 73,852 Investment Needs( 2016CAD) $300,000 $250,000 $200,000 $150,000 $100,000 $50,000
174 40 Table 5-1 Ten Year ( ) Needs by Park Name PARK NAME Palais des Sports $17 $2 $17 $2 $4 Richelieu Park $4 $1 $3 $24 Russell Ball Park $14 $8 $153 $6 $18 Russell Youth Center $33 New York Station Trail $88 Bourdeau Park $5 $1 $5 $3 $1 Camelot Park $5 $1 $10 $3 Hanover Park $6 $3 $13 Joe Bélisle Park $3 $2 $10 $8 Lafortune Park $2 $2 $12 Mélanie Park $5 $0.5 $3 $9 $5 $0.5 Olde Towne West Park $11 $0.5 $12 Séraphin Marion Park $4 $3 $39 $19 $0.1 $5 Stanley Park $3 $3 Yahoo Park $1 $22 $4 AG Bourdeau Park $5 $2 $0.3 $0.3 Duncanville Park $2 Gregoire Road Park Keith M. Boyd Park $5 $42 $2 Lapointe Park $2 McDougall Park $2 $1 Nokomis Park $3 $2 Omer Lamadeleine $0.5 $3 $0.5 Park Pico Park $0.5 $1 $4 $0.5 Stiver Park $6 $2 $16 Total Replacement Cost ($000) 2016 CAD $83 $16.8 $7.9 $119.2 $197.0 $82.6 $19.9 $97.4 $72.0 $42.9 FINANCING STRATEGY The major capital projects for the Township s Parks Infrastructure projected over the 25-year planning period include: Replacement of baseball field lights in Richelieu Park and Russell Ball Park Replacement of fence in Russell Ball Park
175 41 RECREATIONAL FACILITIES Figure 5-2 Recreational Facility 10-Year Needs Summary FINANCING STRATEGY Table 5-2 Ten Year ( ) Needs by Recreational Facility Name RECREATIONAL FACILITY NAME Russell Arena 1 $48.7 $36.3 $2.7 $91.1 Marionville Community $104.2 $20.0 $29.2 Center Palais des Sports $2.4 $1.7 $24.2 $50.9 $1.7 Embrun Community Center $8.7 $12.1 $38.7 $19.4 Russell pool $0.1 Russell Youth Center Convenience St New York Station $18.7 $0.9 $2.4 $7.3 Church Museum $2.9 $3.0 $2.4 Fire House Museum $2.4 $2.4 Total Replacement Cost ($000) 2016 CAD $18.7 $14.5 $2.9 $65.6 $4.7 $104.2 $99.2 $20.0 $82.7 $ Includes Russell Arena Garage.
176 42 The major capital projects for the Township s Recreational Facilities projected over the 25-year planning period include: Replacement of HVAC system in Russell Arena and Palais Des Sports(Embrun Arena) End-of-life replacement of electrical service & distribution systems Replacement of ice rink lighting system in Palais Des Sports(Embrun Arena) YEAR INVESTMENT NEEDS BY PLANNED ACTION STRATEGY A summary of the recommended works categorized by the previously defined planned action strategies over the next ten year period (in thousands of dollars) is included in Table 5-3. This forecast will assist Township staff in planning for the expenses associated with replacement, maintenance, rehabilitation and expansion of the Township s parks and recreational facilities. Table 5-3 Ten Year ( ) Needs by Planned Action Strategy FINANCING STRATEGY PLANNED ACTION STRATEGY Park Renewal/Rehabilitation Activities Park Replacement Activities Recreational Facility Renewal/Rehabilitation Activities Recreational Facility Replacement Activities Total ($000) 2016 CAD $14 $0.0 $1.6 $60.1 $104.5 $12.6 $0.7 $94.3 $39.2 $18.0 $69.0 $16.8 $6.3 $59.2 $92.5 $70 $19.2 $3.1 $32.8 $24.9 $17.5 $14.5 $2.9 $65.3 $3.0 $104.2 $62.9 $0.0 $46.1 $93.7 $1.2 $0.0 $0.0 $0.3 $1.7 $0.0 $36.3 $20.0 $36.6 $28.4 $101.7 $31.1 $10.8 $184.9 $202 $186.8 $119.1 $117.4 $154.7 $165
177 43 Figure 5-3 Ten Year Needs by Planned Action Strategy Investment Needs (2016 $) $900,000 $800,000 $700,000 $600,000 $500,000 $400,000 $300,000 $200,000 $100,000 FINANCING STRATEGY Park Renewal/Rehabilitation Activities Recreational Facility Renewal/Reabilitation Activities Park Replacement Activities Recreational Facility Replacement Activities 5.2 EXPENDITURE HISTORY VS FORECASTS PARKS The current annual sustainable infrastructure investment projected for the parks is approximately $69,072. The projected annual expenditures over the 25-year planning period are summarized in Figure 5-4.
178 44 Figure 5-4 Parks 25-Year Investment Requirements Investment Needs (2016 $) $300,000 $250,000 $200,000 $150,000 $100,000 $50,000 Annual 25-year Sustainable Investment = $72,832 Current Average Capital Investment = $55,750 FINANCING STRATEGY Park Annual 25-year Sustainable Investment Current Average Investmment Based on the Township s audited financial records, the average capital expenditure for the parks between the years of 2013 to 2016 was roughly $55,750. The breakdown of the yearly expenses is presented below in Table 5-4. Table 5-4 Annual Expenses for Parks CATEGORY (BEFORE ) 2016 PROPOSED BUDGET AVERAGE ( ) Parks (capital) $14,662 $40,618 $112,462 $55,256 $55,750 The average capital expenditure may be used to expansion and development activities of the park infrastructure. The 25-year sustainable investment plan mainly focuses on replacement, rehabilitation and renewal activities. The difference between the forecasted annual sustainable investment and the existing average annual investment is $17,082. The gap is more apparent long term when inflation is applied, however. This relationship is shown in Figure 5-5.
179 45 Figure 5-5 Inflated Parks Expenditures Annual Expenditure $140,000 $120,000 $100,000 $80,000 $60,000 Annual Expenditure Gap Forecasted Sustainable Investment ($72,832) FINANCING STRATEGY $40,000 $20,000 Current Average Investment ($55,750) $ RECREATIONAL FACILITIES The current annual sustainable infrastructure investment projected for the recreational facilities is approximately $161,719. The projected annual expenditures over the twenty-five year planning period are summarized in Figure 5-6. Figure 5-6 Recreational Facilities 10-Year Investment Requirements $900,000 $800,000 $700,000 $600,000 $500,000 $400,000 $300,000 $200,000 $100,000 Annual 25-year Sustainable Investment = $161,719 Current Average Investment = $109,848 Recreational Facility Annual 25-year Sustainable Investment Current Average Investmenet
180 46 From the installation data provided by Township s staff, some of the recreational facilities have exceeded their expected service life. The condition of those facilities, however, may be sufficient to provide the desired levels of service for communities in the Township. In other words, the facilities appear to be in good condition even though they are old. The replacement and rehabilitation investment strategy is developed based on the condition of each asset in the recreational facilities. The Township s average capital expenditure for the facilities between the years of 2013 to 2016 was $109,848. The breakdown of the yearly expenses is presented in Table 5-5. Table 5-5 Annual Expenses for Facilities CATEGORY (BEFORE ) 2016 PROPOSED BUDGET AVERAGE ( ) Facilities (capital) $140,524 $14,619 $130,000 $154,243 $109,848 *Does not include capital expenditures for 2010 and The difference between the forecasted annual sustainable investment and the existing average annual investment is $51,871. However, it is more apparent long-term when inflation is applied. This relationship is shown in Figure 5-7. Figure 5-7 Inflated Facilities Expenditures FINANCING STRATEGY $250,000 $200,000 Annual Expenditure Gap Annual Expenditure $150,000 $100,000 Forecasted Sustainable Investment ($161,719) $50,000 Current Average Investment ($109,848) $
181 FUNDING STRATEGY REVENUE SOURCES Several sources of funding are available to the Township of Russell to support the sustainable recreational infrastructure investments over the next twenty-five years. Typical funding sources are outlines below for discussion purposes however, funding of the sustainable infrastructure plan will be further determine through other studies to be undertaken by the Treasures Department RESERVE ACCOUNTS Reserve accounts provide a source from which funds can be drawn when needed. Reserve accounts play an important role in long term financial planning. Reserve accounts for infrastructure provide a buffer for unexpected expenditures, and allow for the accumulation of funding for significant future infrastructure investments. FINANCING STRATEGY DEBENTURE Debenture financing involves taking out a loan to fund infrastructure needs at a fixed interest rate. It is a long term debt that is paid back over time according to a fixed payment schedule. Both corporations and governments frequently issue this type of bond in order to secure capital. USER FEES User fees are levies charged to the users of a good or service; this could include charges to users for admission, rentals, registrations and other fees at various facilities including arenas, pools and for the rental of community halls. A rate is typically used to determine the user fees, which may or may not be based on full cost recovery. PUBLIC PRIVATE PARTNERSHIPS The Public Private Partnership program, P3 Canada, is a federally funded program that aims to improve the delivery of infrastructure with contracts between the public sector and private parties. Public private partnerships are a long term approach to developing infrastructure that enhances the accountability of the private sector for infrastructure assets over their expected service lives. The private party assumes responsibility for the design, construction, financing and operation of the infrastructure. The public sector repays the operating and capital expenditures to the private party throughout the life of the infrastructure. This allows for a significant portion of the risk associated with infrastructure development to be passed over to the private party. Public private partnerships are not the right solution for all infrastructure developments; however they can provide many benefits when applied to the right projects. FEDERAL GAS TAX The Federal Gas Tax Fund (GTF) provides predictable, long term funding for municipalities to help build and revitalize infrastructure. Funding is provided twice a year to provinces and territories who then distribute this funding to their municipalities. Municipalities can pool, bank and borrow against this funding. Currently, federal GTF can be used for the following:
182 48 public transit wastewater infrastructure drinking water solid waste management community energy systems local roads and bridges GRANTS/RECOVERIES capacity building highways local and regional airports short-line rail short-sea shipping disaster mitigation broadband and connectivity brownfield redevelopment CULTURE TOURISM SPORT RECREATION This Asset Management Plan is intended to be used as a tool during capital grant application processes. Although grants may become available in the future, the sustainable funding plan cannot rely on awarded grants in order to balance the funding needs. FINANCING STRATEGY TAXATION Property taxes are levies on a property which are issued by the governing municipality in which the property is located. Two components make up the property tax calculation for Ontario Municipalities: The annual operating expenditure to provide services to residents; and The total current market value of the assessment base (property) over which the operating expenditure is to be recovered. The tax rate is determined by divided the annual operating expenditure by the total assessment value.

183 ANNUAL REVENUES The proposed 2016 funding for all revenues associated with the Township s recreational infrastructure have been summarized in Figure 5-8 and Figure 5-9. Figure 5-8 Proposed 2016 Funding Sources for Park Infrastructure Infrastructure Tax Levy, $55,256 Asset Replacement Reserve, $12,500 Other Reserve Funds, $37,744 FINANCING STRATEGY Grants: Provincial, Federal and Gas Tax, $100,000 Figure 5-9 Proposed 2016 Funding Sources for Recreational Facility Asset Replacement Reserve, $22,500 Other Reserve Funds, $61,450 Infrastructure Tax Levy, $154,243
Office of the Auditor General / Bureau du vérificateur général FOLLOW-UP TO THE 2010 AUDIT OF THE CITY S MANAGEMENT OF A LOAN AGREEMENT 2012 SUIVI DE
 Office of the Auditor General / Bureau du vérificateur général FOLLOW-UP TO THE 2010 AUDIT OF THE CITY S MANAGEMENT OF A LOAN AGREEMENT 2012 SUIVI DE LA VÉRIFICATION DE LA GESTION D UN CONTRAT DE PRÊT
TOWNSHIP OF RUSSELL ASSET MANAGEMENT PLAN WATER / WASTEWATER JUNE WSP 100 Commerce Valley Drive West Thornhill, ON L3T 0A1
 TOWNSHIP OF RUSSELL ASSET MANAGEMENT PLAN WATER / WASTEWATER JUNE 2017 WSP 100 Commerce Valley Drive West Thornhill, ON L3T 0A1 Contact: Kevin Morawski Email: kevin.morawski@wspgroup.com Phone +1 905-882-1100
Asset Management Plan
 2016 Asset Management Plan United Counties of Prescott and Russell 6/1/2016 Preface This Asset Management Plan is intended to describe the infrastructure owned, operated, and maintained by the United Counties
Office of the Auditor General / Bureau du vérificateur général FOLLOW-UP TO THE 2006 AUDIT OF THE WASTEWATER AND DRAINAGE SERVICES DIVISION 2010
 Office of the Auditor General / Bureau du vérificateur général FOLLOW-UP TO THE 2006 AUDIT OF THE WASTEWATER AND DRAINAGE SERVICES DIVISION 2010 SUIVI DE LA VÉRIFICATION DE LA DIVISION DES SERVICES DE
The City of Owen Sound Asset Management Plan
 The City of Owen Sound Asset Management Plan December 013 Adopted by Council March 4, 014 TABLE OF CONTENTS 1 EXECUTIVE SUMMARY... 1 INTRODUCTION....1 Vision.... What is Asset Management?....3 Link to
2. OFFICE OF THE AUDITOR GENERAL (OAG) RESPONSE TO THE QUALITY ASSURANCE REVIEW GENERAL
 RESPONSE TO THE QUALITY ASSURANCE REVIEW GENERAL") 6 COMITÉ DES FINANCES ET DU 2. OFFICE OF THE AUDITOR GENERAL (OAG) RESPONSE TO THE QUALITY ASSURANCE REVIEW GENERAL BUREAU DU VÉRIFICATEUR GÉNÉRAL (BVG) RÉPONSE À L EXAMEN D ASSURANCE QUALITÉ COMMITTEE
6 COMITÉ DES FINANCES ET DU 2. OFFICE OF THE AUDITOR GENERAL (OAG) RESPONSE TO THE QUALITY ASSURANCE REVIEW GENERAL BUREAU DU VÉRIFICATEUR GÉNÉRAL (BVG) RÉPONSE À L EXAMEN D ASSURANCE QUALITÉ COMMITTEE
Office of the Auditor General / Bureau du vérificateur général FOLLOW-UP TO THE 2007 AUDIT OF THE CORPORATE PESTICIDE USE POLICY 2009 SUIVI DE LA
 Office of the Auditor General / Bureau du vérificateur général FOLLOW-UP TO THE 2007 AUDIT OF THE CORPORATE PESTICIDE USE POLICY 2009 SUIVI DE LA VÉRIFICATION DE LA POLITIQUE DE LA VILLE CONCERNANT L UTILISATION
Office of the Auditor General / Bureau du vérificateur général FOLLOW-UP TO THE 2010 AUDIT OF THE REVENUE BRANCH 2012 SUIVI DE LA VÉRIFICATION DE LA
 Office of the Auditor General / Bureau du vérificateur général FOLLOW-UP TO THE 2010 AUDIT OF THE REVENUE BRANCH 2012 SUIVI DE LA VÉRIFICATION DE LA DIRECTION DES RECETTES DE 2010 Table of Contents EXECUTIVE
SIXTH SUPPLEMENT DATED 16 MARCH 2015 TO THE DEBT ISSUANCE PROGRAMME PROSPECTUS DATED 23 APRIL 2014
 SIXTH SUPPLEMENT DATED 16 MARCH 2015 TO THE DEBT ISSUANCE PROGRAMME PROSPECTUS DATED 23 APRIL 2014 TOTAL S.A., TOTAL CAPITAL, TOTAL CAPITAL CANADA LTD. and TOTAL CAPITAL INTERNATIONAL 26,000,000,000 (increased
Canadian securities regulation: Single regulator or the passport system?
 Canadian securities regulation: Single regulator or the passport system? A Speech by Ian C.W. Russell President and Chief Executive Officer Investment Industry Association To the Montréal Economic Institute
MUNICIPALITY OF CHATHAM-KENT CORPORATE SERVICES
 MUNICIPALITY OF CHATHAM-KENT CORPORATE SERVICES TO: FROM: Mayor and Members of Council Gerry Wolting, B. Math, CPA, CA General Manager, Corporate Services DATE: January 13, 2014 SUBJECT: 2013 Asset Management
THE ASSET MANAGEMENT PLAN FOR THE CITY OF NIAGARA FALLS
 THE ASSET MANAGEMENT PLAN FOR THE CITY OF NIAGARA FALLS 2013 THE CITY OF NIAGARA FALLS 4310 QUEEN STREET NIAGARA FALLS, ONTARIO, L2E 6X5 SUBMITTED DECEMBER 2013 BY PUBLIC SECTOR DIGEST 148 FULLARTON STREET,
2004 Report of the AUDITOR GENERAL to the Legislative Assembly
 2004 Report of the AUDITOR GENERAL to the Legislative Assembly Prince Edward Island TABLE OF CONTENTS SECTION INTRODUCTION PAGE 1. THE PROVINCE S FINANCES... 1 SPECIAL AUDITS AND EXAMINATIONS 2. INTRODUCTION
Report to the Legislative Assembly
 Report to the Legislative Assembly 2018 Office of the Auditor General 105 Rochford Street Charlottetown, Prince Edward Island C1A 7N8 www.assembly.pe.ca/auditorgeneral Table of Contents CHAPTER PAGE Introduction
Report to Committee of the Whole
 Report to Committee of the Whole To: Mayor Linton and Members of Council Prepared By: Dan Wilson, Managing Director of Corporate Services / Treasurer Report: COR2018-10 Date: 19 Mar 2018 RE: Asset Management
ASSET MANAGEMENT PLAN EXECUTIVE SUMMARY
 ASSET MANAGEMENT PLAN EXECUTIVE SUMMARY To ensure our municipal assets are maintained and renewed INDEX in a responsible and financially sustainable manner. 2016 INTRODUCTION Our first Asset Management
Township of Melancthon Asset Management Plan
 Township of Melancthon Asset Management Plan R.J. Burnside & Associates Limited 15 Townline Orangeville ON L9W 3R4 CANADA 300038690.2016 Township of Melancthon i Table of Contents Executive Summary 1.0
City of Welland. Comprehensive Asset Management Plan. GMBP File: January 13, Prepared By:
 Prepared By: City of Welland Comprehensive Asset Management Plan GMBP File: 614013 January 13, 2015 GUELPH OWEN SOUND LISTOWEL KITCHENER EXETER HAMILTON GTA 650 WOODLAWN RD. W., BLOCK C, UNIT 2, GUELPH
TABLE OF CONTENTS 1. THE PROVINCE S FINANCES... 1
 TABLE OF CONTENTS SECTION PAGE INTRODUCTION 1. THE PROVINCE S FINANCES... 1 SPECIAL AUDITS AND EXAMINATIONS 2. INTRODUCTION TO SPECIAL AUDITS AND EXAMINATIONS... 13 3. PROVINCIAL NOMINEE PROGRAM - IMMIGRANT
DEMANDE DE RENSEIGNEMENTS N O 1 D OPTION CONSOMMATEURS (OC) À HYDRO-QUÉBEC DISTRIBUTION (HQD) ET CONCENTRIC ENERGY ADVISORS (CEA)
 À HYDRO-QUÉBEC DISTRIBUTION (HQD) ET CONCENTRIC ENERGY ADVISORS (CEA)") Page 1 de 6 DEMANDE DE RENSEIGNEMENTS N O 1 D OPTION CONSOMMATEURS (OC) À HYDRO-QUÉBEC DISTRIBUTION (HQD) ET CONCENTRIC ENERGY ADVISORS (CEA) IMPLANTATION D UN MÉCANISME DE RÉGLEMENTATION INCITATIVE (MRI)
Page 1 de 6 DEMANDE DE RENSEIGNEMENTS N O 1 D OPTION CONSOMMATEURS (OC) À HYDRO-QUÉBEC DISTRIBUTION (HQD) ET CONCENTRIC ENERGY ADVISORS (CEA) IMPLANTATION D UN MÉCANISME DE RÉGLEMENTATION INCITATIVE (MRI)
TABLE OF CONTENTS 1. THE PROVINCE S FINANCES... 1
 TABLE OF CONTENTS SECTION PAGE INTRODUCTION 1. THE PROVINCE S FINANCES... 1 SPECIAL AUDITS AND EXAMINATIONS 2. INTRODUCTION TO SPECIAL AUDITS AND EXAMINATIONS... 13 3. SPECIAL EDUCATION - EASTERN SCHOOL
Water System Financial Plan Corporation of the Town of Hawkesbury
 Water System Financial Plan Corporation of the Town of Hawkesbury June 6, 2014 Prepared by Chantal McLean-Leroux, CPA, CA Treasurer for the Town of Hawkesbury TABLE OF CONTENTS 1. INTRODUCTION... 1 1.1
THIRD SUPPLEMENT TO THE BASE PROSPECTUS DATED 3 SEPTEMBER RCI BANQUE (incorporated in France as a "société anonyme")
") THIRD SUPPLEMENT TO THE BASE PROSPECTUS DATED 3 SEPTEMBER 2018 RCI BANQUE (incorporated in France as a "société anonyme") 23,000,000,000 EURO MEDIUM TERM NOTE PROGRAMME This third supplement (the "Supplement")
THIRD SUPPLEMENT TO THE BASE PROSPECTUS DATED 3 SEPTEMBER 2018 RCI BANQUE (incorporated in France as a "société anonyme") 23,000,000,000 EURO MEDIUM TERM NOTE PROGRAMME This third supplement (the "Supplement")
AMP2016. County of Grey. The 2016 Asset Management Plan for the. w w w. p u b l i c s e c t o r d i g e s t. c o m
 AMP2016 w w w. p u b l i c s e c t o r d i g e s t. c o m The 2016 Asset Management Plan for the County of Grey SUBMITTED BY THE PUBLIC SECTOR DIGEST INC. (PSD) WWW.PUBLICSECTORDIGEST.COM JULY 2017 Contents
Report to Rapport au: Finance and Economic Development Committee Comité des finances et du développement économique 5 December 2017 / 5 décembre 2017
 1 Report to Rapport au: Finance and Economic Development Committee Comité des finances et du développement économique 5 December 2017 / 5 décembre 2017 and Council et au Conseil 13 December 2017 / 13 décembre
MUNICIPALITY OF MISSISSIPPI MILLS. plan. December, 2016
 MUNICIPALITY OF MISSISSIPPI MILLS plan December, 2016 PREFACE This Asset Management Plan is intended to describe the infrastructure owned, operated and maintained by the Municipality of Mississippi Mills
******************************** ******************************** ******************************** ********************************
 Page 1 of 15 ACIG/IGUA-APGQ/QOGA - 1 Note : Les questions qui suivent s'adressent en premier lieu à 1'APGQ. Toutefois, veuillez considérer les questions qui portent sur la réalité spécifique des producteurs
AMP2016. i t r i g e s t. c o w w w. p u b l i c s e c t o r d i g e s t. c o m. The 2016 Asset Management Plan for the Township of Hamilton
 AMP2016 i t r i g e s t. c o w w w. p u b l i c s e c t o r d i g e s t. c o m The 2016 Asset Management Plan for the Township of Hamilton SUBMITTED BY THE PUBLIC SECTOR DIGEST INC. (PSD) WWW.PUBLICSECTORDIGEST.COM
Town of Huntsville Municipal Asset Management Plan
 Town of Huntsville Municipal Asset Management Plan Adopted by Council (Resolution 470-13) December 20, 2013 1 P a g e Table of Contents Executive Summary... 3 Introduction... 4 State of Local Infrastructure...
Office of the Auditor General / Bureau du vérificateur général AUDIT OF THE CITY OF OTTAWA WATER RATE 2008
 Office of the Auditor General / Bureau du vérificateur général AUDIT OF THE CITY OF OTTAWA WATER RATE 2008 VÉRIFICATION DE LA REDEVANCE D EAU DE LA VILLE D OTTAWA 2008 Table of Contents EXECUTIVE SUMMARY...
... O N T A R I O L I M I T E D
 Page: 1 For Ministry Use Only À l'usage exclusif du ministère Ontario Corporation Number Numéro de la société en Ontario This BCA Form 1 submission was accepted for filing by the Companies and Personal
First Supplement dated 6 November to the Euro Medium Term Note Programme Base Prospectus dated 2 August 2017 BNP PARIBAS
 First Supplement dated 6 November 2017 to the Euro Medium Term Note Programme Base Prospectus dated 2 August 2017 BNP PARIBAS (incorporated in France) (as Issuer) 90,000,000,000 EURO MEDIUM TERM NOTE PROGRAMME
FIRST SUPPLEMENT DATED 11 AUGUST 2017 TO THE BASE PROSPECTUS DATED 6 JULY Euro 45,000,000,000 Euro Medium Term Note Programme
 FIRST SUPPLEMENT DATED 11 AUGUST 2017 TO THE BASE PROSPECTUS DATED 6 JULY 2017 Euro 45,000,000,000 Euro Medium Term Note Programme This first supplement (the First Supplement ) is supplemental to, and
BNP Paribas Issuance B.V. BNP Paribas
 Second Supplement dated 25 September 2018 to the Base Prospectus for the issue of Certificates dated 5 June 2018 BNP Paribas Issuance B.V. (incorporated in The Netherlands) (as Issuer) BNP Paribas (incorporated
... O N T A R I O L I M I T E D
 Page: 1 For Ministry Use Only À l'usage exclusif du ministère Ontario Corporation Number Numéro de la société en Ontario This BCA Form 1 submission was accepted for filing by the Companies and Personal
Asset Management Plan 2016 Township of King
 Asset Management Plan 206 Township of King GHD Allstate Parkway Suite 30 Markham Ontario L3R 9T8 T 905 752 4300 F 905 752 430 5432 Table of Contents. 2. 3. 4. 5. 6. Executive Summary. Introduction.2 State
FIRST SUPPLEMENT DATED 6 AUGUST 2018 TO THE DEBT ISSUANCE PRO GRAMME PRO SPECTUS DATED 9 MAY 2018
 FIRST SUPPLEMENT DATED 6 AUGUST 2018 TO THE DEBT ISSUANCE PRO GRAMME PRO SPECTUS DATED 9 MAY 2018 TO TAL S.A., TO TAL CAPITAL, TO TAL CAPITAL CANADA LTD. and TO TAL CAPITAL INTERNATIO NAL 35,000,000,000
Norfolk County Asset Management Plan Roads
 Norfolk County Asset Management Plan Roads An overview of the County s Asset Management Practices based on the Ontario Ministry of Infrastructure s Building Together Initiative Prepared for: Norfolk County
Communiqué de presse sur les résultats financiers
 CREDIT SUISSE GROUP AG Paradeplatz 8 Téléphone +41 844 33 88 44 Case postale Téléfax +41 44 333 88 77 CH-8070 Zurich media.relations@credit-suisse.com Suisse Communiqué de presse sur les résultats financiers
La CSFO publie une ébauche de la ligne directrice sur le traitement équitable des consommateurs
 La CSFO publie une ébauche de la ligne directrice sur le traitement équitable des consommateurs 17 avril 2018 Stuart S. Carruthers, Andrew S. Cunningham Le 3 avril 2018, l autorité provinciale des services
Alerte de votre conseiller Point de vue sur les IFRS Classement des emprunts comportant des clauses restrictives
 Alerte de votre conseiller Point de vue sur les IFRS Classement des emprunts comportant des clauses restrictives Février 2016 Aperçu L équipe IFRS de Grant Thornton International a publié le document IFRS
Report to/rapport au : Agriculture and Rural Affairs Committee Comité de l'agriculture et des affaires rurales. and Council / et au Conseil
 Report to/rapport au : Agriculture and Rural Affairs Committee Comité de l'agriculture et des affaires rurales and Council / et au Conseil June 25, 2012 Le 25 juin 2012 Submitted by/soumis par : Steve
Certificate of Incorporation Certificat de constitution
 Request ID: 012596000 Province of Ontario Date Report Produced: 2010/10/15 Demande n o : Province de l Ontario Document produit le: Transaction ID: 042560977 Ministry of Government Services Time Report
SUPPLEMENT N 2 DATED 25 JANUARY 2017 TO THE BASE PROSPECTUS DATED 27 JULY 2016 CRÉDIT MUTUEL ARKÉA 13,000,000,000 EURO MEDIUM TERM NOTE PROGRAMME
 SUPPLEMENT N 2 DATED 25 JANUARY 2017 TO THE BASE PROSPECTUS DATED 27 JULY 2016 CRÉDIT MUTUEL ARKÉA 13,000,000,000 EURO MEDIUM TERM NOTE PROGRAMME This supplement (the Second Supplement ) is supplemental
Asset Management Investment Plan
 Asset Management Plan Prepared for the City of Kimberley 304-1353 Ellis Street Kelowna, BC, V1Y 1Z9 T: 250.762.2517 F: 250.763.5266 June 2016 File: 1162.0014.01 A s s e t M a n a g e m e n t I n v e s
Palos Weekly Commentary
 To subscribe to our Newsletters /register CONTENTS Important Reminder to Contribute 1 Rappel important pour cotiser 2 Palos Funds vs. Benchmarks (Total Returns) 3 Disclaimer 4 Contacts 5 Important Reminder
ORANGE EUR 30,000,000,000 Euro Medium Term Note Programme
 Supplement dated 31 July 2018 to the base prospectus dated 26 June 2018 ORANGE EUR 30,000,000,000 Euro Medium Term Note Programme This supplement (the Supplement ) is supplemental to, and should be read
Municipal Asset Management Plans
 Municipal Asset Management Plans AMCTO Webinar October 12, 2012 Agenda Introduction Municipal Infrastructure Investment Initiative Asset Management Scoping Asset Management Approaches State of Local Infrastructure
FIRST SUPPLEMENT DATED 31 AUGUST 2015 TO THE BASE PROSPECTUS DATED 24 JULY 2015
 FIRST SUPPLEMENT DATED 31 AUGUST TO THE BASE PROSPECTUS DATED 24 JULY Crédit Mutuel-CIC Home Loan SFH (société de financement de l'habitat duly licensed as a French specialised credit institution) 30,000,000,000
Do Liquidity Proxies Measure Liquidity in Canadian Bond Markets?
 Staff Analytical Note/Note analytique du personnel 2017-23 Do Liquidity Proxies Measure Liquidity in Canadian Bond Markets? by Jean-Sébastien Fontaine, 1 Jeffrey Gao, 2 Jabir Sandhu 1 and Kobe Wu 1 Financial
Archived Content. Contenu archivé
 ARCHIVED - Archiving Content ARCHIVÉE - Contenu archivé Archived Content Contenu archivé Information identified as archived is provided for reference, research or recordkeeping purposes. It is not subject
THE STATE OF ONTARIO S ROADS AND BRIDGES AN ANALYSIS OF 93 MUNICIPALITIES
 THE STATE OF ONTARIO S ROADS AND BRIDGES AN ANALYSIS OF 93 MUNICIPALITIES 2015 Prepared for the Association of Municipalities of Ontario IN TE LLIGE NCE FOR THE PUB LIC SEC TOR. About The Public Sector
South Huron Asset Management Program. Spending the right amount of money, on the right assets, at the right time
 South Huron Asset Management Program Spending the right amount of money, on the right assets, at the right time Current Asset Management Plan Identifies all asset classes with condition data mainly for
Alerte de votre conseiller Point de vue sur les IFRS Comptabilisation des fonds détenus au nom de clients
 Alerte de votre conseiller Point de vue sur les IFRS Comptabilisation des fonds détenus au nom de clients Octobre 2018 Aperçu L équipe IFRS de Grant Thornton International a publié IFRS Viewpoint Accounting
AMP2016. w w w. p u b lii c s e ctt orr di igg ee sst t.. cco o m. The 2016 Asset Management Plan for the Municipality of Grey Highlands
 AMP2016 w w w. p u b lii c s e ctt orr di igg ee sst t.. cco o m The 2016 Asset Management Plan for the Municipality of Grey Highlands SUBMITTED BY THE PUBLIC SECTOR DIGEST INC. (PSD) WWW.PUBLICSECTORDIGEST.COM
ASSET MANAGEMENT PLAN. HEMSON C o n s u l t i n g L t d. 30 Saint Patrick Street, Suite 1000 Toronto, ON, M5T 3A3
 ASSET MANAGEMENT PLAN C o n s u l t i n g L t d. 30 Saint Patrick Street, Suite 1000 Toronto, ON, M5T 3A3 March 2017 TABLE OF CONTENTS EXECUTIVE SUMMARY... 1 A. STATE OF THE LOCAL INFRASTRUCTURE... 1 B.
CLHIA OPENING REMARKS
 CLHIA OPENING REMARKS TO THE HOUSE OF COMMONS STANDING COMMITTEE ON HEALTH APPEARANCE ON PHARMACARE OCTOBER 19, 2017 Merci, Monsieur le Président. Je suis Stephen Frank, président et chef de la direction
A Practical Approach to Establishing Margins for Adverse Deviations in Going Concern Funding Valuations
 Member s Paper A Practical Approach to Establishing Margins for Adverse Deviations in Going Concern Funding Valuations By Chun-Ming (George) Ma, PhD, FCIA, FSA Any opinions expressed in this paper are
8. BIRCH HILL TELECOM CORPORATION MUNICIPAL ACCESS AGREEMENT ENTENTE D ACCES AUX ROUTES MUNICIPALES BIRCH HILL TELECOM CORPORATION
 132 COMITÉ DES FINANCES ET DU 8. BIRCH HILL TELECOM CORPORATION MUNICIPAL ACCESS AGREEMENT ENTENTE D ACCES AUX ROUTES MUNICIPALES BIRCH HILL TELECOM CORPORATION COMMITTEE RECOMMENDATION That Council approve
Convention-cadre sur les changements climatiques
 NATIONS UNIES Convention-cadre sur les changements climatiques Distr. LIMITÉE FCCC/SBI/2008/L.11 12 juin 2008 FRANÇAIS Original: ANGLAIS ORGANE SUBSIDIAIRE DE MISE EN ŒUVRE Vingt-huitième session Bonn,
COUNTY OF LAMBTON ASSET MANAGEMENT PLAN 2013
 COUNTY OF LAMBTON ASSET MANAGEMENT PLAN 2013 Pictures Key Front Cover Top Row 1) Administration Building Second Row, left to right 2) Brigden EMS Station 3) Judith & Norman Alix Art Gallery Third row,
First Supplement dated 5 October 2017 to the Euro Medium Term Note Programme Base Prospectus dated 14 September 2017
 First Supplement dated 5 October 2017 to the Euro Medium Term Note Programme Base Prospectus dated 14 September 2017 HSBC France 20,000,000,000 Euro Medium Term Note Programme This first supplement (the
City of Markham Asset Management Plan
 2016 City of Markham Asset Management Plan Table of Content 1. Executive Summary...4 2. Introduction...7 2.1 Provincial Guidelines on Asset Management Plans...7 2.2 City of Markham Goals / Strategic Plan...7
REGULATION TO AMEND REGULATION RESPECTING MUTUAL FUNDS. Section 1.1 of Regulation respecting Mutual Funds is amended:
 REGULATION TO AMEND REGULATION 81-102 RESPECTING MUTUAL FUNDS Securities Act (RSQ, c V-11, s 3311, par, (3), (11), (16), (17) and (34)) 1 Section 11 of Regulation 81-102 respecting Mutual Funds is amended:
Strategic Asset Management Policy
 Strategic Asset Management Policy Submission Date: 2018-04-24 Approved by: Council Approval Date: 2018-04-24 Effective Date: 2018-04-24 Resolution Number: Enter policy number. Next Revision Due: Enter
Alerte de votre conseiller États financiers consolidés intermédiaires types 2018
 Alerte de votre conseiller États financiers consolidés intermédiaires types 2018 À propos de Raymond Chabot Grant Thornton Juin 2018 Vue d ensemble L équipe des IFRS de Grant Thornton International a publié
S Opening of the meeting Mayor Ranger opens the meeting and welcomes all in attendance.
 Minutes of a special meeting to present and adopt the 2016 budget. Meeting held on December 14 th 2015 at 4:30P.M. at the usual place. Under chairmanship of her worship Mayor Mrs.Doris Ranger the following
Recommendations Outstanding from Previous Audits. Office of the Auditor General - Responsibilities and Operations
 Table of Contents CHAPTER PAGE Introduction Special Audits and Examinations 1. Introduction to Special Audits and Examinations...1 2. Information Technology - Governance and IT Contracting...3 3. Diabetes
ANNEXE D* MANDATS DE GESTION DES PRODUITS DE GESTION EN GESTION DISTINCTE
 Mise à jour le 1 er janvier 2009 Mise à jour le 1 er mars 2009 Mise à jour le 1 er décembre 2009 Mise à jour le 1 er décembre 2010 Mise à jour le 1 er avril 2011 Mise à jour le 1 er mars 2013 Mise à jour
Devolving authority for health care in Canada s provinces: 2. Backgrounds, resources and activities of board members
 Devolving authority for health care in Canada s provinces: 2. Backgrounds, resources and activities of board members Education Éducation Jonathan Lomas, MA; Gerry Veenstra, MA; John Woods, BSc Abstract
IMPLANTATION D UN MÉCANISME DE RÉGLEMENTATION INCITATIVE (MRI) PHASE 3 R Inflation factor I
 PHASE 3 R Inflation factor I") Page 1 de 6 DEMANDE DE RENSEIGNEMENTS N O 1 D OPTION CONSOMMATEURS (OC) À PACIFIC ECONOMICS GROUP (PEG) IMPLANTATION D UN MÉCANISME DE RÉGLEMENTATION INCITATIVE (MRI) PHASE 3 R-4011-2017 Inflation factor
Page 1 de 6 DEMANDE DE RENSEIGNEMENTS N O 1 D OPTION CONSOMMATEURS (OC) À PACIFIC ECONOMICS GROUP (PEG) IMPLANTATION D UN MÉCANISME DE RÉGLEMENTATION INCITATIVE (MRI) PHASE 3 R-4011-2017 Inflation factor
TABLE OF CONTENTS 1. THE PROVINCE S FINANCES... 1
 TABLE OF CONTENTS SECTION PAGE INTRODUCTION 1. THE PROVINCE S FINANCES... 1 SPECIAL AUDITS AND EXAMINATIONS 2. INTRODUCTION TO SPECIAL AUDITS AND EXAMINATIONS... 13 3. IMPLEMENTATION OF THE ELECTRONIC
The Tax Information, Exchange Agreement between France and Jersey. in force as of 11th October, 2010
 The Tax Information, Exchange Agreement between France and Jersey in force as of 11th October, 2010 Date: valid as at 28 th December, 2010 This short article is a summary of certain, not all, advantages
BNP Paribas Issuance B.V. BNP Paribas
 Third Supplement dated 22 November 2018 to the Base Prospectus for the issue of Certificates dated 5 June 2018 BNP Paribas Issuance B.V. (formerly BNP Paribas Arbitrage Issuance B.V.) (incorporated in
perthcounty_amp2_d The Asset Management Plan for the County of Perth October 2016
 The Asset Management Plan for the County of Perth October 2016 1 Content Executive Summary... 8 I. Introduction & Context... 9 II. Asset Management...10 III. AMP Objectives and Content...11 IV. Data and
TOWN OF COLLINGWOOD ASSET MANAGEMENT PLAN
 TOWN OF COLLINGWOOD ASSET MANAGEMENT PLAN JUNE 24, 2014 EXECUTIVE SUMMARY CONTENTS Page (i) 1. INTRODUCTION 1.1 Overview 1-1 1.2 Plan Development 1-1 1.3 Maintaining the Asset Management Plan 1-2 1.4
NOVEMBER 2 6 NOVBfBR? 2WS
 For Ministry Use Only A I'usage exclusif du ministere Numero de la societe en Ontario NOVEMBER 2 6 NOVBfBR? 2WS Form 3 Business Corporations Act Formule 3 Loi sur les societes par actions ARTICLES OF AMENDMENT
European Savings Directive 2003/48/EC
 European Savings Directive 2003/48/EC Information The ALFI Taxation of Savings Working Group was asked to look at practical ways in which some of the provisions of the European Savings Directive 2003/48/EC
Using Reserves and Reserve Fund Strategies to meet your challenging needs ahead!
 Using Reserves and Reserve Fund Strategies to meet your challenging needs ahead! MFOA, ON September 22, 2016 Dean Decaire, CPA, CA Audit Client Service Partner Joe Filippelli Advisory Services Senior Manager
Archived Content. Contenu archivé
 ARCHIVED - Archiving Content ARCHIVÉE - Contenu archivé Archived Content Contenu archivé Information identified as archived is provided for reference, research or recordkeeping purposes. It is not subject
I have the honour of presenting for your consideration, the Annual Report of Manitoba Finance for the fiscal year ended March 31, 2011.
 2 4 Deputy Minister of Finance Room 109, Legislative Building, Manitoba, Canada R3C 0V8 www.manitoba.ca Honourable Rosann Wowchuk Minister of Finance 103 Legislative Building Winnipeg, Manitoba R3C 0V8
PRÉLÈVEMENTS 2018 DES OFFICES DE PROTECTION DE LA NATURE
 5 COMITÉ DES FINANCES ET DU 2. CONSERVATION AUTHORITIES 2018 LEVIES PRÉLÈVEMENTS 2018 DES OFFICES DE PROTECTION DE LA NATURE COMMITTEE RECOMMENDATION That Council approve the 2018 levies for the Rideau
PREPARING YOUR REPORT FOR THE YEAR 2013
 PREPARING YOUR REPORT FOR THE YEAR 2013 Public Sector Salary Disclosure Act GUIDE TABLE OF CONTENTS Introduction... 3 Important Reminder... 4 Definition of Salary Reporting Requirements Reporting Deadlines
ATTORNEY GENERAL OF CANADA. and ASSOCIATION OF JUSTICE COUNSEL ASSOCIATION OF JUSTICE COUNSEL. and ATTORNEY GENERAL OF CANADA
 Federal Court Cour fédérale Date: 20110506 Docket: T-2179-09 Citation: 2011 FC 530 Ottawa, Ontario, May 6, 2011 PRESENT: The Honourable Mr. Justice O'Keefe BETWEEN: ATTORNEY GENERAL OF CANADA Applicant
CORPORATION OF THE TOWNSHIP OF MALAHIDE. Consolidated Financial Statements
 CORPORATION OF THE TOWNSHIP OF MALAHIDE Consolidated Financial Statements December 31, 2015 Consolidated Financial Statements Table of Contents PAGE Independent Auditors' Report 1 Consolidated Statement
ANNEXE I. Gazifère Inc. Modifications du Tarif 200 avec commentaires Ajustement du coût du gaz
 ANNEXE I Gazifère Inc. Modifications du Tarif 200 avec commentaires Ajustement du coût du gaz Impact on Rate 200 from EB-2017-0181 July 1, 2017 QRAM Enbridge Gas Distribution ( EGD ) is proposing the following
Part 2 GAZETTE OFFICIELLE DU QUÉBEC, November 20, 1996, Vol. 128, No An Act to amend the Taxation Act and other legislative provisions
 Part 2 GAZETTE OFFICIELLE DU QUÉBEC, November 20, 1996, Vol. 128, No. 47 4449 NATIONAL ASSEMBLY SECOND SESSION THIRTY-FIFTH LEGISLATURE Bill 8 (1996, chapter 39) An Act to amend the Taxation Act and other
CANTON DE RUSSELL COMITÉ PLÉNIER ORDRE DU JOUR TOWNSHIP OF RUSSELL COMMITTEE OF THE WHOLE AGENDA
 TOWNSHIP OF RUSSELL COMMITTEE OF THE WHOLE AGENDA December 8, 2014 5:00 p.m. Gaston R. Patenaude Hall 717 Notre-Dame Street Embrun, ON CANTON DE RUSSELL COMITÉ PLÉNIER ORDRE DU JOUR Le 8 décembre 2014
PROSPECTUS SUPPLEMENT N 1 DATED 21 SEPTEMBER 2016 TO THE BASE PROSPECTUS DATED 29 JUNE 2016
 PROSPECTUS SUPPLEMENT N 1 DATED 21 SEPTEMBER 2016 TO THE BASE PROSPECTUS DATED 29 JUNE 2016 ARKÉA HOME LOANS SFH (duly licensed French specialised credit institution) 10,000,000,000 COVERED BOND PROGRAMME
CORPORATION OF THE TOWNSHIP OF ADELAIDE METCALFE. Financial Statements. December 31, 2016
 CORPORATION OF THE TOWNSHIP OF ADELAIDE METCALFE Financial Statements December 31, 2016 Financial Statements Table of Contents PAGE Independent Auditors' Report 1 Statement of Financial Position 2 Statement
THE DISTRICT OF MUSKOKA ASSET MANAGEMENT PLAN FOR ROADS, BRIDGES, WATER AND WASTEWATER ASSETS
 THE DISTRICT OF MUSKOKA ASSET MANAGEMENT PLAN FOR ROADS, BRIDGES, WATER AND WASTEWATER ASSETS MAY 29, 2014 EXECUTIVE SUMMARY CONTENTS Page (i) 1. INTRODUCTION 1.1 Overview 1-1 1.2 Plan Development 1-1
Alerte de votre conseiller Point de vue sur les IFRS Comptabilisation des cryptomonnaies les bases
 Alerte de votre conseiller Point de vue sur les IFRS Comptabilisation des cryptomonnaies les bases Mai 2018 Aperçu L équipe IFRS de Grant Thornton International a publié IFRS Viewpoint Accounting for cryptocurrencies
SEAH STEEL CORPORATION. and
 Date: 20170829 Docket: A-178-15 Citation: 2017 FCA 172 CORAM: WEBB J.A. DE MONTIGNY J.A. WOODS J.A. BETWEEN: SEAH STEEL CORPORATION Applicant and EVRAZ INC. NA CANADA, ALGOMA TUBES INC., PRUDENTIAL STEEL
DISPOSITIONS PARTICULIÈRES APPLICABLES DE "THE PENSION PLAN FOR THE EMPLOYEES OF LAURIER LIFE HOLDINGS LIMITED AND ITS ASSOCIATED COMPANIES"
 ANNEXE VII-M DISPOSITIONS PARTICULIÈRES APPLICABLES AUX PARTICIPANTS EN DATE DU 1 ER JANVIER 2001 DE "THE PENSION PLAN FOR THE EMPLOYEES OF LAURIER LIFE HOLDINGS LIMITED AND ITS ASSOCIATED COMPANIES" Partie
Jeudi, 1б mai I963 at 9*30 a.m. à 9 h. 30 Palais des Nations. Palais des Nations Geneva
 WORLD HEALTH ORGANIZATION ORGANISATION MONDIALE DE LA SANTE SIXTEENTH WORLD HEALTH ASSEMBLY SEIZIEME ASSEMBLEE MONDIALE DE LA SANTE a i 6/v r / i o 16 May I963 \\ 16 mai 1963 Provisional Verbatim Record
That the report from the Director of Finance regarding the Strategic Asset Management Policy, dated June 20, 2018, be received; and
 Staff Report To: From: Mayor and Council Jeff Schmidt, Director of Finance Date: June 20, 2018 Subject: Strategic Asset Management Policy Report Highlights Provincial regulation (O.Reg. 588/17 - Asset
INTERIM FOLLOW-UP OF THE 2008 AUDIT OF THE PARKING FUNCTION SUIVI INTÉRIMAIRE DE LA VÉRIFICATION DE LA FONCTION STATIONNEMENT DE 2008
 Office of the Auditor General / Bureau du vérificateur général INTERIM FOLLOW-UP OF THE 2008 AUDIT OF THE PARKING FUNCTION 2009 SUIVI INTÉRIMAIRE DE LA VÉRIFICATION DE LA FONCTION STATIONNEMENT DE 2008
AUGUST 1 3 AOCIT, 2012
 For Ministry Use Only A ('usage exciusif du ministere, Ministry of Government Services pp Ontario CERTIFICATE This is to certify that these articles are effective on Minister des Services gekwe/nenientaux
IMPLANTATION D UN MÉCANISME DE RÉGLEMENTATION INCITATIVE (MRI) PHASE 3 R Inflation factor I
 PHASE 3 R Inflation factor I") Page 1 of 8 DEMANDE DE RENSEIGNEMENTS N O 1 D OPTION CONSOMMATEURS (OC) À PACIFIC ECONOMICS GROUP (PEG) IMPLANTATION D UN MÉCANISME DE RÉGLEMENTATION INCITATIVE (MRI) PHASE 3 R-4011-2017 Inflation factor
Page 1 of 8 DEMANDE DE RENSEIGNEMENTS N O 1 D OPTION CONSOMMATEURS (OC) À PACIFIC ECONOMICS GROUP (PEG) IMPLANTATION D UN MÉCANISME DE RÉGLEMENTATION INCITATIVE (MRI) PHASE 3 R-4011-2017 Inflation factor
ORANGE EUR 30,000,000,000 Euro Medium Term Note Programme
 Supplement dated 1 August 2016 to the base prospectus dated 29 June 2016 ORANGE EUR 30,000,000,000 Euro Medium Term Note Programme This supplement (the Supplement ) is supplemental to, and should be read