Population Projections for Korea (2015~2065)
|
|
|
- Megan Primrose George
- 5 years ago
- Views:
Transcription
1 Population Projections for Korea (2015~2065) Ⅰ. Results 1. Total population and population rate According to the medium scenario, the total population is projected to rise from 51,010 thousand persons in 2015 to 52,960 thousand persons in Afterwards, the total population is projected to record 43,020 thousand persons in According to the high scenario (assuming a high total fertility rate, a high life expectancy at birth and a high-level net international migration), the total population is projected to drop to 49,980 thousand persons in 2065 after recording a peak of 55,420 thousand persons in According to the low scenario (assuming a low total fertility rate, a low life expectancy at birth and a low-level net international migration), the total population is projected to drop to 36,660 thousand persons in 2065 after recording a peak of 51,680 thousand persons in The annual population rate is projected to decrease from 0.53 percent in Beginning a minus population rate in 2032, the annual population rate will reach percent in [ Table 1 ] Total population ( ) Indicator Scenario Medium Total population 2,870 3,528 4,081 4,509 4,818 5,101 5,261 5,283 5,105 4,743 4,302 (10 thousand High 5,101 5,360 5,530 5,495 5,280 4,998 persons) Low 5,101 5,163 5,040 4,724 4,235 3,666 Medium Population rate (%) High Low Demographic variations (Birth, death and international migration) The number of births would drop from 430 thousand persons in 2015 to 360 thousand persons in 2035 and 260 thousand persons in Under the high scenario, the number of births would record 390 thousand persons in Under the low scenario, the number of births would record 160 thousand persons in The number of deaths would rise from 280 thousand persons in 2015 to over 400 thousand persons in 2028 and 740 thousand persons in The figure for 2065 is 2.7 times higher compared to Under the high scenario, the number of deaths would mark 760 thousand persons in 2065.
2 - Under the low scenario, the number of deaths would mark 720 thousand persons in The natural increase (Birth - Death) would be minus between 2022 and Under the medium assumption, the population is projected to begin recording a minus natural increase rate from Under the high assumption, the population is projected to begin recording a minus natural increase rate from Under the low assumption, the population is projected to begin recording a minus natural increase rate from The age of recording the highest number of deaths for both males and females is projected to rise by more than 8 years for the next 5 decades. - The age of recording the highest number of deaths is projected to go up from 78 years for males and 85 years for females in 2015 to 90 years for males and 93 years for females in This figure rises by 12 years for males and 8 years for females. The number of net international migration would decrease from 80 thousand persons in 2015 to 30 thousand persons after Under the high scenario, the net international migration would decrease from 120 thousand persons in 2016 to 70~80 thousand persons after Under the low scenario, the net international migration would remain between - 10 thousand persons and 10 thousand persons after [ Table 2 ] Natural increase and net international migration ( ) (Unit: 10 thousand persons) Classification Scenario Population (=A+B) Natural increase (A) Birth Death International migration (B) Medium High Low Medium High Low Medium High Low Medium High Low Medium High Low Note) Data between July of the reference year and June of the following year The drop in births and the rise in the aged population lead to the increase in deaths. The rise in deaths would bring about a continuous drop in the population after The plus net international migration is projected to reduce a decreasing trend in the total population. - The population rate (-1.6 persons) during the period stems from the natural increase rate of -2.2 persons and the net international migration of 0.6 person.
3 - The decrease in the population (-10,380 thousand persons) during the period stems from the natural increase (Birth - Death, -11,520 thousand persons (111%) and plus net international migration (1,140 thousand persons, -11%). [ Table 3 ] Population rate by year and analysis of population Population rate Population (10 thousand persons) and (per 1,000 population) contribution (%) Scenario Classification Population Contribution Population Contribution Population (A-B+C) , Natural increase Medium (A-B) , Birth (A) ,040 Death (B) ,192 Net international migration (C) Population (A-B+C) Natural increase High Low (A-B) Birth (A) ,384 Death (B) ,167 Net international migration (C) Population (A-B+C) , Natural increase (A-B) , Birth (A) Death (B) ,225 Net international migration (C) Note) Population rate = Birth rate - Death rate + Net international migration rate 3. Population by age group As of 2015, the working age population aged 15 to 64 records 37,440 thousand persons, which accounts for 73.4 percent of the total population. The elderly population aged 65 or more records 6,540 thousand persons, which accounts for 12.8 percent of the total population. The child population aged 0 to 14 records 7,030 thousand persons, which accounts for 13.8 percent of the total population. - In 2065, the working age population, the elderly population and the child population are projected to occupy 47.9 percent, 42.5 percent and 9.6 percent, respectively. The working age population is projected to decrease to 20,620 thousand persons (47.9%) in 2065 after recording a peak of 37,630 thousand persons in Under the high scenario, the working age population is projected to fall to 24,520 thousand persons (49.1%) in 2065 after recording a peak of 37,660 thousand persons in 2017.
4 - Under the low scenario, the working age population is projected to drop to 17,000 thousand persons (46.4%) in 2065 after recording a peak in Under all medium, high and low scenarios, the elderly population is projected to exceed the child population from Compared to 6,540 thousand persons (12.8%) in 2015, the elderly population is projected to rise by 2.3 times in 2035 and 2.8 times to 18,270 thousand persons (42.5%) in The super elderly population aged 85 or more is projected to increase from 510 thousand persons in 2015, exceeding 1,000 thousand persons in Compared to 2015, the super elderly population is projected to increase by 10 times to 5,050 thousand persons in The child population is projected to decrease to 7,030 thousand persons (13.8%) in 2015, 5,980 thousand persons (11.3%) in 2035 and 4,130 thousand persons (9.6%) in The school age population (people aged 6 to 21 years) is predicted to record 8,920 thousand persons in 2015, decreasing to 1,840 thousand persons for the next decade. 4. Median age The median age is predicted to mark 40.9 years in 2015, exceeding 50 years in This figure is predicted to rise to 59.0 years in 2061, falling to 58.7 years in According to both high and low assumptions, the median age is predicted to rise. Under the high assumption, the median age is expected to exceed 50 years in 2035, reaching 54.9 years in [ Table 4 ] Median age ( ) (Unit: year) Classification Sex Total Medium Males Females Total High Males Females Total Low Males Females Dependency ratio and aging index The total dependency ratio is projected to increase from 36.2 persons per 100 working age population in 2015, exceeding 70 persons in This figure is projected to exceed 100 persons in Under the high scenario, the total dependency ratio is projected to rise to persons in Under the low scenario, the total dependency ratio is projected to rise to persons in The child dependency ratio is projected to slightly rise from 18.8 persons in 2015 to 20.0 persons in 2065 as both the child population and the working age population drop.
 is projected to exceed 100 persons in 2017 after recording 93.1 persons in 2015. The ageing index is projected to mark 203 persons in 2029 and 442.")
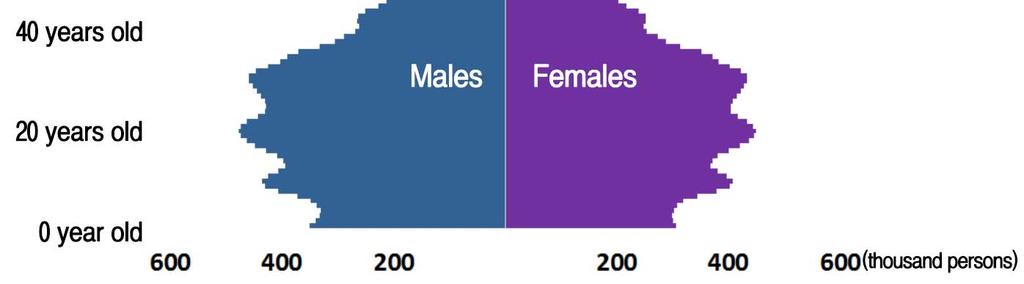
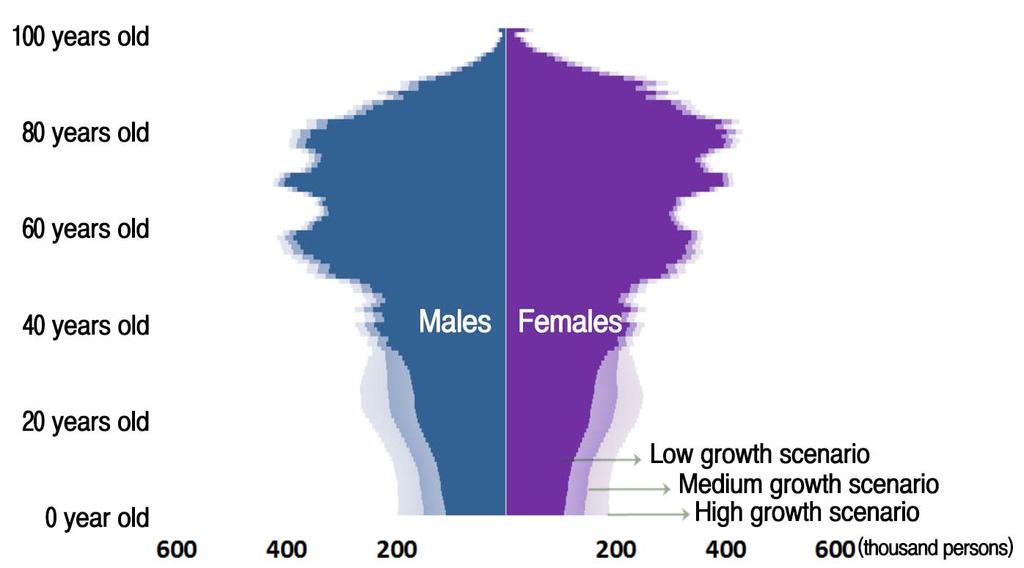
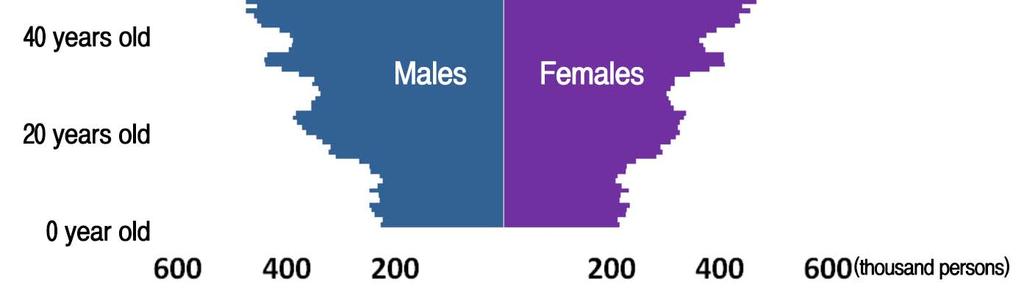
5 The aged dependency ratio is projected to rise from 17.5 persons in 2015, exceeding 50 persons in This figure will record 88.6 persons in 2065, which is 5.1 times higher than that for The ageing index (per 100 child population) is projected to exceed 100 persons in 2017 after recording 93.1 persons in The ageing index is projected to mark 203 persons in 2029 and persons in The figure for 2065 is more than 4 times higher than that for [ Table 5 ] Dependency ratio and ageing index ( ) (Unit: per 100 working age population, per 100 child population) Scenario Classification Medium High Low Total dependency ratio Child dependency ratio Aged Ageing index Total dependency ratio Child dependency ratio Aged Ageing index Total dependency ratio Child dependency ratio Aged Ageing index Population pyramid As of 2015, the population pyramid is pot shaped due to a large share of people in their thirties ~ fifties. However, the population pyramid would become inverted triangular shaped due to a large share of people aged 60 or more. [ Figure 1 ] Population pyramid ( ) 1965

6

7

, the population is projected by applying the demographic balancing equation.")
8 2065 Ⅱ. Method and assumptions 1. Cohort component method Population Projections for Korea (2015~2065) are based on the results of the 2015 Population Census, which is a register-based census. Statistics of births, deaths and international migration are used for population projections. According to the Cohort component method, the population size and the population structure by sex and age are projected from 2015 to According to the Cohort component method (birth, death and international migration), the population is projected by applying the demographic balancing equation. Births and net international migrations are added to the base population, while deaths are subtracted for population projections. 2. Base population (2015) The base population, which is a starting point for population projections, refers to the population as of July 1st, The base population (as of July 1st, 2015) is obtained by reflecting the demographic variations between July and October, 2015, on the basis of the census population as of November 1st, 2015 in the Population Census (Register-based Census). The base population (51,010 thousand persons, as of July 1st, 2015) was 60 thousand persons smaller than the census population (51,070 thousand persons, as of November 1st, 2015).
9 [ Table 6 ] Census population and base population (2015) 2015 Population (10 thousand persons) Total Males Females Census population (November 1st) 5,107 2,561 2,546 Base population (July 1st) 5,101 2,559 2, Retrospective population (2001~2014) After finalizing the base population on the basis of the Population Census (Register-based Census) results, the retrospective population (estimated population between censuses) is calculated to determine the past population. In the meantime, to secure the stability of the time series in accordance with the switch to the register-based census, the retrospective period is extended from the usual 4 years to 14 years (2001~2014). The retrospective population is calculated by linearly distributing the estimation error 1) of the current population 2) of 2015 by year and cohort to the current population from 2001 to 2014 (estimated population after the census). 4. Fertility projections Using the time series model, the cohort completed fertility rate is predicted. The birth rate by age is calculated by using generalized log gamma distribution. Fertility projections - By reflecting the uncertainty of future fertility rates, three assumptions are formulated. 1) Under the medium fertility scenario, the total fertility rate would rise from 1.18 persons in 2016 to 1.38 persons in Afterwards, the figure would remain the same level. 2) Under the high fertility scenario, the total fertility rate would rise from 1.20 persons in 2016 to 1.64 persons in Afterwards, the figure would remain the same level. 3) Under the low fertility scenario, the total fertility rate would drop from 1.16 persons in 2016 to 1.12 persons in Afterwards, the figure would remain the same level. - A increasing trend of childbirth age gradually slows down and the fluctuation of birth rate is stabilized. In the long run, the birth rate and cohort birth rate are projected to reach the same level. Total fertility rate Year-on-year change [ Table 7 ] Total fertility rate ( ) (Unit: Number of births per woman aged 15 to 49) Medium High Low Medium High Low ) Estimation error of 2015 = Base population of Current population of ) Estimated population by considering observation values of demographic variations (birth, death, migration) to the base population of 2000.
10 The feasibility of future fertility assumption is checked by referring to the opinion of external experts. - Experts forecast that the total fertility rate will record 1.28 persons in 2025, 1.39 persons in 2040 and 1.46 persons in Compared to the future fertility rate of external experts, the future fertility of the KOSTAT for the period is similar. 5. Mortality projections Mortality by sex and age is predicted by applying the Li-Lee-Gerland probability model (2013). 3) - The Li-Lee-Gerland model 4) is applied to reflect the rotation of age pattern, which was a weak point of the Li-Lee model applied in mortality projections in * By reflecting the slowing rate of improvement in the low-age mortality rate and the improvement in the high-age mortality rate, the Li-Lee-Gerland model was proposed in the '2016 Mortality Estimation Method Improvement Research Project'. - The death rates by sex and age between 1970 and 2016 are used as basic data. * The number of deaths in 2016 is estimated by applying year-on-year percent changes in the number of deaths by age between January and September. - The high and low scenarios apply the 99% confidence interval of the Li-Lee-Gerland (LLG) model. Mortality projections - Three scenarios of life expectancy at birth are established by considering the uncertainty of future mortality. 1) Under the medium mortality scenario, the life expectancy at birth of males would go up from 79.0 years in 2015 to 88.4 years in The life expectancy at birth of females would go up from 85.2 years in 2015 to 91.6 years in ) Under the high mortality scenario, the life expectancy at birth of males would go up to 89.2 years in The life expectancy at birth of females would go up to 92.6 years in ) Under the low mortality scenario, the life expectancy at birth of males would go up to 87.2 years in The life expectancy at birth of females would go up to 90.5 years in ) Li, N., Lee, R., and Gerland, P.(2013), Extending the Lee-Carter method to model the rotation of age pattern of mortality decline for long-term projections, Demography, 50(6), ) The Li-Lee model, a kind of Lee-Carter (LC) model widely used in the world, complements the coherence of the group-to-group mortality estimation, which is a weak point of the LC model. The Li-Lee model reflects common trends of death rates of males and females as well as individual trends of the death rates by sex.
11 Medium High Low [ Table 8 ] Life expectancy at birth ( ) (Unit: year) Total Males Females Total Males Females Total Males Females International migration projections International migrations of Koreans and foreigners are separately projected to reflect their different characteristics. By considering a stable net international migration rate of Koreans, the average net international migration rate by sex and age for the recent five years is applied. - The age-specific high and low scenarios apply the 99% confidence interval. When calculating the international migration rate of foreigners, it's difficult to define the population used as a denominator. By considering the characteristics of foreigner policies that are managed in terms of size, such as the quota system by status of sojourn, the net migration by year is used. - After estimating the total net migration by period, the figure is distributed by sex and age. - The total net migration of foreigners is based on the projection of foreigners by year according to the '2nd Basic Plan for Foreigners' (Ministry of Justice). Results of international migration projections - Three scenarios are established by considering the uncertainty of net international migration in the future. 1) Under the medium migration scenario, the net international migration would fall from 81 thousand persons in 2015 to 64 thousand persons in 2020, 33 thousand persons in 2030 and 32 thousand persons in ) Under the high migration scenario, the net international migration would fall from 111 thousand persons in 2020 to 76 thousand persons in 2030 and 71 thousand persons in ) Under the low migration scenario, the net international migration would fall from 19 thousand persons in 2020 to -9 thousand persons in 2030 and -2 thousand persons in Population projection scenarios The three assumptions of the high, medium and low scenarios are established by considering components of demographic variations (birth, death and international migration) to reflect future uncertainty into a total of 30 projection scenarios.
12 A combination of all the assumptions leads to 27 scenarios (3 assumptions of birth x 3 assumptions of death x 3 assumptions of international migration). - As basic scenarios, the medium assumption is formulated by combining the medium assumptions of birth, death and international migration. The high assumption (maximum population size) is formulated by combining the high assumptions of birth, death and international migration. The low assumption (minimum population size) is formulated by combining the low assumptions of birth, death and international migration. Three special scenarios are added by considering foreigner policy and childbirth policy. - The zero international migration scenario is assumed to eliminate the effect of international migration which is easily affected by policy factors. (medium assumption of birth rate and life expectancy at birth) - The scenario of the current birth rate assumes that the average birth rate for the recent five years will be maintained. (medium assumption of life expectancy at birth and international migration) - The scenario of the target birth rate assumes that according to the 3rd Basic Plan for low birth and aging society, the target birth rate for 2017~2020 will be realized. (medium assumption of life expectancy at birth and international migration) (The total fertility rate would be 1.5 persons after 2021.) Excluding three basic scenarios (medium, maximum and minimum ), the other 27 scenarios are provided on the KOSIS website. [ Table 9 ] Population projection scenarios and projection results Indicator High Medium Low Zero international migration, birth (medium) + death (medium) Total fertility rate (person) Life expectancy at birth (year) / / / / / 91.6 Net international migration (thousand persons) ,015 (0.53) Total population and rate ,977 (-0.58) 43,024 (-1.03) 36,659 (-1.54) 40,918 (-1.15) (thousand persons, %) Population peak (year) 55,420 (2038) 52,958 (2031) 51,680 (2023) 52,069 (2028) Population aged 15~64 and share (thousand persons, %) Population aged 65 or more and share (thousand persons, %) Population aged 0 ~ 14 and share (thousand persons, %) Total dependency ratio and aged dependency ratio (per 100 working age population) ,444 (73.4%) ,518 (49.1%) 20,620 (47.9%) 17,003 (46.4%) 19,452 (47.5%) Population peak (year) 37,663 (2017) 37,627 (2016) 37,627 (2016) 37,627 (2016) ,541 (12.8%) ,498 (39.0%) 18,273 (42.5%) 16,951 (46.2%) 17,434 (42.6%) ,030 (13.8%) ,960 (11.9%) 4,132 (9.6%) 2,705 (7.4%) 4,032 (9.9%) (17.5) (79.5) (88.6) (99.7) (89.6)
![[ Population Projections (2015~2065) ] Total population and population rae](/docs-images/89/100357168/images/13-0.jpg "(1965~2065) Number of births and deaths (1985~2065) Population structure by age group")
13 [ Population Projections (2015~2065) ] Total population and population rae (1965~2065) Number of births and deaths (1985~2065) Population structure by age group (1965~2065)


14 Composition of the population by age group (1965~2065) Working age population (1965~2065)
Bayesian Probabilistic Population Projections for All Countries
 Bayesian Probabilistic Population Projections for All Countries Adrian E. Raftery University of Washington http://www.stat.washington.edu/raftery Joint work with Leontine Alkema, Patrick Gerland, Sam Clark,
2008-based national population projections for the United Kingdom and constituent countries
 2008-based national population projections for the United Kingdom and constituent countries Emma Wright Abstract The 2008-based national population projections, produced by the Office for National Statistics
Environmental Justice Task Force
 Attachment 5 Year 2050 Population and Economic Forecasts #211068v1 Environmental Justice Task Force April 16, 2013 1 Introduction Population and economic projections serve as a basis for updating the regional
Metro Houston Population Forecast
 Metro Houston Population Forecast Projections to 2050 Prepared by the Greater Houston Partnership Research Department Data from Texas Demographic Center www.houston.org April 2017 Greater Houston Partnership
NEW STATE AND REGIONAL POPULATION PROJECTIONS FOR NEW SOUTH WALES
 NEW STATE AND REGIONAL POPULATION PROJECTIONS FOR NEW SOUTH WALES Tom Wilson The New South Wales Department of Planning recently published state and regional population projections for 06 to 36. This paper
Regional Population Projections for Japan: Overview of the Method
 Regional Population Projections for Japan: 2010-2040 Overview of the Method (Released in March 2013) Introduction We publicized the new population projection by region in March 2012. We projected population
POPULATION TOPIC PAPER
 LOCAL DEVELOPMENT FRAMEWORK RESEARCH REPORT POPULATION TOPIC PAPER Updated February 2011 For further information on this report please contact Planning Policy, Woking Borough Council, Civic Offices, Gloucester
Coping with Population Aging In China
 Coping with Population Aging In China Copyright 2009, The Conference Board Judith Banister Director of Global Demographics The Conference Board Highlights Causes of Population Aging in China Key Demographic
PROJECTIONS OF FULL TIME ENROLMENT Primary and Second Level,
 PROJECTIONS OF FULL TIME ENROLMENT Primary and Second Level, 2012-2030 July 2012 This report and others in the series may be accessed at: www.education.ie and go to Statistics/Projections of Enrolment
Socio-Demographic Projections for Autauga, Elmore, and Montgomery Counties:
 Information for a Better Society Socio-Demographic Projections for Autauga, Elmore, and Montgomery Counties: 2005-2035 Prepared for the Department of Planning and Development Transportation Planning Division
Population and Vital Statistics Republic of Mauritius, January June 2018
 . Introduction Population and Vital Statistics Republic of Mauritius, January June 08 This issue of the Economic and Social Indicators presents provisional population estimates for mid-year 08 and vital
MAIN FEATURES OF GLOBAL POPULATION TRENDS
 MAIN FEATURES OF GLOBAL POPULATION TRENDS John Wilmoth, Director Population Division, DESA, United Nations Seminar on Population Projections and Demographic Trends Eurostat, Luxembourg, 13 November 2018
ECONOMICS AND STATISTICS BRANCH DEPARTMENT OF FINANCE
 ECONOMICS AND STATISTICS BRANCH DEPARTMENT OF FINANCE The Branch is responsible for meeting the broad macroeconomic and statistical requirements of Government and its agencies. As part of this mandate,
Wellesley Public Schools, MA Demographic Study. February 2013
 Wellesley Public Schools, MA Demographic Study February 2013 Table of Contents Executive Summary 1 Introduction 2 Data 3 Assumptions 3 Methodology 5 Results and Analysis of the Population Forecasts 6 Table
Oregon Population Forecast Program Regional Forecast Meeting - September 23, 2014
 Oregon Population Forecast Program Regional Forecast Meeting - September 23, 2014 Presentation by Population Forecast Program Team CURRY COUNTY Oregon Population Forecast Program Project Team Xiaomin Ruan,
ACTUARIAL REPORT 25 th. on the
 25 th on the CANADA PENSION PLAN Office of the Chief Actuary Office of the Superintendent of Financial Institutions Canada 16 th Floor, Kent Square Building 255 Albert Street Ottawa, Ontario K1A 0H2 Facsimile:
GLA 2014 round of trend-based population projections - Methodology
 GLA 2014 round of trend-based population projections - Methodology June 2015 Introduction The GLA produces a range of annually updated population projections at both borough and ward level. Multiple different
Projections of Florida Population by County,
 Bureau of Economic and Business Research College of Liberal Arts and Sciences University of Florida Florida Population Studies Bulletin 162 (Revised), March 2012 Projections of Florida Population by County,
Item 3 Challenges and use of population projections
 SP 1 21 April 2010 UNITED NATIONS STATISTICAL COMMISSION and ECONOMIC COMMISSION FOR EUROPE STATISTICAL OFFICE OF THE EUROPEAN UNION (EUROSTAT) CONFERENCE OF EUROPEAN STATISTICIANS Joint Eurostat/UNECE
Projection of Thailand s Agricultural Population in 2040
 Journal of Management and Sustainability; Vol., No. 3; 201 ISSN 192-472 E-ISSN 192-4733 Published by Canadian Center of Science and Education Projection of Thailand s Agricultural Population in 2040 Chanon
Why is understanding our population forecasts important?
 % Population Growth per annum Population Why is understanding our population forecasts important? Understanding the ACT s population growth and its demographic trends, is fundamental to longterm strategic
CHAPTER 7 U. S. SOCIAL SECURITY ADMINISTRATION OFFICE OF THE ACTUARY PROJECTIONS METHODOLOGY
 CHAPTER 7 U. S. SOCIAL SECURITY ADMINISTRATION OFFICE OF THE ACTUARY PROJECTIONS METHODOLOGY Treatment of Uncertainty... 7-1 Components, Parameters, and Variables... 7-2 Projection Methodologies and Assumptions...
Population and Housing Demand Projections for Metro Boston Regional Projections and Provisional Municipal Forecasts
 Population and Housing Demand Projections for Metro Boston Regional Projections and Provisional Municipal Forecasts January, 2014 Metropolitan Area Planning Council Appendix F: Formulas for calculation
Model to Structuring Total Population
 Applications of a Cohort-Component Component Model to Structuring Total Population Estimates to Categories of Age and Sex: A Pilot Study in New Mexico Jack Baker Adelamar Alcantara Xiaomin Ruan University
Harnessing Demographic Dividend: The Future We Want
 Harnessing Demographic Dividend: The Future We Want Presented at 5th Commission on Population and Development April 5th, 217 Republik Indonesia Ministry of National Development Planning/ Bappenas National
The Impact of Demographic Change on the. of Managers and
 The Impact of Demographic Change on the Future Availability of Managers and Professionals in Europe Printed with the financial support of the European Union The Impact of Demographic Change on the Future
2000 HOUSING AND POPULATION CENSUS
 Ministry of Finance and Economic Development CENTRAL STATISTICS OFFICE 2000 HOUSING AND POPULATION CENSUS REPUBLIC OF MAURITIUS ANALYSIS REPORT VOLUME VIII - ECONOMIC ACTIVITY CHARACTERISTICS June 2005
Demographic Situation: Jamaica
 Policy Brief: Examining the Lifecycle Deficit in Jamaica and Argentina Maurice Harris, Planning Institute of Jamaica Pablo Comelatto, CENEP-Centro de Estudios de Población, Buenos Aires, Argentina Studying
Population Statistics of Japan
 所内研究報告第 26 号 2008 年 9 月 Population Statistics of Japan 2008 National Institute of Population and Social Security Research Tokyo, Japan Preface This report has been published as a useful reference for understanding
2017 Statistics on the Aged
 2017 Statistics on the Aged Ⅰ. () In 2017, the population aged 65 or more is projected to occupy 13.8 percent of the total population. trends (Unit: thousand persons, %) Projected size and share by age
Labor Force Projections for Europe by Age, Sex, and Highest Level of Educational Attainment, 2008 to 2053
 Labor Force Projections for Europe by Age, Sex, and Highest Level of Educational Attainment, 08 to 3 Elke Loichinger Wittgenstein Centre for Human Capital and Development (Vienna University of Economics
ACTUARIAL REPORT 27 th. on the
 ACTUARIAL REPORT 27 th on the CANADA PENSION PLAN Office of the Chief Actuary Office of the Superintendent of Financial Institutions Canada 12 th Floor, Kent Square Building 255 Albert Street Ottawa, Ontario
The Beehive Shape: Provisional 50-Year Demographic and Economic Projections for the State of Utah,
 Policy Brief October 2016 The Beehive Shape: Provisional 50-Year Demographic and Economic Projections for the State of Utah, 2015-2065 Authored by: Mike Hollingshaus, Ph.D., Emily Harris, M.S., Catherine
State and National Projections Methodology
 State and National Projections Methodology This document describes in detail the steps in developing projections for the nation, the 50 states, and the District of Columbia for,, and 2040. The projections
Projections of Florida Population by County, , with Estimates for 2013
 College of Liberal Arts and Sciences Bureau of Economic and Business Research Florida Population Studies Volume 47, Bulletin 168, April 2014 Projections of Florida Population by County, 2015 2040, with
K. Srinivasan and V.D. Shastri *
 A SET OF POPULATION PROJECTIONS OF INDIA AND THE LARGER STATES BASED ON 2001 CENSUS RESULTS INTRODUCTION K. Srinivasan and V.D. Shastri * This note gives the underlying assumptions and results derived
Global demographic projections: Future trajectories and associated uncertainty
 Global demographic projections: Future trajectories and associated uncertainty John Wilmoth, Director Population Division, DESA, United Nations CPD Side Event, 14 April 2015 Outline Introduction UN population
Cumbria Popgroup Population Projections: 2016 Refresh
 Cumbria Popgroup Population Projections: 2016 Refresh 1. Aim To report on the latest population projections for Cumbria based on a series of scenarios generated by the Cumbria Intelligence Observatory
I Overview of the System and the Basic Statistics [1] General Welfare and Labour
![I Overview of the System and the Basic Statistics [1] General Welfare and Labour](/thumbs/82/85260124.jpg "I Overview of the System and the Basic Statistics [1] General Welfare and Labour") I Overview of the System and the Basic Statistics [1] General Welfare and Labour Population Structure Overview The Population Pyramid in Japan Age 100 or over Age 76: the number of births decreased in
I Overview of the System and the Basic Statistics [1] General Welfare and Labour Population Structure Overview The Population Pyramid in Japan Age 100 or over Age 76: the number of births decreased in
Latvian Country Fiche on Pension Projections
 Latvian Country Fiche on Pension Projections 1. OVERVIEW OF THE PENSION SYSTEM 2 Pension System in Latvia The Notional defined-contribution (NDC) pension scheme is functioning already since 1996, the state
GROWTH STRATEGY REPORT FOR THE OKANAGAN SIMILKAMEEN REGION, 2004 to 2031
 GROWTH STRATEGY REPORT FOR THE OKANAGAN SIMILKAMEEN REGION, 2004 to 2031 Population Age Profile, Okanagan Similkameen RD, 2004 and 2031 100 95 90 85 80 75 70 65 60 55 50 45 40 35 30 25 20 15 10 5 0 Female
Global population projections by the United Nations John Wilmoth, Population Association of America, San Diego, 30 April Revised 5 July 2015
 Global population projections by the United Nations John Wilmoth, Population Association of America, San Diego, 30 April 2015 Revised 5 July 2015 [Slide 1] Let me begin by thanking Wolfgang Lutz for reaching
Population, Housing, and Employment Methodology
 Appendix O Population, Housing, and Employment Methodology Final EIR APPENDIX O Methodology Population, Housing, and Employment Methodology This appendix describes the data sources and methodologies employed
Fiscal Sustainability Report 2017
 Fiscal Sustainability Report 217 Ottawa, Canada 5 October 217 www.pbo-dpb.gc.ca The Parliamentary Budget Officer (PBO) supports Parliament by providing analysis, including analysis of macro-economic and
NOVEMBER 2017 PINELLAS COUNTY POPULATION PROJECTION PREPARED BY BENJAMIN FRIEDMAN TH STREET NORTH CLEARWATER, FL
 NOVEMBER 2017 PINELLAS COUNTY POPULATION PROJECTION 2016-2021 PREPARED BY BENJAMIN FRIEDMAN 13805 58TH STREET NORTH CLEARWATER, FL 33760 727-464-7332 Executive Summary Between 2016 and 2021, Pinellas County
The labor market in South Korea,
 JUNGMIN LEE Seoul National University, South Korea, and IZA, Germany The labor market in South Korea, The labor market stabilized quickly after the 1998 Asian crisis, but rising inequality and demographic
The Fiscal Consequences of Shrinking Populations
 Public Disclosure Authorized Public Disclosure Authorized Public Disclosure Authorized The Fiscal Consequences of Shrinking Populations Benedict Clements Division Chief Fiscal Affairs Department International
REPUBLIC OF BULGARIA. Country fiche on pension projections
 REPUBLIC OF BULGARIA Country fiche on pension projections Sofia, November 2017 Contents 1 Overview of the pension system... 3 1.1 Description... 3 1.1.1 The public system of mandatory pension insurance
INDIGENOUS DARWIN AND THE REST OF THE NORTHERN TERRITORY
 POPULATION STUDIES RESEARCH BRIEF ISSUE Number 2009026 School for Social and Policy Research 2008 Population Studies Group School for Social and Policy Research Charles Darwin University Northern Territory
NSW Long-Term Fiscal Pressures Report
 NSW Long-Term Fiscal Pressures Report NSW Intergenerational Report 2011-12 Budget Paper No. 6 Table of Contents Executive Summary... i Chapter 1: Background to the Report 1.1 Fiscal Sustainability... 1-1
Albany City School District
 Albany City School District Enrollment and Demographics Dr. Jim Butterworth, CASDA Introduction Projection: Projects the past and present demographics into the future in order to estimate population. Forecast:
Methods and Data for Developing Coordinated Population Forecasts
 Methods and Data for Developing Coordinated Population Forecasts Prepared by Population Research Center College of Urban and Public Affairs Portland State University March 2017 Table of Contents Introduction...
Peterborough Sub-Regional Strategic Housing Market Assessment
 Peterborough Sub-Regional Strategic Housing Market Assessment July 2014 Prepared by GL Hearn Limited 20 Soho Square London W1D 3QW T +44 (0)20 7851 4900 F +44 (0)20 7851 4910 glhearn.com Appendices Contents
Indicators for the 2nd cycle of review and appraisal of RIS/MIPAA (A suggestion from MA:IMI) European Centre Vienna
 European Centre Vienna") Indicators for the 2nd cycle of review and appraisal of RIS/MIPAA 2007-2012 (A suggestion from MA:IMI) European Centre Vienna April 2011 The indicators cover four main topics: demography, income and wealth,
Indicators for the 2nd cycle of review and appraisal of RIS/MIPAA 2007-2012 (A suggestion from MA:IMI) European Centre Vienna April 2011 The indicators cover four main topics: demography, income and wealth,
COUNTRY REPORT TURKEY
 COUNTRY REPORT TURKEY This document sets out basic mortality information for Turkey for the use of the International Actuarial Association s Mortality Working Group. CONTENTS New Research... 2 New Mortality
Demographic and economic assumptions used in actuarial valuations of social security and pension schemes
 International Social Security Association Fifteenth International Conference of Social Security Actuaries and Statisticians Helsinki, Finland, 23-25 May 2007 Demographic and economic assumptions used in
Projections of Florida Population by County, , with Estimates for 2018
 College of Liberal Arts and Sciences Bureau of Economic and Business Research Florida Population Studies Volume 52, Bulletin 183, April 2019 2020 2045, with Estimates for 2018 Stefan Rayer, Population
Population projections for Derbyshire County Council
 Population projections for Derbyshire County Council CCSR Working Paper 2005-05 Ludi Simpson This document provides a report of population projections, summarising the main features
CHAPTER IV: LABOUR FORCE STATUS
 CHAPTER IV: LABOUR FORCE STATUS 1. Trends in the Population in Labour Force Japan s population in labour force is 65. million, showing a labour force participation rate of 61.5%. According to the status
Population Changes and the Economy
 Population Changes and the Economy Predicting the effect of the retirement of the baby boom generation on the economy is not a straightforward matter. J ANICE F. MADDEN SOME ECONOMIC forecasters have suggested
Timor-Leste Population
 Timor-Leste Population and Housing Census 2015 Analytical Report on Population Projection Volume 9 2015 Timor-Leste Population and Housing Census Thematic Report Volume 9 Population Projections by age
Rotorua Lakes District Population Projections
 Rotorua Lakes District Population Projections Draft report February 2015 www.berl.co.nz Background Author(s): Hugh Dixon, Hillmarè Schulze, Mark Cox DISCLAIMER All work is done, and services rendered at
Looking to the Future, Now. Mackenzie and Area Seniors Needs Project. Population Background and Trends Report
 Looking to the Future, Now Mackenzie and Area Seniors Needs Project Population Background and Trends Report prepared by: Rachael Clasby, Greg Halseth, and Neil Hanlon Geography Program University of Northern
CRS Report for Congress Received through the CRS Web
 Order Code RL33387 CRS Report for Congress Received through the CRS Web Topics in Aging: Income of Americans Age 65 and Older, 1969 to 2004 April 21, 2006 Patrick Purcell Specialist in Social Legislation
Statistics Division, Economic and Social Commission for Asia and the Pacific
 .. Distr: Umited ESAW/CRVS/93/22 ORIGINAL: ENGUSH EAST AND SOUTH ASIAN WORKSHOP ON STRATEGIES FOR ACCELERATING THE IMPROVEMENT OF CIVIL REGISTRATION AND VITAL STATISTICS SYSTEMS BEIJING, 29 NOVEMBER -
Multistate Demography with R? Samir K.C. World Population Program - IIASA
 Multistate Demography with R? Samir K.C. World Population Program - IIASA Definition the study of populations stratified by age, sex, and one or several attributes such as region of residence marital status
Chapter 12 The Human Population: Growth, Demography, and Carrying Capacity
 Chapter 12 The Human Population: Growth, Demography, and Carrying Capacity The History of the Human Population Years Elapsed Year Human Population 3,000,000 10,000 B.C.E. (Agricultural Revolution) 5-10
Hallow on Significance of Maternity Insurance Actuarial and Characteristics of the System in our Country
 International Business and Management Vol. 11, No. 1, 2015, pp. 41-45 DOI:10.3968/7351 ISSN 1923-841X [Print] ISSN 1923-8428 [Online] www.cscanada.net www.cscanada.org Hallow on Significance of Maternity
DISABILITY AND DEATH PROBABILITY TABLES FOR INSURED WORKERS BORN IN 1995
 ACTUARIAL NOTE Number 2015.6 December 2015 SOCIAL SECURITY ADMINISTRATION Office of the Chief Actuary Baltimore, Maryland DISABILITY AND DEATH PROBABILITY TABLES FOR INSURED WORKERS BORN IN 1995 by Johanna
Populations: an Introduction to Demography. Population Trends In Canada
 Populations: an Introduction to Demography Population Trends In Canada Demography Demography is the study of populations over time and over place. The three major components of demography are: (1) mortality,
HEMSON C o n s u l t i n g L t d.
 GROWTH OUTLOOK TO 2036 City of Greater Sudbury DRAFT C o n s u l t i n g L t d. May 2013 TABLE OF CONTENTS EXECUTIVE SUMMARY... 1 I II III INTRODUCTION AND PURPOSE... 3 POSITIVE GROWTH OUTLOOK FOR GREATER
Introducing National Transfer Account (NTA) in Nepal Rishi Ram Sigdel Tirtha Raj Baral
 in Nepal Rishi Ram Sigdel Tirtha Raj Baral") Introducing National Transfer Account (NTA) in Nepal Rishi Ram Sigdel Tirtha Raj Baral Presentation Outline Introduction Demographic context Socio-economic indicators Available data sources Possible agencies
Introducing National Transfer Account (NTA) in Nepal Rishi Ram Sigdel Tirtha Raj Baral Presentation Outline Introduction Demographic context Socio-economic indicators Available data sources Possible agencies
Macro Economic & Demographic Trends: India
 Macro Economic & Demographic Trends: India 14 th Global Conference of Actuaries, Mumbai; February 19-21, 2012 Report compiled by Actuarial Team, Aviva Life Insurance Co. India Ltd. 1. Macro Economic Factors
A Long-Term View of Canada s Changing Demographics. Are Higher Immigration Levels an Appropriate Response to Canada s Aging Population?
 A Long-Term View of Canada s Changing Demographics. Are Higher Immigration Levels an Appropriate Response to Canada s Aging Population? REPORT OCTOBER 2016 A Long-Term View of Canada s Changing Demographics:
EUROPOP2003: Draft Population Projections - FRANCE -
 EUROPEAN COMMISSION EUROSTAT Directorate F: External relations statistics Unit F-1: Demography, migration Luxembourg, 1 June 2004 ESTAT/F-1/POP/08(2004)/GL Working paper for the Consultation of the Member
Population Projections, South Sudan From
 Population Projections, South Sudan From 2008 2015 National Bureau of Statistics October, 2014 1 Preface There has been a lot of demand for population projection and understandably so because it is not
CURRENT DEMOGRAPHICS & CONTEXT GROWTH FORECAST SOUTHERN CALIFORNIA ASSOCIATION OF GOVERNMENTS APPENDIX
 CURRENT DEMOGRAPHICS & CONTEXT GROWTH FORECAST SOUTHERN CALIFORNIA ASSOCIATION OF GOVERNMENTS APPENDIX PROPOSED FINAL MARCH 2016 INTRODUCTION 1 FORECASTING PROCESS 1 GROWTH TRENDS 2 REGIONAL GROWTH FORECAST
POPULATION PROJECTIONS
 2012 (BASE) TO 2101 POPULATION PROJECTIONS 3222.0 AUSTRALIA EMBARGO: 11.30AM (CANBERRA TIME) TUES 26 NOV 2013 CONTENTS Notes... page 2 CHAPTERS Main Features 3 2 Assumptions... 7 3 Projection results Australia...
Napier City Socio-Demographic Profile Report prepared for the Napier City Council by Professor Natalie Jackson
 Napier City Socio-Demographic Profile 1986-2011 Report prepared for the Napier City Council by Professor Natalie Jackson November 2011 Table of Contents EXECUTIVE SUMMARY 4 What you need to know about
Population Aging and Fiscal Sustainability of Social Security in China
 Population Aging and Fiscal Sustainability of Social Security in China Contents Preface...3 1 The Status and Trend of Population Aging in China...5 1.1 The current situation of China's population structure...
Projections of Florida Population by County, , with Estimates for 2017
 College of Liberal Arts and Sciences Bureau of Economic and Business Research Florida Population Studies Volume 51, Bulletin 180, January 2018 Projections of Florida Population by County, 2020 2045, with
Chapter 2 Population Prospects in Japanese Society
 Chapter 2 Population Prospects in Japanese Society Abstract Although there were some interruptions at wartimes, the growth of Japanese population reached its peak in 2008, and then began to decrease. There
THE FISCAL IMPACT OF POPULATION CHANGE: DISCUSSION
 THE FISCAL IMPACT OF POPULATION CHANGE: DISCUSSION Paul Atkinson* Ronald Lee and Ryan Edwards have provided a comprehensive analysis of the prospective budgetary implications of the aging of the U.S. population
REPUBLIC OF BULGARIA. Country fiche on pension projections
 REPUBLIC OF BULGARIA Country fiche on pension projections Sofia, November 2014 Contents 1 Overview of the pension system... 3 1.1 Description... 3 1.1.1 The public system of mandatory pension insurance
Insights into Retirement Risks and Opportunities in Asia Pacific Markets
 Insights into Retirement Risks and Opportunities in Asia Pacific Markets R. DALE HALL, FSA, MAAA, CERA, CFA Managing Director of Research, Society of Actuaries Monday, September 17, 2018 About the Research
Demographic Dividend or Demographic Threat in Pakistan?
 Demographic Dividend or Demographic Threat in Pakistan? Durre Nayab Pakistan Institute of Development Economics December 4, 2006 Scheme for Presentation What is demographic dividend? Demographic evolution
Coordinated Population Forecast
 Coordinated Population Forecast 2017 Through 2067 Linn County Urban Growth Boundaries (UGB) & Area Outside UGBs Photo Credit: A footbridge in McDowell Creek Falls County Park (Photo No. linnda0099). Gary
Population Projections for South Sudan
 Population Projections for South Sudan 2015-2020 National Bureau of Statistics March, 2015 1 Preface There has been a lot of demand for population projection and understandably so because it is not appropriate
The South West Its People and Future
 The South West Its People and Future John Henstridge Data Analysis Australia UDIA Bunker Bay 2004 Overview The Myth Population movements Population Structure How we understand it Forecast models The Grey
ACTUARIAL REPORT 12 th. on the
 12 th on the OLD AGE SECURITY PROGRAM Office of the Chief Actuary Office of the Superintendent of Financial Institutions Canada 12 th Floor, Kent Square Building 255 Albert Street Ottawa, Ontario K1A 0H2
Hastings District Socio Demographic Profile Report prepared for the Hastings District Council by Professor Natalie Jackson
 Hastings District Socio Demographic Profile 1986 2011 Report prepared for the Hastings District Council by Professor Natalie Jackson November 2011 Table of Contents EXECUTIVE SUMMARY 4 What you need to
Lehigh Valley Planning Commission
 Lehigh Valley Planning Commission 961 Marcon Boulevard, Suite 310 Allentown, Pennsylvania 18109 Telephone: 610-264-4544 or 1-888-627-8808 E-mail: lvpc@lvpc.org POPULATION PROJECTIONS FOR LEHIGH AND COUNTIES:
VICTORIA IN FUTURE 2012
 VICTORIA IN FUTURE 2012 POPULATION AND HOUSEHOLD PROJECTIONS 2011 2031 FOR VICTORIA AND ITS REGIONS April 2012 Published by Spatial Analysis and Research, a branch in the Department of Planning and Community
Nicholas C Garganas: The ageing of Europe s population: consequences and reforms with particular reference to Greece
 Nicholas C Garganas: The ageing of Europe s population: consequences and reforms with particular reference to Greece Address by Mr Nicholas C Garganas, Governor of the Bank of Greece, at the conference
The CMI Mortality Projections Model Fri 13 th November 2009
 IAA Mortality Task Force The CMI Mortality Projections Model Fri 13 th November 2009 Brian Ridsdale, Faculty and Institute Representative Courtesy: CMI The CMI Mortality Projections Model Agenda Introduction
Labour force ageing: Its impact on employment level and structure. The cases from Japan and Australia
 Labour force ageing: Its impact on employment level and structure. The cases from Japan and Australia Ewa Orzechowska-Fischer (Ewa.Orzechowska@anu.edu.au) The Australian National University Abstract Introduction:
A Society with a Lowest- Low Fertility Rate and Super-Aged Population: Risks and Strategy
 Working Paper 2015-06 A Society with a Lowest- Low Fertility Rate and Super-Aged Population: Risks and Strategy Samsik Lee Hyojin Choi A Society with a Lowest-Low Fertility Rate and a Super-Aged Population:
Population & Demographic Analysis
 Population & Demographic Analysis The United States Census Bureau conducts a nationwide census every ten years. This census compiles information relating to the socio-economic characteristics of the entire
Demographic models. población y desarrollo. for projections of social sector demand
 S E R I E población y desarrollo 66 Demographic models for projections of social sector demand Timothy Miller Latin American and Caribbean Demographic Centre (CELADE) Population Division Santiago, Chile,
LESOTHO COUNTRY BRIEF
 LESOTHO COUNTRY BRIEF This brief is part of a series of outputs under the analytical work Forever Young? Social Policies for a Changing Population in Southern Africa. Outputs include: Forever Young? Social