Theoretically, 68% of prices fall within the boundary. IV Rank near 100% IV Rank near 0%
|
|
|
- Augustus White
- 5 years ago
- Views:
Transcription


 which is represented by implied volatility rank (IV Rank).")


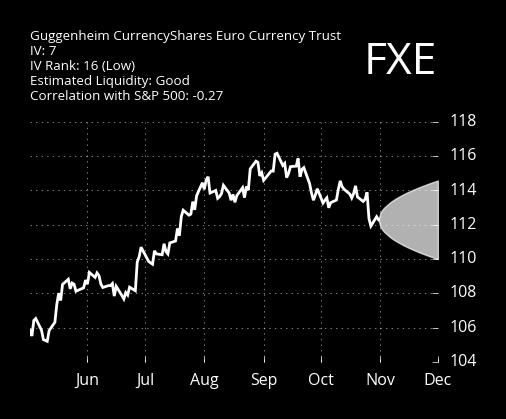
1 October 31, 2017 Reading the Cone Graphics What are the cones on the price graphics and what s the significance of the colors? I ll explain The cone represents a 30-day theoretical expected price range the larger the cone, the greater the expectation of stock price move. The cones are calculated using the option s implied volatility. The higher the implied volatility, the larger the expected move of the underlying stock and thus the greater the breadth of the cone. The color of the cone is significant. The darker the color, the more extreme the implied volatility (IV) which is represented by implied volatility rank (IV Rank). The higher the IV Rank, the more expensive the prices of the options have been historically. This information can help you decide on a trading strategy. Theoretically, 68% of prices fall within the boundary. IV Rank near 100% IV Rank near 0% What Are We Looking At? The charts on the right are many of the stocks and etfs that we are looking at. See the next two pages of Cherry Picks for more information. Cherry Picks Futures Edition Pete Mulmat s Futures Edition Cherry Picks was sent out on Sunday a cheat sheet showing popular futures, their notional sizes, and their etf equivalents it is super useful information for anyone interested in futures. If you didn t receive it, please reach out. We welcome comments/feedback. Best of luck in this week s trading. Michael Rechenthin, PhD Kai Zeng research@tastytrade.com Options involve risk and are not suitable for all investors. Please read Characteristics and Risks of Standardized Options before deciding to invest.
 continues to provide nice diversification with the S&P 500 (SPY) and implied volatility is getting to be more expensive.")
2 3-Month Correlation Matrix of Price Returns What Do We Find Interesting? The Utilities etf (XLU) continues to provide nice diversification with the S&P 500 (SPY) and implied volatility is getting to be more expensive. This is starting to make this an ideal ETF to begin selling premium in. The Oil Services etf (OIH) seems to have recovered a bit from selling that occurred last week. IV Rank is relatively low (20%), but an implied volatility of 26 makes options in OIH have twice as much premium in them than the S&P 500 (SPY). We are keeping sizes relatively small in the metals low implied volatility in Silver (SLV) and Gold (GLD) make them not as attractive as premium sellers. The correlation between Gold (GLD) and the S&P 500 (SPY) are currently slightly negative (-0.35) expect to see this relationship strengthen and the negative correlation get stronger if stocks begin to sell off. At least that is what usually happens. Junior Gold Miners (GDXJ) has had some large moves over the past month down 7%. IV Rank might be on the low side, but with an implied volatility near 30, and the large movements, it looks fairly appealing from a contrarian standpoint. Healthcare (XLV) continues to be in the news currently the liquidity is surprisingly poor, which is unfortunate considering IV Rank is beginning to look good. Look toward some of the big capitalization individual stocks if you want to play this sector. Expect to see the relationship between the major market indices, S&P 500 (SPY), the small-cap Russell 2000 index (IWM), and the Nasdaq (QQQ), strengthen if we begin to have some selling in the market. tastytrade.com, 2017 Michael Rechenthin, PhD Kai Zeng Page 2 of 10

3 Popular ETFs DIA Dow EEM Emerging Index Fund EFA MSCI EAFE EWZ Brazil FEZ Euro Stoxx 50 FXI China Large Cap GDX Gold Miners GDXJ Junior Gold Miners GLD Gold IWM Russell 2000 ETF KRE Regional Banking OIH Oil Services QQQ Nasdaq 100 SLV Silver SPY S&P 500 TLT 20+ Year Treasury Bond ETF XBI Biotech XLB Materials XLE XLF XLI XLK XLP XLU XME XOP XRT Energy Select Sector Financial Industrial Tech Consumer Staples Utilities Metals and Mining Oil & Gas Exploration & Product Retail What Has High Implied Volatility? Brazil (EWZ) has a nice combination of high implied volatility (e.g. nearly 3x as much premium as the S&P 500) and historically expensive options (i.e. high implied volatility rank) Tech (XLK) and Euro currency (FXI) and Retail (XRT) are all displaying implied volatility ranks near 50%. Not shown on the scatter plot above, but General Electric (GE), A&T (T), Apple (AAPL), CVS, Facebook (FB), Cisco (CSCO), Disney (DIS), Intel (INTC), Wal-Mart (WMT), and Costco (COST) all have high implied volatility rank. tastytrade.com, 2017 Michael Rechenthin, PhD Kai Zeng Page 3 of 10
4 Earnings season is coming to an end. Seen below are some of the stocks with earnings we are keeping our eye on. We highlighted the ones that are on our tastytrade watchlist. Symbol Description Expected Report Date Time of Day Weekly Options In Dow? In S&P 500? In Russell 2000? In tastytrade Watchlist? X United States Steel Tue Oct-31 After Close Yes Yes 5 Market Cap (Billions) EA Electronic Arts Tue Oct-31 After Close Yes - Yes DDD 3D Systems Tue Oct-31 After Close Yes - - Yes - 1 GRPN Groupon Wed Nov-01 Before Open Yes - - Yes - 3 FB Facebook Wed Nov-01 After Close Yes - Yes - Yes 522 GPRO GoPro, (Class A) Wed Nov-01 After Close Yes - - Yes - 1 RIG Transocean Ltd Wed Nov-01 After Close Yes - Yes - Yes 4 QCOM QUALCOMM Wed Nov-01 After Close Yes - Yes YELP Yelp Wed Nov-01 After Close Yes - - Yes - 4 TSLA Tesla Wed Nov-01 After Close Yes Yes 53 SHAK Shake Shack (Class A) Wed Nov-01 After Close Yes - - Yes - 1 APA Apache Thu Nov-02 Before Open Yes - Yes YUM Yum! Brands Thu Nov-02 Before Open Yes - Yes CHK Chesapeake Energy Thu Nov-02 Before Open Yes - Yes BABA Alibaba Group Thu Nov-02 Before Open Yes Yes 462 RL Ralph Lauren Thu Nov-02 Before Open Yes - Yes ATVI Activision Blizzard Thu Nov-02 After Close Yes - Yes SBUX Starbucks Thu Nov-02 After Close Yes - Yes - Yes 80 AAPL Apple Thu Nov-02 After Close Yes Yes Yes - Yes 861 P Pandora Media Thu Nov-02 After Close Yes Yes 2 RCL Royal Caribbean Cruises Ltd. Fri Nov-03 n/a Yes - Yes CVS CVS Health Mon Nov-06 Before Open Yes - Yes KORS Michael Kors Holdings Limiteds Mon Nov-06 Before Open Yes - Yes PCLN The Priceline Group Mon Nov-06 After Close Yes - Yes - Yes 92 TRIP TripAdvisor Mon Nov-06 After Close Yes - Yes COH Coach Tue Nov-07 Before Open Yes - Yes HUM Humana Wed Nov-08 Before Open Yes - Yes M Macy's Inc Thu Nov-09 Before Open Yes - Yes NVDA NVIDIA Thu Nov-09 After Close Yes - Yes DIS Walt Disney Thu Nov-09 After Close Yes Yes Yes - Yes 151 tastytrade.com, 2017 Michael Rechenthin, PhD Kai Zeng Page 4 of 10
5 Stocks and ETFs with an upcoming dividend. In the money short call options are the only options at risk of additional early assignment due to the dividend. If the extrinsic value of the in the money short call is less than the dividend, the option is at (a greater than average) risk of being assigned. Symbol Description Ex-Dividend Date Dividend Per Share In Dow? In S&P 500? In Russell 2000? In tastytrade Watchlist? WFC Wells Fargo & Thu, Nov Yes - - UN Unilever NV Thu, Nov KKR KKR & Co. L.P. Fri, Nov NBL Noble Energy Fri, Nov Yes - - MET MetLife Fri, Nov Yes - - C Citigroup Fri, Nov Yes - Yes INTC Intel Mon, Nov Yes Yes - - FE FirstEnergy Mon, Nov Yes - - TJX TJX Companies Wed, Nov Yes - - GSK GlaxoSmithKline PLC Thu, Nov BBT BB&T Thu, Nov Yes - - PFE Pfizer Thu, Nov Yes Yes - - Additional upcoming ex-dividends in popular etfs: Wed, Nov 01 HYG, LQD, TLT, IEI, GOVT, IEF, TIP, PFF, IPFF, JNK tastytrade.com, 2017 Michael Rechenthin, PhD Kai Zeng Page 5 of 10
6 Some of the most popular segments include: Date Segment Title Link Tue, Oct 31 Market Measures Short /ES & Short SPY Strangles LINK Tue, Oct 31 Options Jive Stacking the Deck LINK Tue, Oct 31 Strategies for IRA Trades For Your IRA: Getting Started LINK Mon, Oct 30 Market Measures FOMC and Trading Opportunities LINK Mon, Oct 30 Options Jive Calculating Expected Moves Using Options LINK Mon, Oct 30 Best Practices Risk & Reward of Strategies LINK Fri, Oct 27 tasty Extras TP Says Using Futures LINK Fri, Oct 27 tasty Extras Sosnoff Says Opportunity is Now LINK Fri, Oct 27 tasty Extras The 3rd Industrial Revolution Money LINK Fri, Oct 27 Market Measures The Importance of Being Neutral LINK Fri, Oct 27 Resize & Analyze Week of October 23rd LINK Fri, Oct 27 Closing the Gap - Futures Edition Euro/Yen at an Extreme LINK Thu, Oct 26 Market Measures Contract Size & Tail Risk LINK Thu, Oct 26 Options Jive Implied Volatility & Two Types of Reversion LINK Thu, Oct 26 Trades From the Research Team LIVE Trades From the Research Team LIVE LINK Wed, Oct 25 Market Measures Portfolio Volatility - 1 SD Strangle LINK Wed, Oct 25 Options Jive Visualizing Trading Expectations LINK Wed, Oct 25 tasty BITES The Defining Effect LINK Tue, Oct 24 Market Measures The Problem With VIX Calendars LINK Tue, Oct 24 Options Jive Option Value Basics LINK Tue, Oct 24 Best Practices Vertical Spreads LINK Mon, Oct 23 Market Measures VVIX to VIX Ratio At All Time Highs? LINK Mon, Oct 23 Options Jive Managing Ratio Spreads and Lizards LINK Mon, Oct 23 Anatomy of a Trade Bad Timing, Good Mechanics in TLT LINK tastytrade.com, 2017 Michael Rechenthin, PhD Kai Zeng Page 6 of 10


7 tastytrade.com, 2017 Michael Rechenthin, PhD Kai Zeng Page 7 of 10


8 tastytrade.com, 2017 Michael Rechenthin, PhD Kai Zeng Page 8 of 10


9 tastytrade.com, 2017 Michael Rechenthin, PhD Kai Zeng Page 9 of 10
10 Reading this Report Expected Range Cone. The following pages show stocks and ETFs that the tastytrade Research Team currently find have relatively high or low volatility. The colored cone represents a 30-day expected theoretical price range that is calculated from the options implied volatilities. If the implied volatility is relatively high, then the market is expecting a larger price change in the underlying stock or ETF. From this we can derive the market s 1 standard deviation theoretical expectation of where prices might be in the future. In other words, the market is expecting, with a 68% theoretical probability, that prices will fall within the boundary of the cone at the end of 30 days. Cone Color. The color of the cone is significant. The darker the color, the more extreme the implied volatility (IV) which is represented by implied volatility rank (IV Rank). This information can help you decide on a trading strategy. Glossary IV. Implied Volatility is the estimated volatility of a security s price derived from its option price; the higher the IV, the more expensive the option and therefore the larger the expected price move. IV is an annualized number of volatility, e.g. a IV of 27 means the option s market is pricing in an annualized price range, either plus or minus, of 27%. IV Rank. IV by itself doesn t tell us if if the volatility is high or low - but IV Rank does. An IV Rank of 70 means that the IV is 70% between its low and high IV over the past year. The higher the IV Rank, the higher the security s IV is compared to its past year. We provide six levels to make evaluating easier: Extremely High: IV Rank between 90 and 100 High: IV Rank between 75 and 90 Moderately High: IV Rank between 50 and 75 Moderately Low: IV Rank between 25 and 50 Low: IV Rank between 10 and 25 Extremely Low: IV Rank between 0 and 10 Option Liquidity. At tastytrade we have our own theoretical measure of option liquidity, Poor, Moderate, Good, or Great. It examines the options bid/ ask spread, open interest, and the number of strikes with non-zero bids. Correlation with S&P 500. Correlation is a statistical measure of how strong a relationship two securities have with one another. A correlation of -1 means the stocks are perfectly negatively correlated (they move in opposite directions), while a correlation of +1 means the stocks are perfectly positively correlated (they move in the same direction). A correlation of 0 means there exist little relationship. Earnings. The earnings date of the security. In practice we tend to see stocks have a larger amount of implied volatility (IV) nearer to earnings as the market is pricing in the fear of the upcoming earnings announcement. In parenthesis, is BTO or AMC; "Before the Open" or "After Market Closes", respectively. Upcoming earnings dates do sometimes change. Disclosures Options involve risk and are not suitable for all investors. Please read Characteristics and Risks of Standardized Options before deciding to invest in options: tastytrade content is provided solely by tastytrade, Inc. and is for informational and educational purposes only. It is not, nor is it intended to be, trading or investment advice or a recommendation that any security, futures contract, transaction or investment strategy is suitable for any person. Trading securities can involve high risk and the loss of any funds invested. tastytrade, through its content, financial programming or otherwise, does not provide investment or financial advice or make investment recommendations. Investment information provided may not be appropriate for all investors, and is provided without respect to individual investor financial sophistication, financial situation, investing time horizon or risk tolerance. tastytrade is not in the business of transacting securities trades, nor does it direct client commodity accounts or give commodity trading advice tailored to any particular client s situation or investment objectives. tastytrade is not a licensed financial advisor, registered investment advisor, or a registered broker-dealer. Please read Characteristics and Risks of Standardized Options before deciding to invest in options. Futures accounts are not protected by the Securities Investor Protection Corporation (SIPC). All customer futures accounts' positions and cash balances are segregated by Apex Clearing Corporation. Futures and futures options trading is speculative and is not suitable for all investors. Please read the Risk Disclosure for Futures and Options prior to trading futures products found in Disclosures under the Documents tab. tastytrade.com, 2017 Michael Rechenthin, PhD Kai Zeng Page 10 of 10
January 24, Michael Rechenthin, PhD Frank Kaberna
 January 24, 2017 This week we provide a list of ETFs that are currently exhibiting some of the most liquid options all with a tastytrade liquidity rating of 3 or 4 stars. To dive deeper into the ETFs and
January 23, Days of Shutdown. S&P 500 Return. Start of Shutdown. President
 January 23, 2018 Options involve risk and are not suitable for all investors. Please read Characteristics and Risks of Standardized Options before deciding to invest. Previous Impact of Government Shutdowns?
April 25, Opportunity Around Earnings. We are at the peak of. Earnings Strategies. Depending on your view of a stock, we
 April 25, 2017 Opportunity Around Earnings. We are at the peak of earnings season with 63% of stocks in the S&P 500 set to release earnings within the next two weeks. Since earnings reports are an unknown,
Four Components Of A Successful Income Portfolio
 Four Components Of A Successful Income Portfolio Presented by: David Fabian Michael Fabian FMD Capital Management One Park Plaza, Suite 600 Irvine, CA 92614 Ph: 888-823-8111 F: 949-266-5788 www.fmdcapital.com
Commentary. Without deviation from the norm, progress is not possible. Frank Zappa
 LongRun Monthly Strategy Review Aug 2016 AR -0.71% AG -5.21% TMG -2.67% SP500 +0.12% R2000 +1.78% GDP -0.57% Commentary August was a quiet month in most markets with the major US equity indices making
Commentary. Our greatest weakness lies in giving up. The most certain way to succeed is always to try just one more time.
 LongRun Monthly Strategy Review May 2018 AR +0.2% AG +1.0% TMG +3.0% SP500 +2.4% GDP +0.7% Commentary Last month s commentary led off with our Absolute Return strategy moving to 100% cash for the month
Commentary. Forecasts usually tell us more about the forecaster than about the future. - Warren Buffett
 LongRun Monthly Strategy Review Nov 2016 AR +1.70% AG +2.07% TMG +1.16% SP500 +3.68% R2000 +11.08% GDP +1.35% Commentary Forecasters and pollsters are having a rough year. First Brexit and now the US presidential
Commentary. If you are the smartest person in the room, then you are in the wrong room. Attributed to Confucius
 LongRun Monthly Strategy Review Jun 2018 AR +0.9% AG +1.0% TMG -0.5% SP500 +0.6% GDP -0.8% Commentary June brought mixed messages from the markets. Worries about the Trump/Kim summit and Federal Reserve
Interactive Brokers Webcast. Options on ETFs. February 13, 2013 Presented by Russell Rhoads, CFA
 Interactive Brokers Webcast Options on ETFs February 13, 2013 Presented by Russell Rhoads, CFA Disclosure CBOE Disclosure Statement Options involve risks and are not suitable for all investors. Prior to
Commentary. Patience and perseverance have a magical effect before which difficulties disappear and obstacles vanish. - John Quincy Adams
 LongRun Monthly Strategy Review Sep 2018 AR -2.0% AG-2.5% TMG -0.3% SP500 +0.6% GDP -0.04% Commentary Last month I pointed out that the S&P 500 large cap stock index had closed higher five months in a
Commentary. CBOE Volatility Index (VIX) Brexit Election VIX
 Brexit Election VIX") LongRun Monthly Strategy Review Mar 2018 AR -0.7% AG -2.9% TMG -2.3% SP500-2.7% GDP 0.0% Commentary I finished last month s commentary with a caution that equity markets might retest the lows of February
LongRun Monthly Strategy Review Mar 2018 AR -0.7% AG -2.9% TMG -2.3% SP500-2.7% GDP 0.0% Commentary I finished last month s commentary with a caution that equity markets might retest the lows of February
Commentary. Things turn out best for the people who make the best of the way things turn out. - John Wooden
 LongRun Monthly Strategy Review Dec 2018 AR +0.1% AG -0.3% TMG -9.8% SP500-8.8% GDP -4.9% Commentary As noted last month, December got off to a bad start wiping out November s equity market gains in the
Market Observations - as of Jul 20, 2018
 Market Observations - as of Jul 20, 2018 By Carl Jorgensen - For Objective Traders - For educational purposes only. Not Financial Advice. This week we saw mostly consolidation and little change from the
LongRun Monthly Strategy Review. Commentary. Oct 2017
 LongRun Monthly Strategy Review Oct 2017 AR 1.78% AG -0.61% TMG +1.50% SP500 +2.36% R2000 +0.73% GDP +0.35% Commentary Market history says that October can be a dangerous month and 2017 marked the 40 th
Commentary. "How ridiculous and how strange to be surprised at anything which happens in life." -Marcus Aurelius
 LongRun Monthly Strategy Review Aug 2017 AR +0.72% AG +1.64% TMG +0.36% SP500 +0.29% R2000-1.54% GDP +0.67% Commentary After posting new all-time highs the first week of August, US equity markets had a
FLOW AND SHORT INTEREST ANALYSIS 04/03/2015 < Last closing date US Broad Indices 05/03/2015 3:52 AM CET < Report creation date & time
 4/3/ < Last closing date US Broad Indices /3/ 3:2 AM CET < Report creation date & time ETF Tracking (SI / Daily D_MAV D MAV MSCI World URTH 74.1 -.3% -.6% 3.4% 4.1% Bullish Bullish MSCI Emerging EEM 39.9-1.1%
High Probability ETF Trading For All
 High Probability ETF Trading For All Version 2.10 Strategy Report Chris White, March 2014 Includes full year results 01/01/2009 to 12/31/13 And Last 3 months results (01/12/13 to 02/28/14) Contents Disclaimer...
Commentary. You can t overlook volatility, but you don t let it push you around in the market - Boone Pickens
 LongRun Monthly Strategy Review Nov 2018 AR +0.2% AG -0.9% TMG +2.4% SP500 +1.9% GDP +0.8% Commentary By way of a recap, US equity markets spent most of October going down before a scramble to recover
TheTechnicalTraders - Advance Options Alerts Total Gross Gain ($) Return (%)
 Return (%)") TheTechnicalTraders - Advance Options Alerts 2011 2012 2013 2014 Total Gross Gain ($) $8,699 $11,990 $10,434 $5,786 $36,909 Return (%) 17.31% 20.34% 14.71% 7.11% 59.47% Date Opened Date Closed Trade Type
TheTechnicalTraders - Advance Options Alerts 2011 2012 2013 2014 Total Gross Gain ($) $8,699 $11,990 $10,434 $5,786 $36,909 Return (%) 17.31% 20.34% 14.71% 7.11% 59.47% Date Opened Date Closed Trade Type
High Probability ETF Trading For All
 High Probability ETF Trading For All Version 2.7 Strategy Report Chris White, August 2012 Includes results to end of July 2012 Contents Disclaimer... 2 Summary... 3 The High Probability ETF Trading book
Market Observations - as of Sep 7, 2018
 Market Observations - as of Sep 7, 2018 By Carl Jorgensen - For Objective Traders - For educational purposes only. Not Financial Advice. Last week we saw a strong and broad rally to new all time highs
The Forecast for Risk in 2013
 The Forecast for Risk in 2013 January 8, 2013 by Geoff Considine With the new year upon us, pundits are issuing their forecasts of market returns for 2013 and beyond. But returns don t occur in a vacuum
Market Recap. TTG Market View. US ETF Index performance (5d): SPY +1.0%, DIA +1.4%, IWM +1.3%, QQQ +2.0%, TLT -0.3%, GLD -1.4%
: SPY +1.0%, DIA +1.4%, IWM +1.3%, QQQ +2.0%, TLT -0.3%, GLD -1.4%") US ETF Index performance (5d): SPY +1.0%, DIA +1.4%, IWM +1.3%, QQQ +2.0%, TLT -0.3%, GLD -1.4% Market Recap US Equities broke out of their +1mo sideways pattern last week. QQQs led the SPX for the 4 th
US ETF Index performance (5d): SPY +1.0%, DIA +1.4%, IWM +1.3%, QQQ +2.0%, TLT -0.3%, GLD -1.4% Market Recap US Equities broke out of their +1mo sideways pattern last week. QQQs led the SPX for the 4 th
Market Observations - as of Aug 17, 2018
 Market Observations - as of Aug 17, 2018 By Carl Jorgensen - For Objective Traders - For educational purposes only. Not Financial Advice. This week we saw a reversal of roles from the prior week. This
Commentary. "The inevitable may be certain, but it is not always punctual." - Jim Grant - Grant's Interest Rate Observer
 LongRun Monthly Strategy Review Nov 2017 AR +2.2% AG +2.1% TMG +2.7% SP500 +3.1% R2000 +2.9% GDP +0.9% Commentary November saw global markets focused on the prospects for US tax reform and Washington managed
Commentary. Just because the river is quiet doesn't mean the crocodiles have left. Malay proverb
 LongRun Monthly Strategy Review Mar 2016 AR -0.11% AG +8.52% TMG +1.91% SP500 +6.72% R2000 +8.02% GDP +9.17% Commentary Equity markets around the world registered impressive gains in March as follow-through
FLOW AND SHORT INTEREST ANALYSIS 27/04/2015 < Last closing date US Broad Indices 28/04/2015 1:23 AM CET < Report creation date & time
 27/4/ < Last closing date US Broad Indices 28/4/ 1:23 AM CET < Report creation date & time ETF Tracking (SI / Daily D_MAV D MAV MSCI World URTH 7. -.1% 2.8%.4% 6.4% Bullish Bullish MSCI Emerging EEM 44..4%
Commentary. "How ridiculous and how strange to be surprised at anything which happens in life." - Marcus Aurelius, Stoic philosopher
 LongRun Monthly Strategy Review Jan 2018 AR +5.2% AG +5.3% TMG +5.1% SP500 +5.6% R2000+2.6% GDP +2.8% Commentary January took global markets to new heights after a better than expected 2017. Last month
Strategies with Weeklys Options
 SM Strategies with Weeklys Options CBOE Disclaimer Options involve risks and are not suitable for all investors. Prior to buying or selling options, an investor must receive a copy of Characteristics and
Matt Hougan Graduate Seminar: Paul Britt, CFA
 Graduate Seminar: ETF Options Matt Hougan President ETF.com Strategies: Hedging Risk, Building Income Paul Britt, CFA Senior ETF Specialist ETF.com ETF Options Strategies - Agenda Landscape Refresher Income
Pursuant to Section 19(b)(1) of the Securities Exchange Act of 1934 ( Act ) 1, and Rule
(1) of the Securities Exchange Act of 1934 ( Act ) 1, and Rule") This document is scheduled to be published in the Federal Register on 03/16/2016 and available online at http://federalregister.gov/a/2016-05854, and on FDsys.gov 8011-01p SECURITIES AND EXCHANGE COMMISSION
This document is scheduled to be published in the Federal Register on 03/16/2016 and available online at http://federalregister.gov/a/2016-05854, and on FDsys.gov 8011-01p SECURITIES AND EXCHANGE COMMISSION
M E M O R A N D U M. RE: Options Specialist Shortfall Fee February 2009
 Memo #2023-08 M E M O R A N D U M TO: FROM: Members and Member Organizations Tom Wittman, President DATE: December 2, 2008 RE: Options Specialist Shortfall Fee February 2009 As previously announced in
Market Recap. TTG Market View. US ETF Index performance (5d): SPY -0.8%, DIA -0.7%, IWM -0.3%, QQQ -1.4%, TLT +1.2%, GLD +1.9%
: SPY -0.8%, DIA -0.7%, IWM -0.3%, QQQ -1.4%, TLT +1.2%, GLD +1.9%") US ETF Index performance (5d): SPY -0.8%, DIA -0.7%, IWM -0.3%, QQQ -1.4%, TLT +1.2%, GLD +1.9% Market Recap Last week Santa was a no show as equities continue to consolidate and move a bit lower. The
US ETF Index performance (5d): SPY -0.8%, DIA -0.7%, IWM -0.3%, QQQ -1.4%, TLT +1.2%, GLD +1.9% Market Recap Last week Santa was a no show as equities continue to consolidate and move a bit lower. The
With Rates Retreating, Bonds Back in Fashion
 Defensive ETFs: December U.S. ETF 2011 Flows: Performance May 2014 FINANCIAL PRODUCTS RESEARCH ETF RESEARCH January & STRATEGY 9, 2011 U.S. ETF flows were $12.7 billion in May representing 0.7% of assets
EQUITY-FIXED INCOME CURRENCY-COMMODITY
 1 / 5 04/10/2016 USD ETFs 07/04/2017 Absolute Scoring & Ranking EQUITY-FIXED INCOME CURRENCY-COMMODITY Weekly Review www.trendandtiming.com 2/5 Weekly Report USD ETF EQUITIES EQUITY W-1 3-Nov-17 AVG AVG
Pursuant to Section 19(b)(1) of the Securities Exchange Act of 1934 ( Act ), 1 and Rule
(1) of the Securities Exchange Act of 1934 ( Act ), 1 and Rule") This document is scheduled to be published in the Federal Register on 08/03/2016 and available online at http://federalregister.gov/a/2016-18313, and on FDsys.gov 8011-01p SECURITIES AND EXCHANGE COMMISSION
This document is scheduled to be published in the Federal Register on 08/03/2016 and available online at http://federalregister.gov/a/2016-18313, and on FDsys.gov 8011-01p SECURITIES AND EXCHANGE COMMISSION
Market Overview. Sector Overview
 September 20, 2010 The Weekly ETF Report is based on ValuEngine Chief Market Strategist Richard Suttmeier's proprietary market analytics. Suttmeier combines his technical analysis expertise with ValuEngine's
EQUITY-FIXED INCOME CURRENCY-COMMODITY
 1 / 5 04/10/2016 USD ETFs 07/04/2017 Absolute Scoring & Ranking EQUITY-FIXED INCOME CURRENCY-COMMODITY Weekly Review www.trendandtiming.com 2/5 Weekly Report USD ETF EQUITIES EQUITY W-1 11-Aug-17 AVG AVG
Thank you For Reading
 Thank you For Reading Welcome to the FIFTH issue of the TradingFibz, LLC weekly supplemental newsletter. It is my hope that the newsletter will take on a new look and add in additional features to make
BOX Penny Pilot Report: Penny Pilot Report 7
 BOX Penny Pilot Report: Penny Pilot Report 7 Table of Contents Chapter 1- Overview and Summary 1.1 Purpose and Scope.. 3 1.2 Summary.. 5 Chapter 2- Quality of Markets 2.1 Best Bid/Ask Spread... 7 2.2 Bid/Ask
Market Observations - as of May 18, 2018
 Market Observations - as of May 18, 2018 By Carl Jorgensen - For Objective Traders - For educational purposes only. Not Financial Advice. After about 4 weeks of a relatively flat horizontal market (in
THE FOUNDATION REPORT. Cycle Projections September 2014 Copyright ID CSN All Rights Reserved
 THE FOUNDATION REPORT Cycle Projections September 2014 Copyright ID CSN0093894 All Rights Reserved FSC PUBLICATIONS STAFF Cycle Projections - The Foundation Report Editors Barry McHale Terrance O Neil
Weekly Market Update
 1 Weekly Market Update 7-19-17 2017 Phoenix Capital Research, Phoenix Capital Management Inc. All Rights Reserved. Protected by copyright laws of the United States and international treaties. This newsletter
Weekly Market Update Part 2
 1 Weekly Market Update 6-22-17 Part 2 2017 Phoenix Capital Research, Phoenix Capital Management Inc. All Rights Reserved. Protected by copyright laws of the United States and international treaties. This
LongRun Monthly Strategy Summary (4/30/2014) Commentary
 Commentary") Commentary As I mentioned in last month s commentary, April was set up to be a dog fight with ARv2 fully invested in US equities and Aggressive Growth and original AR positioned defensively with 67% bonds
Commentary As I mentioned in last month s commentary, April was set up to be a dog fight with ARv2 fully invested in US equities and Aggressive Growth and original AR positioned defensively with 67% bonds
Tortoise daily report
 4/17/2017 Tortoise daily report A collection of research and systems signals designed to provide a robust framework for developing daily trading plans that can support 3 different trading timeframes: intraday,
Market Observations as of Nov 17, 2017
 Market Observations as of Nov 17, 2017 By Carl Jorgensen - For Objective Traders - For educational purposes only. Not Financial Advice. This week we saw a variety of market moves. The daily charts for
A sampling of research & data on exchange traded funds from AltaVista Research
 A sampling of research & data on exchange traded funds from AltaVista Research In this week's issue: Chart of the week: Nuclear vs. Clean Energy ETFs Fund Focus: ishares S&P Global Nuclear Energy (NUCL)...
Market Observations - as of Jun 8, 2018
 Market Observations - as of Jun 8, 2018 By Carl Jorgensen - For Objective Traders - For educational purposes only. Not Financial Advice. Over the past four months we have seen several examples of Consolidation
MACRO CHART BOOK Q2, 2016
 Adaptive Investing MACRO CHART BOOK Q2, 2016 Upside Participation Downside Management For Investment Advisors and Institutions Only Content Summary US Economy Market Snapshot Asset Class Performance Equity
Tortoise daily report
 3/5/2018 Tortoise daily report A collection of research and systems signals designed to provide a robust framework for developing daily trading plans that can support 3 different trading timeframes: intraday,
Columbus Asset Allocation Report For Portfolio Rebalancing on
 Columbus Asset Allocation Report For Portfolio Rebalancing on 2017-08-31 Strategy Overview Columbus is a global asset allocation strategy designed to adapt to prevailing market conditions. It dynamically
BOX Penny Pilot Report: Penny Pilot Report 5
 BOX Penny Pilot Report: Penny Pilot Report 5 Table of Contents Chapter 1- Overview and Summary 1.1 Purpose and Scope.. 3 1.2 Summary.. 5 Chapter 2- Quality of Markets 2.1 Best Bid/Ask Spread... 7 2.2 Bid/Ask
BOX Penny Pilot Report: Penny Pilot Report 4
 BOX Penny Pilot Report: Penny Pilot Report 4 Table of Contents Chapter 1- Overview and Summary 1.1 Purpose and Scope.. 3 1.2 Summary.. 5 Chapter 2- Quality of Markets 2.1 Best Bid/Ask Spread... 7 2.2 Bid/Ask
Market Observations - as of Aug 24, 2018
 Market Observations - as of Aug 24, 2018 By Carl Jorgensen - For Objective Traders - For educational purposes only. Not Financial Advice. This week we mostly saw quiet changes in leadership as sector rotation
Tortoise daily report
 9/11/2014 Tortoise daily report A collection of research and systems signals designed to provide a robust framework for developing daily trading plans that can support 3 different trading timeframes: intraday,
Market Observations - as of Jul 6, 2018
 Market Observations - as of Jul 6, 2018 By Carl Jorgensen - For Objective Traders - For educational purposes only. Not Financial Advice. The shortened Holiday Market week saw mostly horizontal chop until
Market Observations - as of May 11, 2018
 Market Observations - as of May 11, 2018 By Carl Jorgensen - For Objective Traders - For educational purposes only. Not Financial Advice. After about four weeks of very little net change in the major indexes
Market Observations - as of Oct 19, 2018
 Market Observations - as of Oct 19, 2018 By Carl Jorgensen - For Objective Traders - For educational purposes only. Not Financial Advice. Last week ended with a rather small bounce after a large volatile
Market Observations as of Dec 8, 2017
 Market Observations as of Dec 8, 2017 By Carl Jorgensen - For Objective Traders - For educational purposes only. Not Financial Advice. The Market Rotation we saw last week, with an exit from Tech into
Market Observations - as of Sep 28, 2018
 Market Observations - as of Sep 28, 2018 By Carl Jorgensen - For Objective Traders - For educational purposes only. Not Financial Advice. The month week, month and quarter ended with not much change in
Prepared By: David Advisor Prepared for: Joe Investor
 Prepared By: David Advisor Prepared for: Joe Investor Content Investment philosophy Risk preference Asset mix History performance Portfolio constitution Disclaimer Date: 2009 10 2 RiskFile Porfolio Composer:
Market Observations - as of Jul 27, 2018
 Market Observations - as of Jul 27, 2018 By Carl Jorgensen - For Objective Traders - For educational purposes only. Not Financial Advice. This week began with most markets continuing their bullish trends
U.S. EXCHANGE TRADED FUNDS MONTHLY FLASH APRIL 2017
 U.S. EXCHANGE TRADED FUNDS MONTHLY FLASH APRIL 2017 NYSE ARCA U.S. EXCHANGE TRADED FUNDS (ETFs) HIGHLIGHTS FROM APRIL 2017 In April, 5 new ETFs 1 listed on NYSE Arca At the end of April, 1,514 ETFs were
Weekly Market Update
 1 Weekly Market Update 5-3-17 2017 Phoenix Capital Research, Phoenix Capital Management Inc. All Rights Reserved. Protected by copyright laws of the United States and international treaties. This newsletter
Market Observations as of Mar 2, 2018
 Market Observations as of Mar 2, 2018 By Carl Jorgensen - For Objective Traders - For educational purposes only. Not Financial Advice. The markets were mixed this week as volatility raised its head back
U.S. EXCHANGE TRADED FUNDS MONTHLY FLASH AUGUST 2017
 U.S. EXCHANGE TRADED FUNDS MONTHLY FLASH AUGUST 2017 NYSE ARCA U.S. EXCHANGE TRADED FUNDS (ETFs) HIGHLIGHTS FROM AUGUST 2017 In August, 12 new ETFs 1 listed on NYSE Arca At the end of August, 1,459 ETFs
Market Observations as of Dec 22, 2017
 Market Observations as of Dec 22, 2017 By Carl Jorgensen - For Objective Traders - For educational purposes only. Not Financial Advice. This week began with a continuation of the bullish trends on Monday
Today s Presentation. 1) Detecting Institutional Activity in Stocks. 2) Finding Institutional Imbalances. 3) Selected Stocks Through LSI Charts
 Detecting Institutional Activity in Stocks. 2) Finding Institutional Imbalances. 3) Selected Stocks Through LSI Charts") Good Morning! Today s Presentation 1) Detecting Institutional Activity in Stocks 2) Finding Institutional Imbalances 3) Selected Stocks Through LSI Charts Bud Leedom 1992 1993 1999 2007 2016 Created LSI
Good Morning! Today s Presentation 1) Detecting Institutional Activity in Stocks 2) Finding Institutional Imbalances 3) Selected Stocks Through LSI Charts Bud Leedom 1992 1993 1999 2007 2016 Created LSI
Exchange Traded Funds, more commonly known as ETFs, have been
 Trading by Numbers: Scoring Strategies for Every Market By Rick Swope and W. Shawn Howell Copyright 2012 by Rick Swope and W. Shawn Howell APPENDIX B Exchange Traded Funds (ETFs) Exchange Traded Funds,
Market Line Weekly Newsletter
 Market Line Weekly Newsletter December 17, 2017 Stock Watch: The trend is up and the bulls have the momentum. A close below the 12/1 low in any of the major indices (the Dow, the S&P, the QQQ, IWM, and
Chart 1: Dow Jones Industrial Average. Chart 2: Dow Jones Transportation Average
 December 17th, 2018 1 You are probably going to hear a lot about Dow Theory in the coming days and weeks. Just like the death crosses that have been occurring in several broad market indices, Dow Theory
U.S. EXCHANGE TRADED FUNDS MONTHLY FLASH OCTOBER 2017
 U.S. EXCHANGE TRADED FUNDS MONTHLY FLASH OCTOBER 2017 NYSE ARCA U.S. EXCHANGE TRADED FUNDS (ETFs) HIGHLIGHTS FROM OCTOBER 2017 In October, 18 new ETFs 1 listed on NYSE Arca At the end of October, 1,459
August U.S. ETP Monthly Flash
 August 2014 U.S. ETP Monthly Flash NYSE Arca U.S. Exchange Traded Products (ETP) Highlights from August 2014 In August, 13 new ETPs listed on NYSE Arca At the end of August, 1,477 ETPs were listed on NYSE
US Index performance (5d): SPX +2.3%, DJIA +2.1%, RTY +3.4%, NDX +3.4%, TLT -0.2%.
: SPX +2.3%, DJIA +2.1%, RTY +3.4%, NDX +3.4%, TLT -0.2%.") US Index performance (5d): SPX +2.3%, DJIA +2.1%, RTY +3.4%, NDX +3.4%, TLT -0.2%. The week ended with Fed Chair Janet Yellen confirming during an interview at Harvard University that a rate increase may
US Index performance (5d): SPX +2.3%, DJIA +2.1%, RTY +3.4%, NDX +3.4%, TLT -0.2%. The week ended with Fed Chair Janet Yellen confirming during an interview at Harvard University that a rate increase may
Weeklys Options What s New?
 Interactive Brokers Webcast SM Weeklys Options What s New? July 17, 2013 Presented by Russell Rhoads, CFA Senior Instructor Disclosure CBOE Disclosure Statement Options involve risks and are not suitable
Weekly Market Update
 1 Weekly Market Update 9-6-17 2017 Phoenix Capital Research, Phoenix Capital Management Inc. All Rights Reserved. Protected by copyright laws of the United States and international treaties. This newsletter
Thank you For Reading
 Thank you For Reading Welcome to the 7th issue of the TradingFibz, LLC weekly supplemental newsletter. Templates now available for purchase and added video each week. At some point in the near future,
Market Observations as of Aug 4, 2017
 Market Observations as of Aug 4, 2017 By Carl Jorgensen - For Objective Traders - For educational purposes only. Not Financial Advice. This week The mixed responses to earnings this week has resulted in
July U.S. ETP Monthly Flash
 July 2016 U.S. ETP Monthly Flash NYSE Arca U.S. Exchange Traded Products (ETP) Highlights from July 2016 In July, 11 new ETPs listed on NYSE Arca At the end of July, 1,572 ETPs were listed on NYSE Arca
The Investing Climate
 November 18, 2018. Volume 14 The Investing Climate It has been a wild ride in the stock market these past couple of months. While history usually points to a wild October, a wild November is surprising
DBA Begins To Launch Mike Swanson (06/05/2016) So many small fries got shaken out by the recent gold drop.
 So many small fries got shaken out by the recent gold drop.") DBA Begins To Launch Mike Swanson (06/05/2016) The chart above is of course the DBA ETF. I have a 20% position in DBA in the model ETF rebalancing portfolio and also as a core position of similar size
DBA Begins To Launch Mike Swanson (06/05/2016) The chart above is of course the DBA ETF. I have a 20% position in DBA in the model ETF rebalancing portfolio and also as a core position of similar size
U.S. ETP MONTHLY FLASH
 U.S. ETP MONTHLY FLASH JANUARY 2013 Source: NYSE Arca ETP Database and Arc vision. Statistics include only NYSE Arca listed ETPs which are derivatively priced securities that can trade intraday on a securities
S&P 500 Buybacks Fall 17.5% Year-over-Year to $133.1 Billion for Q1 2017
 S&P 500 Buybacks Fall 17.5% Year-over-Year to $133.1 Billion for Q1 2017 Q1 2017 repurchases is 1.6% less than Q4 2016 and 17.5% less than Q1 2016 EPS support via share count reduction significantly declines
You are getting this because you are a paid up member to my Fearless Wealth Research Service AND this is your May 2017 Research update.
 Hi Guys, You are getting this email because you are a paid up member to my Fearless Wealth Research Service AND this is your May 2017 Research update. High Level: Part I. The S&P500 is in Green Light Mode
Market Observations as of Aug 25, 2017
 Market Observations as of Aug 25, 2017 By Carl Jorgensen - For Objective Traders - For educational purposes only. Not Financial Advice. We saw a confirmation of bearish behaviors last week, and not much
GS Momentum Builder Multi-Asset 5S ER Index-Linked CDs Due 2024
 GS Momentum Builder Multi-Asset 5S ER Index-Linked CDs Due 2024 OVERVIEW The CDs do not bear interest. At maturity an investor in the CDs will be paid an amount in cash equal to the face amount of their
Trend Report 11/2017
 Trend Report 11/2017 Table of Contents Macroeconomic Data GDP ECRI Leading Economic Indicators Intermarket Relationships-Trends Stocks vs. Bonds Stocks vs. Gold High Yield vs. Treasuries TIPs vs. Treasuries
Weekly Market Update
 1 Weekly Market Update 3-23-17 2017 Phoenix Capital Research, Phoenix Capital Management Inc. All Rights Reserved. Protected by copyright laws of the United States and international treaties. This newsletter
The Technical Portfolio
 Volume 18 Monthly Return Comparison Regular Portfolio +2.73% Aggressive Portfolio +2.68% S&P 500 +1.69% Dow Jones Industrial Average -0.13% Nasdaq Composite +2.89% Russell 2000-1.00% March 17, 2019 The
SELECT YOUR SECTORS. Respond to Market Cycles with Agility and Precision
 SELECT YOUR SECTORS Respond to Market Cycles with Agility and Precision ECONOMIC CYCLES & SECTORS The economy moves in cycles. Specific sectors may outperform or underperform during different phases, driven
March U.S. ETP Monthly Flash
 March 2016 U.S. ETP Monthly Flash NYSE Arca U.S. Exchange Traded Products (ETP) Highlights from March 2016 In March, 10 new ETPs listed on NYSE Arca At the end of March, 1,558 ETPs were listed on NYSE
SPOTTING TRENDS. Sectors & Industries
 Sectors & Industries SPOTTING TRENDS Q4 2017 With each ebb and flow in the market, trends emerge that present opportunities for investors provided they have the necessary tools for action. Because firms
Mastering the Markets
 www.mastermindtraders.com Presents Mastering the Markets Your Path to Financial Freedom DISCLAIMER Neither or any of its personnel are registered broker-dealers or investment advisors. We may mention that
Real-time Analytics Methodology
 New High/Low New High/Low alerts are generated once daily when a stock hits a new 13 Week, 26 Week or 52 Week High/Low. Each second of the trading day, the stock price is compared to its previous 13 Week,
TradeOptionsWithMe.com
 TradeOptionsWithMe.com 1 of 18 Option Trading Glossary This is the Glossary for important option trading terms. Some of these terms are rather easy and used extremely often, but some may even be new to
Market Volatility Bulletin
 ( Skew Ratio Percentile (Last 5 Years) Weekly Market Commentary March 10, 2014 Market Volatility Bulletin Hedging Demand Increases on Rising Cross-Asset Contagion Equity Derivatives Strategy Weekly IMPLIED
Exchange Traded Funds ETFs
 Exchange Traded Funds ETFs Table of Content: Topic Page Exchange Traded Funds Definition 3 Exchange Traded Funds Creation and Redemption 3 Exchange Traded Funds benefits 4 Exchange Traded Funds Types 6
KEY ETF REPORT BY ASSET CLASS (US LISTED)
") 08/05/2015 < Last closing Date TOP/BOTTOM PERFORMERS 1 D (in $bn) 11/05/2015 < Current Date 10:49 PM CET (For US Listed ETF's, "today's" prices reflect last closing prices. For futures and spot FX, "today's"
08/05/2015 < Last closing Date TOP/BOTTOM PERFORMERS 1 D (in $bn) 11/05/2015 < Current Date 10:49 PM CET (For US Listed ETF's, "today's" prices reflect last closing prices. For futures and spot FX, "today's"
Top Down Analysis Success Demands Singleness of Purpose
 Chapter 9 Top Down Analysis Success Demands Singleness of Purpose Armed with a little knowledge about the stock and options market as well as a desire to trade, many new traders are faced with the daunting