Modeling Error Variances Understanding CH, ARCH and GARCH Models
|
|
|
- Paulina Caldwell
- 5 years ago
- Views:
Transcription

1 Modeling Error Variances Understanding CH, ARCH and GARCH Models J. Stuart McMenamin Itron s Forecasting Brown Bag Seminar March 9, 011
2 Please Remember In order to help this session run smoothly, your phones are muted. To make the presentation portion of the screen larger, press the expand button on the toolbar. Press it again to return to regular window. If you need to give other feedback to the presenter during the meeting, such as, slow down or need to get the presenters attention for some other reason, use the pull down menu in the seating chart and we will address it right away. If you have questions, please type your question in the Q&A box in the bottom, right corner. We will try to answer as many questions as we can. 009, Itron Inc.
3 011 Brown Bag Seminars Modeling Error Variances --Understanding CH, ARCH and GARCH models -March 9, 011 What is a Good Model? -June 1, 011 System Operations Forecasting - September 13, 011 Variables For Each Time Horizon-December 13, 011 All at noon, Pacific Time All are recorded and available for review after the session. 009, Itron Inc. 3
4 Agenda Overview of error variance assumptions in linear models Tests for constant variance (homoskedasticity) Specifications for CH, ARCH, GARCH Estimation of heteroskedastic models Application to financial data (S&P 500) Application to energy usage data (daily load) Conclusions 009, Itron Inc. 4
5 The Standard Linear Model Standard linear model Y = βx + e t t t > e values are independent > identically distributed > normally distributed Skedasis is greek for dispersion The skedistic function is the variance function for a model In the standard linear model, the variance function is very simple: Var Cov ( e ) = σ ( variance is constant) t ( e,e ) 0 t t j = When variance is not constant, errors are heteroskedastic Constant variance is called homoskedastic 009, Itron Inc. 5
6 Depiction of Homoskedasticity In the single variable case (Y=a+bX+e) Y Constant Variance True Model X 009, Itron Inc. 6
7 Implications of Heteroskedasticity Least squares parameter estimators are unbiased and consistent Least squares parameter estimators are not efficient (the variances of the estimated parameters are not the minimum variance estimates). The problem is that least squares weights all squared errors equally. Observations when variances are large will tend to have large errors and even bigger squared errors. These observations will have too large an influence on the estimates. The standard solution is to build a variance model and use generalized (weighted) least squares > The goal is to weight each squared error by the inverse of its variance. > This can be accomplished in the simple case by dividing Y and the X s by the estimated standard error (square root of the variance) for each observation. 009, Itron Inc. 7
8 Tests for Heteroskedasticity Estimate Least Squares and get residuals Estimate model of residuals > ei = c0 + c1z1 + cz +... (Breusch-Pagan) > ei = c0 + c1z1 + cz +... (Glejser) ( )... > lnei = c0 + c1z1 + cz + (Harvey- Godfrey) > ei = a0 + a1x akxk + b1x c1x1x +... (White) Compute Lagrange Multiplier (LM) test statistic = n R Under null hypothesis of homoskedasticerrors, LM has a chi squared distribution with L-1 degrees of freedom (where L is the number of parameters in the residual model). 009, Itron Inc. 8

9 Have you run any tests for heteroskedasticityin your sales or peak forecasting models? 009, Itron Inc. 9
10 Forms of Heteroskedasticity Discussed Today Contitional heteroskedasticity Var ( e ) = v = c + cz1 + c Z... t t 0 1 t t + Autoregressive conditional heteroskedasticity (ARCH Engle 198) ( e ) = v = c + c e + c e +... Var = t 0 1 t 1 t t + Generalized autoregressive conditional heteroskedasticity (Bollerslev 1986) ( e ) t + Var = vt = c0 + c1et 1 + cet d1vt 1 + dvt... Innovation Terms Persistence Terms 009, Itron Inc. 10


11 That s Not All From Glossary to ARCH (GARCH), Bollerslev, 007 Available at: 009, Itron Inc. 11
12 Estimation Method for ARCH/GARCH Model for GARCH(1,1) Y t = βxt + et etisn0, ( vt ) v = c + ce d v t 0 1 t t 1 Maximize the Likelihood Function L = t 1 πv t exp 1 e v Equilavent is to minimize ln(l) ln(l) 1 t ln ( v ) Find the parameters (β,c,d) that minimize this function > Note the parallels to OLS and GLS t + e v t t t t 009, Itron Inc. 1
13 Data for S&P 500 Picture of constant variance Daily Close Change Change , Itron Inc. 13


14 The Model in MetrixND 009, Itron Inc. 14

 T ( X t X) 009, Itron Inc. 15")
15 Regression Result Delta Regression Confidence 1 σf = σˆ 1+ + Band T t= ( Xf X) T ( X t X) 009, Itron Inc. 15

16 White Test for Heteroskedasticity Residual Squared n R χ 95%,8 = = 53.5 =.73 Prob =.0000 Predicted Variance , Itron Inc. 16

17 ARCH(1) Model Delta ARCH Confidence Band , Itron Inc. 17


18 GARCH(1,1) Model Delta GARCH Confidence Band , Itron Inc. 18


19 What do we learn We get different parameters. The regression parameters are the average daily change in each year. The variance model of indicates that volatility is persistent. We get a direct estimate and forecast of volatility. Regression GARCH(1,1) 009, Itron Inc. 19
20 How does this apply to our typical problem Typical problem is explaining and forecasting: > Customers > Energy usage (sales) > System peaks Example with daily energy data 009, Itron Inc. 0

21 Daily Energy Scatter Plot Visually the data appear to be relatively homoskedastic once temperature is accounted for Weekdays Saturday Sunday Holiday 009, Itron Inc. 1
22 Do you use weighted least squares or another method to adjust for heteroskedasticityin your sales and peak forecasting models? 009, Itron Inc.


23 Regression Model Actual Predicted Residual 009, Itron Inc. 3


24 Applying the White Test n R χ 95%,40df = 64.6 = 6.5 Probability = , Itron Inc. 4
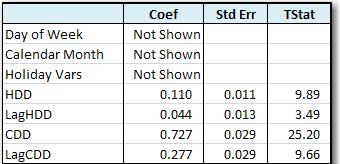
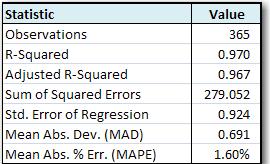
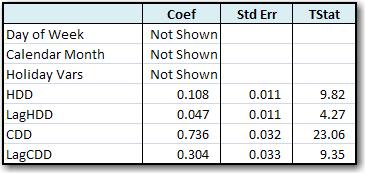
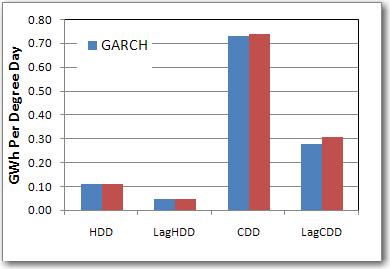
25 GARCH(1,1) Model GARCH(1,1) Regression 009, Itron Inc. 5


26 Comparison of Regression and GARCH Results Regression Sigma GARCH Sigma Regression and GARCH predicted values are almost identical Correlation = , Itron Inc. 6
27 Comparison of Confidence Bands Regression Confidence Bands GARCH(1,1) Confidence Bands 009, Itron Inc. 7
28 Conclusion Extreme heteroskedasticityis unlikely for energy consumption data. Variances are relatively stable compared to financial data. Energy processes are not volatile in a GARCH sense, where volatility today generates volatility tomorrow. When it gets hot, the loads increase, and variances may go up, but when it cools off, the load returns quickly to a normal low variance value. There is little or no volatility persistence. Estimated parameters are not likely to change significantly due to heteroskedasticity corrections. Predicted and forecasted values are not likely to be impacted significantly by heteroskedasticity corrections. Modeling of energy market prices is a more likely place to apply the ARCH and GARCH types of techniques, especially if it is valuable to quantify and forecast price volatility. 009, Itron Inc. 8
29 Should we include more functionality in MetrixND to test and adjust for heteroskedasticity? 009, Itron Inc. 9
30 011 HANDS-ON WORKSHOPS Energy Forecasting Week - May 16-0, Las Vegas > One-Day SAE Modeling Workshop May 18 > One-Day MetrixIDR Workshop May 18 Fundamentals of MetrixND - June 6-7, Boston Itron UC - September 18-0, Phoenix Fundamentals of Sales & Demand Forecasting September -3, Boston Fundamentals of Short-Term and Hourly Forecasting September 8-30, San Diego Forecasting October 4-6, San Diego Press *6 to ask a question OTHER FORECASTING MEETINGS Energy Forecasting Week - May 16-0, Las Vegas > Annual ISO/RTO Forecasting Summit May > Long-Term Forecasting/EFG Meeting May Itron Users' Conference - September 18-0, Phoenix Hotel registration deadline: April 18, 011 For more information and registration: Contact us at: , or forecasting@itron.com 009, Itron Inc. 30
The Role of Modeling and Accounting in Estimation of Unbilled Revenue Presented by: J. Stuart McMenamin
 Electric / Gas / Water The Role of Modeling and Accounting in Estimation of Unbilled Revenue Presented by: J. Stuart McMenamin Please Remember In order to help this session run smoothly, your phones are
Property of Itron. The Economic Impact of the Financial Crisis on Utility Sales. Frank A. Monforte, Ph.D. March 10, 2009
 The Economic Impact of the Financial Crisis on Utility Sales Frank A. Monforte, Ph.D. Itron s Forecasting Brown Bag Seminar March 10, 2009 Please Remember In order to help this session run smoothly, your
Chapter 4 Level of Volatility in the Indian Stock Market
 Chapter 4 Level of Volatility in the Indian Stock Market Measurement of volatility is an important issue in financial econometrics. The main reason for the prominent role that volatility plays in financial
CHAPTER III METHODOLOGY
 CHAPTER III METHODOLOGY 3.1 Description In this chapter, the calculation steps, which will be done in the analysis section, will be explained. The theoretical foundations and literature reviews are already
Financial Econometrics
 Financial Econometrics Volatility Gerald P. Dwyer Trinity College, Dublin January 2013 GPD (TCD) Volatility 01/13 1 / 37 Squared log returns for CRSP daily GPD (TCD) Volatility 01/13 2 / 37 Absolute value
Variance clustering. Two motivations, volatility clustering, and implied volatility
 Variance modelling The simplest assumption for time series is that variance is constant. Unfortunately that assumption is often violated in actual data. In this lecture we look at the implications of time
Andy Sukenik. Itron s Forecasting Brown Bag Seminar. September 14, 2010
 Technolog Choice Modeling And Sukenik Itron s Forecasting Brown Bag Seminar September 14, 2010 Please Remember In order to help this session run smoothl, our phones are muted. To make the presentation
IS INFLATION VOLATILITY CORRELATED FOR THE US AND CANADA?
 IS INFLATION VOLATILITY CORRELATED FOR THE US AND CANADA? C. Barry Pfitzner, Department of Economics/Business, Randolph-Macon College, Ashland, VA, bpfitzne@rmc.edu ABSTRACT This paper investigates the
Problem Set 9 Heteroskedasticty Answers
 Problem Set 9 Heteroskedasticty Answers /* INVESTIGATION OF HETEROSKEDASTICITY */ First graph data. u hetdat2. gra manuf gdp, s([country].) xlab ylab 300000 manufacturing output (US$ miilio 200000 100000
Time series: Variance modelling
 Time series: Variance modelling Bernt Arne Ødegaard 5 October 018 Contents 1 Motivation 1 1.1 Variance clustering.......................... 1 1. Relation to heteroskedasticity.................... 3 1.3
ARCH and GARCH models
 ARCH and GARCH models Fulvio Corsi SNS Pisa 5 Dic 2011 Fulvio Corsi ARCH and () GARCH models SNS Pisa 5 Dic 2011 1 / 21 Asset prices S&P 500 index from 1982 to 2009 1600 1400 1200 1000 800 600 400 200
Assicurazioni Generali: An Option Pricing Case with NAGARCH
 Assicurazioni Generali: An Option Pricing Case with NAGARCH Assicurazioni Generali: Business Snapshot Find our latest analyses and trade ideas on bsic.it Assicurazioni Generali SpA is an Italy-based insurance
Modeling and Forecasting Volatility in Financial Time Series: An Econometric Analysis of the S&P 500 and the VIX Index.
 F A C U L T Y O F S O C I A L S C I E N C E S D E P A R T M E N T O F E C O N O M I C S U N I V E R S I T Y O F C O P E N H A G E N Seminar in finance Modeling and Forecasting Volatility in Financial Time
Forecasting Stock Index Futures Price Volatility: Linear vs. Nonlinear Models
 The Financial Review 37 (2002) 93--104 Forecasting Stock Index Futures Price Volatility: Linear vs. Nonlinear Models Mohammad Najand Old Dominion University Abstract The study examines the relative ability
Modelling volatility - ARCH and GARCH models
 Modelling volatility - ARCH and GARCH models Beáta Stehlíková Time series analysis Modelling volatility- ARCH and GARCH models p.1/33 Stock prices Weekly stock prices (library quantmod) Continuous returns:
Panel Regression of Out-of-the-Money S&P 500 Index Put Options Prices
 Panel Regression of Out-of-the-Money S&P 500 Index Put Options Prices Prakher Bajpai* (May 8, 2014) 1 Introduction In 1973, two economists, Myron Scholes and Fischer Black, developed a mathematical model
Asian Economic and Financial Review A REGRESSION BASED APPROACH TO CAPTURING THE LEVEL DEPENDENCE IN THE VOLATILITY OF STOCK RETURNS
 Asian Economic and Financial Review ISSN(e): 2222-6737/ISSN(p): 2305-2147 URL: www.aessweb.com A REGRESSION BASED APPROACH TO CAPTURING THE LEVEL DEPENDENCE IN THE VOLATILITY OF STOCK RETURNS Lakshmi Padmakumari
Quantitative Techniques Term 2
 Quantitative Techniques Term 2 Laboratory 7 2 March 2006 Overview The objective of this lab is to: Estimate a cost function for a panel of firms; Calculate returns to scale; Introduce the command cluster
Risk Management. Risk: the quantifiable likelihood of loss or less-than-expected returns.
 ARCH/GARCH Models 1 Risk Management Risk: the quantifiable likelihood of loss or less-than-expected returns. In recent decades the field of financial risk management has undergone explosive development.
Devin Barras Case Scenario
 Devin Barras Case Scenario Devin Barras is valuing a company named Fumbler. Fumbler has been growing at a faster growth rate than the other companies in the similar industry. The company has not paid any
Lecture 5a: ARCH Models
 Lecture 5a: ARCH Models 1 2 Big Picture 1. We use ARMA model for the conditional mean 2. We use ARCH model for the conditional variance 3. ARMA and ARCH model can be used together to describe both conditional
Volatility Clustering of Fine Wine Prices assuming Different Distributions
 Volatility Clustering of Fine Wine Prices assuming Different Distributions Cynthia Royal Tori, PhD Valdosta State University Langdale College of Business 1500 N. Patterson Street, Valdosta, GA USA 31698
Tests for One Variance
 Chapter 65 Introduction Occasionally, researchers are interested in the estimation of the variance (or standard deviation) rather than the mean. This module calculates the sample size and performs power
Graduate School of Business, University of Chicago Business 41202, Spring Quarter 2007, Mr. Ruey S. Tsay. Solutions to Final Exam
 Graduate School of Business, University of Chicago Business 41202, Spring Quarter 2007, Mr. Ruey S. Tsay Solutions to Final Exam Problem A: (30 pts) Answer briefly the following questions. 1. Suppose that
Financial Econometrics Notes. Kevin Sheppard University of Oxford
 Financial Econometrics Notes Kevin Sheppard University of Oxford Monday 15 th January, 2018 2 This version: 22:52, Monday 15 th January, 2018 2018 Kevin Sheppard ii Contents 1 Probability, Random Variables
Downside Risk: Implications for Financial Management Robert Engle NYU Stern School of Business Carlos III, May 24,2004
 Downside Risk: Implications for Financial Management Robert Engle NYU Stern School of Business Carlos III, May 24,2004 WHAT IS ARCH? Autoregressive Conditional Heteroskedasticity Predictive (conditional)
The Efficient Market Hypothesis Testing on the Prague Stock Exchange
 The Efficient Market ypothesis Testing on the Prague Stock Exchange Miloslav Vošvrda, Jan Filacek, Marek Kapicka * Abstract: This article attempts to answer the question, to what extent can the Czech Capital
Gov 2001: Section 5. I. A Normal Example II. Uncertainty. Gov Spring 2010
 Gov 2001: Section 5 I. A Normal Example II. Uncertainty Gov 2001 Spring 2010 A roadmap We started by introducing the concept of likelihood in the simplest univariate context one observation, one variable.
Brief Sketch of Solutions: Tutorial 2. 2) graphs. 3) unit root tests
 graphs. 3) unit root tests") Brief Sketch of Solutions: Tutorial 2 2) graphs LJAPAN DJAPAN 5.2.12 5.0.08 4.8.04 4.6.00 4.4 -.04 4.2 -.08 4.0 01 02 03 04 05 06 07 08 09 -.12 01 02 03 04 05 06 07 08 09 LUSA DUSA 7.4.12 7.3 7.2.08 7.1.04
Brief Sketch of Solutions: Tutorial 2 2) graphs LJAPAN DJAPAN 5.2.12 5.0.08 4.8.04 4.6.00 4.4 -.04 4.2 -.08 4.0 01 02 03 04 05 06 07 08 09 -.12 01 02 03 04 05 06 07 08 09 LUSA DUSA 7.4.12 7.3 7.2.08 7.1.04
Oil Price Effects on Exchange Rate and Price Level: The Case of South Korea
 Oil Price Effects on Exchange Rate and Price Level: The Case of South Korea Mirzosaid SULTONOV 東北公益文科大学総合研究論集第 34 号抜刷 2018 年 7 月 30 日発行 研究論文 Oil Price Effects on Exchange Rate and Price Level: The Case
The Estimation Model for Measuring Performance of Stock Mutual Funds Based on ARCH / GARCH Model
 Review of Integrative Business and Economics Research, Vol. 5, no. 2, pp.215-225, April 2016 215 The Estimation Model for Measuring Performance of Stock Mutual Funds Based on ARCH / GARCH Model Ferikawita
Research on the GARCH model of the Shanghai Securities Composite Index
 International Academic Workshop on Social Science (IAW-SC 213) Research on the GARCH model of the Shanghai Securities Composite Index Dancheng Luo Yaqi Xue School of Economics Shenyang University of Technology
12. Conditional heteroscedastic models (ARCH) MA6622, Ernesto Mordecki, CityU, HK, 2006.
 MA6622, Ernesto Mordecki, CityU, HK, 2006.") 12. Conditional heteroscedastic models (ARCH) MA6622, Ernesto Mordecki, CityU, HK, 2006. References for this Lecture: Robert F. Engle. Autoregressive Conditional Heteroscedasticity with Estimates of Variance
12. Conditional heteroscedastic models (ARCH) MA6622, Ernesto Mordecki, CityU, HK, 2006. References for this Lecture: Robert F. Engle. Autoregressive Conditional Heteroscedasticity with Estimates of Variance
Determinants of Stock Prices in Ghana
 Current Research Journal of Economic Theory 5(4): 66-7, 213 ISSN: 242-4841, e-issn: 242-485X Maxwell Scientific Organization, 213 Submitted: November 8, 212 Accepted: December 21, 212 Published: December
Amath 546/Econ 589 Univariate GARCH Models
 Amath 546/Econ 589 Univariate GARCH Models Eric Zivot April 24, 2013 Lecture Outline Conditional vs. Unconditional Risk Measures Empirical regularities of asset returns Engle s ARCH model Testing for ARCH
Lecture 6: Non Normal Distributions
 Lecture 6: Non Normal Distributions and their Uses in GARCH Modelling Prof. Massimo Guidolin 20192 Financial Econometrics Spring 2015 Overview Non-normalities in (standardized) residuals from asset return
LONG MEMORY IN VOLATILITY
 LONG MEMORY IN VOLATILITY How persistent is volatility? In other words, how quickly do financial markets forget large volatility shocks? Figure 1.1, Shephard (attached) shows that daily squared returns
A Simplified Approach to the Conditional Estimation of Value at Risk (VAR)
") A Simplified Approach to the Conditional Estimation of Value at Risk (VAR) by Giovanni Barone-Adesi(*) Faculty of Business University of Alberta and Center for Mathematical Trading and Finance, City University
A Simplified Approach to the Conditional Estimation of Value at Risk (VAR) by Giovanni Barone-Adesi(*) Faculty of Business University of Alberta and Center for Mathematical Trading and Finance, City University
Properties of financail time series GARCH(p,q) models Risk premium and ARCH-M models Leverage effects and asymmetric GARCH models.
 models Risk premium and ARCH-M models Leverage effects and asymmetric GARCH models.") 5 III Properties of financail time series GARCH(p,q) models Risk premium and ARCH-M models Leverage effects and asymmetric GARCH models 1 ARCH: Autoregressive Conditional Heteroscedasticity Conditional
5 III Properties of financail time series GARCH(p,q) models Risk premium and ARCH-M models Leverage effects and asymmetric GARCH models 1 ARCH: Autoregressive Conditional Heteroscedasticity Conditional
Introduction to Population Modeling
 Introduction to Population Modeling In addition to estimating the size of a population, it is often beneficial to estimate how the population size changes over time. Ecologists often uses models to create
GDP, PERSONAL INCOME AND GROWTH
 GDP, PERSONAL INCOME AND GROWTH PART 1: IMPACT OF NATIONAL AND OTHER STATE GROWTH ON NEVADA GDP INTRODUCTION Nevada has been heavily hit by the recession, with unemployment rates of 13.4% as of October
The Simple Regression Model
 Chapter 2 Wooldridge: Introductory Econometrics: A Modern Approach, 5e Definition of the simple linear regression model "Explains variable in terms of variable " Intercept Slope parameter Dependent var,
Your Name (Please print) Did you agree to take the optional portion of the final exam Yes No. Directions
 Did you agree to take the optional portion of the final exam Yes No. Directions") Your Name (Please print) Did you agree to take the optional portion of the final exam Yes No (Your online answer will be used to verify your response.) Directions There are two parts to the final exam.
Your Name (Please print) Did you agree to take the optional portion of the final exam Yes No (Your online answer will be used to verify your response.) Directions There are two parts to the final exam.
Solutions for Session 5: Linear Models
 Solutions for Session 5: Linear Models 30/10/2018. do solution.do. global basedir http://personalpages.manchester.ac.uk/staff/mark.lunt. global datadir $basedir/stats/5_linearmodels1/data. use $datadir/anscombe.
Lecture 5: Univariate Volatility
 Lecture 5: Univariate Volatility Modellig, ARCH and GARCH Prof. Massimo Guidolin 20192 Financial Econometrics Spring 2015 Overview Stepwise Distribution Modeling Approach Three Key Facts to Remember Volatility
Financial Econometrics Lecture 5: Modelling Volatility and Correlation
 Financial Econometrics Lecture 5: Modelling Volatility and Correlation Dayong Zhang Research Institute of Economics and Management Autumn, 2011 Learning Outcomes Discuss the special features of financial
GARCH Models. Instructor: G. William Schwert
 APS 425 Fall 2015 GARCH Models Instructor: G. William Schwert 585-275-2470 schwert@schwert.ssb.rochester.edu Autocorrelated Heteroskedasticity Suppose you have regression residuals Mean = 0, not autocorrelated
Research Article The Volatility of the Index of Shanghai Stock Market Research Based on ARCH and Its Extended Forms
 Discrete Dynamics in Nature and Society Volume 2009, Article ID 743685, 9 pages doi:10.1155/2009/743685 Research Article The Volatility of the Index of Shanghai Stock Market Research Based on ARCH and
Appendixes Appendix 1 Data of Dependent Variables and Independent Variables Period
 Appendixes Appendix 1 Data of Dependent Variables and Independent Variables Period 1-15 1 ROA INF KURS FG January 1,3,7 9 -,19 February 1,79,5 95 3,1 March 1,3,7 91,95 April 1,79,1 919,71 May 1,99,7 955
FINITE SAMPLE DISTRIBUTIONS OF RISK-RETURN RATIOS
 Available Online at ESci Journals Journal of Business and Finance ISSN: 305-185 (Online), 308-7714 (Print) http://www.escijournals.net/jbf FINITE SAMPLE DISTRIBUTIONS OF RISK-RETURN RATIOS Reza Habibi*
Volatility in the Indian Financial Market Before, During and After the Global Financial Crisis
 Volatility in the Indian Financial Market Before, During and After the Global Financial Crisis Praveen Kulshreshtha Indian Institute of Technology Kanpur, India Aakriti Mittal Indian Institute of Technology
Week 2 Quantitative Analysis of Financial Markets Hypothesis Testing and Confidence Intervals
 Week 2 Quantitative Analysis of Financial Markets Hypothesis Testing and Confidence Intervals Christopher Ting http://www.mysmu.edu/faculty/christophert/ Christopher Ting : christopherting@smu.edu.sg :
ARCH modeling of the returns of first bank of Nigeria
 AMERICAN JOURNAL OF SCIENTIFIC AND INDUSTRIAL RESEARCH 015,Science Huβ, http://www.scihub.org/ajsir ISSN: 153-649X, doi:10.551/ajsir.015.6.6.131.140 ARCH modeling of the returns of first bank of Nigeria
Handout seminar 6, ECON4150
 Handout seminar 6, ECON4150 Herman Kruse March 17, 2013 Introduction - list of commands This week, we need a couple of new commands in order to solve all the problems. hist var1 if var2, options - creates
The University of Chicago, Booth School of Business Business 41202, Spring Quarter 2009, Mr. Ruey S. Tsay. Solutions to Final Exam
 The University of Chicago, Booth School of Business Business 41202, Spring Quarter 2009, Mr. Ruey S. Tsay Solutions to Final Exam Problem A: (42 pts) Answer briefly the following questions. 1. Questions
FINANCIAL ECONOMETRICS PROF. MASSIMO GUIDOLIN
 Massimo Guidolin Massimo.Guidolin@unibocconi.it Dept. of Finance FINANCIAL ECONOMETRICS PROF. MASSIMO GUIDOLIN SECOND PART, LECTURE 1: VOLATILITY MODELS ARCH AND GARCH OVERVIEW 1) Stepwise Distribution
Volatility Spillovers and Causality of Carbon Emissions, Oil and Coal Spot and Futures for the EU and USA
 22nd International Congress on Modelling and Simulation, Hobart, Tasmania, Australia, 3 to 8 December 2017 mssanz.org.au/modsim2017 Volatility Spillovers and Causality of Carbon Emissions, Oil and Coal
PASS Sample Size Software
 Chapter 850 Introduction Cox proportional hazards regression models the relationship between the hazard function λ( t X ) time and k covariates using the following formula λ log λ ( t X ) ( t) 0 = β1 X1
Modeling the volatility of FTSE All Share Index Returns
 MPRA Munich Personal RePEc Archive Modeling the volatility of FTSE All Share Index Returns Bayraci, Selcuk University of Exeter, Yeditepe University 27. April 2007 Online at http://mpra.ub.uni-muenchen.de/28095/
The University of Chicago, Booth School of Business Business 41202, Spring Quarter 2017, Mr. Ruey S. Tsay. Solutions to Final Exam
 The University of Chicago, Booth School of Business Business 41202, Spring Quarter 2017, Mr. Ruey S. Tsay Solutions to Final Exam Problem A: (40 points) Answer briefly the following questions. 1. Describe
The data definition file provided by the authors is reproduced below: Obs: 1500 home sales in Stockton, CA from Oct 1, 1996 to Nov 30, 1998
 Economics 312 Sample Project Report Jeffrey Parker Introduction This project is based on Exercise 2.12 on page 81 of the Hill, Griffiths, and Lim text. It examines how the sale price of houses in Stockton,
Volatility Analysis of Nepalese Stock Market
 The Journal of Nepalese Business Studies Vol. V No. 1 Dec. 008 Volatility Analysis of Nepalese Stock Market Surya Bahadur G.C. Abstract Modeling and forecasting volatility of capital markets has been important
Demand For Life Insurance Products In The Upper East Region Of Ghana
 Demand For Products In The Upper East Region Of Ghana Abonongo John Department of Mathematics, Kwame Nkrumah University of Science and Technology, Kumasi, Ghana Luguterah Albert Department of Statistics,
Optimal Hedge Ratio and Hedging Effectiveness of Stock Index Futures Evidence from India
 Optimal Hedge Ratio and Hedging Effectiveness of Stock Index Futures Evidence from India Executive Summary In a free capital mobile world with increased volatility, the need for an optimal hedge ratio
Cross- Country Effects of Inflation on National Savings
 Cross- Country Effects of Inflation on National Savings Qun Cheng Xiaoyang Li Instructor: Professor Shatakshee Dhongde December 5, 2014 Abstract Inflation is considered to be one of the most crucial factors
The Simple Regression Model
 Chapter 2 Wooldridge: Introductory Econometrics: A Modern Approach, 5e Definition of the simple linear regression model Explains variable in terms of variable Intercept Slope parameter Dependent variable,
Financial Times Series. Lecture 8
 Financial Times Series Lecture 8 Nobel Prize Robert Engle got the Nobel Prize in Economics in 2003 for the ARCH model which he introduced in 1982 It turns out that in many applications there will be many
Forecasting FTSE Index Using Global Stock Markets
 Forecasting FTSE Index Using Global Stock Markets Jose G. Vega College of Business Administration University of Texas San Antonio One UTSA Circle, San Antonio, TX 7849, USA Jan M. Smolarski (Corresponding
Old Exam 3 Solutions
 Amherst College Department of Economics Economics 360 Old Exam 3 Solutions 1. (30 points) The EViews workfile diningout.wf1 reports on the income and dining out expenditures of 100 households: INCOME annual
Session 178 TS, Stats for Health Actuaries. Moderator: Ian G. Duncan, FSA, FCA, FCIA, FIA, MAAA. Presenter: Joan C. Barrett, FSA, MAAA
 Session 178 TS, Stats for Health Actuaries Moderator: Ian G. Duncan, FSA, FCA, FCIA, FIA, MAAA Presenter: Joan C. Barrett, FSA, MAAA Session 178 Statistics for Health Actuaries October 14, 2015 Presented
Modeling Volatility of Price of Some Selected Agricultural Products in Ethiopia: ARIMA-GARCH Applications
 Modeling Volatility of Price of Some Selected Agricultural Products in Ethiopia: ARIMA-GARCH Applications Background: Agricultural products market policies in Ethiopia have undergone dramatic changes over
Tests for the Difference Between Two Linear Regression Intercepts
 Chapter 853 Tests for the Difference Between Two Linear Regression Intercepts Introduction Linear regression is a commonly used procedure in statistical analysis. One of the main objectives in linear regression
Empirical Analysis of Stock Return Volatility with Regime Change: The Case of Vietnam Stock Market
 7/8/1 1 Empirical Analysis of Stock Return Volatility with Regime Change: The Case of Vietnam Stock Market Vietnam Development Forum Tokyo Presentation By Vuong Thanh Long Dept. of Economic Development
A Note on the Oil Price Trend and GARCH Shocks
 MPRA Munich Personal RePEc Archive A Note on the Oil Price Trend and GARCH Shocks Li Jing and Henry Thompson 2010 Online at http://mpra.ub.uni-muenchen.de/20654/ MPRA Paper No. 20654, posted 13. February
Computer Lab Session 2 ARIMA, ARCH and GARCH Models
 JBS Advanced Quantitative Research Methods Module MPO-1A Lent 2010 Thilo Klein http://thiloklein.de Contents Computer Lab Session 2 ARIMA, ARCH and GARCH Models Exercise 1. Estimation of a quarterly ARMA
Market Integration, Price Discovery, and Volatility in Agricultural Commodity Futures P.Ramasundaram* and Sendhil R**
 Market Integration, Price Discovery, and Volatility in Agricultural Commodity Futures P.Ramasundaram* and Sendhil R** *National Coordinator (M&E), National Agricultural Innovation Project (NAIP), Krishi
A Note on the Oil Price Trend and GARCH Shocks
 A Note on the Oil Price Trend and GARCH Shocks Jing Li* and Henry Thompson** This paper investigates the trend in the monthly real price of oil between 1990 and 2008 with a generalized autoregressive conditional
Lampiran 1. Data Penelitian
 LAMPIRAN Lampiran 1. Data Penelitian Tahun Impor PDB KURS DEVISA 1985 5.199,00 2.118.215,40 1.125,00 5.811,00 1986 5.825,00 2.242.661,60 1.641,00 5.841,00 1987 7.209,00 2.353.133,40 1.650,00 5.103,00 1988
Example 1 of econometric analysis: the Market Model
 Example 1 of econometric analysis: the Market Model IGIDR, Bombay 14 November, 2008 The Market Model Investors want an equation predicting the return from investing in alternative securities. Return is
Time Invariant and Time Varying Inefficiency: Airlines Panel Data
 Time Invariant and Time Varying Inefficiency: Airlines Panel Data These data are from the pre-deregulation days of the U.S. domestic airline industry. The data are an extension of Caves, Christensen, and
Volume 29, Issue 2. Measuring the external risk in the United Kingdom. Estela Sáenz University of Zaragoza
 Volume 9, Issue Measuring the external risk in the United Kingdom Estela Sáenz University of Zaragoza María Dolores Gadea University of Zaragoza Marcela Sabaté University of Zaragoza Abstract This paper
INTERNATIONAL JOURNAL OF ADVANCED RESEARCH IN ENGINEERING AND TECHNOLOGY (IJARET)
") INTERNATIONAL JOURNAL OF ADVANCED RESEARCH IN ENGINEERING AND TECHNOLOGY (IJARET) ISSN 0976-6480 (Print) ISSN 0976-6499 (Online) Volume 5, Issue 3, March (204), pp. 73-82 IAEME: www.iaeme.com/ijaret.asp
INTERNATIONAL JOURNAL OF ADVANCED RESEARCH IN ENGINEERING AND TECHNOLOGY (IJARET) ISSN 0976-6480 (Print) ISSN 0976-6499 (Online) Volume 5, Issue 3, March (204), pp. 73-82 IAEME: www.iaeme.com/ijaret.asp
Conditional Heteroscedasticity
 1 Conditional Heteroscedasticity May 30, 2010 Junhui Qian 1 Introduction ARMA(p,q) models dictate that the conditional mean of a time series depends on past observations of the time series and the past
VOLATILITY. Time Varying Volatility
 VOLATILITY Time Varying Volatility CONDITIONAL VOLATILITY IS THE STANDARD DEVIATION OF the unpredictable part of the series. We define the conditional variance as: 2 2 2 t E yt E yt Ft Ft E t Ft surprise
THE INFORMATION CONTENT OF IMPLIED VOLATILITY IN AGRICULTURAL COMMODITY MARKETS. Pierre Giot 1
 THE INFORMATION CONTENT OF IMPLIED VOLATILITY IN AGRICULTURAL COMMODITY MARKETS Pierre Giot 1 May 2002 Abstract In this paper we compare the incremental information content of lagged implied volatility
Business Statistics 41000: Probability 3
 Business Statistics 41000: Probability 3 Drew D. Creal University of Chicago, Booth School of Business February 7 and 8, 2014 1 Class information Drew D. Creal Email: dcreal@chicagobooth.edu Office: 404
LAMPIRAN PERHITUNGAN EVIEWS
 LAMPIRAN PERHITUNGAN EVIEWS DESCRIPTIVE PK PDRB TP TKM Mean 12.22450 10.16048 14.02443 12.63677 Median 12.41945 10.09179 14.22736 12.61400 Maximum 13.53955 12.73508 15.62581 13.16721 Minimum 10.34509 8.579417
Software Tutorial ormal Statistics
 Software Tutorial ormal Statistics The example session with the teaching software, PG2000, which is described below is intended as an example run to familiarise the user with the package. This documented
Steven Trypsteen. School of Economics and Centre for Finance, Credit and. Macroeconomics, University of Nottingham. May 15, 2014.
 Cross-Country Interactions, the Great Moderation and the Role of Volatility in Economic Activity Steven Trypsteen School of Economics and Centre for Finance, Credit and Macroeconomics, University of Nottingham
Invalid t-statistics
 A Demonstration of Time Varying Volatility & Invalid t-statistics Patrick M. Herb * this version: August 27, 2015 Abstract This paper demonstrates that using ordinary least squares (OLS) to estimate a
Case Study: Predicting U.S. Saving Behavior after the 2008 Financial Crisis (proposed solution)
") 2 Case Study: Predicting U.S. Saving Behavior after the 2008 Financial Crisis (proposed solution) 1. Data on U.S. consumption, income, and saving for 1947:1 2014:3 can be found in MF_Data.wk1, pagefile
2 Case Study: Predicting U.S. Saving Behavior after the 2008 Financial Crisis (proposed solution) 1. Data on U.S. consumption, income, and saving for 1947:1 2014:3 can be found in MF_Data.wk1, pagefile
Forecasting Canadian Equity Volatility: the information content of the MVX Index
 Forecasting Canadian Equity Volatility: the information content of the MVX Index by Hendrik Heng Bachelor of Science (Computer Science), University of New South Wales, 2005 Mingying Li Bachelor of Economics,
ECON Introductory Econometrics. Lecture 1: Introduction and Review of Statistics
 ECON4150 - Introductory Econometrics Lecture 1: Introduction and Review of Statistics Monique de Haan (moniqued@econ.uio.no) Stock and Watson Chapter 1-2 Lecture outline 2 What is econometrics? Course
REGIONAL WORKSHOP ON TRAFFIC FORECASTING AND ECONOMIC PLANNING
 International Civil Aviation Organization 27/8/10 WORKING PAPER REGIONAL WORKSHOP ON TRAFFIC FORECASTING AND ECONOMIC PLANNING Cairo 2 to 4 November 2010 Agenda Item 3 a): Forecasting Methodology (Presented
Market Risk Management for Financial Institutions Based on GARCH Family Models
 Washington University in St. Louis Washington University Open Scholarship Arts & Sciences Electronic Theses and Dissertations Arts & Sciences Spring 5-2017 Market Risk Management for Financial Institutions
An Empirical Research on Chinese Stock Market Volatility Based. on Garch
 Volume 04 - Issue 07 July 2018 PP. 15-23 An Empirical Research on Chinese Stock Market Volatility Based on Garch Ya Qian Zhu 1, Wen huili* 1 (Department of Mathematics and Finance, Hunan University of
Trading Financial Market s Fractal behaviour
 Trading Financial Market s Fractal behaviour by Solon Saoulis CEO DelfiX ltd. (delfix.co.uk) Introduction In 1975, the noted mathematician Benoit Mandelbrot coined the term fractal (fragment) to define
Tests for Intraclass Correlation
 Chapter 810 Tests for Intraclass Correlation Introduction The intraclass correlation coefficient is often used as an index of reliability in a measurement study. In these studies, there are K observations
Trends in currency s return
 IOP Conference Series: Materials Science and Engineering PAPER OPEN ACCESS Trends in currency s return To cite this article: A Tan et al 2018 IOP Conf. Ser.: Mater. Sci. Eng. 332 012001 View the article
Estimating the Current Value of Time-Varying Beta
 Estimating the Current Value of Time-Varying Beta Joseph Cheng Ithaca College Elia Kacapyr Ithaca College This paper proposes a special type of discounted least squares technique and applies it to the