Risk Management. Risk: the quantifiable likelihood of loss or less-than-expected returns.
|
|
|
- Duane Sullivan
- 6 years ago
- Views:
Transcription
1 ARCH/GARCH Models 1
2 Risk Management Risk: the quantifiable likelihood of loss or less-than-expected returns. In recent decades the field of financial risk management has undergone explosive development. Risk management has been described as one of the most important innovations of the 20th century. But risk management is not something new. 2

3 Risk Management José (Joseph) De La Vega was a Jewish merchant and poet residing in 17 th century Amsterdam. There was a discussion between a lawyer, a trader and a philosopher in his book Confusion of Confusions. Their discussion contains what we now recognize as European options and a description of their use for risk management. 3
4 Risk Management There are three major risk types: market risk: the risk of a change in the value of a financial position due to changes in the value of the underlying assets. credit risk: the risk of not receiving promised repayments on outstanding investments. operational risk: the risk of losses resulting from inadequate or failed internal processes, people and systems, or from external events. 4

5 Risk Management VaR (Value at Risk), introduced by JPMorgan in the 1980s, is probably the most widely used risk measure in financial institutions. 5

6 Risk Management Given some confidence level. The VaR of our portfolio at the confidence level α is given by the smallest value such that the probability that the loss exceeds is no larger than. 6

7 The steps to calculate VaR s market position t Volatility measure days to be forecasted VAR Level of confidence Report of potential 7
8 The success of VaR Is a result of the method used to estimate the risk The certainty of the report depends upon the type of model used to compute the volatility on which these forecast is based 8

9 Volatility 9
10 Volatility 10

11 11
12 Modeling Volatility with ARCH & GARCH In 1982, Robert Engle developed the autoregressive conditional heteroskedasticity (ARCH) models to model the time-varying volatility often observed in economical time series data. For this contribution, he won the 2003 Nobel Prize in Economics (*Clive Granger shared the prize for cointegration ARCH models assume the variance of the current error term or innovation to be a function of the actual sizes of the previous time periods' error terms: often the variance is related to the squares of the previous innovations. In 1986, his doctoral student Tim Bollerslev developed the generalized ARCH models abbreviated as GARCH. 12
13 Volatility of Merval Index modelling whith Garch (1,1) /01/ /10/ /22/ /28/ /10/ /18/ /30/ /05/ /13/ /26/ /04/ /11/ /23/ /08/ /21/ /01/ /12/ /25/ /02/ /21/ /06/ /13/2000


14 Time series 14
15 Time series-arch (*Note, Zt can be other white noise, no need to be Gaussian) Let be N(0,1). The process is an ARCH(q) process if it is stationary and if it satisfies, for all and some strictly positive-valued process, the equations Where and,. Note: is usually the error term in a time series regression model! 15
16 Time series-arch ARCH(q) has some useful properties. For simplicity, we will show them in ARCH(1). Without loss of generality, let a ARCH(1) process be represented by Conditional Mean Unconditional Mean So have mean zero 16
17 Time series-arch 17
18 Time series-arch have unconditional variance given by Proof 1 (use the law of total variance): Because it is stationary,. So. 18
19 Time series-arch Proof 2: Lemma: Law of Iterated Expectations Let and be two sets of random variables such that. Let be a scalar random variable. Then Since, as, 19
20 Time series-arch fatter tails The unconditional distribution of X t is leptokurtic, it is easy to show. Proof: So. Also, 20
21 Time series-arch The unconditional distribution of is leptokurtic, The curvature is high in the middle of the distribution and tails are fatter than those of a normal distribution, which is frequently observed in financial markets. 21
22 Time series-arch For ARCH(1), we can rewrite it as where. is finite, then it is an AR(1) process for Another perspective: The above is simply the optimal forecast of if it follows an AR(1) process 22
23 Time series-ewma Before introducing GARCH, we discuss the EWMA (exponentially weighted moving average) model where is a constant between 0 and 1. The EWMA approach has the attractive feature that relatively little data need to be stored. 23
24 Time series-ewma We substitute for,and then keep doing it for steps For large, the term is sufficiently small to be ignored, so it decreases exponentially. 24
25 Time series-ewma The EWMA approach is designed to track changes in the volatility. The value of governs how responsive the estimate of the daily volatility is to the most recent daily percentage change. For example, the RiskMetrics database, which was invented and then published by JPMorgan in 1994, uses the EWMA model with for updating daily volatility estimates. 25
26 Time series-garch The GARCH processes are generalized ARCH processes in the sense that the squared volatility is allowed to depend on previous squared volatilities, as well as previous squared values of the process. 26
27 Time series-garch (*Note, Zt can be other white noise, no need to be Gaussian) Let be N(0,1). The process is a GARCH(p, q) process if it is stationary and if it satisfies, for all and some strictly positive-valued process, the equations Where and,,. Note: is usually the error term in a time series regression model! 27
28 Time series-garch GARCH models also have some important properties. Like ARCH, we show them in GARCH(1,1). The GARCH(1, 1) process is a covariance-stationary white noise process if and only if 1. The variance of the covariance-stationary process is given by 0 1. In GARCH(1,1), the distribution of but can be normal. is also mostly leptokurtic
29 Time series-garch We can rewrite the GARCH(1,1) as where 1 is finite, then it is an ARMA(1,1) process for X t2. 29
30 Time series-garch The equation for GARCH(1,1) can be rewritten as where 1. 1 The EWMA model is a special case of GARCH(1,1) where 1 30
31 Time series-garch The GARCH (1,1) model recognizes that over time the variance tends to get pulled back to a long-run average level of. Assume we have known, if, then this expectation is negative 2 E[s t+1 - V I t ] = E[g V L +a 1 X t 2 + bv - V I t ] < E[g V +a 1 X t 2 + bv - V I t ] = E[-a 1 V +a 1 X t 2 I t ] = -a 1 V +a 1 V = 0 31
32 Time series-garch If, then this expectation is positive 2 E[s t+1 - V I t ] = E[g V L +a 1 X t 2 + bv - V I t ] > E[g V +a 1 X t 2 + bv - V I t ] = E[-a 1 V +a 1 X 2 t I t ] = -a 1 V +a 1 V = 0 This is called mean reversion. 32
33 Time series-(arma-garch) In the real world, the return processes maybe stationary, so we combine the ARMA model and the GARCH model, where we use ARMA to fit the mean and GARCH to fit the variance. For example, ARMA(1,1)-GARCH(1,1) X t = m + fx t-1 + e t +qe t-1 e t = s t Z t s t 2 = a 0 + a 1 e t bs t-1 33
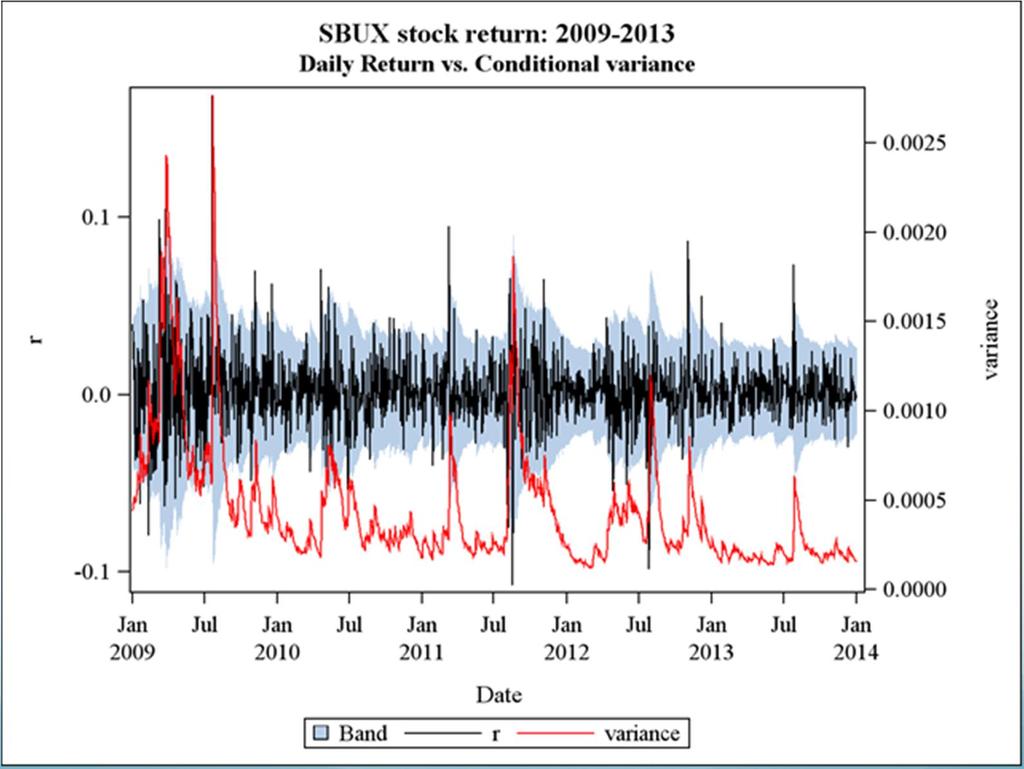
34 Time Series in R Data from Starbucks Corporation (SBUX) 34
35 Program Preparation Packages: >require(quantmod): specify, build, trade and analyze quantitative financial trading strategies >require(forecast): methods and tools for displaying and analyzing univariate time series forecasts >require(urca): unit root and cointegration tests encountered in applied econometric analysis are implemented >require(tseries): package for time series analysis and computational finance >require(fgarch): environment for teaching Financial Engineering and Computational Finance 35

36 Introduction >getsymbols('sbux') >chartseries(sbux,subset='2009::2013') 36
)) >plot(r, main='time plot of the daily logged return")
37 Method of Modeling >ret=na.omit(diff(log(sbux$sbux.close))) >plot(r, main='time plot of the daily logged return of SBUX') 37
38 KPSS test KPSS tests are used for testing a null hypothesis that an observable time series is stationary around a deterministic trend. The series is expressed as the sum of deterministic trend, random walk, and stationary error, and the test is the Lagrange multiplier test of the hypothesis that the random walk has zero variance. KPSS tests are intended to complement unit root tests 38
39 KPSS test where : contains deterministic components : stationary time series : pure random walk with innovation variance 39
40 Trend Check KPSS test: null hypothesis: s 2 = 0 >summary(ur.kpss(r,type='mu',lags='short')) Return is a stationary around a constant, has no linear trend 40
41 ADF test ADF test is a test for a unit root in a time series sample. ADF test: null hypothesis: has unit root It is an augmented version of the Dickey-Fuller test for a larger and more complicated set of time series models. ADF used in the test, is a negative number. The more negative it is, the stronger the rejection of the hypothesis that there is a unit root at some level of confidence. 41
42 Trend Check ADF Test: null hypothesis: X t has AR unit root (nonstationary) >summary(ur.df(r,type='trend',lags=20,selectlags='bic')) Return is a stationary time series with a drift 42
43 Check Seasonality >par(mfrow=c(3,1)) >acf(r) >pacf(r) >spec.pgram(r) 43
44 Random Component Demean data >r1=r-mean(r) >acf(r1); pacf(r1); 44
45 Random Component >fit=arima(r,order=c(1,0,0)) >tsdiag(fit) AR(1) 45
46 Random Component First difference > diffr=na.omit(diff(r)) > plot(diffr); acf(diffr); pacf(diffr); 46
47 Random Component >fit1=arima(r,order=c(0,1,1)); tsdiag(fit1); 47
48 Random Component >fit2=arima(r,order=c(1,1,1)); tsdiag(fit2); ARIMA(1,1,1) 48
49 Model Selection where is the number of parameters, is likelihood Final model: 49
50 Shapiro-Wilk normality test The Shapiro- Wilk test, proposed in 1965, calculates a W statistic that tests whether a random sample comes from a normal distribution. Small values of W are evidence of departure from normality and percentage points for the W statistic, obtained via Monte Carlo simulations. 50
51 Residual Test >res=residuals(fit) >shapiro.test(res) not normally distributed 51
52 Residual Test >par(mfrow=c(2,1)) >hist(res); lines(density(res)) >qqnorm(res); qqline(res) 52
53 ARMA+GARCH ARMA(1,0)+GARCH(1,1) >summary(garchfit(~arma(1,0)+garch(1,1),r,trace=f)) ARIMA(1,1,1)+GARCH(1,1) >summary(garchfit(~arma(1,1)+garch(1,1),data=diffr,trace=f)) 53
54 Model Comparison x t = x t-1 +s t e t s 2 = x 2 t t s 2 t-1 54
55 Forecasting 55
56 Time Series in SAS Data from Starbucks Corporation (SBUX) 56
57 SAS Procedures for Time Series PROC ARIMA This procedure do model identification, parameter estimation and forecasting for model ARIMA(p,d,q) where is ground mean of and is the usually intercept (drift). does NOT do ARCH/GARCH 57
58 SAS Procedures for Time Series PROC AUTOREG This procedure estimate and forecast the linear regression model for time series data with an autocorrelated error or a heterosedastic error Linear regression mode Autocorrelated error Heterosedastic error Independent assumption invalid Homosedasity assumption invalid Autocorrelated error Heterosedastic error 58


59 Import Data DATA st.return; INFILE "\SBUXreturn.txt" firstobs=2; INPUT Date YYMMDD10. r; FORMAT Date Date9.; RUN; st.return SBUXreturn.txt 59

60 PROC SGPLOT DATA=st.return; SERIES X=Date Y=r; RUN; 60
61 Testing for Autocorrelation The following statements perform the Durbin-Watson test for autocorrelation in the returns for orders 1 through 3. The DWPROB option prints the marginal significance levels (pvalues) for the Durbin-Watson statistics. PROC AUTOREG DATA=st.return; TITLE2 "AUTOREG AR Test"; MODEL r = / METHOD=ML DW=3 DWPROB; RUN; 61
62 Durbin-Watson test If is the residual associated with the observation at time, then the test statistic is where is the number of observations. Since where is the sample autocorrelation of the residuals. 62
63 Durbin-Watson test Since Positive serial correlation Negative serial correlation To test for positive autocorrelation at significance α : If If,, the error terms are positively autocorrelated,, there is no statistical evidence To test for negative autocorrelation at significance α : If If,, the error terms are negatively autocorrelated,, there is no statistical evidence (, and, are lower and upper critical values) 63
64 Testing for Autocorrelation Durbin-Watson Statistics Order DW Pr < DW Pr > DW Note: Pr<DW is the p-value for testing positive autocorrelation, and Pr>DW is the p-value for testing negative autocorrelation. Autocorrelation correction is needed. Generalized Durbin-Watson tests should not be used to decide on the autoregressive order. 64
65 Stepwise Autoregression Once you determine that autocorrelation correction is needed, you must select the order of the autoregressive error model to use. One way to select the order of the autoregressive error model is Stepwise Autoregression. The following statements show the stepwise feature, using an initial order of 5: PROC AUTOREG DATA=st.return; TITLE2 "AUTOREG (fit P) for log returns"; MODEL r = / METHOD=ML NLAG=5 BACKSTEP; RUN; 65
66 Stepwise Autoregression Estimates of Autocorrelations Lag Covariance Correlation ******************** * E * * E Backward Elimination of Autoregressive Terms Lag Estimate t Value Pr > t Estimates of Autoregressive Parameters Standard Lag Coefficient Error t Value
67 Testing for Heteroscedasticity One of the key assumptions of the ordinary regression model is that the errors have the same variance throughout the sample. This is also called the homoscedasticity model. If the error variance is not constant, the data are said to be Heteroscedastic The following statements use the ARCHTEST= option to test for heteroscedasticity PROC AUTOREG DATA=st.return; TITLE2 "AUTOREG arch Test"; MODEL r = / METHOD=ML ARCHTEST; RUN; 67
68 Testing for Heteroscedasticity Portmanteau Q Test For nonlinear time series models, the portmanteau test statistic based on squared residuals is used to test for independence of the series where 68
69 Testing for Heteroscedasticity Lagrange Multiplier Test for ARCH Disturbances Engle (1982) proposed a Lagrange multiplier test for ARCH disturbances. Engle s Lagrange multiplier test for the qth order ARCH process is written where The presample values have been set to 0 69
70 Testing for Heteroscedasticity Tests for ARCH Disturbances Based on OLS Residuals Order Q Pr > Q LM Pr > LM < < < < < < < < < < < < < <.0001 The p-values for the test statistics strongly indicate heteroscedasticity 70
71 Fitting AR(p)-GARCH(P,Q) The following statements fit an AR(1)-GARCH model for the return r. The GARCH=(P=1,Q=1) option specifies the GARCH conditional variance model. The NLAG=1 option specifies the AR(1) error process. PROC AUTOREG DATA=st.return; TITLE2 "AR=1 GARCH(1,1)"; MODEL r = / METHOD=ML NLAG=1 GARCH=(p=1,q=1); OUTPUT OUT=st.rout HT=variance P=yhat LCL=low95 UCL=high95; RUN; 71
72 Fitting AR(1)-GARCH(1,1) Parameter Estimates Variable DF Estimate Standard Error t Value Approx Pr > t Intercept AR ARCH E E <.0001 ARCH <.0001 GARCH <
73 Fitting GARCH(1,1) Parameter Estimates Variable DF Estimate Standard Error t Value Approx Pr > t Intercept ARCH E E <.0001 ARCH <.0001 GARCH <
74 Model Comparison AR(1)-GARCH(1,1) GARCH(1,1) GARCH Estimates SSE Observations MSE Uncond Var Log Total R Likelihood 4 Square SBC - AIC MAE AICC MAPE HQC Normality Test Pr > ChiSq <.0001 GARCH Estimates SSE Observations MSE Uncond Var Log Likelihood Total R- 6 Square. SBC AIC MAE AICC MAPE HQC Normality Test Pr > ChiSq <
75 Prediction 75
")
76 VaR (Value at Risk) 76
77 Summary Models for conditional variance (risk) ARCH EWMA GARCH Numerical experiment ARIMA+GARCH in R AR+GARCH in SAS VaR in SAS 77

78 This presentation was revised from my students presentation. 78
Financial Time Series Analysis (FTSA)
") Financial Time Series Analysis (FTSA) Lecture 6: Conditional Heteroscedastic Models Few models are capable of generating the type of ARCH one sees in the data.... Most of these studies are best summarized
Financial Time Series Analysis (FTSA) Lecture 6: Conditional Heteroscedastic Models Few models are capable of generating the type of ARCH one sees in the data.... Most of these studies are best summarized
ARIMA ANALYSIS WITH INTERVENTIONS / OUTLIERS
 TASK Run intervention analysis on the price of stock M: model a function of the price as ARIMA with outliers and interventions. SOLUTION The document below is an abridged version of the solution provided
Chapter 4 Level of Volatility in the Indian Stock Market
 Chapter 4 Level of Volatility in the Indian Stock Market Measurement of volatility is an important issue in financial econometrics. The main reason for the prominent role that volatility plays in financial
Conditional Heteroscedasticity
 1 Conditional Heteroscedasticity May 30, 2010 Junhui Qian 1 Introduction ARMA(p,q) models dictate that the conditional mean of a time series depends on past observations of the time series and the past
Financial Econometrics Notes. Kevin Sheppard University of Oxford
 Financial Econometrics Notes Kevin Sheppard University of Oxford Monday 15 th January, 2018 2 This version: 22:52, Monday 15 th January, 2018 2018 Kevin Sheppard ii Contents 1 Probability, Random Variables
Financial Econometrics
 Financial Econometrics Volatility Gerald P. Dwyer Trinity College, Dublin January 2013 GPD (TCD) Volatility 01/13 1 / 37 Squared log returns for CRSP daily GPD (TCD) Volatility 01/13 2 / 37 Absolute value
Amath 546/Econ 589 Univariate GARCH Models
 Amath 546/Econ 589 Univariate GARCH Models Eric Zivot April 24, 2013 Lecture Outline Conditional vs. Unconditional Risk Measures Empirical regularities of asset returns Engle s ARCH model Testing for ARCH
University of New South Wales Semester 1, Economics 4201 and Homework #2 Due on Tuesday 3/29 (20% penalty per day late)
") University of New South Wales Semester 1, 2011 School of Economics James Morley 1. Autoregressive Processes (15 points) Economics 4201 and 6203 Homework #2 Due on Tuesday 3/29 (20 penalty per day late)
University of New South Wales Semester 1, 2011 School of Economics James Morley 1. Autoregressive Processes (15 points) Economics 4201 and 6203 Homework #2 Due on Tuesday 3/29 (20 penalty per day late)
ECG 752: Econometrics II Spring Assessed Computer Assignment 3: Answer Key
 ECG 752: Econometrics II Spring 2005 Assessed Computer Assignment 3: Answer Key Question 1 The time series plots of x(d), x(bw) and x(m) are presented below. 1 A common characteristic of all series is
Modeling Volatility of Price of Some Selected Agricultural Products in Ethiopia: ARIMA-GARCH Applications
 Modeling Volatility of Price of Some Selected Agricultural Products in Ethiopia: ARIMA-GARCH Applications Background: Agricultural products market policies in Ethiopia have undergone dramatic changes over
The University of Chicago, Booth School of Business Business 41202, Spring Quarter 2009, Mr. Ruey S. Tsay. Solutions to Final Exam
 The University of Chicago, Booth School of Business Business 41202, Spring Quarter 2009, Mr. Ruey S. Tsay Solutions to Final Exam Problem A: (42 pts) Answer briefly the following questions. 1. Questions
Economics 413: Economic Forecast and Analysis Department of Economics, Finance and Legal Studies University of Alabama
 Problem Set #1 (Linear Regression) 1. The file entitled MONEYDEM.XLS contains quarterly values of seasonally adjusted U.S.3-month ( 3 ) and 1-year ( 1 ) treasury bill rates. Each series is measured over
Financial Time Series Analysis: Part II
 Department of Mathematics and Statistics, University of Vaasa, Finland Spring 2017 1 Volatility Models Background ARCH-models Properties of ARCH-processes Estimation of ARCH models Generalized ARCH models
Homework Assignments for BusAdm 713: Business Forecasting Methods. Assignment 1: Introduction to forecasting, Review of regression
 Homework Assignments for BusAdm 713: Business Forecasting Methods Note: Problem points are in parentheses. Assignment 1: Introduction to forecasting, Review of regression 1. (3) Complete the exercises
ARCH and GARCH models
 ARCH and GARCH models Fulvio Corsi SNS Pisa 5 Dic 2011 Fulvio Corsi ARCH and () GARCH models SNS Pisa 5 Dic 2011 1 / 21 Asset prices S&P 500 index from 1982 to 2009 1600 1400 1200 1000 800 600 400 200
Chapter 5 Univariate time-series analysis. () Chapter 5 Univariate time-series analysis 1 / 29
 Chapter 5 Univariate time-series analysis 1 / 29") Chapter 5 Univariate time-series analysis () Chapter 5 Univariate time-series analysis 1 / 29 Time-Series Time-series is a sequence fx 1, x 2,..., x T g or fx t g, t = 1,..., T, where t is an index denoting
Chapter 5 Univariate time-series analysis () Chapter 5 Univariate time-series analysis 1 / 29 Time-Series Time-series is a sequence fx 1, x 2,..., x T g or fx t g, t = 1,..., T, where t is an index denoting
Oil Price Effects on Exchange Rate and Price Level: The Case of South Korea
 Oil Price Effects on Exchange Rate and Price Level: The Case of South Korea Mirzosaid SULTONOV 東北公益文科大学総合研究論集第 34 号抜刷 2018 年 7 月 30 日発行 研究論文 Oil Price Effects on Exchange Rate and Price Level: The Case
Determinants of Stock Prices in Ghana
 Current Research Journal of Economic Theory 5(4): 66-7, 213 ISSN: 242-4841, e-issn: 242-485X Maxwell Scientific Organization, 213 Submitted: November 8, 212 Accepted: December 21, 212 Published: December
Properties of financail time series GARCH(p,q) models Risk premium and ARCH-M models Leverage effects and asymmetric GARCH models.
 models Risk premium and ARCH-M models Leverage effects and asymmetric GARCH models.") 5 III Properties of financail time series GARCH(p,q) models Risk premium and ARCH-M models Leverage effects and asymmetric GARCH models 1 ARCH: Autoregressive Conditional Heteroscedasticity Conditional
5 III Properties of financail time series GARCH(p,q) models Risk premium and ARCH-M models Leverage effects and asymmetric GARCH models 1 ARCH: Autoregressive Conditional Heteroscedasticity Conditional
Donald Trump's Random Walk Up Wall Street
 Donald Trump's Random Walk Up Wall Street Research Question: Did upward stock market trend since beginning of Obama era in January 2009 increase after Donald Trump was elected President? Data: Daily data
Research Article The Volatility of the Index of Shanghai Stock Market Research Based on ARCH and Its Extended Forms
 Discrete Dynamics in Nature and Society Volume 2009, Article ID 743685, 9 pages doi:10.1155/2009/743685 Research Article The Volatility of the Index of Shanghai Stock Market Research Based on ARCH and
Amath 546/Econ 589 Univariate GARCH Models: Advanced Topics
 Amath 546/Econ 589 Univariate GARCH Models: Advanced Topics Eric Zivot April 29, 2013 Lecture Outline The Leverage Effect Asymmetric GARCH Models Forecasts from Asymmetric GARCH Models GARCH Models with
Brief Sketch of Solutions: Tutorial 2. 2) graphs. 3) unit root tests
 graphs. 3) unit root tests") Brief Sketch of Solutions: Tutorial 2 2) graphs LJAPAN DJAPAN 5.2.12 5.0.08 4.8.04 4.6.00 4.4 -.04 4.2 -.08 4.0 01 02 03 04 05 06 07 08 09 -.12 01 02 03 04 05 06 07 08 09 LUSA DUSA 7.4.12 7.3 7.2.08 7.1.04
Brief Sketch of Solutions: Tutorial 2 2) graphs LJAPAN DJAPAN 5.2.12 5.0.08 4.8.04 4.6.00 4.4 -.04 4.2 -.08 4.0 01 02 03 04 05 06 07 08 09 -.12 01 02 03 04 05 06 07 08 09 LUSA DUSA 7.4.12 7.3 7.2.08 7.1.04
LAMPIRAN. Null Hypothesis: LO has a unit root Exogenous: Constant Lag Length: 1 (Automatic based on SIC, MAXLAG=13)
") 74 LAMPIRAN Lampiran 1 Analisis ARIMA 1.1. Uji Stasioneritas Variabel 1. Data Harga Minyak Riil Level Null Hypothesis: LO has a unit root Lag Length: 1 (Automatic based on SIC, MAXLAG=13) Augmented Dickey-Fuller
74 LAMPIRAN Lampiran 1 Analisis ARIMA 1.1. Uji Stasioneritas Variabel 1. Data Harga Minyak Riil Level Null Hypothesis: LO has a unit root Lag Length: 1 (Automatic based on SIC, MAXLAG=13) Augmented Dickey-Fuller
DATABASE AND RESEARCH METHODOLOGY
 CHAPTER III DATABASE AND RESEARCH METHODOLOGY The nature of the present study Direct Tax Reforms in India: A Comparative Study of Pre and Post-liberalization periods is such that it requires secondary
Market Integration, Price Discovery, and Volatility in Agricultural Commodity Futures P.Ramasundaram* and Sendhil R**
 Market Integration, Price Discovery, and Volatility in Agricultural Commodity Futures P.Ramasundaram* and Sendhil R** *National Coordinator (M&E), National Agricultural Innovation Project (NAIP), Krishi
ARCH modeling of the returns of first bank of Nigeria
 AMERICAN JOURNAL OF SCIENTIFIC AND INDUSTRIAL RESEARCH 015,Science Huβ, http://www.scihub.org/ajsir ISSN: 153-649X, doi:10.551/ajsir.015.6.6.131.140 ARCH modeling of the returns of first bank of Nigeria
COINTEGRATION AND MARKET EFFICIENCY: AN APPLICATION TO THE CANADIAN TREASURY BILL MARKET. Soo-Bin Park* Carleton University, Ottawa, Canada K1S 5B6
 1 COINTEGRATION AND MARKET EFFICIENCY: AN APPLICATION TO THE CANADIAN TREASURY BILL MARKET Soo-Bin Park* Carleton University, Ottawa, Canada K1S 5B6 Abstract: In this study we examine if the spot and forward
Lloyds TSB. Derek Hull, John Adam & Alastair Jones
 Forecasting Bad Debt by ARIMA Models with Multiple Transfer Functions using a Selection Process for many Candidate Variables Lloyds TSB Derek Hull, John Adam & Alastair Jones INTRODUCTION: No statistical
Indian Institute of Management Calcutta. Working Paper Series. WPS No. 797 March Implied Volatility and Predictability of GARCH Models
 Indian Institute of Management Calcutta Working Paper Series WPS No. 797 March 2017 Implied Volatility and Predictability of GARCH Models Vivek Rajvanshi Assistant Professor, Indian Institute of Management
Forecasting the Philippine Stock Exchange Index using Time Series Analysis Box-Jenkins
 EUROPEAN ACADEMIC RESEARCH Vol. III, Issue 3/ June 2015 ISSN 2286-4822 www.euacademic.org Impact Factor: 3.4546 (UIF) DRJI Value: 5.9 (B+) Forecasting the Philippine Stock Exchange Index using Time HERO
Forecasting Stock Index Futures Price Volatility: Linear vs. Nonlinear Models
 The Financial Review 37 (2002) 93--104 Forecasting Stock Index Futures Price Volatility: Linear vs. Nonlinear Models Mohammad Najand Old Dominion University Abstract The study examines the relative ability
Forecasting Financial Markets. Time Series Analysis
 Forecasting Financial Markets Time Series Analysis Copyright 1999-2011 Investment Analytics Copyright 1999-2011 Investment Analytics Forecasting Financial Markets Time Series Analysis Slide: 1 Overview
Modeling Exchange Rate Volatility using APARCH Models
 96 TUTA/IOE/PCU Journal of the Institute of Engineering, 2018, 14(1): 96-106 TUTA/IOE/PCU Printed in Nepal Carolyn Ogutu 1, Betuel Canhanga 2, Pitos Biganda 3 1 School of Mathematics, University of Nairobi,
Booth School of Business, University of Chicago Business 41202, Spring Quarter 2016, Mr. Ruey S. Tsay. Solutions to Midterm
 Booth School of Business, University of Chicago Business 41202, Spring Quarter 2016, Mr. Ruey S. Tsay Solutions to Midterm Problem A: (30 pts) Answer briefly the following questions. Each question has
Variance clustering. Two motivations, volatility clustering, and implied volatility
 Variance modelling The simplest assumption for time series is that variance is constant. Unfortunately that assumption is often violated in actual data. In this lecture we look at the implications of time
Booth School of Business, University of Chicago Business 41202, Spring Quarter 2010, Mr. Ruey S. Tsay. Solutions to Midterm
 Booth School of Business, University of Chicago Business 41202, Spring Quarter 2010, Mr. Ruey S. Tsay Solutions to Midterm Problem A: (30 pts) Answer briefly the following questions. Each question has
Lecture 5a: ARCH Models
 Lecture 5a: ARCH Models 1 2 Big Picture 1. We use ARMA model for the conditional mean 2. We use ARCH model for the conditional variance 3. ARMA and ARCH model can be used together to describe both conditional
INFORMATION EFFICIENCY HYPOTHESIS THE FINANCIAL VOLATILITY IN THE CZECH REPUBLIC CASE
 INFORMATION EFFICIENCY HYPOTHESIS THE FINANCIAL VOLATILITY IN THE CZECH REPUBLIC CASE Abstract Petr Makovský If there is any market which is said to be effective, this is the the FOREX market. Here we
Market Risk Management for Financial Institutions Based on GARCH Family Models
 Washington University in St. Louis Washington University Open Scholarship Arts & Sciences Electronic Theses and Dissertations Arts & Sciences Spring 5-2017 Market Risk Management for Financial Institutions
Modeling Philippine Stock Exchange Composite Index Using Time Series Analysis
 Journal of Physics: Conference Series PAPER OPEN ACCESS Modeling Philippine Stock Exchange Composite Index Using Time Series Analysis To cite this article: W S Gayo et al 2015 J. Phys.: Conf. Ser. 622
The University of Chicago, Booth School of Business Business 41202, Spring Quarter 2010, Mr. Ruey S. Tsay Solutions to Final Exam
 The University of Chicago, Booth School of Business Business 410, Spring Quarter 010, Mr. Ruey S. Tsay Solutions to Final Exam Problem A: (4 pts) Answer briefly the following questions. 1. Questions 1
Time series: Variance modelling
 Time series: Variance modelling Bernt Arne Ødegaard 5 October 018 Contents 1 Motivation 1 1.1 Variance clustering.......................... 1 1. Relation to heteroskedasticity.................... 3 1.3
The University of Chicago, Booth School of Business Business 41202, Spring Quarter 2012, Mr. Ruey S. Tsay. Solutions to Final Exam
 The University of Chicago, Booth School of Business Business 41202, Spring Quarter 2012, Mr. Ruey S. Tsay Solutions to Final Exam Problem A: (40 points) Answer briefly the following questions. 1. Consider
Booth School of Business, University of Chicago Business 41202, Spring Quarter 2014, Mr. Ruey S. Tsay. Solutions to Midterm
 Booth School of Business, University of Chicago Business 41202, Spring Quarter 2014, Mr. Ruey S. Tsay Solutions to Midterm Problem A: (30 pts) Answer briefly the following questions. Each question has
IS INFLATION VOLATILITY CORRELATED FOR THE US AND CANADA?
 IS INFLATION VOLATILITY CORRELATED FOR THE US AND CANADA? C. Barry Pfitzner, Department of Economics/Business, Randolph-Macon College, Ashland, VA, bpfitzne@rmc.edu ABSTRACT This paper investigates the
Volatility Analysis of Nepalese Stock Market
 The Journal of Nepalese Business Studies Vol. V No. 1 Dec. 008 Volatility Analysis of Nepalese Stock Market Surya Bahadur G.C. Abstract Modeling and forecasting volatility of capital markets has been important
This homework assignment uses the material on pages ( A moving average ).
.") Module 2: Time series concepts HW Homework assignment: equally weighted moving average This homework assignment uses the material on pages 14-15 ( A moving average ). 2 Let Y t = 1/5 ( t + t-1 + t-2 +
Module 2: Time series concepts HW Homework assignment: equally weighted moving average This homework assignment uses the material on pages 14-15 ( A moving average ). 2 Let Y t = 1/5 ( t + t-1 + t-2 +
Market Risk Analysis Volume II. Practical Financial Econometrics
 Market Risk Analysis Volume II Practical Financial Econometrics Carol Alexander John Wiley & Sons, Ltd List of Figures List of Tables List of Examples Foreword Preface to Volume II xiii xvii xx xxii xxvi
Lecture 5: Univariate Volatility
 Lecture 5: Univariate Volatility Modellig, ARCH and GARCH Prof. Massimo Guidolin 20192 Financial Econometrics Spring 2015 Overview Stepwise Distribution Modeling Approach Three Key Facts to Remember Volatility
CHAPTER III METHODOLOGY
 CHAPTER III METHODOLOGY 3.1 Description In this chapter, the calculation steps, which will be done in the analysis section, will be explained. The theoretical foundations and literature reviews are already
Prerequisites for modeling price and return data series for the Bucharest Stock Exchange
 Theoretical and Applied Economics Volume XX (2013), No. 11(588), pp. 117-126 Prerequisites for modeling price and return data series for the Bucharest Stock Exchange Andrei TINCA The Bucharest University
Computer Lab Session 2 ARIMA, ARCH and GARCH Models
 JBS Advanced Quantitative Research Methods Module MPO-1A Lent 2010 Thilo Klein http://thiloklein.de Contents Computer Lab Session 2 ARIMA, ARCH and GARCH Models Exercise 1. Estimation of a quarterly ARMA
RISK SPILLOVER EFFECTS IN THE CZECH FINANCIAL MARKET
 RISK SPILLOVER EFFECTS IN THE CZECH FINANCIAL MARKET Vít Pošta Abstract The paper focuses on the assessment of the evolution of risk in three segments of the Czech financial market: capital market, money/debt
Introductory Econometrics for Finance
 Introductory Econometrics for Finance SECOND EDITION Chris Brooks The ICMA Centre, University of Reading CAMBRIDGE UNIVERSITY PRESS List of figures List of tables List of boxes List of screenshots Preface
Volume 29, Issue 2. Measuring the external risk in the United Kingdom. Estela Sáenz University of Zaragoza
 Volume 9, Issue Measuring the external risk in the United Kingdom Estela Sáenz University of Zaragoza María Dolores Gadea University of Zaragoza Marcela Sabaté University of Zaragoza Abstract This paper
A Note on the Oil Price Trend and GARCH Shocks
 MPRA Munich Personal RePEc Archive A Note on the Oil Price Trend and GARCH Shocks Li Jing and Henry Thompson 2010 Online at http://mpra.ub.uni-muenchen.de/20654/ MPRA Paper No. 20654, posted 13. February
An Empirical Research on Chinese Stock Market Volatility Based. on Garch
 Volume 04 - Issue 07 July 2018 PP. 15-23 An Empirical Research on Chinese Stock Market Volatility Based on Garch Ya Qian Zhu 1, Wen huili* 1 (Department of Mathematics and Finance, Hunan University of
A Note on the Oil Price Trend and GARCH Shocks
 A Note on the Oil Price Trend and GARCH Shocks Jing Li* and Henry Thompson** This paper investigates the trend in the monthly real price of oil between 1990 and 2008 with a generalized autoregressive conditional
A Study of Stock Return Distributions of Leading Indian Bank s
 Global Journal of Management and Business Studies. ISSN 2248-9878 Volume 3, Number 3 (2013), pp. 271-276 Research India Publications http://www.ripublication.com/gjmbs.htm A Study of Stock Return Distributions
ESTABLISHING WHICH ARCH FAMILY MODEL COULD BEST EXPLAIN VOLATILITY OF SHORT TERM INTEREST RATES IN KENYA.
 ESTABLISHING WHICH ARCH FAMILY MODEL COULD BEST EXPLAIN VOLATILITY OF SHORT TERM INTEREST RATES IN KENYA. Kweyu Suleiman Department of Economics and Banking, Dokuz Eylul University, Turkey ABSTRACT The
Econometric Models for the Analysis of Financial Portfolios
 Econometric Models for the Analysis of Financial Portfolios Professor Gabriela Victoria ANGHELACHE, Ph.D. Academy of Economic Studies Bucharest Professor Constantin ANGHELACHE, Ph.D. Artifex University
List of tables List of boxes List of screenshots Preface to the third edition Acknowledgements
 Table of List of figures List of tables List of boxes List of screenshots Preface to the third edition Acknowledgements page xii xv xvii xix xxi xxv 1 Introduction 1 1.1 What is econometrics? 2 1.2 Is
MODELING EXCHANGE RATE VOLATILITY OF UZBEK SUM BY USING ARCH FAMILY MODELS
 International Journal of Economics, Commerce and Management United Kingdom Vol. VI, Issue 11, November 2018 http://ijecm.co.uk/ ISSN 2348 0386 MODELING EXCHANGE RATE VOLATILITY OF UZBEK SUM BY USING ARCH
Modeling Volatility Clustering of Bank Index: An Empirical Study of BankNifty
 Review of Integrative Business and Economics Research, Vol. 6, no. 1, pp.224-239, January 2017 224 Modeling Volatility Clustering of Bank Index: An Empirical Study of BankNifty Ashok Patil * Kirloskar
12. Conditional heteroscedastic models (ARCH) MA6622, Ernesto Mordecki, CityU, HK, 2006.
 MA6622, Ernesto Mordecki, CityU, HK, 2006.") 12. Conditional heteroscedastic models (ARCH) MA6622, Ernesto Mordecki, CityU, HK, 2006. References for this Lecture: Robert F. Engle. Autoregressive Conditional Heteroscedasticity with Estimates of Variance
12. Conditional heteroscedastic models (ARCH) MA6622, Ernesto Mordecki, CityU, HK, 2006. References for this Lecture: Robert F. Engle. Autoregressive Conditional Heteroscedasticity with Estimates of Variance
STAT758. Final Project. Time series analysis of daily exchange rate between the British Pound and the. US dollar (GBP/USD)
") STAT758 Final Project Time series analysis of daily exchange rate between the British Pound and the US dollar (GBP/USD) Theophilus Djanie and Harry Dick Thompson UNR May 14, 2012 INTRODUCTION Time Series
STAT758 Final Project Time series analysis of daily exchange rate between the British Pound and the US dollar (GBP/USD) Theophilus Djanie and Harry Dick Thompson UNR May 14, 2012 INTRODUCTION Time Series
CAN MONEY SUPPLY PREDICT STOCK PRICES?
 54 JOURNAL FOR ECONOMIC EDUCATORS, 8(2), FALL 2008 CAN MONEY SUPPLY PREDICT STOCK PRICES? Sara Alatiqi and Shokoofeh Fazel 1 ABSTRACT A positive causal relation from money supply to stock prices is frequently
The University of Chicago, Booth School of Business Business 41202, Spring Quarter 2017, Mr. Ruey S. Tsay. Solutions to Final Exam
 The University of Chicago, Booth School of Business Business 41202, Spring Quarter 2017, Mr. Ruey S. Tsay Solutions to Final Exam Problem A: (40 points) Answer briefly the following questions. 1. Describe
VOLATILITY. Time Varying Volatility
 VOLATILITY Time Varying Volatility CONDITIONAL VOLATILITY IS THE STANDARD DEVIATION OF the unpredictable part of the series. We define the conditional variance as: 2 2 2 t E yt E yt Ft Ft E t Ft surprise
A Predictive Model for Monthly Currency in Circulation in Ghana
 A Predictive Model for Monthly Currency in Circulation in Ghana Albert Luguterah 1, Suleman Nasiru 2* and Lea Anzagra 3 1,2,3 Department of s, University for Development Studies, P. O. Box, 24, Navrongo,
Trends in currency s return
 IOP Conference Series: Materials Science and Engineering PAPER OPEN ACCESS Trends in currency s return To cite this article: A Tan et al 2018 IOP Conf. Ser.: Mater. Sci. Eng. 332 012001 View the article
Equity Price Dynamics Before and After the Introduction of the Euro: A Note*
 Equity Price Dynamics Before and After the Introduction of the Euro: A Note* Yin-Wong Cheung University of California, U.S.A. Frank Westermann University of Munich, Germany Daily data from the German and
Econometrics II. Seppo Pynnönen. Spring Department of Mathematics and Statistics, University of Vaasa, Finland
 Department of Mathematics and Statistics, University of Vaasa, Finland Spring 2018 Part IV Financial Time Series As of Feb 5, 2018 1 Financial Time Series Asset Returns Simple returns Log-returns Portfolio
Improving volatility forecasting of GARCH models: applications to daily returns in emerging stock markets
 University of Wollongong Research Online University of Wollongong Thesis Collection University of Wollongong Thesis Collections 2013 Improving volatility forecasting of GARCH models: applications to daily
Graduate School of Business, University of Chicago Business 41202, Spring Quarter 2007, Mr. Ruey S. Tsay. Solutions to Final Exam
 Graduate School of Business, University of Chicago Business 41202, Spring Quarter 2007, Mr. Ruey S. Tsay Solutions to Final Exam Problem A: (30 pts) Answer briefly the following questions. 1. Suppose that
International Journal of Business and Administration Research Review. Vol.3, Issue.22, April-June Page 1
 A STUDY ON ANALYZING VOLATILITY OF GOLD PRICE IN INDIA Mr. Arun Kumar D C* Dr. P.V.Raveendra** *Research scholar,bharathiar University, Coimbatore. **Professor and Head Department of Management Studies,
Volatility in the Indian Financial Market Before, During and After the Global Financial Crisis
 Volatility in the Indian Financial Market Before, During and After the Global Financial Crisis Praveen Kulshreshtha Indian Institute of Technology Kanpur, India Aakriti Mittal Indian Institute of Technology
Demand For Life Insurance Products In The Upper East Region Of Ghana
 Demand For Products In The Upper East Region Of Ghana Abonongo John Department of Mathematics, Kwame Nkrumah University of Science and Technology, Kumasi, Ghana Luguterah Albert Department of Statistics,
The Great Moderation Flattens Fat Tails: Disappearing Leptokurtosis
 The Great Moderation Flattens Fat Tails: Disappearing Leptokurtosis WenShwo Fang Department of Economics Feng Chia University 100 WenHwa Road, Taichung, TAIWAN Stephen M. Miller* College of Business University
ESTIMATING MONEY DEMAND FUNCTION OF BANGLADESH
 BRAC University Journal, vol. VIII, no. 1&2, 2011, pp. 31-36 ESTIMATING MONEY DEMAND FUNCTION OF BANGLADESH Md. Habibul Alam Miah Department of Economics Asian University of Bangladesh, Uttara, Dhaka Email:
Thi-Thanh Phan, Int. Eco. Res, 2016, v7i6, 39 48
 INVESTMENT AND ECONOMIC GROWTH IN CHINA AND THE UNITED STATES: AN APPLICATION OF THE ARDL MODEL Thi-Thanh Phan [1], Ph.D Program in Business College of Business, Chung Yuan Christian University Email:
A SEARCH FOR A STABLE LONG RUN MONEY DEMAND FUNCTION FOR THE US
 A. Journal. Bis. Stus. 5(3):01-12, May 2015 An online Journal of G -Science Implementation & Publication, website: www.gscience.net A SEARCH FOR A STABLE LONG RUN MONEY DEMAND FUNCTION FOR THE US H. HUSAIN
LONG MEMORY IN VOLATILITY
 LONG MEMORY IN VOLATILITY How persistent is volatility? In other words, how quickly do financial markets forget large volatility shocks? Figure 1.1, Shephard (attached) shows that daily squared returns
Booth School of Business, University of Chicago Business 41202, Spring Quarter 2013, Mr. Ruey S. Tsay. Midterm
 Booth School of Business, University of Chicago Business 41202, Spring Quarter 2013, Mr. Ruey S. Tsay Midterm ChicagoBooth Honor Code: I pledge my honor that I have not violated the Honor Code during this
Statistics and Finance
 David Ruppert Statistics and Finance An Introduction Springer Notation... xxi 1 Introduction... 1 1.1 References... 5 2 Probability and Statistical Models... 7 2.1 Introduction... 7 2.2 Axioms of Probability...
MODELING VOLATILITY OF BSE SECTORAL INDICES
 MODELING VOLATILITY OF BSE SECTORAL INDICES DR.S.MOHANDASS *; MRS.P.RENUKADEVI ** * DIRECTOR, DEPARTMENT OF MANAGEMENT SCIENCES, SVS INSTITUTE OF MANAGEMENT SCIENCES, MYLERIPALAYAM POST, ARASAMPALAYAM,COIMBATORE
Inflation and inflation uncertainty in Argentina,
 U.S. Department of the Treasury From the SelectedWorks of John Thornton March, 2008 Inflation and inflation uncertainty in Argentina, 1810 2005 John Thornton Available at: https://works.bepress.com/john_thornton/10/
Forecasting Exchange Rate between Thai Baht and the US Dollar Using Time Series Analysis
 Forecasting Exchange Rate between Thai Baht and the US Dollar Using Time Series Analysis Kunya Bowornchockchai International Science Index, Mathematical and Computational Sciences waset.org/publication/10003789
Web Appendix. Are the effects of monetary policy shocks big or small? Olivier Coibion
 Web Appendix Are the effects of monetary policy shocks big or small? Olivier Coibion Appendix 1: Description of the Model-Averaging Procedure This section describes the model-averaging procedure used in
Analysis of the Relation between Treasury Stock and Common Shares Outstanding
 Analysis of the Relation between Treasury Stock and Common Shares Outstanding Stoyu I. Nancie Fimbel Investment Fellow Associate Professor San José State University Accounting and Finance Department Lucas
Per Capita Housing Starts: Forecasting and the Effects of Interest Rate
 1 David I. Goodman The University of Idaho Economics 351 Professor Ismail H. Genc March 13th, 2003 Per Capita Housing Starts: Forecasting and the Effects of Interest Rate Abstract This study examines the
THE INFLATION - INFLATION UNCERTAINTY NEXUS IN ROMANIA
 THE INFLATION - INFLATION UNCERTAINTY NEXUS IN ROMANIA Daniela ZAPODEANU University of Oradea, Faculty of Economic Science Oradea, Romania Mihail Ioan COCIUBA University of Oradea, Faculty of Economic
Measuring the Price Volatility of Certain Field Crops in South Africa using the ARCH/GARCH Approach
 Measuring the Price Volatility of Certain Field Crops in South Africa using the ARCH/GARCH Approach H Jordaan 1, B Grové, A Jooste 3 & ZG Alemu 4 Abstract The conditional volatility in the daily spot prices
AN EMPIRICAL ANALYSIS OF THE PUBLIC DEBT RELEVANCE TO THE ECONOMIC GROWTH OF THE USA
 AN EMPIRICAL ANALYSIS OF THE PUBLIC DEBT RELEVANCE TO THE ECONOMIC GROWTH OF THE USA Petar Kurečić University North, Koprivnica, Trg Žarka Dolinara 1, Croatia petar.kurecic@unin.hr Marin Milković University
The University of Chicago, Booth School of Business Business 41202, Spring Quarter 2013, Mr. Ruey S. Tsay. Final Exam
 The University of Chicago, Booth School of Business Business 41202, Spring Quarter 2013, Mr. Ruey S. Tsay Final Exam Booth Honor Code: I pledge my honor that I have not violated the Honor Code during this
Financial Econometrics Lecture 5: Modelling Volatility and Correlation
 Financial Econometrics Lecture 5: Modelling Volatility and Correlation Dayong Zhang Research Institute of Economics and Management Autumn, 2011 Learning Outcomes Discuss the special features of financial
A Copula-GARCH Model of Conditional Dependencies: Estimating Tehran Market Stock. Exchange Value-at-Risk
 Journal of Statistical and Econometric Methods, vol.2, no.2, 2013, 39-50 ISSN: 1792-6602 (print), 1792-6939 (online) Scienpress Ltd, 2013 A Copula-GARCH Model of Conditional Dependencies: Estimating Tehran
Exchange Rate Market Efficiency: Across and Within Countries
 Exchange Rate Market Efficiency: Across and Within Countries Tammy A. Rapp and Subhash C. Sharma This paper utilizes cointegration testing and common-feature testing to investigate market efficiency among
Predictability of Foreign Exchange Rates with the AR(1) Model
 Model") Journal of Applied Finance & Banking, vol. 7, no. 4, 2017, 39-58 ISSN: 1792-6580 (print version), 1792-6599 (online) Scienpress Ltd, 2017 Predictability of Foreign Exchange Rates with the AR(1) Model Andreas
Journal of Applied Finance & Banking, vol. 7, no. 4, 2017, 39-58 ISSN: 1792-6580 (print version), 1792-6599 (online) Scienpress Ltd, 2017 Predictability of Foreign Exchange Rates with the AR(1) Model Andreas